The surface water supply of California, 1906: with a ...
230
Golden Gate University School of Law GGU Law Digital Commons Federal Documents Government Documents 1906 e surface water supply of California, 1906: with a section on ground water levels in southern California (Great basin and Pacific ocean drainages in California and lower Colorado river drainage) William Billings Clapp Follow this and additional works at: hps://digitalcommons.law.ggu.edu/federal_documents Part of the Water Law Commons
Transcript of The surface water supply of California, 1906: with a ...

Golden Gate University School of LawGGU Law Digital Commons
Federal Documents Government Documents
1906
The surface water supply of California, 1906: with asection on ground water levels in southernCalifornia (Great basin and Pacific ocean drainagesin California and lower Colorado river drainage)William Billings Clapp
Follow this and additional works at: https://digitalcommons.law.ggu.edu/federal_documents
Part of the Water Law Commons

"Water-Supply and Irrigation Paper No. 213 Series P, Hydrographie Progress Reports, 67
DEPARTMENT OF THE INTERIOR
UNITED STATES GEOLOGICAL SCKVEYGEORGE GUIS SMITH. DIKECTOK
THE SURFACE WATER SUPPLY OF CALIFORNIA, 1906
WITH A SECTION ON GROUND WATER LEVELS IN SOUTHERN CALIFORNIA
(GREAT BASIN AND PACIFIC OCEAN DRAINAGES
IN CALIFORNIA AND LOWER COLORADO
RIVER DRAINAGE)
W. B. CLAPPDISTRICT HYDEOGRAPHER
IN COOPERATION WITH CALIFORNIA STATE BOARD OF EXAMINERS
WASHINGTONGOVERNMENT PRINTING OFFICE
1907


CONTENTS.
Introduction............................... ........................ 7Scope of work.................................................... 7Definitions............................................... 0Explanation and use of tables.............................. 10('onvenient equivalents................................................ 12Field methods of measuring stream flow................................. 13Office methods of computing run-off..................................... LOCooperation and acknowledgments..................................... 22
Lower ('olorado River drainage basin ....................................... 23Colorado River at Hardyville. \riy,..................................... 23Colorado River at Yuma, Ari%.......................................... 26Miscellaneous measurements............................................ 20Sallon Sea, near Salton, Cal............................................. 30
The(ireat Basin drainage.................................................. 34General features....................................................... 34Owens River drainage basin............................................. 34
Description of basin............................................... 34Owens River near Round Valley. Cal............................... 35Owens River near Tinemaha .Cal................................... 37Rock Creek near Round Valley. Cal................................ 30Pine Creek near Round Valley. Cal................................. 40Bishop Creek near Bishop. Cal...................................... 42Big Pine Creek near Big Pine. Cal.................................. 44Birch Creek near Tinemaha. Cal..................................... 44Tinemaha Creek near Tinemaha, Cal................................ 45Taboose Creek near Tibbetts, Cal.................................... 45Goodale Creek near Tibbetts, Cal.................................... 47Division Creek near Independence. ('al............................. 48Eight Mile Creek near Independence. (^al............................ 50Oak Creek near Independence, Cal.................................. 51Independence Creek near Independence. Cal........................ 52Shepherds Creek near Independence, (^al........................... 53Moffelt Creek near Independence, Cal.............................. 54Georges Creek near Independence, Cal.............................. 55Lone Pine (Yeck near Lone Pine, Cal................................ 55Tuttle Creek near Lone Pine, Cal.................................... 56Cottonwood Creek near Olancha, Cal................................. 57Ash Creek near Lone Pine, Cal..................................... 50Miscellaneous measurements........................................ .")9
Mohave River drainage basin........................................... (IIDescription of basin............................................... (UMohave River at Victorville, Cal................................... 61
3

Southern Pacific Ocean drainage.........................................General features.......................................................San Diego Bay drainage basin, Cal..........................
Description of basin....................................Cotlonwood Creek near Jamul, Cal...................................Pine Valley Creek near Jamul. Cal.......................Sweetwater River near Descanso, Cal................................San Diego River at Lakeside. Cal...........................
Bernardo River drainage basin.................................Description < >i basin......................................Santa Ysabel Creek near Escondido, Cal.....................
San Luis Rey River drainage basin....................................Description of basin...........................San Luis Rey River near Pala. Cal..................................
Santa Margarita River drainage basin.............................Description < >f basin.....................................Temecida (Veek near Temerula. Cal................................
Santa Ana River drainage basin.....................................Description of basin.................. ...... ...............Santa Ana River near Mentone, Cal...... ......................Seepage measurements.............. ... ................ .... ..Miscellaneous measurements....................................
San Gabriel River drainage basin...................................Description of basin.........................................San Gabriel River and canals near Azusa, Cal.......................
Los Angeles River drainage basin...............................Description of basin...................................Miscellaneous measurements..................................
Malibu Creek drainage basin............................Description of basin.....................................Malibu Creek near Calabasas, Cal....................................Triunfo Creek near Calabasas. Cal..................................
Ventura River drainage basin..................................Description of basin. ............................ f .................Miscellaneous measurements...............................
Santa Ynez River drainage basin...........................Description of basin......1..........................Santa Ynez River near Santa Barbara. Cal................Miscellaneous measurements...........................
Santa Maria River drainage basin .........................Description of basin..................................Santa Maria River near Santa Maria, Cal. .......................
Salinas River drainage basin....................................Description of basin..................................Arroyo Seco near Soledad, Cal.....................................
San Francisco Bay drainage basin............................... 10General features............................ ]0Sacramento River drainage basin ...................... 10
Description ot basin ............................ 10Main Sacramento River............................. 10
Sacramento River near Red Bluff, Cal. ................... 10Miscellaneous measurement.............................. 10

CONTENTS. 5
San Francisco Bay drainage basin Continued.Sacramento River drainage ba.^in Continued. Page.
Pit River drainage basin........................ ... . . ........... 103Description of basin........................................... 103Fit River near Bieber, Cal...................................... 104McCloud River near Gregory, Cal................................ 106
Stony Creek drainage bas ...................................... 107Description of basin........................................... 107Stony Creek near Fruto, Cal.................................... 108Miscellaneous measurements.................................... 109
('ache Creek drainage basin............................ ........... 109Description of basin........................................... 109Cache Creek at Lower Lakt-, Cal.....--..--..-.-.-.-............ 110Cache Creek near Yolo, Cal.......................... .......... HI
Puta Creek drainage basin ......................................... 113Description of basin........................................... 113Puta Creek near Guenuc, Cal................................... 114Puta Creek at Winters, Cal..................................... 116
Feather River drainage basin....................................... 118Description of basin........................................... 118Feather River at Oroville, Cal................................... L20Grizzly Creek near Beckwith, Cal............................... 121Indian Creek near Crescent Mills, Cal.......................... 123North Fork of Feather River below Prattville, Cal.............. 125North Fork uf Feather River above Prattville, Cal .............. 128Hamilton Branch near Prattville, Cal............................ 130Butt Creek at Butte Valley, Cal. ......................*........ 132North Fork of Feather River near Big Bend, Cal ................ 133Miscellaneous measurements.................................... 135Precipitation and evaporation data.............................. 140
Yuba River drainage basin.......................................... 140Description of basin........................................... 140Yuba River near Smartaville. Cal............................... 141
Bear River drainage basin......................................... 143Description of basin........................................... 143Bear River above Wheatland. Cal............................... 144
American River drainage basin..................................... 145Description of basin........................................... 145American River near Fairoaks, Cal.............................. I4U
S&n Joaquin River drainage basin...................................... 14KDescription of basin................................................ 148Main San Joaquin River............................................ 148
San Joaquin River at Bernd* »n. Cal............................. 148Miscellaneous measurements....................'................ 149
Kern River drainage basin......................................... 149Description of basin........................................... 149Kern River near Bakersfield, Cal............................... 150
Tule River drainage basin......................................... 151Description of basin..............................\............ 151Tule River near Portersville, Cal................................ 152Miscellaneous measurements.................................... 154
Kaweah River drainage basin...................................... 154Description of basin........................................... 154Kaweah River below Three Rivers, (^al......................... 154

(> CONTENTS.
San Francisco Bay drainage basin Continued.San Joaquin River Continued. Pag<
Kings River drainage basin......................................... IfDescription of basin........................................... IfKings River near Sanger, Cal................................... Ic
Merced River drainage basin....................................... IfDescription of basin............................................. IfMerced River above Merced Falls, Cal.......................... 16Merced River in Yosemite Valley, Cal........................... IfYosemite Creek in Yosemite Valley, Cal........................ IfTenaya Creek in Yosemite Valley, Cal.......................... If
Tuolunme River drainage basin.................................... ItDescription of basin........................................... 16Tuolumne River at Lagrange, Cal.............................. ItModesto canal at Lagrange, Cal................................. IfTurlock canal at Lagrange, Cal.................................. If
Stanislaus River drainage basin.................................... IfDescription of basin........................................... 16Stanislaus River at Knights Ferry. Cal.......................... YStanislaus Water Company's canal at Knights Ferry. Cal......... 1"
Mokelumne River drainage basin.................................... 1"Description of basin........................................... YMokelumne River near Clements. Cal........................... V
Northern Pacific Ocean drainage........................................... 1"Klamath River drainage basin.......................................... 1"
Description of basin............................................... YLink River at Ivlamath Falls, Oreg.................................. YUpper Klamath Lake at Klamath Falls. Oreg........................ YKlamath River at Keno. Oreg....................................... YSycan River near Silver Lake, Oreg ................................ YLost River near Clear Lake, Cal..................................... 1£Lost River near Merrill, Oreg-...................................... YTule Lake near Merrill Oreg........................................ 1£Miller Creek near Lorella, Oreg..................................... ItMiscellaneous measurements........................................ 1£Precipitation and evaporation data.................................. l£
Fluctuations in ground-water levels in the valley of southern California, byW. C. Mendenhall...................................................... Y
Index ................................................................... 2f
ILLUSTRATIONS.
PagPLATE I. Map of United States showing location of principal river stations
maintained during 1906.........................................II. A, Current-meter rating station. Los Angeles, Cal.; B, Price current
meters........................................................III. A, Cable station, Kings River near Red Mountain, Cal.; B, Dis
charge measurement by wading.................................. 1.'IV. Map of valley of southern California showing location of wells selected
to show ground-water conditions................................ liFIG. 1. Cable station showing section of river, car, gage, etc................
2. 'Typical discharge, area, and mean-velocity curves .. ............ '.

SURFACE WATER SUPPLY OF CALIFORNIA 1906:
W. B. CLAPP,District Hydrographn\ b
INTRODUCTION.
SCOPE OF WORK.
The water supply of the United States is of more importance to the life and pursuits of the people than is any other natural resource. In the arid States the limit of agricultural development is determined by the amount of water available for irrigation; while in all parts of the country the increase in the population of cities and towns makes nec essary additional water supplies for domestic and industrial uses, in procuring which both the quantity and the quality of the water that may be obtained must be considered. The location of manufacturing plants may depend largely on the water-power facilities and on the character of the water. The notable advances made in the electric transmission of power have led to the utilization of water powers for the operation of manufacturing establishments, railroads, and munici pal lighting plants, many of which are at some distance from the places at which the power is developed.
The intelligent establishment and maintenance of enterprises or industries that depend on the use of water demands a thorough knowledge of the flow of the streams and an understanding of the conditions affecting that flow. This knowledge should be based on data showing both the total flow and the distribution of the flow throughout the year, in order that normal fluctuations may be pro vided for. As the flow of a stream is variable from year to year' estimates of future flow can be made only from a study of observa tions covering several years. The rapid increase in the development
« This report contains information similar to that published in previous years under the title "Report on Progress of Stream Measurements."
* The data in this report have been collected under the direction of W. B. Clapp, assisted by W. F. Martin, R. S. Hawley, C. II. Lee, and W. C. Sawyer, and have been prepared for publication under the direction of John C. Hoyt, by R. H. Bolster, Robert Follansbee, F. F. Henshaw, J. E. Stewart, and H.D. 1'adgett.
7

8 SURFACE WATER SUPPLY, 1906.
of the water resources of the United States has caused a great demand by engineers for information in regard to the flow of streams, as it if now generally realized that the failure of many targe power, irriga tion, and other projects has been due to the fact that the plans were made without sufficient trustworthy information in respect to the water supply.
Owing to the broad scope of these hydrographic investigations and the length of time they should cover in order that the records may be of greatest value, it is, in general, impossible for private individ uals to collect the necessary data, and as many of the streams trav erse more than one State this work does not properly fall within the province of the State authorities. The United States Geologica Survey has therefore, by means of specific appropriations by Con gress, for several years systematically made records of stream flow, with the view to ultimately determining all the important features governing the flow 'of the principal streams of the country. In car rying out this plan stations are established on the streams and main tained for a period long enough to show their regimen or genera behavior. When a record that is sufficient for this purpose has been obtained for any stream, the work on that stream is discontinued. The order in which the streams are measured is determined by the degree of their importance.
During 1906 the regimen of flow was studied at about 700 stations distributed along the various rivers throughout the United States, as shown on PI. I. In addition to these records, data in regard tc precipitation, evaporation, water power, and rver profiles were obtained in many sections of the country.
These data have been assembled by drainage areas and are pub lished in a series of fourteen Water-Supply and Irrigation Papers, Nos. 201 to 214, inclusive, each of which pertains to the surface-water resources of a group of adjacent areas. In these papers are embod ied not only the data collected in the field, but also the results of com putations based on these data, and other information that has a direct bearing on the subject, such as descriptions of basins and the streams draining them, utility of the water resources, etc. The list follows:
Water-Supply and Irrigation Papers on Surface Water Supply, 1906.
201. Surface water supply of New England, 1906. (Atlantic coast of New England drainage.) .
202. (Surface water supply of the Hudson, Passaic, Raritan. anc1 Delaware river drain ages, 1906.
203. Surface water supply of the Middle Atlantic States, 1906. (Susquehanna, Gun powder, Patapsco, Potomac, James, Pvoanoke, and Yadtin river drainages, j
204. Surface water supply of the Southern Atlantic and Eastern Gulf States, 1906. ('Santee, Savannah, Ogeechee, and Altamaha rivers, and eastern Gulf of Mexico drainages.)

LNTBODUCTION. 11
The discharge-measurement table gives the results of the discharge measurements made during the year, including the date, name of the hydrographer, width and area of cross section, gage height, and discharge in second-feet.
The table of daily gage heights gives the daily fluctuations of the surface of the river as found from the mean of the gage readings taken each day. The gage height given in the table represents the eleva tion of the surface of the water above the zero of the gage. At most stations the gage is read in the morning and in the evening.
The discharge measurements and gage heights are the base data from which the other tables are computed. In cases of extensive development it is expected that engineers wTill use these original data in making their calculations, as the computations made by the Survey are based on the data available at the time they are made and should be reviewed and, if necessary, revised when additional data are available.
The rating table gives the discharge in second-feet corresponding to various stages of the river as given by the gage heights. It is published to enable engineers to determine the daily discharge in case this information is desired.
In the table of monthly discharge the column headed "Maximum" gives the mean flow for the day when the mean gage height was highest, and it is the flow as given in the rating table for that mean gage height. As the gage height is the mean for the day, there might have been short periods when the water \vas higher and the corresponding discharge larger than given in this column. Likewise in the column of "Minimum" the quantity given is the mean flow for the day when the mean gage height was lowest. The column headed "Mean" is the average flow for each second during the month. Upon this the computations for the remaining columns, which are defined on page 10, are based.
The values in the table of monthly discharge are intended to give only a general idea of the conditions of flow at the station, and it is not expected that they will be used for other than preliminary estimates.
In most work wThere data in regard to flow are used the regimen of flow is of primary importance. Therefore for the principal stations tables have been prepared showing the horsepower that can be developed at various rates of flow, and the length of time that these rates of flow and the corresponding horsepower are available. These tables have been prepared on a basis of 80 per cent ef^ciency on the turbines, and the horsepower per foot of fall is given in order that the reader can determine the horsepower for any fall.
In the computations, sufficient significant figures have been used so that the percentage of error in the tables will not in general exceed

12 SURFACE WATEE SUPPLY, 1906.
1 per cent. Therefore, most of the values in the tables are given only three significant figures. In making the various computatic Thatcher's slide rule, Crelle's tables, and computation machines bj been generally used.
In order to give engineers an idea of the relative value of the var data, notes in regard to accuracy are given as far as possible. T accuracy depends on the genera) local conditions at the gaging p tions and the amount of data collected. Every effort possible is mi to so locate the stations that the data collected vT ill give a high deg of accuracy. This is not always possible, but it is considered better publish rough values with explanatory notes rather than no data
In the accuracy notes the following terms have been used, indicat the probable accuracy, in per cent, of the mean monthly flow, these values are mean values, the error in the value for the flow of ? individual day may be much larger.
Excellent indicates that the mean monthly flow is probably ac rate to within 5 per cent; good, to within 10 per cent; fair, to wit 15 per cent; approximate, to within 25 per cent.
CONVENIENT EQUIVALENTS.
Following is a table of convenient equivalents for use in hydrai computations:
1 second-foot equals 40 California miner's inches (law of March 23, 1901). 1 second-toot equals 38.4 Colorado miner's inches. 1 second-foot equals 40 Arizona miner's inches.] second-foot equals 7.48 United States gallons per second; equals 448.8 gallons
minute; equals 646,272 gallons for one day.1 second-foot equals 6.23 British imperial gallons per second.1 second-foot for one year covers 1 square mile 1.131 feet or 13.572 inches deep.1 second-foot for one year equals 31,530,000 cubic feet.1 second-foot equals about 1 acre-inch per hour.1 second-foot for one day covers 1 square mile 0.03719 inch deep.1 second-foot for one 28-day month covers 1 square mile 1.041 inches deep.1 second-foot for one 29-day month covers 1 square mile 1.079 inches deep.1 second-foot for one 30-day month covers 1 square mile 1.116 inches deep.1 second-foot for one 3L-day month covers 1 square mile 1.153 inches deep.1 second-foot for one day equals 1.983 acre-feet.1 second-foot for one 28-day month equals 55.54 acre-feet.1 second-foot for one 29-day month equals 57.52 acre-feet.1 second-foot for one 30-day month equals 59.50 acre-feet.1 second-foot for one 31-day month equals 61.49 acre-feet.100 California miner's inches equal 18.7 United States gallons per second.100 California miner's inches equal 96.0 Colorado miner's inches.100 California miner's inches for one day equal 4.96 acre-feet.100 Colorado miner's inches equal 2.60 second-feet.100 Colorado miner's inches equal 19.5 United States gallons per second.100 Colorado miner's inches equal 104 California miner's inches.100 Colorado miner's inches for one day equal 5.17 acre-feet.100 United States gallons per minute equal 0.223 second-foot.

INTRODUCTION. 13
100 United States gallons per minute for one day equal 0.442 acre-foot.1,000,000 United States gallons per day equal 1.55 second-feet.1,000,000 United States gallons equal 3.07 acre-feet.1,000,000 cubic feet equal 22.95 acre-feet.1 acre-foot equals 325,850 gallons.1 inch deep on 1 square mile equals 2,323,200 cubic feet.1 inch deep on 1 square mile equals 0.0737 second-foot per year.1 foot equals 0.3048 meter.] mile equals 1.60935 kilometers.1 mile equals 5,280 feet.1 acre equals 0.4047 hectare.1 acre equals 43.560 square feet.1 acre equals 209 feet square, nearly.1 square mile equals 2.59 square kilometers.1 cubic 1 foot equals 0.0283 cubic meter.1 cubic foot equals 7.48 gallons.1 cubic foot of water weighs 62.5 pounds.1 cubic meter per minute equals 0.5886 second-foot.] horsepower equals 550 foot-pounds per second.1 horsepower equals 76.0 kilogram-meters per second.1 horsepower equals 746 watts.1 horsepower equals 1 second-foot falling 8.80 feet.1J horsepower equal about 1 kilowatt.
Sec.-ft, X fall in feetJo calculate water power quickly: ,, - =net horsepower on wa
ter wheel, realizing 80 per cent of theoretical power.
FIELD METHODS OF MEASURING STREAM FLOW.
The methods used in collecting these data and in preparing them for publication are given in detail in Water-Supply Papers No. 94 (Hydrographic Manual, V. S. Geological Survey) and I To. 95 (Accu racy of Stream Measurements). In order that persons using this report may readily become acquainted with the general methods employed, the following brief descriptions are given:
Streams may be divided, with respect to their physical conditions, into three classes: (1) Those with permanent beds; (2) those with beds which change only during extreme low or high water; (3) those with constantly shifting beds. In determining the daily flow special methods are necessary for each class. The data upon which the determinations are based and the methods of collecting them are, however, in general the same.
There are three distinct methods of determining the now of open- channel streams: (1) By measurements of slope and cross section and the use of Chezy's and Kutter's formulas; (2) by means of a weir; (3) by measurements of the velocity of the current and of the area of the cross section. The method chosen for any case depends upon the local physical conditions, the degree of accuracy desired, the funds available, and the length of time that the record is to be continued.


INTRODUCTION. 9
205. Surface water supply of the Ohio and lower eastern Mississippi river drainages,]906.
2U6. Surface water supply of the Great Lakes and St. Lawrence River drainages. 1906.207. Surface water supply of the upper Mississippi River and Hudson Bay drainages,
1906.208. Surface water supply of the Missouri River drainage, 190(1.209. Surface water supply of the lower western Mississippi River drainage, 1906.210. Surface water supply of the western Gulf of Mexico and Rio Grande drainages,
1906.211. Surface water supply of the Colorado River drainage above Yuma. 1906.212. Surface water supply of the Great Basin drainage, 1906.218. Surface water supply of California, 1906. (The Great Basin and Pacific Ocean
drainages in California, and Colorado River drainage below Yuma.) 214. Surface water supply of the North Pacific Coast drainage, 1906.
The records at most of the stations discussed in these reports extend over a series of years. An index of the reports containing such records up to and including 1903 has been published in Water-Supply Paper No. 119. The following table gives, by years and primary drain age basins, the numbers of the papers on surface water supply, published from 1901 to 1906.
Numbers of Water-Snpply Papers containing results of stream measurements, 1901-1906.°
Susquehaima, Gunpowder, Patapsco, Fotomae, James, Roaiioke,
Santee, Savannah, Ogeeehee, and Altamaha rivers, and OH stern
Hudson Bay and upper eastern and western Mississippi River
Merameo, Arkansas, Red, and lower western Mississippi river
The Great Basin and Paeifi" Ocean drainages in California, find
1901.
No. / !*\ /o{'il
ni1 65 \ 75/ 65I 75
65
\ 661 75j or,I < ">{ ^\ <5/ 66\ <»( 66
j 66\ 75 j 66 \ 75
I 66I ,.-, t
1902.
No.| S2
}S282 S3
} ,3
1 ' M 83
84
}«84
84
85
}»
}»
I Si; **
1903.
No.97
9797 P898
9897n£
99
99
99
99
100
100
100
1904.
No. 124
125
| 126
127
129128 130
/ 130
131
132
133
133
134
1905.
No.165
166
167
168
170
}m
},»173
174
175
176
177
178
1906.
No. 201
203
204
206
207
208
209
210
211
212
213
« Reports containing data for years prior to 1901 are noted in the series list at the end of this paper.
DEFINITIONS.
The volume of water flowing in a stream the "run-off" or "dis charge 1 ' is expressed in various terms, each of which has become associated with a certain class of work. These terms may be divided into two groups: (1) Those which represent a rate of flow, as second- feet, gallons per minute, miner's inches, and run-off in second-feet per

10 SUEFACE WATER SUPPLY, 1906.
square mile, and (2) those which represent the actual quantit water, as run-off in depth in inches and acre-feet. They ma; defined as follows:
1 ' Second-foot" is an abbrevation for cubic foot per second ai the quantity of water flowing in a stream 1 foot wide, 1 foot c at a rate of 1 foot per second. It is generally used as a fundamc unit from which others are computed.
"Gallons per minute" is generally used in connection with pi ing and city water supply.
The "miner's inch" is the quantity of water that passes thrc an orifice 1 inch square under a head which varies locally. It been commonly used by miners and irrigatore throughout the ^ and is defined by statute in each State in which it is used.
"Second-feet per square mile" is the average number of cubic of water flowing per second from each square mile of area drainec the assumption that the rim-ofT is distributed uniformly bot regards time and area.
"Run-off in inches" is the depth to which tl ^ drainage area w be covered if all the water flowing from it in a given period conserved and uniformly distributed on the surface. It is usec comparing run-off with rainfall, which is usually expressed in d in inches.
"Acre-foot" is equivalent to 43,560 cubic feet, and is the quai required to cover an acre to the depth of 1 foot. It is comm used in connection with storage for irrigation work. There convenient relation between the second-foot and the acre-foot: second-foot flowing for twenty-four hours will deliver 86,400 c feet, or approximately 2 acre-feet.
EXPLANATION AND USE OF TABLES.
For each regular gaging station are given, as far as available following data:
1. Description of station.2. List of discharge measurements.3. Gage-height table.4. Rating table.5. Table of monthly and yearly discharges and run-off.6. Tables showing discharge and horsepower and the number of days durii
year when the same are available.
The descriptions of stations give such general information a the locality and equipment as would enable the reader to find use the station, and they also give, as far as possible, a com history of all the changes that have occurred since the establish.! of the station that would be factors in using the data collected.

TNTRODTJCTIOX. 17
section into strips. For each strip or pair of strips the riean velocity, area, and discharge are determined independently, so that conditions existing in one part of the stream may not be extended to parts where they do not apply.
Three classes of methods of measuring velocity with current meters are in general use multiple-point, single-point, and integration.
The three principal multiple-point methods in general use are the vertical velocity-curve; 0.2 and 0.8 depth; and top, bottom, and mid- depth.
In the vertical velocity-curve method a series of velocity determi nations are made in each vertical at regular intervals, usually from 0.5 to 1 foot apart. By plotting these velocities as abscissas and their depths as ordinates, and drawing a smooth curve among the re sulting points, the vertical velocity-curve is developed. This curve shows graphically the magnitude and changes in velocity from the surface to the bottom of the stream. The mean velocitv in the ver-
FIG. 1. Cable station, showing section of river, car, gage, etc.
tical is then obtained by dividing the area bounded, by this velocity curve and its axis by the depth. On account of the length of time required to make a complete measurement by this method, its use is limited to the determination of coefficients for purposes of compar ison and to measurements under ice.
In the second multiple-point method the meter is held successively at 0.2 and 0.8 of the depth, and the mean of the velocities at these two points is taken as the mean velocity for that vertical. On the assumption that the vertical velocity-curve is a common parabola with horizontal axis, the mean of the velocities at 0.22 and 0.79 of the depth will give (closely) the mean velocity in the vertical. Actual observations under a wide range of conditions show that this second multiple-point method gives the mean velocity very closely for open- water conditions, and, moreover, the indications are that it holds nearly as well for ice-covered rivers.
In the third multiple-point method the meter is held at mid depth, 8591 IRR 213 07 2

18 SURFACE WATEK SUPPLY, 190 1.
at 0.5 foot below the surface, and at 0.5 foot above the bottom, a the mean velocity is determined by dividing by 6 the sum of the t velocity, four times the mid-depth velocity, and the bottom velociv This method may be modified by observing at 0.2, 0.6, and 0.8 dep j
The single-point method consists in holding the meter either the depth of the thread of mean velocity, or at an arbitrary dep for which the coefficient for reducing to mean velocity has be determined.
Extensive experiments by vertical velocity-curves show that t thread of mean velocity generally occurs at from 0.5 to 0.7 of t total depth. In general practice the thread of mean velocity is cc sidered to be at 0.6 depth, at which point the meter is held in t majority of measurements. A large number of vertical velocit curve measurements, taken on many streams and under varying cc ditions, show that the average coefficient for reducing the veloci obtained at 0.6 depth to mean velocity is practically unity.
In the other principal single-point method the meter is held ne the surface, usually 1 foot below, or low enough to be out of t effect of wind or other disturbing influences. This is known as t subsurface method. The coefficient for reducing the velocity tak at the subsurface to the mean has been found to be from 0.85 0.95, depending on the stage, velocity, and channel conditions. T higher the stage the larger the coefficient. This method is especia adapted for flood measurements or when the velocity is so great th the meter can not be kept at 0.6 depth.
The vertical integration method consists in moving the meter at slow, uniform speed from the surface to the bottom and back aga to the surface, and noting the number of revolutions and the time tak in the operation. This method has the advants.ge that the veloci at each point of the vertical is measured twice. It is useful as check on the point methods.
The area, which is the other factor in the velocity method of det( mining the discharge of a stream, depends on the stage of the riv which is observed on the gage, and on the general contour of the b of the stream, which is determined by soundings. The soundin are usually taken at each measuring point at the time of the dischar measurement, either by using the meter and cable, or by a spec sounding line or rod. For streams with permanent beds standa cross sections are usually taken during low water. These sectio serve to check the soundings which are taken at the time of t measurements, and from them any change which may have tak place in the bed of the stream can be detected. They are also value in obtaining the area for use in computations of high-wat measurements, as accurate soundings are hard to obtain at hi stages.

INTRODUCTION. 19
In computing the discharge measurements from the observed velocities and depths at various points of measurement the measur ing section is divided into elementary strips, as shown in fig. 1, and the mean velocity, area, and discharge are determined separately for either a single or a double strip. The total discharge and the area are the sums of those for the various strips, and the mean veloc ity is obtained by dividing the total discharge by the total area.
The determination of the flow of an ice-covered stream is difficult, owing to diversity and instability of conditions during the winter period and also to the lack of definite information in regard to the laws of flow of water under ice. The method now employed is to make frequent discharge measurements during the frozen periods by the 0.2 and 0.8, and vertical velocity-curve methods, and to keep an accurate record of the conditions, such as the gage height to the sur face of the water as it rises in a hole cut in the ice, the thickness and character of the ice, etc.
From these data an approximate estimate of the daily flow can be made by constructing a rating curve (really a series of curves) simi lar to that used for open channels, but considering, in addition to gage heights and discharge, the varying thickness of ice.
For information in regard to flow under ice cover see Water-Supply Paper No. 187.
OFFICE METHODS OF COMPUTING RUN-OFF.
There are two principal methods of determining run-ofl', depending on whether or not the bed of the stream is permanent.
For stations on streams with permanent beds the first step in com puting the run-off is the construction of the rating table, which shows the discharge corresponding to any stage of the stream. This rating table is applied to the record of stage to determine the amount of water flowing. The construction of the rating table depends on the method used in measuring flow.
For a station at a weir or dam the basis for the rating table is some standard weir formula. The coefficients to be used in its applica tion depend on the type of dam and other conditions near its crest. After inserting in the weir formula the measured length of crest and assumed coefficient, the discharge is computed for various heads and the rating table constructed.
The data necessary for the construction of a rating table for a velocity-area station are the results of the discharge measurements, which include the record of stage of the river at the time of measure ment, the area of the cross section, the mean velocity of the current, and the quantity of water flowing. A thorough knowledge of the conditions at and in the vicinity of the station is also necessary.

20 SUBFACE WATER SUPPLY, 1906.
The construction of the rating table depends on the following lav of flow for open, permanent channels: (1) The discharge will remai constant so long as the conditions at or near the gaging station remai constant; (2) the discharge will be the same whenever the stream at a given stage if the change of slope due to the rise and fall of tb stream be neglected; (3) the discharge is a function of and increase gradually with the stage.
The plotting of the results of the various discharge measurement, using gage heights as ordinates, and discharge, mean velocity, an area as abscissas, will define curves which show the discharge, mea velocity, and area corresponding to any gage height. For the deve opment of these curves there should be, therefore, a sufficient nun ber of discharge measurements to cover the range of the stage of tt stream. Fig. 2 shows a typical rating curve, with its correspondin mean-velocity and area curves.
As the discharge is the product of two factors, the area and tl mean velocity, any change in either factor will produce a corresponc ing change in the discharge. Their curves are therefore constructe in order to study each independently of the other.
The area curve can be definitely determined from accurate sounc ings extending to the limits of high water. It is always conca^ toward the horizontal axis or on a straight line, unless the banks the stream are overhanging.
The form of the mean-velocity curve depends chiefly upon the su face slope, the roughness of the bed, and the cross section of tl stream. Of these the slope is the principal factor. In accordar- with the relative change of these factors the curve may be either straight line, convex or concave toward either axis, or a comb in tioii of the three. From a careful study of the conditions at ar gaging station the form which the vertical velocity-curve will tal can be predicted, and it may be extended with reasonable certaint to stages beyond the limits of actual measurements. Its princip use is in connection with the area curve in locating errors in dischar^ measurements and in constructing the rating table.
The discharge curve is defined primarily by the measurements discharge, which are studied and weighted in accordance with tl local conditions existing at the time of each measurement. Tl curve may, however, best be located between and beyond the mea urements by means of curves of area and mean velocity. This cim under normal conditions is concave toward the horizontal axis ar is generally parabolic in form.
In the preparation of the rating table the discharge for each ten, or half tenth on the gage is taken from the cur Te. The differenc between successive discharges are then taken and adjusted accor ing to the law that they shall either be constant or increasing.

INTRODUCTION. 21
Gage height in feet<j> \j <P__ to__ o ru 01 M <x
\£ to £ <o £5 p o o Q01 Oi ^ u r\J
(o Co iv
3 3
§ S-i-. Q,
fer
^ » f»

22 SUEFACE WATEE SUPPLY, 1906.
The determination of daily discharge of streams with changeab beds is a difficult problem. In case there is a weir or dam availabl a condition which seldom exists on streams of this class, the dischar^ can be determined by its use. In case of velocity-area stations fr quent discharge measurements must be made if the determinations flow are to be other than rough approximations. For stations wit beds which shift slowly, or are materially changed only during flood rating tables can be prepared for periods between such changes ar satisfactory results obtained with a limited numb°r of measurement provided that some of them are taken soon after the change occur For streams with continually shifting beds, such as the Colorado ar Rio Grande, discharge measurements should be made every two < three days and the discharges for intervening days obtained eith by interpolation modified by gage height or by Professor Stout method, which has been described in full in the Nineteenth Annu Report United States Geological Survey, Part IV, page 323, and : the Engineering News of April 21, 1904. This method, or a grap1 ical application of it, is also much used in determining the flow * stations where the bed shifts but slowly.
COOPERATION AND ACKNOWLEDGMENTS.
The hydrographic work of the United States Geological Surve in California is being carried on in cooperation with the State : accordance with acts of the State legislature approved March 1 1903, and March 20, 1905.
The act of March 16, 1903, which covered the period from July 1903, to June 30, 1905, is in substance as follows:
The State board of examiners are hereby empowered to enter into contracts wi the Director of the United States Geological Survey for the purpose, of making top graphic maps to the extent of twenty thousand dollars; also for the purpose of gagr streams, surveying reservoir sites and canal locations, for the conservation and utiliz tion of the flood or storm waters of the State, to the extent of fifteen thousand dc lars [etc.].
The act of March 20, 1905, is in substance the same as previous ac the appropriations being increased to $30,000 for topography an $20,000 for hydrography, and covering the two fiscal years July 1905, to June 30, 1907.
Assistance has been rendered or records furnished by the follov ing, to whom acknowledgment is due: California State board examiners, composed of the following members: George C. Parde governor; C. F. Curry, secretary of state; U. S. Webb, attorne^ general. Acknowledgment is also due to Mr. Lovelace, of Lemoor Cal., for gage readings on Tulare Lake; to the Kern County Lar. Company, through A. Iv. Warren, engineer in charge of water mea urements, for the record of Kern River; to the city of Santa Barba:

LOWER COLORADO RIVER BASIN. 23
for cooperation in gaging Santa Ynez River; to the Bay Cities Water Company, through Edwin Duryea, jr., chief engineer, for precipita tion and run-off data; to the Great Western Power Company, through Mr. M. A. Viele, chief engineer, for gage heights and stream measure ments on Feather River and tributaries and for rainfall and evapora tion records near Prattville, Cal.; to the Southern Pacific Company, through its chief engineer, William Hood, for river-stage records of San Joaquin River at Herndon, Cal., and for transportation fur nished; and to the officials of the Santa Fe Railway for transporta tion furnished.
LOWER COLORADO RIVER DRAINAGE BASIN.0
COLORADO RIVER AT HARDYVILLE, ARIZ.
This station was established May 11, 1905. It is located one- fourth mile above the deserted town of Hardyville, and 7 miles above Fort Mohave, Ariz. The conditions at this station and the bench marks are described in Water-Supply Paper No. 175, page 128.
Discharge measurements of Colorado River at Hardyville, Ariz., in 1905-6.
Date. Hydrographer. h^ft
1905. Feet. Mavl7......... O. W. Peterson.. 6.05May 20 .. .. - -do -- 0.95Mav '^7June 4 .........
July 9..........
July 30......... ..... ............ ..
.....do........... 10.50
.....do......... . 14.50
.....do........... 0.70
.....do........... 5.70
do 4. I'D
August 27 do 4 on
October 15..... ..... ............
.....do........... 3 <n
do s. sn
November 4 ... November 12 . . November 19 . .
December 3 ....
1906. January 1. .... January 7 .....
Jenkins and Lee. 3. 48 C. W. Jenkins....! 3, S5 .....do........... 3.70
.....do........... (i. 00
C. W. Jenkius. ... 3. 70 .....do... ........ 3.50
dn s anJanuary 21 ....'.... .do ........... 4. 15 January 28 ....'.... .do ........... 4. 50
March 18....... '..... do... ........ 6.40March 25....... i..... do. .......... 5.80
Dis charge.
Sec.-ft. 33. 14033,910 t.9,01004, 750
107, 700 81,030 52, SCO 30, 650 22. ^"0017,120 14,5SO 17, 0<0 12,270 11,C50 5,934 7,523 4,057 6,579 (1,574 5,949 6, 504 5,979 5, 7.07
17, 850
3,430 3, 4iO 3, SCO 5, 900 7,850 5,110 0, 3SO(», 3505,710 1,520
19, 400 12.800 30,000
Date. Hydrographer.
1906. Aprils......... C. W. Jenkins ...April 15. ....... .... .do ...........April 22 . doApril 24........ Mav 3 ..........
Mayl3.........
May 27.........
June 16.. ......
JulyS..........
J uly 22
Murphy and Lee. Lee and Jenkins. C. W. Jenkins.. .......do...........C. II. Lee........C. W. Jenkins. ...
.....do...........
F. T. C.ivin .......do . .
August 18.....
September 15. . September 22 . .
October 13.....
October 28. ....
.....do...........
.....do...........
.....do...........
.....do........... C. .]. Brunk...... ... .do................do................do................do...........
.....do...........
.....do...........
.....do...........
.....do...........
.....do. ..........
.....do...........
.....do...........
.....do...........
.....do..........
Gage height.
Feet. C. 90 7.30 8.10 8.84 9.00 8.70
11. CO 11.90 14. CO 14.05 13.10 14. <0 10.35 19.30
S. 50 8.56 7.55 7.35 7.00 6.45 6.20 6.50 6.63 6.50 6.73 7. 38 7.63 7.00 6.75 6. CO 6.80 7.30 7.15 6.85 6.70 8.48 7.25 6.89 6.50
Dis charge.
Sec.-ft. 21,500 24, 100 32.200 37,500 <0, 800 33,100 67,200 63,700 92, 800 96, 200 92,000
109,000 63,700 47, 500 34, fiOO 38,100 27,600 24,400 19,500 16,200 14,200 15, 500 12, 700 11,400 12, 100 16. 900 16, 000 12,000 9,840 8,400 9,470
12,800 10,300 9,430 7,720
23,300 11,300 9,230 7.160
a A description of thf> general features of Colorado River drainage will be found in Water-Supply Paper Mo. 211.

24 SURFACE WATER SUPPLY, 1903.
Daily gage height, in feet, of Colorado River at Hardy ville, Ariz.,for 1905-6.
Day. Jan. Feb. Mar.
1905. 1.... ........... ....... ....... ....... . 23............... .............. ....... .
7...... ......... ...... ....... ....... .
9......:........ ....... ....... ....... .10............... ....... ....... ........
15............... ....... ....... ..... . .
16............... ....... .............. .
22
95
29.....-.-..-.-.- ....... ....... ....... .3031............... ......................
1906.
4............... 3.4 4.1 , 4.15............... 3.35 4.1 4.1
6............. . 3.4 4.1 4.17............... 3.5 4.2 4.18 3 3 r> 4 ° 4 °9 . 3.3 4.3 4.2
10............... 3.15 4.4 4.2
11............... 3.3 °4.4 4.2512-.....--.- .... 3 35 4.4 4.213--.-...--...... 3.3 4.4 4.35 14............... 3.4 4.4 4.5 15............... 3.35 4.3 5.1
16............... 3.4 4.3 «5.817............... 3.7 4.3 6.4
20............... 4.2 4.1 5.8
22. .... ... 4.5 «4.2 5.9 ' 23.-.....----.-.- 4.4 4.2 5.8 c24--.....-....-.. 4.3 4.2 5.825. .... .. 4.4 4.3 5.8
26............... 4.5 4.3 6.527. ........ 4.4 4.3 6.428............... 4.45 4.4 6.329............... 4.4 ....... (1.553')............... 4.4 ....... 7.331............... 4.3 .......' 7.75 .
i 1
Apr. May. June. July. Aug. Sept.
...... ....... all. 8 8.55 . 4.5 3.4
...... ...... .nil. 5 , 8.4 ; 4.5 3.4
...... ....... nll.l 8.3 a4.61 3.2
............. 10.7 8.0 4.8 i 3.2
........... 12.5 7.3 47 3.5
............. 13.1 7.0 4.7 3.6
............. 13.7 6.7 4.85 3.5
...... .. .... H.4 6.7 4.6 3.6
...... 081 14.3 6 5 4.5 4.0
...... 69 14.0 6 15 4.3 3.7
..... 6.95 14.3 a 6.0 4.25 3.5
...... 6 95 13 8 5.85 4.0 3.45
...... 6.7 13.3 5.5 ' 3.9 3.4
...... 6.8 12.8 5.3 , 3.8 3.3
...... 7.0 12.2 "5.2 3.8 3.2
...... 8.1 11.35 5.1 3.75 ' 3.05
..... 8.8 10.8 5.1 3.6 3.0
..... 9.5 10.5 4.95 3.6 3.05
...... 9.9 10.15 4.85 3.0 2.95
.. . . 10.6 10.0 4.7 4.75 2.95
.. .. 11.1 9.5 4.7 3.7 2.95
...... 11.5 9.1 4.7 3.4 2.95
...... 12.7 9.2 4.7 3.3 | 3.95
.. .. (J12.4 9.6 4.65 3.4 3.95
..... «12.1 ....... 4.6 3.4 .......
7.85 9.5 13.2 10.25 7.4 6.58.25 9.2 13 8 10.0 7.4 6 357.9 9.1 14.0 '-9.7 7.6 6.357.4 9.2 13 8 9.4 7.5 6.57.45 8.9 13.75 9.4 | 7.35 6.5
7.1 8.8 13.8 9.2 7.2 6 556.85 8.7 13.6 9.35 7.0 6.55 6.9 8.1 13.3 9.25 7.1 6.76.9 8.7 13.0 9.35 7.0 676.9 9.3 13.1 9.1 7.0 6.7
7.1 10.1 13.25 8 9 ; 7.05 6.557.1 10.5 13.5 88 6 85 667.6 11.05 ' 13.1 8.8 6.8 6.55 7.5 11.85 13.95 845 6.7 655 7.35 11.9 "14.0 , 8.5 6.6." 6.55
7.4 12.5 14.1 8.35 6.6 6.557.45 12.75 14.6 8 55 6.55 6 57.6 12.6 14.8 8 5 6.45 , 6 67.6 12.1 15 2 8 55 6 45 6.97.6 '11.9 15.4 8.65 6.25 6.7
7.9 12.3 15.0 8.75 0.2 6.68.1 12.75 15.0 8.6 6.1 6.75 8.4 13.4 14.35 8.55 6.3 7.28.8 13.7 13.8 8.35 6.6 7.08.9 14.2 13.1 8.15 6.2 6.9
9.2 14.2 12.4 8.05 6.2 7.09.8 14.55 11.85 7.85 °6.25 7.0
10.4 14.5 11.6 7.65 6.35 "7.210.3 H4.2 11.2 7.55 6.45 7.410.0 13.9 10.6 7.55 6.5 7.6...... 13.4 ....... 07.5 «6.5 .......
Oct.
3. 75
4.7
4.84.74.74.45
4.254.1
"4.03.953.85
3.83.73.73.73.6
3.5 3.5
a 3.5 3.45
3.5 3.453.53.553 53.5
7.57.77.7
7.67.4 7.37.27.1
7.17.17.0 7.0 6.95
6.96.856.86.86.75
6.76.7 6.76.b.56.6
6.66.556.66.75
16 756.75
Nov. D
3.45 7 3.45 73.5 63.45 5
3.6 44.0 °43.85 43.85 3
3.75 33.85 33.8 33. 65 3
3. 75 3.3.7 3
3. 7 3.3.7 3.
3.6 ia3.3.6 - 3. 3.6 3.3. 7 3. 3.6 ' 3.
5.4 3.
5.1 3.5.0 3.5. 1 3.
6.65 ' 6.6.6 ' 6.
"6.7 6.6.8 6.6.75 6.
6.9 7. 6.9 8.7.0 7.7.3 7.
7.3 «~."7.3
7.37.2 7.15
7. 15 7.7.15 6.7.1 6.7.0 6.6.9 6.
6.85 , 6.6.85 6. 6.9 6.6.85 6.6.85 6..
16.85 6..6.85 b.6.9 6.6.9 6.6.8 6..
"Estimated.

LOWER COLORADO RIVER BASIN. 25
Daily discharge, in second-feet, of Colorado Rirer at Hardyville, Ariz.,for 1905-6.
Day. .Tan Feb.
1905.
Mar Apr. May. June. July. Aug.I
Sept. Oct. Nov. Dec.
73,460 45,260 14,0801 7,160 9,29011'......... ..........'.....................'....... 73,700:44,020 14,080 7,160 11,6003.. ..... . .... .................. .......'. ..... 67,09J 1 43,200! 15,090 5,970 1.3,900 6,000,4................ .'....... .......i....... ........ 63,553 40,750' 16,110 5,970 13,1(X>! 5,750 !
64.430 39,940' 18,950, 7,460 18,200 5.800
5,650 29,500 5, (OOj 26,500
18,200 14,300 11,50(1
.S......... ...................................... i 8,5, 78 ) 32, 750
10......... . . . ....... ............... .......i 98,783 30.410
73,920 37,120 17,500' 15,430 15,430 16,460 14,750
Jl..... ..... ...... ... ............. 31,533 97,76) 28,85012......... ... ....... ....... ....... ....... 3i, 970 94. 700 26,16013........ ....................... i..... . 32, 3(50 97, 760 25,00014.... ......................... ......... 33,940] 99,293 23.8101.............................. ......I....... 33,940 99,80) 18,950
1C............. ........................... 32,36017............. ....... ....... ....... ....... 30,41018.. ...................................... 31,19019............. ................ ........... 32.330 2,}............. .............. ............. 32,750
8,0o5 15,6007,763 15,3008,370 14,3007,760 14,0008,3,0 12,000;
14,080 10,850 10,300'12,770 8,980 8,90012,440 7,760 7,90011,800 7,760 7,200'10,850 7,460 6,200
92,703 23,840 10.85087.740 21,180 10,22082,883 19,690 9,600'80,000 19,320 9,60077,183 18,950 9,600'
7,460'
7,] 60 6,560 5,970 5,970
6,000 5,300 5,bOO 5,600 5,200
5,500 6,000, 8,500, 7,200! 7,000
6,0006,5006,2005,2006,700
6, loo! 5,800 5,900 5,980 6,000
5,900
13,20013,300
21............. ....... ....... ....... ....... 35,520 73,920
23............. .......I....... .......I....... 47,330 64,430 18,220; 8,37024............. ............................ 53,230 61,810 17.1.50 8,370
26............. .......'....... ....... ...... 62.680 500 15,430 15,770 53,230 15,430 8,980 49,840 15,430 7,160l 50,683 15,430' 54,083 15 090
14, 750
4,5154,5154,515
6,560 10,540
6,700 33,600 45.9006,0)0 36,933 42,9306,00) 32,8)0 41.8005,70), 27,3)3 41.3)05,703 27,10) 36,403
4............. 2,9)3
9............. 3,050
10,40010,2009,5008,8007,400
6,3006,3006,7006,7006,000
b,000 6,000 6,000 5,300 5,300
7,400 7,400
7,400 6,700 6,700
25,000 15,500 17,800 8,30091,703 59,003 25,000 13,200, 16,000 8,00095,501 55,000 29,000 12,500' 17,500 8,60094,303 51,003 27,000 13,500; 16,800 9,47095,030 50,500 24,400' 13,030 16,600' 8,900
7,720 6,800 6.700 6'. 000 5,500
5,650 23,600 34,000:5,603' 21,103 31,0005,703 21,50) 28.5005,650 21,333 35,6035,600. 22,100 42,503
5,700 22,803 52,7005,803 22,903 58,500
96,500 47,500' 21,500' 13,000' 15,800 9,200, 6,00094.503 48,703 18,500 12,200 13,500 9.500 1 10,10093,20) 47,0)0 20.700 13,bOO 12,800 9,500 23,10091,203 47,500 18,803 13,600 12,100 10,030 14,50092,003 44,100 19,100 13,600 11,700 12,800 13,000
93.200. 41,00095,803
6,700 27,0)0 65,800 91,0)0
b,000 10,630 24,603 71,503: 100.0)0
15,030| 25,200 77,100! 101,00019,303i 25,70) 78,030 ! 305,03019,033' 27,20) 72,330' 110.00.315.400 27,20) 68,030; 115,03014,300 27.303 63,7l'0 116,000
14,900 14,303 13.50) 13,233 12,800
30,203 68 500,32,20) 73,50034,10) 81.00.3'37,103 83,00338,30) 89,500'
18,000 41,700' 89,500 17,630, 48,60) 92,200 17,203 55.60) 93,003 22,30.3' 54,50) 91,000 26,801,' 51,200 89,030 31,8301......J 84,500'.
113,000113,000103,000100,00093,000
85,00079,70076,70072,50066,000
39,60039,030,34,50034,600
33,50030,03035, 70036,50037,200
39, 700, 38,500 38,030' 35,703 33,600
32.60030,50028,50027,60027,50027,500
lr», J.UU
20,50017,800IS, 00017,50017, 203
17,30017,60316,20016,50014,000
13,50012. 50015,00020, 30014, 200
It, 00014,10015,00016, 50016,500 16,500
10, UUU
12,00012,63012,10312 10012, 100
11,70011.30012,00315, 00012, 503
10,80011,80016, 50014,03012,500
13.00013, 00015,00017,40019,500
11, (UU
12,00012, 30012,00012,00011,700
11,10010, 80010,30010, 2009,840
9,8009,3009,2008 9008,500
8,4508,2008,4009.4009,400 9.400
i^:, out;
12, 70012,50012,20011,30010, 700
10.60010, 30010,2009, 6009,200
9.0009,2009,4009,4309,200
9,2009,2009,5009,5008,800
12,60012,40011,70011,30011,300
10,1009,1009,1009.0009,000
9,0008,9008,3007,6007,000
6,7006,4006,4007,1607 4007,700
NOTE. These discharges were obtained by the indirect method for shifting channels, except from May n to Ootober 1, 1905, when a rating table was used.

26 SURFACE WATER SUPPLY, 1906.
Estimated monthly discharge of Colorado Riier at Hardyville, Ariz.,for 1905-6.
Month.
1905. May (11 to 31) ...........................................
July.....................................................
December ............. ......... . .......... . ... ...
Discharge in second-feet. Total
Maximum.
81,920 99,800 45, 260 18, 950 10,850 18, 200 17, 800 29.500
Minimum.
30, 410 49, 840 14,750 6,560 4,515 4,700 5,200 5.300
Mean. acre- fe
47,370 1,973 75, 760 4, 508 25, 310 1, 556 11, 810 726 6,972 414 8, 571 527 7, 606 452 9. 097 559
10,720
1906.
July.....................................................
7,7006,700
31,80055,60093, 000116,00062,00029,00019,50017, 80012, 80023, 100
116,000
2,8505,0005,600
21, 100
66, 000
12, 50010, 8008,2008,0005,500
2,850
4,8305,88012,30031,60064, 50095,30040, 00018, 40013,40011,7009,8709,200
26, 400
997327
1,880
2,4601,130797719
569
19,200
NOTE. Values are rated as follows: October to December, 1905, fair; remainder of 1905 and 1906, gc
COLORADO RIVER AT YUMA, ARIZ.
This station is located in the town of Yuma, Ariz., 1^ miles bel- the mouth of Gila River and 10 miles, by river, above the Mexic boundary. Records of river height have been kept by the Southe Pacific Company since April 1, 1878, on the gage which was esta lished by Arthur Brown, superintendent of the company's brid and building department, during the summer of 1876. The cor tions at the station and the bench marks are described in Wat Supply Paper No. 177, page 13, where are given also references publications that contain data for previous year?.
Discharge measurements of Colorado Hirer at Yimia, An':., in 19()C>.
[BY W. I). SMITH AND OTHERS.]
s.Feet.
January 27 ....................... 18. 80
a Meas
Dis charge.
Sec. -ft. 5,730 5,580 5,090 4,550 4,260
16, 100 13, 800 10,000 9,740 9,110 7,280 6,360 8,220 9,640
14,600 12,200
ured by J
Date.
February 24 .....................March 6. .........................March 9. .........................
March 19. ........................March 21 .........................March 24 .........................March 27 .........................
March 31 a .......................Aprils...........................
. N, Johannson.
Gage height.
Feet. 19.40 19.30 18.90 18.90 18.85 26.35 27.55 24. 75 22. 75 22.05 21.50 24.00 26.50 28.10 23.70 23.80
Dicha
Stc. 10, 10,8,*},'
54, 66, 42, 33, 24, 22 43^ 65, 75, 34, 37,

D ERTY or
LOWER COLORADO RIVER BASIN. !
Discharge measurements of Colorado River at Yuma, Ariz., in 19^)6 Continued.
Date. Gage Dis- height. charge. Date. Gage Dis-
height. charge.
Feet. April 5.. .........................\ 23.40April 9........................... 22. 30April 11.......................April 14.......................April 10..........................' 22.70April 18.......................... 22.40April 20.......................... 22.45April 23.......................... 22. 65April 25.......................... 23.10April 27.......................... 23. 55April 30..........................i 24.50-' - 25.10
24.55 24.30
Sec.-n. 37,800 27,200 29, 800 27,800 29,500
May 2May 5May8May 10...........................' 23.70May 12........................... 24.25
24.90 26.20
May 15.......................May 18.......................May 21........................... 27.10May 24........................... 27.20May 28........................... 27.60June I............................ 28.60June 5.. .......--.--.-..-...-..-. 28. 30June S............................ i 27. 40June 11........................... 27. 30June 13........................... 26.90
26. 95 26.90
June IB.......................June 18.......................June 21........................... 26. 75June 23........................... 27. 30June 25........................... 27. 80June 28 a......................... 28.05June 30........................... 27. 30JulyS............................ 24.35Julys............................ 22.85July 9.........-......-..--..--..- 21.85July 11........................... 21.SOJuly 13....... .-...-........--.. 21.40July 16........................... 20.95July 18........................... 21.15July 20........................... 21.30July 23........................... 21.60July 25........ ................... 21.40July 28........................... 21.10July 30........................... 20. 70August 1......................... 20. 35August 4......................... 20.00August 7..................--.....' 19.70August 9.........-..-......----.. 19.30August 11........................ 19.55August 13................ ....... 19.40August 15........................ 19.20August 18................... .... 19.10August 20........................ 19.25August 21........................ 19. 90August 24........................ 19.20August 25........................ 19. 80
27,200 26,100 29,000 31, 700 36,700 44,100 50,800 40,600 36,800 35,100 42,100 46,500 52, 800 64,200 68,900 71,100 81, 800 92, 400 89,000 82,100 65,800 80,600 80,800 79,800 83,000 96,600 96,900 80, 300 60,400 48,100 40,400 38,600 38,100 35,400 32,900 32,400 31,600 33,000 29,100 29,100 25, 600 24,500 21,900 22,000 20,500 19,500 1C. 900
Feet. August 27...... ................. 19.10August 29........................ 19.50August 31........................ 18. 90September 3...................... 19.20September 5...................... 18. 85September 7...................... 18. 70September 10..................... 18. 75September 13..................... 18. 80September 15..................... 18. 70September 17..................... 16. 65September 19..................... 18. 40September 21..................... 18.40September 24......... ...........I 18.40September 26..................... 19.10September 28..................... 18. 70October 1........................ 19.55October 3........................ 19.40October 6........................ 19. 35October 8........................ 19.10October 10....................... 18. 80October 11....................... 18.60October 16....................... 18.10
18.10 18.00
October 18 October 22 October 24....................... 18.00October 27....................... 18.00October 29....................... 18.05
18.35 18.50
November 1..................November 3..................November 6...................... 18. 65November 8...................... 18. 75November 9...................... 18. 75November 10.....................' 18.80November 12..................... 19.20November 14........ ........... 19.10November 16..................... 19. 00November 20..................... 18. 95November 22..................... 18. 75November 24..................... 18.80November 26..................... IS. 80November 28..................... 18. 80December 1 b..................... 18. 70December 3...................... 18. 65December 5...................... 18.50December 6...................... 21.10December 8...................... 23.90December 10..................... 21. 90
21.00 20.30
December 11 December 12 December 15..................... I 19. 60December 17 < .................... 19.30
16,50016,40018,50015,50017,900
December 19. December 21. December 24. December 26. December 28. December 29.
19.10 18.90 18.80 18.60 18.50 IS. 50
Sec.-ft. 15,200 16,40013. 40014. 50012, 50012,00011,80011, 80010, 70010, 7009,920
10, 20010, 30013, 20011,70015,90014,70015, 80014,90014,30013, 30010, 70010, 8009,9509,8008,9808,6108, 6309,1508,4309,4209,4309,650
11,60011,50010, 80010, 0009,2809,2308,6709,2109,0809,0808,470
26, 00047,00037, 00028, 20023,4001H, 30015,80013,90012, 30011,30010,6008, S708,940
« Measurements June 28 to July 25 by F. R. S. Buttemer.h Measurements December 1 to 15 by J. M. Brown.' Measurements December 17 to 29 by L. 0. Robertson.
Daily (/aye height, in feet, of Colorado River at Yuma, Ariz., for 1903.
Day. .laii. , Feb.
1............... 17.75 lS.fi
3............... 17.7 18.554. . .... 17.6 18.455............... 17.55 18.2
6............... 17.4 18.37............... 17.4 18.28............... 17.5 i 18.2 9............... 17.45 18.2
10............... 17.5 18.2
Mar.
19.0 19.019.019.018.95
18.918.9518.95 18.918,85
Apr.
24.2 23.923.824.023.4
23.222.95
"22." 45'
22,9
May.
24.75 25.125.024.724.55
24.5524.424.2 23.9523.8
June.
28.6 28.628.828.628.3
27.9527.627.4 27.427.45
July.
26.5 25.5524.3523.3522.85
22.422.021.9 21.8521,85
Aug.
20. 35 20.320. 220.020.15
20.019.719.4 19.319,2
Sept.
18.8 19.019.219.118.85
18.718.718.7 18. 6c18.75
Oct.
19.55 19.419.419.4519.45
19.3519.1519.1 18.918,8
Nov.
18.35 18.518.518.618.6
18.6518.718.75 18.818. S
Dec.
18.7 18.818.6518.618.5
20.325.323.55 21.222.1

28 SURFACE WATER SUPPLY, 1907.
Daily gage height, infect, of Colorado River at Yum a. Ariz.,for 1906 Continued
Day.
11............... 12...............
14..............
10...............
1 8
19...............20........... ...
22.............
24........ ....25 ...............
2027...............
29. .. 30........... ... 31...............
Jan.
17.5
17.417.4
17.417.4
17.417. 45
17.5
19. !!
19.018. 8 18. 75IS. 75 18.7
Feb.
18.7 18.55
18.8 18.9
19. 9520.0
19. 619.4
19.419.419.319.319.2
19.119.0 19.0
Mar.
18. 85 18.85
20.2 > \ o
o- r-
25.523.222. C522.85
21.7
21.52 1 . 35
23. 1 2..027. 95 25.0 23.8
Apr.
22.7 2-'. l 5
22. 45 22.9
22.422 422. 5522. 45
22.409 499 7
22. 923.1
23. 523. 55 2:i. s24.2 24. 5
May.
23.8 24.2524.324.5 24.9
25.425.852'i.226. 4526. 8
27.1
27.3
27. 3
''7 627. S
%i
June.
27.3
21. 92.1. 7 2-i. 75
20. 952ii.9526.920. 826.7
27.627.8
27. So2S. 10 2s. 0.-)27. V> 27. X
July.
21,8 21.5521.421.3
20.9520.95
21.521.2
21.5
21.521.4
21.421.2 21.120. 9 20.7 20. 5
Aug.
19. 55 19 419.419.4 19.2
19.219.119.119.519. 25
19 °19.3
19.219.8
19. 4519. 15 18.919. 5 19.2
Sept.
18.8 18.85
18.8 18.7
18.718. G518.618.418.35
18.6
18.418.7
19.118.8 18.718.8 19.0
Oct.
18.6 18.4
18.25 18.2
18.1
101
18.118.0
18.018.018.017. 95
17.9518.0 18.018.05 18.1
Nov.
18. 85 19.2i 0 q
19.1 19.1
19.018.951 Q Q
18.918.9
18.8
18.818.8
18.818. 75 18.818. 75 18.8
D
2(
°(1< l f
1C
1!-\<
VH
1(1«ni>
i'1'i<1<V 9
Daily discharge, in second-feet, of Colorado River at Yitma, Ariz.,for 1906.
Day. Jan. i Feb Apr. May. ' June. , July. , Aug. Sept. I Oct.
1............... 5.8^0 9.280 9.350 39.600 4!i, 900 '81.800 '74.200 25.600 12,700 '15,9002............... 5.800 9.100 9.210 37.600 50.800 84.000 68000 2.5.500 13.300 llo,0003............... 5730 9.000 9.00 37,500 48,600 84.200 <0400 25,200 14.500 14 7CO4...............' 5.640 8.500 8,900 38,000 43.400 87,200 52,200 24.500 13.800 15,1005............... 5 5HO 7.280 8,750 37,800 40. TOO 92.400 48.100 24.900 12.5(10 15.200
Nov. D
8,6309,3009,1509,2708,700
8,600 35.900,41,000,91,100 44,600 24.400 12,100 15.800 8,430 17,8,350 33.400 38,500 89,800 41,900 i21.900 12,000 15.000 9,000 CO.8,0 0 31,000 3j,800 89,000 41,100 '21,900 111,900 14,900 ' 9,420 43.7,730 27,200 3i,000 83,700 40,400 22,000 11.900 14,500 i 9.700 27,
10............... 4.950 6,450 7,300 32,200 35,100 85,300 39,500 21,900 11,800 14,300 9.650 38
11............. . 4,830 8,830 6.900 29.800 |36, 700 's2,100 38,600 20.500 11,800 13.300 | 9,800 27,11.100 23,12,500 21,11,500 19,11,500 17,
12............... 4,70013............... 4,53014........ ..... 4,5!)015............... 4,450
8,220 | 6.740 129,200 142, 100 74,030 40,600 19.700 11,90342,800 65.800 3S, 100 19.500 11.83044,000 165,000 37,400 19.200 11,700
8,840 i 7.000 '29,000
9,640 54,300 31,200
It). 4,400 14.600 66,700 '29,500 48,900
11.80010,90010,800
46,500 70,000 36,300 16,900 10,700 10,500
19. 4,2 0 12,200
42.30031.00033.200
4,400 10,800 24,600 5.030 '10,700 23,300
13,800 9,880 21,200
27,200 ,'51,100 80.600 134,600.600 35,400
28,200 55,900 I SO, 400 '32,600 26,100 60,200 80,100 32,400
25,80025 50029,00030,600
64,200
700
79,800 32,20080,40083,030.. - , ,
68,900 '91,000 32,300
31,80031,000
31,700 69,200 '96,600 '33,000
11,000 i 9,550 19,000 36,200 69,700 90,400 |32,40010,000 ' 9,250 43,800 30,700 70,600 '99,200 30,8009,940 9,190 65, (,00 38, f00 71,200 97,100 29,1009,830 ....... 75,000 41.800'73.590 92,000 29,1009,740 ....... 47,51)0 44,100 77,300 79,300 29,1009600 ... ...34.700 .......79.800 ......27.000
16,800
NOTE. These discharges were obtained by the indirect method for shifting channels.

LOWER COLORADO RIVER BASIN. 29
Monthly discharge of Colorado Hirer at Yuma. Arh.. for 1906.
[Drainage area, 225,000 square miles.]
Month.
April.............................Mav......... -.-.....-.-.....-.-..
July. .............................
Discharge in second-feet.
Maximum.
16, 100 14,800 75,000 44, 100 79, 800 99, 200 74, 200 25, COO 14, 500
12, 500 60,000
99.200
Minimum.
4. 260 6,360 6, 740
25, 500 35.100 (15,000 27,000 13, 400 9, 600 8,600 8,4EO 0.800
4, 260
Mean.
6, S70 9,560
25,400 32, 500 54, 100 84, 200 . '9,000 19,200 11,700 11.700 9,710
IS, 300
20, 900
Total in acre-feet.
422,000 531,000
1,560,000 1,930.000 3, 3SO, 000 5,010,000 2,400,000 1,180,000
096, 000 719, 000 578,000
1,130,000
19, 490 000
Run-off.
Sec.-ft. per , Depth in sq. mile. inches.
O.OGO 0.042 0. 113 0.144 0.240 0.374 0. 173 0. 085 0. 052 0. 052 0. 043 0. 081
0. 119
0.03 .04 .13 .16. *rfO
.42
.20
.10
.06
.06
.05
.09
1.62
NOTE. These values are good.
MISCELLANEOUS MEASUREMENTS IN COLORADO RIVER DRAINAGEBASIN.
The following miscellaneous measurements were made in Colo rado River drainage basin below Hardyville in 1906:
Colorado River l>elov^ heading No. 3 of Imperial canal. Measure ments at this point show the discharge in the old channel of Colorado River below the intake of the Imperial canal, where most of the flow was diverted into Salton Sea.
There was practically no discharge in the old channel from early in July until the closure of the break, in November, 1906. The con ditions at this point are described in Water-Supply Paper No. 177, page 17.
Discharge measurements of Colorado River below heading No. 3 of Imperial canal in 1906.
Date. Ilydrographer. Gage Dis- height. charge. Date. Ilydrographer.
5.10 1,0406. 70 H, 8406.80 ' 3.440
Gage height.
June 7.. J une 19. June 27.July 4... July 11..
W. D. Smith .... . ......do...............Smith and Buttemer. V. R. S. Butten^er... .....do............. .
Feet. 7.00 (i. 30 7.10 4.50 3.80
charge.
Sec.-ft.3,210
398a 1,220
34 0
a- Second channel estimated.
Farmer's canal near Yuma, Ariz. This canal diverts water from Colorado River about 1 mile below Yuma. Measurements were made at the heading. The canal was dry after July 4.
June 7: Area, 82 square feet; discharge, 58 second-feet. .Tune 19: Area. 78 square feet; discharge, 48 second-feet.
Liidy canal near Yuma, Ariz. This canal diverts water from Colo rado River about 3 miles below Yuma. Measurements were made at the heading. The canal was dry after July 4.
June 7: Area, 109 square feet; discharge, 76 second-feet. June 19: Area, 116 square feet; discharge, 93 second-feet.

30 SURFACE WATER SUPPLY, 1906.
SALTON SEA NEAR SALTON, CAL.
What is now generally known as Salton Sea was until recently * old dry lake or playa, marked on maps as Salton ?; nk. There is sor uncertainty as to the elevation of the lowest point of this sink, ai it is now believed that the depth below sea level has been overes mated in the past. From the record of the depth of the water as filled the lowest portion of the basin, as kept by the New Liverpe Salt Company, it appears that the maximum depth of water w 17 feet on October 4, 1905 (according to the gage and as check by soundings later), when on the same date the water surface ju covered the United States Geological Survey bench mark a few fe from the old Salton railway station. As this bench mark is 256 feet below mean sea level, it would appear that the lowest point of t 1 sink is 273.5 feet below mean sea level instead of 287 feet, which h been accepted heretofore.
Salton Sink originally formed a part of the Colorado Desert, whi has an area of nearly 2,000 square miles and extends in a northwes erly direction almost 100 miles from the California-Mexico bounda line. It comprises two fertile valleys, that to the northwest of t 1 sink, in Riverside County, being known as the Coahuila /Valley, ai the one to the southeast of the sink, in San Diego County, being cal1 the Imperial A"alley. Salton Sea, wThich now partly fills the sin separates the two valleys and is partly in Riverside County and part in San Diego County. The longest diameter of the sea has a nort west-southeast direction. On December 31, 1£06, its surface w 201 feet below mean sea level and it had a length of nearly 50 mile a maximum width of about 16 miles, a minimum width of 10 miles, maximum depth of 72.5 feet, and a superficial area of about 4 square miles. It is about 160 miles southeast of Los Angeles, , miles northwest of Yuma, and 50 miles north of Calexico.
A few thousand years ago, according to geologic evidence, what now Salton Sea was a part of the Gulf of California, which th- extended about 200 miles further northwest than at present, reac ing possibly to the base of San Jacinto and San Gorgonio mountair and certainly some distance beyond the present town of Indio. Col rado River then emptied into the Gulf about 125 miles below its hef in the vicinity of Yuma, 75 miles above the present mouth. Tl river, then as now, was heavily laden with silt, p,t present estimate to amount to about 53 mile-feet annually, or sufficient to cover i square miles 1 foot deep each year. The checking of the veloci' near the river's mouth owing to the practically still water of tl Gulf, resulted in a deposition of this vast volume of silt, and in tl course of hundreds of years built up a broad delta that extend( westward as a wide bar or dam until it eventually reached the Coco^ Mountains in Mexico, the western wall of the valley, forming i
LOWER COLORADO RIVEK BASIN. 31
inland salt, or brackish, sea. During the next few hundred years the Colorado delivered all, or a part, of its silt-laden waters into this newly formed sea, raising the level of its waters coincidently with elevating, broadening, and strengthening by the silt-depositing proc ess the barrier dam which effected its complete and permanent isola tion. In the course of many years the dam and the level of the inland sea reached a height of about 30 feet above mean sea level, whereupon the river took a course of less resistance and found an outlet to the Gulf below the recently completed dam.
Whether the river maintained its outlet to the Gulf continuously until the inland sea was completely dissipated through the medium of evaporation is not known. The probability is that the river fol lowed the course of all rivers with growing deltas, and changed its channel from time to time with more or less caprice, alternately dis charging into the Gulf and the inland sea. At any rate it is defi nitely known from the shells found on the desert that the water which ultimately filled the inland sea was fresh, while the originally isolated Gulf water was salt. The conversion from salt to fresh water may have come about through the alternate partial evaporation of the salt water and the refilling with fresh water from the river, or it may have been effected gradually by means of dilution and substitution from a continuous fresh-water inflow covering a long p°riod of time.
As to the date when this inland sea finally disappeared there is mi definite information. The Indians now living in the desert are said to have a tradition that the sea was full as late as 40C or 500 years ago at most, and that the water disappeared "poco a' poco" little by little until the sea became dry. The geologic evidence at hand neither confirms nor disproves the Indian legend, but simply indi cates that the dissipation of the sea occurred at a time which, if not historic, is at least one of the most recent of geologic dates. With climatic conditions as they are at present the sea when full would probably have evaporated in 50 years if not checked by inflow. It is highly probable that the sink has been partly refilled many times in the recent past, the water soon evaporating. During the summer of 1891 the high water in the Colorado overflowed into the sink to such an extent as to endanger the Southern Pacific's railway at its lowest point. In the summer of 1905, after a succession of winter and spring floods in Gila River, followed by an exceptionally heavy summer flow in the Colorado, there was a repetition of flood conditions in the sink on a much larger scale.
The gravity of the situation on this latter date, however, was greatly augmented by the interference of man. For several years preceding a small quantity of water had been diverted from the Colorado below Yuma, Ariz., to be used by the settlers of the Im perial Valley for irrigation and domestic purposes. T^e first water

32 SUEFACE WATER SUPPLY, 1903,
was diverted in the United States and conveyed to the Imper Valley, after passing through Mexican territory, by means of an c river channel which had been one of the Colorado's distributari during the formation of its delta, and is now known as Alamo Riv The increased demand for water and the silting up of the origir canal heading above the boundary line necessitated the cutting an additional channel from the river below the boundary to conne with the canal. It likewise silled up, so that in order to supply t urgent need for water a canal was cut 4 miles below the origir heading to connect Colorado and Alamo rivers. This canal was n provided with protective headworks and had a gradient much great than that of the river, so that with the unusual and prolonged sir mer flood in 1905, it began cutting, until in July it was carrying per cent of the total flow of the river. This large quantity of wat flooded several hundred square miles about Calexico in the southe part of the Imperial Valley, and caused serious loss both in t United States and in Mexico. These waters ultimately reached t Salton Sea but in doing so they deepened and widened Alamo Rh into a great gorge and developed another drainage channel to t west through Imperial Valley in a second gorge now called N River. Notwithstanding all attempts to control it the Colorado cc tinned to pour its waters through Alamo and New rivers into Salt Sea until the early fall of 1906 when it was finally shut off by t Southern Pacific Company. It broke again, however, on Deceml 7, but was closed about two months later.
The rise of Salton Sea began in November, 1904, and continu throughout 1905 and 1906. In the summer of 1905 it endanger the Southern Pacific tracks to such an extent as to require freque shifting to higher ground by means of "shoo-fly" or spur trac1 which served temporarily until the latter part of the year when high line about 40 miles in length was completed on the 200-fc contour below sea level. This line is still in use, though during t latter part of 1906 the lowest portion of it was seriously damaged the action of waves. For use in the future, if required, another li has been located and graded on the 150-foot contour below sea lev In addition to the damage done to the railroad the sea has co pletely submerged the plant of the New Liverpool Salt Compar below Mecca, and also a few ranches in the vicinity of Mecca.
The gage record from November, 1904, to February 26, 1906, v kept by the New Liverpool Salt Company. Their datum is t lowest portion of the sink, or at least that portion which first fill with water, so that the gage record shows the actual depth of t water from time to time. On February 23, 1906, the government p in a gage on the same datum about one-half mile west of Salt railway station, which is 3 miles southeast of the old Salton static This gage consisted of a series of 5 posts, 6 inches by 6 inches \)\

LOWER COLORADO RIVER BASIN. 36
feet, set in the ground about 3 feet deep, and so placed that when the water covered one it would just reach the next one farther back. It was not a great while, however, until the waves completely destroyed tliis gage. In the meantime the Southern Pacific Company had graduated a bent on the trestle bridge across Salt Creek, about 2^ miles east of Salton, using the company's datum, and arrangements were made to have the Southern Pacific agent at Salton furnish the record from this gage, corrections being made to reduce to the origi nal datum. The zero of the gage is 273.5 feet below mean sea level as determined from United Slates Geological Survey bench marks, or at an elevation of -280.3 according to the Southern Pacific Com pany.
o.o.0 .0 .0 .0 .0 .0 .1).0 .0 .0 .0
o 6R
Day.
1904.
Nov. l)ec. Day.
1904.
Nov.
1 S
17..............
'?1
24..............
.0?
.2
.3
.3
.4
.4
-"7"-----('»
J( ...... .......
JS... . .. .....
jOjl..............
.4
.5i;
0 610X Xs s
Day.
1....... ..... .........
3.......................... 4........ ........... ...
6.. ..... ...............
H!()........_._...............
11.. ... ..... ... 12..........................
i4XX!XV XXXXX/V15..........................
17........ . .............18...... . ............ 19..........................20..........................
22 23...... /X........... . 24.. ... ...... ..
26.... .....................27.......... .............2N. . . . .29.......................... 30..........................31..........................
Total monthly rise. .
Jan.
O.S
.6
.6
.X
.X
.9
1.0 1.0 1.1 1.1 1.1
1.7 1.81.8 1.8 1.8
1.8 l.X 1.8 1.92.0
3.0 2.0 2.0 2.1 2 12.2
1.4
Fob. Mar.
2.2
2.3 2.4 2.4
2.4 2.5 2.6 2.7 2.8
2.8 2.8 2.9 3.0 3.2
3.2 3.23.2 3.3 3.3
3.4 3.4 3.4 3.43.5
3.6 3.7 3.8
1.6
3.8 3.94.0 4.2 4.4
4.4 4.4 4.4 4.4 4.3
4.3 4.3 4.3 4.2 4.2
4.2 4 64.6 4.6 4.5
4.5 4.5 4.6 4.0 4.6
4.0 4.6 4.7 4.6 4.6
.8
Apr.
4.8 4.84.S 4.9 5.0
5.2
5\2 5.4 5.2
5.2 5.3 .5.4 5.5 5.4
5.5 5.35. 5 5.2 5.5
5.4 5.7 5.7 5.7 5.5
5.6 5.7 5.8 5.8 5.8
1.2
May.
5. 7 5.85.9 6.0 5.8
5. S 6.2 6.1 6.0 5.8
6.2 6.2
ois6.3
6.4 6.46.4 6.5 6.6
0.3 6.7 6.5 6.8 6.6
6.6 6.6 6.8 0.8 7.0 6.S
1.0
June. July.
7.0 7.17.0 7.1 7.2
7.3 7.6 7.2 7.3 7.6
7^7 7.7 7.77.8
7.8
7.8 8.0 KO
8.3
sia8.4 8.5
8.5 8.7 8.8 8.8 9.0
9.1
9.4 9.6 9.7
9.8 10.1 10.2 10.3 10.3
10.7 10.8 10.9 10.9 11.1
11.2 11.411.7 11.9 11.9
12.1 12.2 12.4 12.5 12.7
12.8 13.0 13.1 13.2 13.2 13.4
Aug.
13.5 13.8 13.8 13.8 13.8
13. S 14.0 14.1 14.2 14.2
14.2 14.4 14.3 14.4 14.5
14.6 14.714.8 14.8 14.9
15.0 15.0 15.1 15.2 15.2
15.3 15.4 15.5 15.5 15.0 15.6
Sept .
15. 15. 15. 15. 15.
15. &' 15. P 15. P 15. P 15. P
15. [id. r 16. r16.1 16.1
16.2
16.2 16.2 16.?
16.3 16. d 16.4 16.5 16.5
16. P 16.7 16.8 16.8 16.8
2.«2 4.4 2.2 1.2
Oct. Nov.
16. S 16.9 16. 9 17.0 17.0
17.1 17.1 17.1 17.1 17.2
17.2 17.3 17.2 11.2 17.3
17.3 17.417.5 18.0 17.7
17.8 17.8 17.9 17 9 18.0
18.0 18.1 18.2 18.2 18.3 18.2
IN. 3 18.3 IS. 4 Ih. 5 IS. 5
18.0 18.7 18.X 18.8 IS. S
18. S 18.9 19. U 19. 0 19.1
19.2 19.219.2 19.2 19.3
19.3 19.4 19.4 19.5 19.5
19.6 19.7 19.7 19.819.8
1. 4 1. 6
Dec.
19.X 19. H 19.9 19.9 20.0
20.1 20.2 20.3 20.5 20.7
20.X 21.0 21.2 21.3 21.5
21.7 21. N 21.9 22.0 22.1
22.2 22.2 22.3 22.3 22. 4
22.4 22.5 22.6 22.6 22.7 22.7
2.9

84 SURFACE WATER SUPPLY, 1900.
Daily gatjc height, infect, of fialton sea near flalton, ('al.,f<>r l!>o.'f -l!fO(i Oontinu
]);iy. Jan. Feb. Mar. Apr. MajT .
190(1. 1.... ............ ..... 22.8 2.. ... ... ..... 22. 8
4 22. 8 .', 22. '.*
7.......................... 23.08 '''< 0
23. 9 ...... 2S. 3 34. 1 24. 0 25. (i
24. 2 ............ 34. 5 24.2 25.8 29.1 ......
24. 4 25. 9 29. 5 ...... >4 4 :>0 fl *) 7
9 '>3 1 94 510.. . . . 23.1
12. ...... . 23.2 13.......... ............... 23.2 14.. 23.2
10 '''j '-!
June.
42.7 43.3 43.8 44.4 44.7
.July.
59. 1 59.4 00.1 (10. 3 00. 5
01.0 01. 4 01.7 0:7 1
24. 5 20 0 30. 2 47. 9 i'fl. 3
»4 724. S 20. 0 30. 5 30. 4 24. 8 2d. 2 30. 9 .... . 24.') .... 31.1 30.9
48.448. 0 49. 5 50. 0
'.^ a .-,1 <
02. (102.8 03. 3 03. 3 03.5
<,.- : s
Aug.
GO. 7 00. 9 07.0 07. 0 07. 1
07.2 07. 3 07.4
Pept.
09. 5 09. 5 09. G 09. 0 09. 7
09. 8 09. 9 09.9 09. <)
07. 0 09. 9
07 7 09.907. S 07.9 08. 1 08.2
(IX '-!
70.0 70.0 70.0 70.1
70.170 1
."> "> :( 04 : : ox r> 70 119 °;i 4 '.", -i >(, i :! > n :-is. n20.............. ..... . . ''3.4
24.......................... 23.5
20. ..................... . 23. (i27........................ . 23. It 28. ......................... 23. 729............ ..... 23.730.......................... 23.8 31....... ................... 23.8
Total monthly rise.. 1.1
25.2 ...... 32.2 3N.4 52. 8
''5 3 38 9
25.5 27.0 ...... 39.5 2.3. (i 27.1 33.0 39.8
...... 27.0 33.3 40.7 °7 7 41 3
............ 33. (i 41. 5
...... 28. 2 ...... 41.8
.................. 42. 5
55." 3"
55. 7 50. 2
57. 3 57. 9
1.8 2.7 5.0 8.7 ' 15.4
04. 4 04. It
04.8 05. 0 05.3 (i5. 3
05. 7 05. 9oo i
08. 0 08. 7
08.8 08.9 09. 0 09.0 09. 1
09. 2 09. 3 lift 4
00. 2 09. 4 00. 3 09. 4 OH. 5 09. 4
70.1 70.1
70.1 70.1 70.1 70.1 70. 1
70.2 70.2 70.2 70. 2 70.3
8.0 2.9 .9
Oct.
70.3 70.3 70. 3 70.4 70.4
70. 4 70.4 70. 0 70.0 70.8
70.971.1 71.3 71. 3 71.3
71. 371.3 71 '!
71.4 71.4 71.4 71.4 71.4
71.4 71.4 71. 5 71.5 71.5 71.5
1.2
Nov.
71.5 71.5 71.5 71. 5 71.0
71.0 71.0 71. (i 71.0 71. 0
71.0 71.0 71.0 71. 0 71. 0
71. 571.5 71.5
71. 5 71.5 71.5 71.5 71.4
71.4 71.4 71.4 71. 3 71.3
-.2
THE GREAT BASIN DRAINAGE.
UEXERATj FEATURES.
The Great Basin drainage in California is comprised within subdrainages Sierra Nevada and Minor Great Basin. Within Sierra Nevada drainage is a limited area of arid country lying on eastern slope of the Sierra Nevada. This area includes the Su and Owens River drainage basins. Within the Minor Great B* drainage lies the Mohave River drainage basin. Having no ou to the sea, the entire drainage of these basins is lost mainly thro" evaporation from the lakes and sinks in which the waters of tl rivers collect.
KIVEK DRAINAGE BASIN.
DESCRIPTION OF BASIN.
Owens River has its source in the Sierra Nevada in eastern C forma and flows southeast parallel with this renge, finally discht ing its waters into Owens Lake. This basin has a length from nc to south of approximately 150 miles with a width of from 20 tc miles. It lies between the Sierra Nevada on the west and the W-

OWENS RIVER DRAINAGE BASIN. 35
Mountains on the east. Practically the entire flow of this river is derived from the Sierra Nevada, as it drains the entire eastern slope of this range from Mount Lyell on the north to a point some distance below Mount Whitney on the south. The White Mountains furnish no water for this stream except in times of exceptionally heavy rain storms, which seldom occur on this range. There are numerous tributaries entering Owens Kiver from the west which have their source in the high elevations of the Sierra Nevada, extending from the northern to the southern limits of this basin. The topography of the portion of the Sierra Nevada drained by this stream is ex tremely rough and precipitous, the mountains rising abruptly from Owens Valley to elevations of 13,000 to 14,000 feet. The formation is of granite, with very little soil covering and sparse timber growth. Numerous lakes and marshes are found in the upper reaches of this portion of the drainage basin.
Owens River, a short distance below its source, enters a flat, swampy country known as Long Valley, where a considerable quantity of its flow is used for the irrigation of meadow lands for stock raising. This water returns to the river channel at the lower end of this valley, at which point the stream enters a deep, narrow gorge with heavy grade. As the river breaks from this canyon it enters Owens Valley, through which it flows for a distance of about 80 miles, finally discharging into Owens Lake. The gaging station at Round Valley is located at the lower end of this canyon. Below this point numerous diversions are made for the irrigation of land in Owens Valley, where the soil is extensively cultivated and large areas are used for the raising of hay and grain. T\is country is particularly adapted to stock raising, which is carried on extensively throughout the valley. Numerous opportunities for the construction of storage reservoirs occur, both on the main stream and also on the upper reaches of its tributaries, although none have been taken advantage of as yet. The precipitation is extremely light except on the high elevations of the .Sierra Nevada, where there is a heavy fall of snow. The melting of this in the spring and summer months feeds the numerous tributaries of this river, insuring a continued flow throughout the year.
OWENS RIVER NEAR ROUND VALLEY, CAL.
This station was established August 3, 1903, by J. C. Clausen. It is located at the footbridge, 700 feet above the junction of Owens River and Rock Creek. The conditions at this station and the bench marks 0 are described in Water-Supply Paper No. 177, page 50, where are given also references to publications that contain data for previ ous years.
o The elevation of the bench mark is 8.05 feet above the datum of th<3 gage.

36 SURFACE WATER SUPPLY, 1906.
Discharge measurements of (keens River near Round Valley. Cal., in 1906.
Date.
F. K. S......do......do.
1 fawle v
ilydrographer.
Buttemer..
miii Sh(J. K. Shiiev. . .
.....do.
Width.
Feel. 34 34 34 34 34 34
Area of section.
8". ft.7377 79
11185 79
(rage height.
Feet. 1.75 1.92 1.93 2. So 2.14 2.00
rch;
Sc
Dady geitje height, in feet, of Owens River near Round Valley, Cal., for 190ft.
Day.
3."!!!!!!."."!!!."!!4...............
910...............
11...............12...............13...............14...............
10... ............ 17...............18......... ...19............... 20. ..............
21............... 22...............23...............
25. ..............
21)............... 27...............28...............29...... .. ... . 30............... 31........ .... .
Jan.
1..X 1.81.8 1.8
1.751.75
1.75
1.8 1.9
1.9 1.95
to2.0
2.12.1
2.05 2.02.01.95 1.9 1 9
Feb.
1.S51.9 1.91.9 1.9
1 91.9 1 9l o^1 . 95
1.95].95 1.951.951.95
1.95 1.951 CK
1.95 1.95
2.0 2.02.02.0
2.0
1.95
Mar.
1.95 1.951.95 1.95
2.0 2.02.02.0
2. .3 2.25o oO 0
2. 25 2. 25
2.3 2.3
2. 35
2. 352.4
2.42. 352.32.3 2. 35
Apr.
2. 4 o 42.4 2.25
2.15 2.3o 52.0
2.72.7 2.75
2.7 2.7 2.72.7 2.7
2.0 2.62.52.352.25
2 2 2. 152.15
2.2
May.
2.3 2.352.3 2.3
2.252. 2 2.25
2.25
2. 35
2! 452.4
2.4 2.42.452.6 2.65
2.6 o 552.52.52.5
2.5
2.452.4 2.45 2.4
Juno. Ju
2.4 32. 45 3 2.4 32.45 3 2.5 (
2.7 ... 2.9 ...
3.95 ...
3. 0 ...3.25 ... 3.3 ...3. 4 ...3 1
3.45 ... 3.45 ... 3. 5 ...3.55 ... 3. 0 ...
3. 7 ...
3.85 ...3.9 ... ? Q
3. 9 ... 3. 7 ...3.65 ...3. 5 3 3. fi 3
....... 3
ly. Aug.
5 3. 555 3. 5 5 3. 4545 3. 45
i ) 3. 4
... 3. 3
... 3.3
... 3. 25
3 0
... 3. 1
... 3. 1
... 3. 1
... 3. 05
... 3. 0
... 2. 95
... 3. 1
... 3.2
... 2. S5
... 2. 85
... 2. 85
... 2.7
... 2. 6
... 2. 605 2. 6 6 2. 0 0 2. 6
Sept.
2.6 2.62.6 2.6
2 5 2.5 > 452.45
2.45 2.45
2.4
2.4 2.4
2. 35 2. 35
2.32.3
2.25
2.32.32.32.3 2.3
Oct.
2.32.3
2.35 2.35
2.3 2.32.32.3
2.2
o o2.2
2.2 2 22.2 2.15
2.15 2.152.12.12.1
2.1 2.12.1
2'. 15
Nov.
2. 152.15 2.152.15 2.15
2.15
2.1 2.12.1
2. 05 2.0
2.0 2.0
2.0 2.02.02.0
2 1 2.12.12. 1 2. 1
n Station discontinued; operations resumed July 29.
Rating table for 0 teens Rirer near Round Valley, Cal., for 1906.
\ Gage.height.
Feet.1.601.701.80
Bis-criarge.
Sec.-ft.132152172
1.90 1942.00 21 S
Gageheight.
Feet.2.10
Dis- 1' Gagecharge. ! height.
Scc.-ft.244
2. 20 2702. 30 2972.402.50
326355
Feet.2. fO2.702.802.903.00
Discharge.
Sec.-ft.385416448480512
Gageheight.
Feet.3.103.203.303.403.50
Discharge.
Sec.-ft.545578612
Gageheight.
Feet.3. fiO
Discharge.
Sec.-ft.715
3. 70 7503. 80 785
646 3.90 S21680
NOTE. This table is based on discharge measurements made during 1903-fi and is well denned be gage heights 1.7 feet and 2.8 feet.

OWENS EIVEE DRAINAGE BASIN.
Monthly discharge of Owens River near Round Valley, Cal.. for 1906.
37
Discharge in second-feet.
Maximum.
February.... ........................................... 21S
April .................................................... 432Mav. ........ ........................................... 400June . . . . ....................... 839July a. ....... ........................................... 732August .................................................. 680September... ........................................... 385October..... ........................................... 312
The year. ......................................... 839
Minimum. Mean.i'
162 199 183 ! 205 206 ! 270 244 . 345 270 1 328 32fi 624 6113 696 385 535 284 330 244 273 218 239 218 256
162 358
Total in acre-feet.
12,200 11,400 16,<00 20, 500 20, 200 37, 100 42, 800 32, 900 19, (.00 16,800 14, 200 15, 700
260, 000
a Discharge interpolated July 5 to 28.
NOTE. Values are rated as follows: June- and July, good; remainder of 190)1, excellent.
OWENS RIVER NEAR TINEMAHA, CAL.
This station was established September 20, 1906, but measure ments were made prior to this date by the city of Lo^ Angeles, Cal. It is located about 7 miles south of Tinemaha at a basaltic knoll in the floor of the valley known as "Charlies Butte." It was described in Water-Supply Paper No. 177 as near Independence.
The channel is straight for 300 feet above and 200 feet below the station. The right bank is high and rocky with a growth of willows along the bank; the left is low and liable to overflow at high stages of the river. The channel has a carrying capacity of about 1,800 second-feet before it overflows. The bed of the stream is composed of sand and gravel ami is subject to some change between high and low stages of the river.
Discharge measurements are made from a cable and car. The initial point for soundings is a spike in post on right bank.
The gage, which is read by Ray Bowers, is a vertical rod fastened to a post on left bank of the stream. The bench mark is a nail in the soiith side of the post that supports the cable on the left bank; elevation, 8.36 feet above the zero of the gage.
During high water this station is inaccessible, and measurements are made at the county bridge near Citrus, about 12 miles below. The conditions at this station are described in Water-Supply Paper No. 177, p. 74, where are given, also, references to publications that contain data for previous years.

38 SLTEFACE WATER SUPPLY, 1906.
Discharge measurements of Owens Rirer near Tinemaha, CaL, by G. R. Shuey. in 19
Date.
March 27 ........ . ...............
Gage Dis- height.' charge.
Feet. Sec.-ft. 1.60 284
2. 63 467
2. 11 3772. 04 3471. 93 350
1. 70 277
2. 67 478
Date.
April 12. ...................
May 3......................
May 24............. ........
October IS.................
' Gage height.
Pe it...... 2. 72
..... 1.10
..... .90
..... 1.16
..... 1.30
..... 3.93
..... 1. 40
..... 1.57
..... 1.802.62
. . .. 2.60
Dicha"
Sec
Daily gage height, in feet, of Owens River near Tinemaha, CaL, for 1906.
Day.
2......-.--.-........3...... -...---.......
5 ............. ......(i .....-.--..7... .............. ..S. . . .. ...910....................n. ...................12.................... 13 .................... 14... .................
16 ....................
Sept. Get.
1 4~t
1.45
1.40
1.361.351.35 1 . 30
Nov.
1 SO
1.901.901.95 2.002.00
2.052.05
2.00 2. 00 2. 00
Dec.
2.15>> oy
2.309 452.00
'' fiO2.552.502.452. 50 2.70 2.809 7f>
2. 70
Day. Sept.
19................... .......20................... 1.8521 ................... 1. 82 22...................' 1.8023................... 1.7524................... 1.7225................... l.HO2(1................... 1.50
'27................... 1.452.X................... 1.40 29................... 1.35 30............ ........ 1.38
Oct.
1.581.601. 55 1.57l.flO1.701.821.851.S71..S5 1.90 1.801 80
Nov.
2.05r> 052.052.002.00 2.002.002.002.102.052.102.20 2.30 2.20
De
Rating tabJe for Owens River near J'inemaha. CaL, from October 19. 1906, to Decem.-11, Wl)t>.
Gage height.
Feet 1.001.10
Dis charge.
Sec.-ft.278290
Gthei
Ft1.1.
1.20 ' 302 I.1.30 . 314 1.1.40 327
Gage height.
Feet.1.50
Dis charge.
flec.-ft. 342
l.tiO 357\ . 70 3721.80 3S7
(rage height.
Feet. 1. 902.002. 102. 20
Dis- . ' Gage charge, height.
Sfc.-ft. Feet. 402 2. 30418 2.40434 2. 50452 2. t 0
Dis charge.
Sec.-ft. 4704S83K.')_4
Gage height.
Ff(t. 2.702.802.903. 00
Dis charge.
Scc.-ft. 5425(105SO(100
NOTE. This table is based 011 5 discharge measurements made during 190H and is fairly \vell defln
Discharge measurements of Owens Rirer ntar C'itrns, CaL, by Bvttemer and Shuey in 19<
Date.
July 1 ........................July ^.. ......................
1 Discharge.
, Sei:-ft. °83
........ 440
........ 595
........ 214
.... ... 58G
........ 1,370
........ 1,520
........ 2,080
Dare. Dischnrj
Sec.-ft July 13..................... .......... 2,July 21........ ....................... 2,July 29....-..--.......-..----..-..... 2.August 9 ............................. 1 .
October 7.............................

OWENS RIVER DRAINAGE BASIN. 89
Monthly rtischaryc of Owens River near TincmaJia, <'al.,for 1906.
Discharge in second-feet.Month.
Maximum.
March ................................ .................. 080April. ................................................... 530Ma\ ..................................................... 285June .................................. .................. 1, 540July ..................................................... 2. (HOAugust .................................................. 2.220September. ............................................. TOOOctol ,er ................................................. 401
December ............................................... 500
The vear ....................................... .. 2,010
Aiinimum. Mean.
270 430 SOS 358 277 438 213 388 102 , 200 224 729
1.520 2.230 730 1 , 210 352 448 270 339 3S7 423 443 510
102 042
Total in
20.800 19,900 20.900 23.100 12.300 43X00
137.000 74.400 20.700 20.800 25,200 31.400
408.000
NoTE. From January 1 to June 30 the daily discharge was interpolated between measurements at the regular station. During July, August, and September the regular station was inaccessible on account of floods and the daily discharge 1ms been interpolated between measurements made at Citrus. The values for these months are probably too small, as the Eastside and Stevens canals divert water above. After September the discharge was obtained from the rating table. Values for the year are approximate.
BOCK CREEK NEAR ROUND VALLEY, CAL.
This station was established August 3, 1903, by J. 0. Clausen. It is located at the wagon bridge on the road from Long Vr.lley to Bishop, 3,500 feet above the mouth of the creek. The conditions and the bench marks are described in Water Supply Paper No. 177, page 52, where are given also references to publications that contain data for previous years.
Dischari/e
Date.
mt'ntx of R»<-k Circk n<ar Round Vc'llfy. Col., in J90(j.
Hydrographer.
Ffft. .lanuury 8...... F. It. S. Buttemer............ ............... 13.5January 14..... .... .do......... .......... ................ 14. 0August'27...... K. S. lhnvle> ................ .............. 14November 3.... 0. R. Shuey............... ................. 13November 30... .... .do....................................... 13
Area of Gagesection, height.
Sq. It.1721
Ftct.1. 5S1.93
21 1. 751C 1. 5519 1.70
Discharge.
Set. -ft.2341513747
Daily t/ayclnu/hl, inf<f1, of Rock Cirri: near Round Valley, Cat., for
Day. Jan.
1 ............... 1.52............... 1.45H..... .......; 1.55.. .... .... li
I',.. ............ .77............. . .<;.-,X ' li9..... ........ .010.............. i.r.5
11.... .......... 1.7512..... ........ L.S13. ............ 1.914.... ... ...... 1.915...... ....... 2.0
Feb.
1. 551. 551.55 1.51.5
1 . 451.41.41.451.45
1.451. 451. 451 451.4
Mar.
1.351 3', %
. 35
.",5
.3
1.41. .82.02.22.4
Apr.
.5
.5
. 55
.5
.45
1.31.3
1.41.41.451.41.3
May.
1.21.21.2 1.251 , 25
1. 251.31.31.31.35
1. 451. 751.81.951. 95
June.
l.S1. 75l.SI V
l.S
1. 851.92. 152 352.5
2.82. 953 'H. 353.4
July.
3. 153. 253.2 3.2("i
Aug.
2. 75'2. 752.75 2. 752.7
2.72. 052.02.(i2. (15
2.72. 1152.72.72. (15
Sept.
1.91.91.9 1 951.9
1.91.851.81 751. 75
1.751. 751. 751.71.7
Oct.
1. 551.551. 551.551.55
1. 551. 551. 551.551 . 55
1.51.51.51. 551.55
Nov.
i.o1.11l.ll1.01. 05
1. 051. (151.051. 051.05
1.051.051.051.051. 05
Dec.
1.71.71.75 1. 751.8
l.Sl.Sl.S1.81. 75
1.7l.lu1.01 . 5fi1.5
Station discontinued; operations resumed July 29.

40 SURFACE WATER SUPPLY, If'00.
Dally gage height, infect, of Rock Creel" near Round Valley, Cal., for 1906 Continue
Pay. Jar
1(1. .......... 2.1
18............... 2.119 4 '°0 1 -
91 1 '
23............... 1.
20. ............. l..r
2s............... i. ;30. ....... .... i.r
i. Feb. Mar.
] 4 '13
1.4 1.7
1 35 1 55
.5. 1.35 i.r>
1.3.5 1.4
o ....... 1.4
Apr.
1.31 "3
1 o
Ni'T-
1. 15
1.13 1 21.2
May.
1.91 90 0
2.3
2. 1,5
1.85
1.81.8
June.
3.4
3. .I
3.7
3. S
3.8
3. ,5.5
3. .5
July. Aug.
(.r,-
.45
.45
.0
1. 95
1 9
Sept.
1.71.71.155
1.6
1.5
1.5
1. 55
1.6
1. 55
Oct.
1.551 ^
1 ^
1 CC
1.6
1.55
1.5
1.45 1 451.45
Nov
1.051.651 65
1 fi^
1.6
1.451 451.5
1.6
1.75
Rating table for Rod' Creek near Round Valley, Cal., from January ^'0, 1!>(H>, to UccemJl, 1906.
Gage height.
Fitt. 1.001.101.201.301.401..50
Dis charge.
Sec.-ft. 121.510232S34
Gage height.
Feet.1.60
Dis charge.
Sec.-ft. 40
1.70 47 '1. 80 541.90 612. 00 OS2. 10 7.5
Gage height.
Feet.2.202.30
Dis charge.
Sec.-ft. 8391
2. 40 992. .50 107
Gage height.
Feet. 2.802.903.003. 10
2. GO 11.5 3.202.70 123 3.30
Dis charge.
Sec.-ft. 13113.11471.5,5163171
Gage height.
Feet. 3. 403. r>03. 603. 703. SO
Dis charge.
Sec.-ft. 179188197206215
NOTE. This table is based on 3 discharge measurements made during 1906 and is not well defln The table used January 1 to 19 gives a much smaller discharge at the same gage height.
Monthly discharge of Rock C'reek near Routid Valley, Cal., for 1906.
Month.
May. ....................................................
July................................................... .
Discharge in second-feet.
Maximum.
200 37 99 37 99
215 167 127
64 40 54 54
21o
Mirimum.
17 25 23 17 19 ,50
131 61 34 31 31 34
17
Mean.
38.8 29.7 4.5.7 24.6 .54. 2
14.5 " 1.50
107 47.4 35.9 42.6 43.5
Total i acre-fee
12 1 3 8 9 6 2 2 2 2
63. 7 46,
" Mea?i for seven days taken as mean for the month.
NOTE. These values are fair.
PINE CREEK NEAR ROUND VALLEY, CAL.
This station was established August 3, 1903, by J. C. Clausen. is located 150 feet below the wagon bridge on the road from Bish( to Long Valley and 100 feet above the mouth of the creek. The co ditions and the bench marks are described in T^ater-Supply Pap

OWENS RIVER DRAINAGE BASIN. 41
No. 177, page 55, where are given also references to publications that contain data for previous years.
On June 15, 1906, the gage was washed out. On August 23 a new gage was placed at the wagon bridge on the Long Valley road about 150 feet above the old gage. It consists of a ^ by It inch steel rod fastened to the downstream side of the bridge, near the right bank, and is graduated to 0.05 of a foot. No reference was made to any bench mark.
This section at the bridge is very rough and rocky, but not subject to much change. During very high stages gagings can be made from the bridge, while at ordinary stages a wading section below the bridge is more satisfactor.
Date. Hydrographnr.
January^.....i F. R. S. Buttemer.January 14.... ..... do.............August 23..... Shuey and Hawley.August 27..... R. 6.' Hawlpy......NovemlxT 3... G. R. Shury.......Novemlwr 30.. ..... do .............
Width. Area of section.
Sq. ft.' 18
2533202221
Gage height.
Feet.1.802. 133. 853. 752. 953. 00
Dis charge.
Ztc.-ft.7.
229092
9.9.
Mil r. Apr. May. June. Aug. St^pl. Oct. No
2.... ................ 1.83...................... l.S 4.. ........ ....... l.S 5...................... l.S
n. ..................... i.s7...................... l.S
9...................... l.S 10...................... 1.S5
11...................... 1.9
13...................... 2.U14............... ...... 2.2515...................... 2.25
10...................... 2.2517...................... 2.15
19........ ............. 2.0 20...................... 1.95
9) ] <)-,
22...................... 1.9523................... .. 1.9 24...................... l.» 25 ...................... 1.9
2(1. ................... 1.85 27...................... 1.85 2s...................... 1.S5 29...................... 1.8530...................... 1.85 31...................... l.S.)
1 85
L 85 1.8
l.S l.S l.Sl.S l.S
l.S 1. S5
1. 851. 85
1.S5! »
l.Sl.S
l.S l.S l.S
l.S l.S l.S
l.Sl.S I.S l.S
l.S 1.751. 7.11 . 7.1 1 . 75
l.S 2.0 ) 0
2. 3
2.22.12-12-}
2.0
1.95 1.9 2.0
1.95 1.91.85 l.Sl.S 1.9
1. S 1. S 2. 01.8 l.S 2.0 l.S 1.S5 2.0 l.S 1.85 2.2
1.9 l.S 2.4 1.9 l.S 2. .15l.S l.S 2.01.S5 l.S 2. 75 l.S l.S 2.M
l.S 1.85 3.2
l.S 1.S5 3.5].S5 1.8.5 .......
1.8 1.9
1.8 2.2l.S 2.1 .. ...
l.S 2.15 .. .... 1.8 2. 3 ....... 1.8 2.3 ......
1.8 2.3 ....... 1.8 2.2 ....... 1.8 2.21. S 2. 15 .1.85 2. 15 .
....... 2.1 .......
3. S5 3. 85 3.8
3. S 3.8 3.S3.83. 75 3.7
3. <i,r3. t 3. ( 3. (
3. t 3.) 3.13.1 3.1
3. 55
3.453.4
3. 35 30%3. 35
3 3o 9 r
3.25 3. 25 3. 25
3. 25 3. 25 3. 25.3. 253. 25
3. 253. 25 3.25 3. 25
3.2 3.2 3. 153. 15 3. 15
3.1
3. 05
3.0
3.0 3.0
3.00 A
3.0 3.0 3.0
3.0 3.0 3.0 3.03.0 3.0
3.03.0 3.0 3.0
3.0 3.0o q
2.9 2.9
2.9
O Q
2.9
2.9
2.9
9 g° 953.0 3.0 3.0
3.0 3.0 3.0 3n3.0
3.03.0 3.0 3.0
3.0 3.03 A3.0 3.0
2. 952. 95
2.9
2.9
2.9 2. 95
2.95 2.952. 95
2. 95 2. 95 2. 95 2. 952 05 2% 95

STJBFU'K WAT HE SUPPLY, 1906.
Ratiny tahhs for Pint Creek near Round Valley, Cal.
JANUAKV 1 TO JUNE 14, 1900.«
Gageheight.
Feft. 1.701.801.902.00
Dis charge.
Sfc.-ft.4
Gage Dis- height. charge.
Feft. 2.10
8 2. 2013 2. 30IS 2.40
2:',
283339
Gage height.
Fift. 2.502. 602.702.80
Dis- Gage charge, height.
Sec.-ft. Ffct. 4.5 , 2. 90,32 ' 3. 00.3967
3.103.20
Dis ci sirge.
""ft
8.39.3
106
Gage height.
Feet. 3.303.403. 50
Dis charge.
Scc.-jt. 119133149
AUGl'ST 23 TO DECEMBER 31, 1906.^
2.903.003.10
- ~ - -- - --.3
103.20 24 3. 403.30 ' 33 , 3. ,30
16
42.33
3. 603.70
64 3. SO76 3. 90
89103
a This table is based on discharge measurements made during 1903-19011 and is well defined In gage height 3 feet.
b This till>le is liased on t discharge me-tsurenients inside during 1906 and is not well defined.
Monthly diseharyc of l'!n< C/«k mar Hound Vallnj, Cal.. for JVOfi.
Discharge in second-feet. \r ,ti, Total
Maximum.
January ................................................ 30
March.......................................... ........ 33April ................................................... 13\r-it- ' 'i'iJune .................................................. ..............July .................................................................August......... ....................................................
October ................................................. 2,s
The year. ........................... .........................
Minimum. Mean. arre"f
8 13.78 8. 0 C> 14.ri ,s 8.7 8 16.0
............ 130
............ KJO :
............' 105 1L'S 1 46.2 10 1.3. ,3
7. 6 J, _71o_,
.3 44. 4 3
XOTE. Monthly means for June. July, and \Ti riwt estimated, and are only approximate; value remainder of 1906fair.
BISHOP CHEEK NEAR BISHOP, CAT,.
This station was established August 10, 1903, at the wagon brie on the Bishop road, about 4^ miles from Bishop and about 2 m from the point where the creek leaves the canyon. The conditi and the bench marks are described in Water-Supply Paper No. 1 page 62, where are given also references to publications that cont data for previous years.
Ttisclianjc meaxurtnitnls of Bishop Creek near Bishop, Cal..for 190(1.
Date. Hydrographer. \Vidtt Area of Gage Di U 1(ltt ' section. height. cha
F. It.S. Huttemer.January !«....January 16 ....January 24 ....August 24 ..... ishuey and llawley.Novembers... G. It. Shuey........December 3.... .....do......... ....
.do.
.do.
Feet. 1.9.3 1.76 1.83 3.1(1 1.71 1.00
"Channel obstructed b\ rocks at time of measurement.

OWENS ETVEE DRAINAGE BASIN. 48
Daily gage height, infect, of Bishop ('reck near Bishop, Cal.,for 19(16.
Day.
9
3...............
5 . ..... .......
S. ..............q10...............
11...............12...............
17............... IS............... 19.. ............
21...............
23............... 24...............
2728.. ............
30...............
Jan.
1.951.851.85
1.61.51.5l.S1 . 55
] . 651.61. 5
1.75
1.81.9 2.0 2.12. 1
2.3 2.152.0 1.91.65
1.751.051.6 1 65
Feb.
1.01.031.0
1.031.01.0
1.55
l.G1.55 1.6
1.0 1.6 1.6
1.6.5 1.71.6
1.61.65i . 65
Mar.
1.6
1.65
1.65
1.71.7
1.7l.S 1.5 2.02.0
2.2 2.2 2.1
2.0 2.02.0 1.91 9
1.91.9
..1.9
Apr.
l.S
1.81.8
1 91.951.91 91.9
1.751.75 1.71.61.7
1.81.85 1.8.5
1.95 2.02.01 9
1 95
2. 55
2.5
May.
2.52.42.45
2. 55
2.62.652. 759 q2.95
2.852.75 2.9
2.8
2.S2. 85 2.9 2.953.0
2.95 2.82.8.5 2.752.8
9 7
2. 05 2.02.5
June.
2.452 4
9 5.-,
2.52.62.75
3.7
3.93. 75 3.05
3.8 3.9 3.9
4.5
4.754.84 9
4. 35
4.4
July.
4.75
(a)
5.5 5.4
5.0
5.3 5.05.4
5.15.3 4.44.44.3
Aug.
4.03 9
3.83.73. 053. 75
3.83 7 3! 05q i\K
3 73.75 3.7 3.7
3.6
3.65 3.65
3. 35IT) Q
2.S5
Sept.
2. 65
2. 65
2.62.6 2.5
2.4
9 452.4 2.49 33
2.3 2.252.2 2.3
2. 259 9
2.2
Oct.
'-> 9
9 9
9 9
2.159 2
2.0
1.95 1.9
1.75 '1.75 1.71."
I."
1.8
1.7
1 . 65
1.55 1 . 55
Nov.
1 451.35
1.45
1.51.65 1. 05 1.7
1.65 1.65 1.7
1.05
1.6
1.7
1.8
l.S
Dec.
1 91.95
1 9
1 9
1.9
2.01.95 2.0
1.95 2.0 1.0
1.9 1 9 ">1.9 1.9
2.0
1 . 95 2.0
n Station discontinued; operation resumed July 15.
Rating table for Bishop Creek near Bishop, Cal.,for 1906.
Gageheight.
Feet.1.401.501.601.701.801 . *,lO2.002. 10 .
Discharge.
Sec.-ft.i
10142435465870
Gapeheight.
Feet.2.202.302.402. 502.602.702. SO2.90
Discharge.
Sec.-ff.8498
114130147164182201
Gageheight.
Feel.3. 003.103.203. 303. 403. 503. (103. 70
Discharge.
Sec.-ft.29
3)0
2012, -1230331'5347370
Gapeheight.
Feet.3.803.904.00
Discharge.
Sec.-ft.39.3410439
4. 10 i 4624. 20 4804. 30 5104. 40 5.344. 50 558
NOTE. - This table is based on 6 discharge measurements made during 1906,
Monthly discharge of Bishop Creek neai
Gageh light.
Feet.4.604.704.804.905. 00.5. 205. 405. 60
Discharge.
Sec.-ft.582606MO654678726774822
and is not well d 'fined.
Hi.tJiop, Ceil., for Jttttt;.
Discharge in second-f°et.Month.
Maximum. Minimum.
Februarv . . .. . .. .. .............. .......
.July..\11SJUSt. .... ............ . ...
os in40 1284 1 0
1220 114666 ' 114S99 .r)1 0
.................... 439 182
October.. . . .. . .. ...... . .... .......No veniberDecember
The yen r
13284
58
8412
3
X22
Mean.
33. 416.44
^-
~> 0
Total in acre-feet.
3.S?;
350124
45. 37 r,
50. 0
166
2, 050911
2, 5SO
22, 700
21,. TOO7,3X02, 780
3,070
121,000
"Mown of 23 days taken as the mean for the month. NOTE. -These values are fair.

44 SURFACE WATER SUPPLY, 1906.
BIG PINE CREEK NEAR BIG PINE, CAL.
This station was established December 5, 1903, by R. S. Hawl It is located 3 miles southwest of Big Pine, Cal., at a point wh the creek leaves the foothills. The conditions and the bench ma are described in Water-Supply Paper No. 177, page 78, where given also references to publications that contrin data for previc years. No gage-height record was kept during 1906.
Discharge measurements of Big Pine ( 1reek near Big Pine, Cal., in 1906.
Date.
December Hi. .
ITydrographer. Width.
Feet.
.....do......................................... 14
.....do......................................... 14
.....do....;................................. .. 9
.....do......................................... 8
Area of , Gage section. ' height.
Sq.ft. Fett. 14 2.2514 2. 3210 ' 1.98"Jfi ' (a\12 (a>13 (a)13 (a )
Di cha*
Sec.
a (Jage out.
BIRCH CREEK NEAR TINEMAHA, CAL.
This station, originally established June 14, 1905, was reest lished on December 7, 1906. It is located about 8 miles south Big Pine and 1 mile west of Fish Springs schoolhouse and ab 500 feet west of Peterson's ranch house. The conditions at t station are described in Water-Supply Paper No. 177, page 80. r gage is a vertical staff nailed to a post, and is graduated to feet ? tenths. The bench mark is two large spikes driven in the base a 4-inch birch tree about 50 feet northeast of the. rod; elevati 0.52 feet above the zero of the gage.
Dischargt measurement* of Birch Creel- near Tinemaha. Cal., in 1906.
Ilydrographer.
( I . R. Shnov ................-.-.---...-...--........do.........................................
.....do. ........................................
Feet.
r,
Sq.ft. Feet. .......... 0. 52
4. 2 a . 35 '
Sec
« By new gage.
Daily i/ai/e height, infect, of Birch Creek near Tinemaha, Cal.. for 1901!.
Day. ' Dec. Day. Dec.
12............... .4 19............... .3
Day. Dec.
22 .............. .323..............: .324. ........ .....' .325 .............. .35
27.............. .4
Day.
>829 ..............
31...............
r

OWENS EIVEE DRAINAGE BASIN. 45
TINEMAHA CHEEK NEAR TINEMAHA, CAL.
Tinemaha Creek is tributary to Owens River from the eastern slope of the Sierra Nevada.
The station was established December 7, 1906. It is located about 500 feet south of the Peterson ranch house, about 8 miles south of Big Pine, and about 1 mile west of Fish Spring? schoolhouse.
The channel is straight for about 40 feet above and for 30 feet below the measuring section, and the velocity is moderate at ordi nary stages. Both banks are steep, about 5 or 6 feet high, and covered with a scrubby growth. The bottom is composed of clean gravel and is not likely to shift. There is one channel at all stages, and at low water the width is about 10 feet and the depth 0.5 feet. The section is good and gagings are made by wading.
The gage is a vertical staff, graduated to feet and tenths, and nailed to a post.
The following measurement was made December 7, 1906:
Width, 7 feet; area. 4 square feet; gage height, 0.50 foot; discharge, 5.9 second- feet.
Daily gage height, infect, of Tinemaha Creek near Tinemaha, CaL.for 1WI6.
Day.
7............... 8...............9...............10...............
13...............
Dee.
0.5
.5
Day. Doc.i
14.............. 0.3
16.............. .45
18..............' .4
20.............. .4
Day.
21. .............2223 ..............
25 . . .
Dec.
0.4
r
Day.
2S .............. 2!) ...........30 ..............31..............
Dee.
0.5
,-
TABOOSE CREEK NEAR TIBBETTS, CAL.
Taboose Creek is tributary to Owens River from the eastern slope of Sierra Nevada.
The station was not*established regularly until August 20, 1906, though discharge measurements were made throughout the year. It is located about 15 miles north of Independence, 2 miles north west of Tibbetts railway station, and about one-half mile west of the crossing on the lower main highway.
The channel is straight for about 50 feet above and 50 feet below the station, and the velocity is moderate. Both banks are rather steep and 3 to 4 feet high and are not likely to overflow. The bed and banks are sandy, with little vegetation, and the channel is sub ject to slight change. At low stages the stream is about 10 feet- wide and 0.5 feet deep.
Discharge measurements are made from a board used as a foot bridge.

46 SURFACE WATER SUPPLY, 1906.
The gage is a vertical staff, about 3.5 feet long, graduated to and tenths, and nailed securely to a post driven in the bank. ^ bench mark in a spike driven in the base of a cottonwood tree 2 south of gage; elevation, 3.75 feet above the zero of the gage.
o/ Tn&oosc (VtcA; , ('«?.. &?/ (r. J?.
Date. AVidth. Aruaof Gape Dis- n- 1^ section, height, charge. **
April 0..April 12......... 7.0 3.2
....... V 30 Ma. 23........
3 0 lunn 11Tnlv")
3.4 July?
x rtApril 24.... .. ' .. . . S. 4May 2...........
May 16.... .......
7.4 S. 07.S
4.5 7.1
0. S........ 12
' July 14.......... i July 27..........
Width.
7.8 7.S 7.0 8.0
10 10
6.0 3.7 4.0
Area of section.
7.4
7.8 10
. 14
]26.9 1.9 1.8
Gage height.
2.35 l.SO 1.65
I oh
at regular station.
Day.
1.............o3.............4.............
eXXXXXX!
9.............
11.............12.............
14........... .15. ............16.............
Aug. Sept.
2 1....... 2. 1....... 2. 1
2 2 X!%% 2%2
....... 2. 2
....... 2. IS
2 2 ? )n 9
....... 2. 2.jO O({
Oct.
1.8a1.651.85 1.85
1.82
Noy.
1.7"{.'7 '
1.8
1.7.?
1.7
Dec.
].75
1.7"i.'?.'
1.6.5
1.0.5
1.65
Day. Aug.
17.......... J.......IS............ .......
20..... ... 2.32 21............ 2.35
27............ 2.1
29............ 2.1
Sept.
2.25
2.252.15 2.1
1 OS
1 91 GB
1.9 1.91 OO
1.85
Oct.
1.81
1.80
1.8
1 O
1.78
Nny.
"i.75"
1 75
1.75
1.75
Month.
March ...................................................
July. ....................................................
Discharge in spcnno
Maximum. Minimum.
4.0 3.0 3.6 8.4
12 28 56 40 21 5.6 4.0 4.0
56
3.3 2.7 3.0 3.4 6.8 9.0
29 15 5.6 3.2 3.0 3.0
-feet.
Mean.
3.7 2.9 3.3 5.8
10.4 21.8 46.3 25.7 15.0 3.7 3.6 3.5
3. 0 ! 12. 1
Tote acre-
NOTE. Daily discharge prior to August 19 was obtained by Interpolation between measureri Values are approximate.

OWENS KiVEK DKA1NAGE BASIN.
GOODALE CREEK NEAR TIBBETTS, CAL.
Goodale Creek is tributary to Owens River from the eastern slope of the Sierra Nevada.
The station was established September 20, 1906. It is located when* the stream leaves the foothills, about 13 miles north of Inde- pendence, 4 miles west of Tibbetts railway station, and one-fourth mile west of the upper road crossing.
The channel is straight for 20 feet above and 15 fe^t below the measuring section, and the current is swift at all times. Both banks are low, clean, and sandy, but not likely to change mater'ally. There is but one channel at all stages and discharge measurements are made from a plank used as a footbridge. At low water the stream is about 8 feet wide and nearly a foot deep.
The gage is a vertical stan" nailed securely to a post driven in the bank. The reference bench mark is the top of a piece of steel driven in the ground about 5 feet south of gage and witnessed by a guard stake; elevation, 2.10 feet above the zero of the gage.
Datf.
April 12......April 24......Mav2. .......May9. .......May 10.......May 23. ......
Width.
4.U
4. 04. 74.75. 04. 7
Area < f section.
"fi,1.8 2.9 2.9 3.5 2.8
(luge l*is- height. charge.
F^. g'rr Vf- 2 (', 4 2 2 5 7 4 7.4 7.5 4.9
11
Date.
.hilv 2 »
.lulv 7 »
Width.i
1 Frrf.
!hilv27iX" .X ""4."4 October 31 b . 5.n December S&... ti. 0
1
i At upper road crossing.
JJ«f/y (/«</( An <//;(, ;/;/}'(/. o/"^uw/»7r (^ '/v r^ /;ro;'
Area of Uagp Dis- st'ction. height, charge.
Xf/. (f. F
'4.1 X3.43.*S
r,/. S,r.-/f.
1727
K. 7I. (JO 5. 4 . (10 4. H
?' At regular station.
TVMfffa. f'«Z.. /m' /.'/(V(;.
Day.
1. ............2.............3............4.............5............. (i.. .........7............. S. .... ......P. ..... ...
10...... .. ..11 .............
Oct.
(iS
-.:
.02
.Ul
Nov. Dec.
...... 0. CX)
.50 . (10
. (X) . 55...... .m
...... .55
Day.
12............13............14............15............Id............ 17............IS............
Kxxxxxx
( )ct.
0. CiO
.CX)
.......,»,
Nov. Dec.
'
0. W 0. 55
.dO .55
...... .50 .(.15 ......
...... .50
Duy. Oct.
23............ O.I12^425............ .(/)20............ ......27............ .(X)
29 .(iO 30............ ......31............ .m
Nov. Dec.
6. uo 6. .vi
...... .5(1.(X) ......
. (JO . 50

48 SURFACE WATER SUPPLY, 1906.
Monthly discltaryc of (roodalc <'reck near Tibbctts, f'aL.for 1906.
Discharge in second-feet. Month. - - - - af
Maximum. Minimum. Mean.
April .................................................... 4. 2
July ..................................................... 27
September. .............................................. 6. 3
............ "2.0
a 1 02.6 3.5 2. 5 6. 3 4. 9 11. 2 6. 8 19. 0 6. 2 6. 4 4. 8 5. 9 5. 4 5. 6 5. 0 5. 3 4. 0 4. 3
............ 6.0
a Estimated.
NOTE. The daily discharge from April to September was obtained by interpolation between r uremenls. Values'are approximate.
DIVISION CREEK NEAR INDEPENDENCE, CAL.
Division Creek is tributary to Owens River f~om the eastern si of Sierra Nevada, and measurements are made near where it lea the foothills and enters the valley.
The station was established January 10,1906, but no gage rec was kept until September. It is located about 10 miles north of Ir pendence on the upper road crossing, about H miles west of Ricky ranch house.
The channel is straight for about 10 feet abcve and 20 feet be the station. Both banks are low, and compos-ed of gravel cove with weeds which extend a foot or two into the water; they are subject to overflow. The bed is also of gravel, but is clean and likely to change. The velocity is moderate and there is one char at all stages. At low water the stream is 6 or 8 feet wide and ab a foot deep. Discharge measurements are made from a plank usec a footbridge.
The gage is a vertical staff driven in the ground and nailed t .post. The bench mark is the top of a steel gad driven in the gro~ near a willow tree 20 feet west of gage; elevation, 4.45 feet above r of gage.

OWENS RIVER DRAINAGE BASIN.
Discharge measurements of Division Creek near Independence, Cal., by O-. IL Shuci/, in1906.
Date.
March 3. ........
April 18.........
May 2 ...........May 9...........
Width.
Feet.
6.4t>. 0
Area of section.
Sq. ft.
3.0
3.03.3
Gage height.
Feet.
9 9Q
2.23
o °52.30
2 2">2. 30
Dis charge.
Sec. -ft. 8.1
5.15.09.05.44.74.95.40.57.4fi.67.9
Date.
Mav Ifi .........
July2. .........July 7. .........Julv 14.........July 27.. .....
October 31 .....
Width.
. Feet.6.5
6.2ti. 16.16.36.36.67.06.54.05. 55.5
Area of section.
Sq. ft. 3.33.33.13.33.74.34.25.06.77.14.04.84.2
Gage height.
Feet. .26. 2i i
28.30.35.40.45. 65.95.10.60.55
Dis charge.
Sfc.-ft. 7.57 5
6.07.79.29.9
11131722
1411
a Measured at ranch house.
Daily e/eie/e height, in feet, of Division Creek near Independence, Cal., for 1<)06.
Day.
1 >
4..................
11 ...............12..................13 .................
Iti........... .......
Aug.
......
Sept.
1.11.11 1
1.11.11 1
1.11.11.11 1
1 11.1
1.1
Oct.
o Ci5
Nov.
2.6
> n
Dec.
2.5
2.5
Day.
17.................18.................19.................20.................21.................
oo
26. ...... .'7
30.................
Aug.
1.11.11.11. 11. 1
1.11.11.11.1
1 1
Sept. Oct.
2. (i
2 I)
2.6
Nov.
2. 55
Dec.
'' 1
......
NOTE. From August IS to September IS the gage record was kept at the ranch house.
Monthly discharge of Division Creek near Independence, Cal., for Htnti.
Month.Discharge in second-f^et.
Maximum. Minimum. Mean
January... Februar}'.. March.....April......May.......June.......July.......August....September. October... November. December..
S.I 5.3 9.0 7.4
5.3 5.04.74.86.16.0
10
10108.0
10
The year
6.75.16.16.07.38.4
17.214.310.912.611.510.1
9.7
Total in acre-feet.
412 283 375 357 449 500 ,060 S79 649 775 684 621
7,040
NOTE. The daily discharge prior to August 18 was obtained by interpolation between measure ments. Values are approximafe.
8591 IRR 213 07-

50 SURFACE WATER SUPPLY, 1906.
EIGHTMILE CREEK NEAR INDEPENDENCE, CAL.
Eight mile Creek is tributary to Owens River from the eastern si of Sierra Nevada; measurements are made near where the stn leaves the foothills and enters the valley.
The station was established September 20, 1906. It is located the upper road crossing about 8 miles north of Independence ' about 300 feet beyond the Eightmile ranch.
The channel is straight for about 15 feet above and 10 feet be the station. The bottom is of gravel, not likely to shift, but b banks are very low and liable to overflow. The velocity is liigh there is only one channel at low water, but at high water there two or three. At low water the stream has a width of about 6 and a depth of 0.5 foot. Measurements are made from a plank u as a footbridge.
The gage is a staff graduated into feet and tenths and nailed t post. The bench mark is a spike driven in fence post 10 feet eas gage; elevation, 1.40 feet above the zero of the gage. During 1 no gage-height record was kept.
Date.
March 27.............
April 24... ...........Moy2.......... .....Muv »...._...........
Width.
Fr(f.
4.04.04.04.0
An'.: of Dis section, charge.
S(/. Ff. ,S<r.-/y.
.......... 2. 3= A
.......... 3. 4
.......... 3. 41. (i 4. 11. (i 3. 71. (i 4. 5l.H 4.4
Date.
May 23..............
June 25. .............Julv 7...............
Octol)vr31"..........
Width.
.Fff/.
4.0
4.0
3.2(i 0Kl)
Ar<vt of section.
Si?. f(.
1.82.02. #'
.|). 13.22. S') ;
rcht
gr
» Gage height O.-JO foot at n gular station.
Dischar^Month.
April ................................................
July ....................................................
The vea r. ....................................... .
Maximum.
2.85.04.14.0
132014118.2
Minimum.
2.5
3.03.74.C,
1311S.35.0
Mem.
"3.0
3.73.44.37.0
10.312. H
n. 7
0.7
Tot: acre-
NOTE.- -The daily discharge, February to October, was obtained by interpolation between mei meats. Values are approximate.

OWENS RIVER DRAINAGE BASIN.
OAK CREEK NEAR INDEPENDENCE, CAL.
51
This station was established June 15, 1905, about ] mile west of old Fort Independence. The conditions and the ben^h marks are described in Water-Supply Paper No. 177, page 83.
A new station was established October 1, 1906. It is located at Bell's flour mill; about 3 miles northwest of Independence, and just above the division boxes which divide the stream into three parts.
The channel at the point of measurement is a flume 12 feet wide and 1 foot deep, with a gravel bottom which has to be cleaned out after high water. At very high stages the stream divides above the flume and forms two channels. Measurements are made by wading or from a plank used as a footbridge.
The gage is a staff nailed to a post on the north side of the stream.
Date.
March 3
Width.
/'V<(.
........
March 10........ ........
March 27 ....
April 12 ........
May 9...........
4 44 1 1
Area of section.
Sy. f/.
Gage height.
Kf(Y. 0.20 .20
,
j.5 4.3 4.0 4.1 (;..1
.30.. »o
.no
.44
.90
Dis- cha rge.
""^
7 1
Date.
May 23.. ........TnncX.
% 5 1 .fnnc ;?X
S.9
10 14 17 14 2(j
JulY-T..........July 14.........
OctnMr20..... Xovemtier 19...
Width.
.Fff/.
IS IS 17 1C, Hi 14
12 12
Area of section.
S?./f. 7. 77. 7
Ji 2d Jl 23 ?2 JO
4. M
,\ (1
Gagi? height.
,F«f. 1.08 1.08
.%
..'!0
Dis- chargp.
&Yr.-^. 34 3(i HO 93
I(i2 14j 132
(8 21 17 12.4 10.0
» Measured in two channels.
;/ (/(K/r 7/rif/A/. n;/ff/. off^fA' r/vrA" /imr

52 SURFACE WATER SUPPLY, 1906.
Monthly discharge of Oak Creek near Independence, CaL, for 1906.
Month.
July.............. ......................................
December
Discharge in second-feet.
Maximum.
7.7 8.9
17 30
128 162 109
51 26 12 12
162
Minimum.
7.1 7.4 8.5
14 36
113 53 20 12 10 10
Mean.
06. 0 7.3 7.8
11.9 28.0 69.9
140 73.5 32.2 20.5 11.8 11.3
35.0
o Estimated.
NOTE. The daily discharge February to September was obtained by interpolation betwee urements; after October 1 a rating table, based on three diseharg^ measurements, was used are approximate.
INDEPENDENCE CREEK NEAR INDEPENDENCE, CAL.
The old station at the city waterworks, which was established Jir 1905, was wrecked in June, 1906, and a new station was establ on August 20, 1906. It is located about 1 mile west of the to"* Independence and about 300 feet above the waterworks for the
The channel is straight for about 40 feet above and 30 feet j the station. Both banks are high and rocky and not liable to flow. The bed is also rocky, but clean and fairly permanent. r. is one channel at all stages and the velocity is high. At very stages the section may change on account of the displaceme bowlders. Measurements are made from a plank used as a bridge. At low water the stream is about 10 feet wide and 0.< deep.
The gage is a staff nailed to a post on the south bank of the c The bench mark is a spike driven in a willow tree about 10 fee of gage on south bank; elevation, 1.32 feet above zero of gage.
Discharge 'measurements of Independence Creek near Independence. CaL, in 19<
Date.
April 22. ........April 30. ........May 10.........May 22 .........
Width.
Feet.
9109
1010
Area of section.
Sq. ft.
4.6
6 17.5
11
Gage height.
Feet. 0.42
.36........
50.60.61.80.98.87
Dis charge.
Sec.-ft. 4.52.82.44.64.95.0G.6
1111254332
Date.
June 4. .........
June 23... ......Julyl..........July 9..........July 19.........
October 20......
Width.
Feet. 8
1311111111
ii111010
Area of section.
8q. ft. 8.6
18
162009
139.16.66.6
Gage height.
Feet. 0.851. .Vj
.90
.50
.45
NOTE. Measurements January to August were made at old station; the gage was out aft 12. Measurements September to November were made at new staVon.

OWENS EIVER DEAINAGE BASTK. 53
Daily gage height, in feet, of Independence Creek near Independence, Cal.,for 1900.
Day.
1.. ....
3 ......4......
0. . . . ..7 ......8.. ....9
10 ......11......
Sept.
O.y
.9
q
.9
Oct. Nov.
O.fi .... ..... 0.5
...... .5
....... .4".'.::: "".53
.7 '......
Dec.
0.5
.4
.
Day.
12.....13.....
15 .....16 .....17.....18.....1920 .....2199
Sept.
0.8
.8
.8
-
Oct.
0.0
--7
Nov.
0.4.45
.4
.4
£
.5
Dec.
0.4
^
Day.
28 .....99OA
31
Sept.
-
Oct. Nov. Dec.
0.4
Monthly discharge, of Independence Creek ntar Independence, CaL, for 1906.
Discharge in second-feet.
Maximum.
January . . 4. 5
April...... ............ . . 11May............................. ..... ............ 43June ..................................................... 220July.................................. . ............. 144August. ............. ........... . . ... 84
October. .......... . ........... ... ...' Iti
December. ... . . . . ... 75
The year. ......................................... 22(1
Minimum. Mean.
2. 8 2.4 4.4 5.0
12 31 88 37 15 7.5 4.0 4.0
2.4
4.0 2.8 4.8 8.0
29.6 96.4
127 54.4 22.9 12.4 6.1 5.2
31. 1
Total in acre-feet.
240 150 295 476
1,820 5, 740 7,810 3,340 1,360
762 363 320
22, 700
NOTE. The daily discharge, January to August, was obtained by interpolation between measure ments. Values are approximate.
SHEPHERDS CREEK NEAR INDEPENDENCE, CAL.
Shepherds Creek is tributary to Owens River from the eastern slope of Sierra Nevada. No regular station has been established on this stream, but a sufficient number of measuremerts have been made during 1906 to warrant a rough estimate of the yearly flow. All measurements have been made near the foothills.
Discharge measurements of Shepherds Creek near Independence, CaL, ly G. E. Shitey, in1906.
Date.
April 14...............................April 22... ............................May 1 ...... ... . ..........May 10................................May 18................................May 26................................June 2 . . . .... . .June 12 ...... ..... . .................
Discharge.
Sec.-ft. 1.7
109.8
3432271560
Date.
June 21 ..... ..............June 29........... ....................July 9................................July 23 ...............................
Discharge.
Sec.-ft. 9570
109
11
.33.4

54 SURFACE WATER SUPPLY, 1906.
Monthly discharge of Shepherds ('red- near Independerce, Cal.,for 1906.
Month.
January
Discharge in second-feet.
Maximum.
February...... ........ .... .....................
July ....................................................
November
Minimum. ' Mean.
.... .. ...i............16 34 95
111 93 31 5.3
4.5 9.8
15 78 33
5. 5 1.0
December .... . .... i .......... ...
The year
2:0 2.0 2.0 9.0
26.5 62.2
104 03. 0 12.0 2.6
. 5 3.0
24.1
Total acre-fe
1 3 6 3
17
NOTE. The daily discharge, April to October, was obtained by interpolation between me as ments; mean for other months estimated. Values are approximate1 .
MOFFETT CREEK NEAR INDEPENDENCE, CAL.
MofTett Creek is tributary to Owens River from the eastern sic of the Sierra Nevada. No regular station has been established t during 1906 enough measurements were made to justify a rou estimate of the yearly flow. All measurements were made near t foothills.
Discharge measurements of Moffett Creek near Independence, fa?., by G. R. Shitetj,1906.
Date. ' Discharge.
| Src.-ft. April 14................... ...... .... 1.5
May 1 a ............................... 3.9
May 18.. .......................... ... 14May 26..... ........................... 15
Date.
June 29« ...............July 9............ ...................Julv 23 a. .........
October 22 a ..........................
Discha*
Sec.-f
f Measured at diversion gates. * Estimated.
Monthly discharge of Moffett Creel: near Independence. Cal.,for 1900.
Month.
January
Discharge in second-feet.
Maximum.
March ........ ... . . ...... .......
July .....................................................
6.5 15 4439 197.8 2.9
Minimum.
1.5 3.9
10 19 8 2 2.9 1.3
ii
Mean.
1.0 1.0 1.0
12.5 31.3 30.3 13.4 4.3 2.0l :l
Total acre-fe
11
6
NOTE. The daily discharge April to October was obtained by interpolation between measuremei mean for other months estimated. Values are approximate.

OWENS RIVER DRAINAGE BASIN. 55
GEORGES CREEK NEAR INDEPENDENCE, CAL.
Georges Creek is a tributary to Owens River from the eastern slope of the Sierra Nevada. No regular station has be^n established, but enough measurements were "made during 1906 to warrant a rough estimate of the flow for the year. Measurements were made at or above the division ates.
Date.
February 7. April 14 J... April 2J....May ]......Mav 10.....May IS.....May 20.....June 12.....
Discharge.
Hrc.-ft.1.05.1
147.4
20
Date.
June 29............. ......... .......July 9. ...... ..... ........... .....July 23......... .. .............. . .\ugust 10.. ....... ............... .
October 30...... ... ............. . .December 1H.. ........... . .
Discharge.
84102424.53.11.0
....
Month.
March............ ..
July .......................................
Discha
Maximum.
rge in seeonr
Minimum.
1429
............ 102
I '^Q. ..........1 14
.; 3.0
7.4 31 70 29 14 3.0 2.1 1.4
103 ............
1-feet.
Mean.
"1.0 "1.0
lf\3 21. 1 52.9 S6.9 42.3 21.0
7. 7 2.6 1.7
30.9
Total in acre-feet.
61
123 613
1,300 3,150 5.340 2,000 1 . 250
473 155 105
15, 200
n Estimated.NnTE. The daily discharge A|)ril to November was obtained hy interpolation hetween measure
ments. Values are approximate.
LONE PINE CREEK NEAR LONE PINE, CAL.
Lone Pine Creek is tributary to Owens River from the eastern slope of the Sierra Nevada. The station was established September 25, 1906. It is located about three-fourths mile west of the town of Lone Pine and about 500 feet above the division boxes on the creek.
The channel is straight for 30 feet above and 20 feet below the sta tion. Both banks are high and rocky and not subject to overflow. The bed is rocky and not likely to change, but the cross section is rough and uneven. There is one channel at all stagee and the cur rent is swift. At low water the stream is 7 feet wide and 0.8 foot deep. Measurements are made by wading or from a plank used as a footbridge.

56 SURFACE WATER SUPPLY, 1906.
The gage is a staff graduated to feet and tenths and is nai securely to a post. The bench mark is a spike driven in the base c birch tree on the south bank near the station; elevation, 4.85 f above zero of gage.
Discharge measurements of Lone Pine Creek near Lone Pine, Cal., by G. R. Shuey, in 1[
Date.
March 29................. .......
Gage height.
Feet.
Dis charge.
Sfc.-ft. 3.13.12.24.04.04.45.5
122(i3332
Date.
June 13. ......... . ..... .......June 21... .......................June 29.......... . .............July 10..........................July 25..........................
October 23 a ......................
Gage height.
Feet.
1.921.801.70
Di cha
Sec
n Measured at regular station.
Daily gage height, in feet, of Lone Pine Creek near Lone Pine Cal., for 1906.
Day.
0
4.............
8.............Q
10.............11. . ....
Oct.
1. x9
1.83
Nov.
1.7
1.7
Dec.
1.7
1.7
"l.~7~
Day.
13............14............
17............
19............
oo
Oct.
1.81
Nov.
1.7
1.7
1.7 1.71.7
Dec.
1.7
1.7
..1.7
Day.
23............24............25............26............27............28............°930............ 31............
Oct.
1.8
Nov.
1.7
1.7
1.7
Monthly discharge of Lone Pine Creek near Lone Pine, Cal., for 1906.
Discharge in second-feet.
May.........................................
July .........................................
November
!1 Maximum.
1
............. 3.1
............ 4. 5
............ 14
............ ! 40
............ 103
............. 139
............ Ill
............ 43
............ 16
............ 8. 0
............ 8. 0
........ ... 139
Minimum.
O 9
2.74.5
1542
1064417128.08.0
2.2
Mean.
aS.O2.93.87.2
28.573.5
12968.427.214.08.08.0
31.1
acre-fe
14741
°2
Total
a Estimated.
NOTE.--The daily discharge January to September was obtained by interpolation between meas ments. Values are approximate.
TUTTLE CREEK NEAR LONE PINE, CAL.
Tuttle Creek is tributar}7 to Owens River frorr the eastern slope the Sierra Nevada. During 1906 measurements were made regulai at a point near Lone Pine, where the stream leaves the foothills a

OWEN'S TUVER DRATNAOE HASTN. 57
enters the valley. These measurements are numerous enough to war rant a monthly estimate of the flow of the stream for the year. A gage-height record has been kept during November and December.
Discharge measurements of Tnttle Creek near Lone Pine, Cal., by G. R. Shuey, in 1906.
Gage Pis- lieight. charge. Date. Gage
height.Dis
charge.
Feet.
February 17 . . . . . .... 0. 90
March 13.... ... ... .................March 23 ......... ... .................
May 11 ...... ..... ............. .98
May 20...... ................. 1.05
Scc.-ft. 4.95.04.44.24.24.0
10
13
June 13..........................June 21... ......... ...
July 25..........................
Fict.1 1 C
1.45
1.651.401.181.12
Sec.-ft. 20
39673518
9.58.5
Daily gage height, infect, of TuttJf Creek near Lone Pine, Cal., for 190G.
Day.
1..........2... .... .3... ....4.. ....
(i....... ..
8... .... .
Nov.
1.1
1. 1
1.1
1. 1
Dec.
1.1
1.1
1.1
i. i
Day. Nov. Dec
9.......... ...... 1. ]10.......... 1.1 ....
12.......... l.l.-> ....
14.......... ..15.......... ...... 1.116.......... ...... ....
Day. Nov.1
. 18.......... ......
.20.......... 1. 13
23.......... 1.15. 24. ...............
Dec.
1.1
1.1
1.1
Day.
9-
20' 28
2930..........31...... ...
Nov.
1.15
......
Dec.
i. i
Monthly discharge of Tuttlc Cretk near Lone Pine, Cal., for 19<l<>.
July .....................................................
Maximum.
5.04.67.0
15406751
11108.0
Minimum.
4.4
164199
10
8.08.0
............
Mean.
« 5. 04.S
26.054.1 ?0 1
14.29.69 08.0
Totfl inacre-feet.
3072(17
3,330
845
536492
11 200
a Estimated.
NOTE. The daily discharge February to December was obtained by interpolation between measure ments. Values are approximate.
COTTONWOOD CREEK NEAR OLANCHA, CAL.
Cottonwood Creek discharges into Owens Lake from the Sierra Nevada; measurements are made near the foothills.
The station was established September 25, 1906. It is located about 15 miles south of Lone Pine and about one-fourth mile above the point of crossing of the Los Angeles conduit.

SURFACE WATER SUPPLY, 1906.
The channel is straight for about 40 feet above and 50 feet be the station. The right bank is high, rocky, and wooded; the. le comparatively low and not wooded; but neither bank is likeb overflow. The bed is rocky and permanent, and there is but channel at all stages, but the current is very swift. At low w the stream is about 10 feet wide and 1 foot deep. Measurements made from a plank used as a footbridge.
The gage is a staff nailed to a post.
I)atl> - height. ! charge.
_
March 2i#..... ............................ 12April 20. ......................... ........ 26April 27.... .. .. .............. . ...... 31May 19......... ................. ....... 15sMay 27.................. .... ... . 131Juno 13........................... ........ 434
Date.
July 10...................July 24..... ..............August 12......... ......
< K-tolier °(i fNovember ° 1 «
Gage height.
F, (t .
....... 0. NO74
....... .50
Measured at regular xta
Day.
1......2......3......4......5......0 ......7......»..-.-.
1011......
Sept.
--
Oct. N
0. S 0..8
s,
.75 ...
.7 ...
.7 ...
.7 '...
iv. Dec.
7 0. 575 ......75 ......
.0... -----
.0
Day.
12... ..
14......15 .....10......17......
in......20......21......22......
Sept. Oct.
'I ',
.7
. 05
.05
.5
Nov.
0.0
(i --
.5
Dec.
o o
.s
.0
(I
Day. Sept. . ' ' .
23... ..I......24..... ......25 ...........20..... 0. S )7 «
2(1 . S30..... . S 31 ...........
()r-t.
0.5.7.75.74.7.7. 05.70. 05
Nov.
0.0
.5
.5
.5
Discharge in second-feet.Month. -, -
Maximum. Mriimum. Mfan.
Manh....... .................. .......... ........ 13April........ ............... ............... .. 35May............ .... .... ..... ... ... .... ... 158JUHP......... .... .... . . ... ...... . 434July........... .... ............................. 287August.............. ..... . ..... .... .... .... 161
October ^2
5.5 7.4 0.5
14 40
172ino70 22 10 0.0 9.U
5.5
0.2 8.2
10. fl 24.2
114 333 225 104 42.4 15.9 13.3 12.8
75. H
Tott acrr-
NOTE. The (Lilly dis hitrgf January tu September \v ments. during high Avatpr iueasurc7ii"nli AArre nuide charge is proljably too low. Values art' approximate.
oht.-tmi'd \y interpnlatinn hrtwern me: flnAv thr point of diversion, ro that th

OWENS RTVER DRAINAGE BASIN. 59
ASH CREEK NEAR LONE PINE, CAL.
Ash Creek discharges into Owens Lake from the eastern slope of the Sierra Nevada. Numerous measurements have been made on this stream during 1906, but they have not been made at the same point, although all were above the point of diversion.
Discharge measurements of Ash Creek near Lone Pine, Cal., by G, R. Shucy in 1906.
Date.
March 2;». ....................
May 10.. .....................May 27.......................June 14. ............... ....
Discharge.
! Sec. -ft. ........ 1.3........| 4.8........ i 10.7........ 10........ 1t>
Date. Discharge.
St,-.-ft. June 29 ............................... .">SJuly 10............................... 31
November 2 1 ......................... 2.4
Monthly discharge of Ash Creel: ni'ur Lone J'im , Cal., for lf)(>f>.
Month.
January... February.. March.."... April......May.......June.......July.......August....September . October... November. December..
Discharge in t>ecoii>l-fQet.
Maximum. Minimum. Mean.
The year.
Total in acre-feet.
494<UU
1,820
NOTE.- The daily discharge January to November was obtained by interpolation between meas urements. Values are approximate.
MISCELLANEOUS MEASUREMENTS IN OWENS RIVER DRAINAGE BASIN.
The following is a list of the miscellaneous discharge measure ments made in the Owens Kiver drainage basin during 1906:
Black Rock Springs near Independence, Cal. Theee springs are near the foothills, about 8 miles northwest of Independence, and the water from them discharges into Owens River. The following measurement was made December 12, 1906, at the point where the water emerges from the ground.
Width, 11 feet; area, 19 square feet; discharge, 27 second-feet.
Cottonwood Creel: near Lone Pine, Cal. This stream discharges into Owens Lake from the eastern slope of the Sierra Nevada. The following measurement was made September 26, 1906, at the mouth of the canyon where the stream enters the valley:
Width, 10 feet; area, 12 square feet; discharge, 25 second-feet.

60 SURFACE WATER SUPPLY, 1006.
Fish Springs near Tinemaha, Cal. These springs are near foothills, about 8 miles south of Big Pine, and the water from t\ discharges into Owens River. The following measurement was m December 7, 1906, in a flume near their source:
Width, 7 feet; area, 20 square feet; discharge, 36 second-feet. Georges Creek near Independence, Cal. This* stream is tribut
to Owens River from the eastern slope of Sierra Nevada. The lowing measurements were made in 1906, at the mouth of the c yon where the stream enters the valley:
September 7: Discharge, 25 second-feet. October 30: Discharge, 4.8 second-feet.
Independence Creek near Independence, Cal. This creek is tri tary to Owens River from the Sierra Nevada. The following ir" urements were made in 1906:
September 11, at mouth of canyon: Area, 11 square feet; discharge, 28 second- November 13, at, Pinon ditch: Width, 5.4 feet; area, 3.3 square feet; dischi
5.3 second-feet.
Lone Pine Creek near Lone Pine, Cal. This stream is tribut to Owens River from the eastern slope of the Sierra Nevada, following measurements were made in 1906, at the mouth of canyon where the stream enters the valley:
September 8: Width, 10 feet; area, 12 sqiiare feet; discharge, 31 second-feet.September 24: Area, 9.3 square feet: discharge, 20 second-feet.October 23: Width, 8.3 feet; area, 0.7 square feet; disclnrge, 10 second-feet.
North Fork Oak Creek near Independence, Cal. This streair tributary to Owens River from the eastern slope of the Sierra Nevr The following measurements were made in 1906:
August 20, in canyon: Area, 7.8 square feet; discharge, 49 second-feet.November 17, 3 miles above junction with South Fork: Width, 4.3 feet; area
square feet; discharge, 12 second-feet.November 19, at junction with South Fork: Width, 8 feet; area, 4.6 square
discharge, 12 second-feet.
South Fork Oak Creek near Independence, Cal. This stream is so of North Fork and is tributary to Owens River from the eastern si of the Sierra Nevada. The following measurements were made 1906:
August 20, in Canyon: Area, 9.9 square feet; discharge, 52 second-feet. November 19, at junction with North Fork: Width, 6.5 feet; area, 3.3 square
discharge, 4.3 second-feet.
Shepherds Creek near Independence, Cal. This stream is tribut to Owens River from the eastern slope of the Sierra Nevada. ' following measurements were made November 14, 1906:
At mouth of canyon: Width, 6.5 feet; area, 3.9 square feet; dishcarge, 5.4 sec feet.
At fork 4 miles east of canyon: Width, 6 feet; area, 4 square feet; discharge second-feet.

MOHAVE RTVEE DKAINAGE BASEST. 61
Taboose Creek near Tibbetts, Cal. This creek is tributary to Owens River from the eastern slope of the Sierra Nevada. CH December 8, 1906, a measurement was made on the upper road crossing 2 miles above gaging station.
Width, 8 feet; area, 3.6 square feet; discharge, 5.4 second-feet.
TJiebaut Creek near Independence, Cal. This stream is tributary to Owens River from the eastern slope of the Sierra Nevada. On November 17, 1906, the following measurement was made at the mouth of the canyon where it enters the valley:
Width, 1.4 feet; area, 0.5 square foot; discharge, 1.6 second-feet.
MOHAVE RIVER DRAINAGE BASI T .
DESCRIPTION OF BASIN.
The Mohave River rises on the northern slope of the San Bernar- dino Mountains, and, flowing in a northerly direction, finally disappears in the sands of the Mohave Desert. This stream has few tributaries, the only ones of importance being West Fork and Deep Creek, which have their source in the higher elevations of the Se,n Bernardino Mountains. The formation is of granite, with a good covering of soil. On the higher elevations there is a considerable growth of tim ber, which diminishes as one approaches the lower reaches, changing to a light growth of brush and grass, finally merging into the barren desert. During the greater portion of the year the stream bed is dry below the junction of West Fork and Deep Cre-^k, where the waters disappear in the sand and gravelly bed of the stream. Water again rises at a point lower down on the river above Yictorville, where the gaging station is located. Water is diverted above and' below the gaging station, but is again returned to the river channel. There are several artesian wells along the river above the gaging station, the water being used for irrigation. This stream does not discharge in any large quantity except during an extremely heavy rainfall in the winter months. The precipitation throughout this basin is very light, with the possible exception of the higher elevation of the San Bernardino Mountains, where there is a considerable fall of snow during the winter months, which melts in the early spring.
MOHAVE RIVER AT VICTORVILLE, CAL.
This station was established February 27, 1899, and discontinued July 31, 1906. It is located in the town of Yictorville, a station on the Atchison, Topeka and Santa Fe Railroad, where the Mohave River passes through a narrow gorge locally known as the "Narrows." The conditions at this station and the bench marks are described in Water-Supply Paper No. 177, page 87, where are given also refer ences to publications that contain data for previous years.

62 SURFACE WATER SUPPLY, 1906.
The gage heights observed at this station in 1906 are of no va" therefore no discharges have been computed.
Discharge measurements of Mohare Rher at Victorville, Gal., by P. n. Leaky in 19
Date Gage mte ' height.
Ft ft.
January 12... .............. . . -1.09
January 31..... ............ .... 4.10
February 0. ..................... 4. 10February 10 .................... 4. 10Februa rv 13. .................... 4. 11February 17 ..................... 4. 11February 21 .................... 4. 12February 24. .................... 4. 12February 27 ..................... 4. OSMarch 2. ......................... 4.11
March 9. ............. ..... . 4.10
March l,s. ........................ 4.1.3March 20......................... 4.11
Ma rch 27 n ...................... 4. 90Ma rch 27 a. ...................... 4. SO
Dis charge.
ficc.-ft. 0503
06
Oil(i4(17OS045079(V)7007
Miq ono1.020
828
4, 5305.5702,100l.SSO
Date.
March 28<z....... .......... .....
April 2...........................
April 13. ....... .......... .....April 17 ..........................April 20..........................
April 28..........................May 1 ......... .... .... .....May 3............................May 11...........................May 19 ......... ..... .... .....Mar 25......... .......... .....
June 10. .................. .... .
July 5............................
July 22...........................
Gage height.
Ft et. 4.40
4 304.604 50
4.304.204.204.104.20
4.204.004.004 no4.404.003 92
4.1G4.244.314.324 30
4 39
rch>
Se
a Measured by Bun-age and Leahy. '< Measured by W. B. Clapp. ('Measured by W. F. Ma
SOUTHERN PACIFIC OCEAN DRAINAGE.
GENERAL FEATURES.
The Southern Pacific Ocean drainage includes those streams soi of San Francisco Bay whose waters, in times of flood at least, re* the Pacific Ocean.
SAN DIEGO BAY DRAINAGE BASIN.
DESCRIPTION OF BASIN.
The principal streams tributary to San Diego Bay are Tia Jua Sweetwater, and San Diego rivers.
The Tia Juana is not measured at any regular station, but stati< are maintained on Cottonwood Creek, which discharges into it* ab' 30 miles east of San Diego city, and on Pine Creek, a branch of C tonwood, and stations are also maintained on Sweetwater and £ Diego rivers.
Measurements in this basin are made for us*3 in connection w the construction of reservoirs for irrigation purposes.
COTTOXWOOD CREEK NEAR JAMUL, CAL.
Cottonwood Creek rises on the west side of the San Jacinto Moi tains, in the southwestern part of San Diego County, at an elevat of about 5,000 feet, and flows in a southwesterly direction, discharg.

SAN DIEGO BAY DRAINAGP: BASTN. 63
into the Tia Juana River just above the California-Mexico boundary line and about 30 miles east of San Diego city. Its drainage basin is rough and broken, with numerous hills and gorges and only a few small valleys. A scrubby timber growth throughout the basin con sists mainl}7 of oak, with some sycamore and cottonwood. The annual precipitation varies from 10 to 30 inches and is mainly in the form of rain. The light snowfall on the higher parts of the area melts rap idly, increasing the torrential nature of the run-off. There are several dam sites in this basin, at least two of which have b0,en utilized. The rock formation through which the creek flows is a loose granite with a good soil covering.
The station was established December 14, 1905. It is located at the Barrett dam site, about 8 miles north of the California-Mexico boundary line, and is reached by driving from San Diego to Jamul ranch house, about 20 miles east of Sail Diego, then drving to the dam site, about 15 miles farther east, making the total distance from San Diego about 35 miles.
The measuring section was first located on the broad crest of the concrete foundation wall of the original Barrett dam, but some time in the late summer the gage was removed on account of constructive operations in connection with the new dam. Above thi^ section the channel had filled in so that the sand was level with the crest of the wall, while on the L-wer side the water had a free fall of 30 feet. Ver tical timber walls had been built up at each ei.cl of the dam, so that the width of the channel at all stages was 70 feet. The grade above the section was heavy, so that very high velocities prevailed in flood stages. A new section has been selected a few hundred feet above the old one, at the foundation of the new dam. At low stages the flow is restricted to a rectangular wooden flume tlirough the founda tion wall, but at higher stages the flow is over the entire length of the foundation wall.
Discharge measurements are usually made by wading, except in high stages, when only float measurements can be made, owing to the torrential nature of the stream. In low stages a section suitable for wading is always used. There is 110 cable and car equipment at this station.
The old gage was a 2 by 4 inch pine scantling, graduated to feet and tenths with black stripes and staples and attached in a vertical posi tion to the timber wall 011 the left bank. The new gage is in two sections, a low-water gage attached to the foundation wall near the wooden flume and a high-water gage fastened to bowlders on the left bank. During 1906 the gage was read twice a day by Joe Hooker. No permanent bench mark for reference has yet been established.

64 SUEFACE WATER SUPPLY, 1906.
Discharge measurements of Cottnntrood Creek near Jamul, Cal., in 1905-6.
Date.
1905.
1906.
April 19. .......
Hydrographer. Width.
Feet.
C. H. Lee..... ..... '5
W. V. Hardy. ................................. 6
.....do. .............................. ... .. . 22
.....do......................................... 70
.....do......................................... 70
.....do......................................... 70
.....do......................................... 20
.....do.......... ................. ........ . 70
.....do......................................... 70
.....do.. ........................... ...... 70
.....do......................................... 70
.....do......................................... 70
.....do.......................... .... ........ 70W. V. Hardy. ................................. 70.....do. ............................ ......... 70C. IT. Lee.................................... .' 30W. F. M;irtiii.. ......... ..... 2.8W. V. Hardv....... ......................... . 0
.....do. ........................................ 0
Area of section.
Sq. ft. 0.51.6
O f)
6.712.520
290
8.77.7
711545741
455775737°79.9
5.46
Gage height.
Feet.
0.210.300.400.500.550.050.230.121.212.200.820.58
6.501.100.810.590.400.28
60.90J'2.00
eh
S(
a Measured hy floats. '' New gage.
Monthly discharge of C'ottonvood Crn'k near Jamul, Cal., for 1906.
Month.
April.. ..................................................Mav. ................................................. ..
Discharge in second-feet.
Maximum. Minimum.
59 100
5,800 350
93 55
51 4.8 7.1
33 375
5,800
2.0 7.0 5.0
93 20 20 2.0 .9
g7. 6
30
Mean.
15.524.1
594 176 54.9 30.5 12.0 0.0 1.3 3.0
20.4 80. S
.8 84. 9
Tot acre
NOTE. Discharges were obtained l>y the indirect method for shifting channels. Values are it
PINE VALLEY CREEK NEAR JAMUL, CAL.
Pine Valley Creek flows in a southerly direction and enters Cot wood Creek about 1 mile north of Barrett's drm. Its drainage is about half of the total drainage area of Cottonwood Creek a" Barrett's dam. The gaging station is located a few hundred feet a" the confluence of the two creeks and was established in. January, 1 It is reached in connection with the Cottonwood station by dri from San Diego.
The channel at the station is composed of shifting sand, ar straight for about 200 feet above and 250 feet below the poir measurement. The right bank is high and rocky and not subje^ overflow, while the left bank is liable to overflow in very high sti

SAN DIEdO BAY DRAINAGE BASIN. 65
forming two channels. In. almost all stages measurements can be made by wading, but two wires have been stretched across the channel 50 feet apart for convenience in float measurements. There is no cable and car.
The gage, which during 1906 was read twice a day by Joe Hooker, is a piece of 2 by 6 inch pine painted white and graduated to feet and tenths with staples. It is fastened to a small tree in a vertical posi tion and the graduations run from 3 to 9.9 feet. The initial point for soundings is the top of a bowlder on the right bank marked with a ring of white paint. The top of this bowlder is also taken as a bench mark, with assumed elevation 1,600 feet. The zero of gage is 13.16 feet below, or at elevation 1,586.84.
Discharge measurements of Pine Valley Creek near Jamul, Cal.. in 1906.
Date.
Fcl rim v 3. ...
Ma ch 11. .. ..\n 1 19.... .
Mil S... .....Jui -22. .......
Hydrogrupher. ' Width.
Feet.
'.....do... . "... . . ........................... 14
. do..... . . . ........... . . ........... 41.....do. ... .................................... 8
do .... ........ 42do. .... . . . ........................... 12
.....do......................................... 40do ................... 47
C. 11. Lee...................................... 17W.F.Martin.... ............................. 2.8\V. V. Hardv... .............................. 11
.....do........ ................................ 19
Area of section.
Sq.ft. 1.5 7. 2
12^3 19.4 2.8
13.1 5.4
23 10 4.8 0. 21 4.1 0. 7
Gagp Dis- 1 eight. charge.
Feet.
3.10 3.20 3.45 2.94 3.12 3.00 4.50 4.40 4.20 4.00 4.21 4. 30
Sec. -ft.1.8
14.4 17.6 41
4 20 8.2
57 32 7.7 0.24 6.7
14.6
Daily (jaeje hciyht, in fed, of Pine Valley Crtekntar Jan/ul, Cal., for 1906.
Day.
1........... ...
Q
4 . .
I,7S910...............
11........ .......12. . ....... .
14. ..... ... .15. . . .
HI ....17...............is .......19........... ...20...... .........
21............... >> >
23........... ...24...............25. ...-----.-....
20.}~
28 ........29 ........30 ..............31...............
Jan.
3.003.203.45
3. 253.203.183.103.08
3. 05
3.033.033.03
Feb.
3. 002. 95o 952.952. 9(1
3.243.15
3.093.01
3.113.01
3.094.02
3.603.403.303. 283.20
3. 213.223.193.083.01
2. 909 Q4
2.97
Mar.
3 00
3.003 04
2.982.92
2. 922. 95
2.97
5.004.033.70
4.043.953. 003. 503. 38
3. 313. 353.30
5.204.82
Apr.
4.904.904.754.754. SO
4. 754.804.704. (154. (15
4. HO
4.604. 554.55
4.504.504.504.504.50
4.454.454.504.504.50
4.504 504. Go4.754.65
May.
4. .504.504. 55
4.504. .50
4.404.40
4. 354.40
4.404.40
4.404.354.354.304.30
4.304.404.404.404.40
4.50
4.504.504.40
June.
4.404.35
4.3(14. 30
4.304. .304.304.304.30
4.254.20
4.204.20
4.204.204.204.154.15
4.104.204.154.154.15
4.154.154.204.154.15
July.
4.124.12
4.124.13
4.104.204.201.224.20
4.174.15
4.124.10
4.114.104.104.114.10
4.074.054.004. 004.05
4.05
4.044.034 02
Aug.
4.024.01
4.003. 95
3. 933.803.793.703.05
s.ro
3.483.403.37
3.002.704.404.404.20
4.204.204.204.194.18
4.184.184.164.104.004.00
Sept.
3.953.95
3.953.94
3.944.004.003.983.98
4.004.004.094.084. 12
4.024.053.964.054.03
3.984.023.914.014.03
4.00
3.983.924.00
Oct.
3.944.03
3.983.80
3.553. 003.703.753.80
4.004.004.054.053.95
3.954.004.004.104.05
4.104 104 054 104 05
4 004 104 10-4 104 004 10
Nov.
4.104.054.054.004.10
4.104.104.104.104.10
4.054.104.104.054.10
4.104.104.104.054.05
4.104.104.204.204.20
4.204.204.204.104.15
Dec.
4.154.20
4.204.20
4.254.254.254.254.20
4.254.304.454.454.30
4.304.204.204.304.20
4.204.154.204.204.20
4.204.304.704.604.504.50
8591 IRR 213 07-

66 SUEFACE WATEE SUPPLY, 1906.
Monthly discharge of Pine Valley Creel'near JamuL ('al.,forl90fi.
Mav-. -.--...-.--..-.--.--....--..--..-.--..-.--..-.-----
July............................................... .....
December
Maximum.
41
1,500150
71328.2
32
1.80.5
114
1,500
Minimum.
1
344151.8.(j
0.02
0.0.3
4.2
0.0
ToMean. :lf' r
10.41 9. 4
150S9 (>30.4
... 8
4.0.6
20.1
29.0
NOTE. Discharges were obtained liy the indirect method lor shilling channels. Values are a- mate.
SWEETWATER RIVER ?sEAR DESCANSO, CAL.
Sweetwater River heads on the west slope of San Jacinto M tains in the west-central portion of San Diego County and flows southwesterly direction, discharging into San Diego Bay near Nat City. The highest parts of the basin are found about 2 miles of Cuyamaca, at an elevation of more than 5,000 feet. This 1 consists of a loose granite formation, and the topography is much broken with numerous canyons, mountain peaks, and c valleys. There is a scrubby timber growth on the highlands, sisting mainly of oak brush. The annual precipitation in the 1 varies from 5 to 20 inches near National City, but increases 01 higher elevations up to from 30 to 60 inches near Cuyamaca, v 20 to 30 inches of snowfall occur in some years. The run-off in face flow is heavy in the spring, but during the summer and fal surface flow entirely disappears in the sands of the lower reach
This station was established December 9, 1905. It is locate the Ellis ranch, about 1 mile south of Descpuso post-office, a' reached by stage from Lakeside. This station is at an elevatk 3,300 feet and has a drainage area of only 40 square miles, \* is almost rectangular in outline, being about 10 miles long r and south and 4 miles wide.
The station is equipped with cable and car, but me a sure 11 can alwaj'S be made by wading, except at very high stages. bed of the stream is composed of sand and gravel, with iso bowlders, and is subject to more or less change. Both banks be overflowed at exceptionally high stages. The channel is str. for 150 feet above and 300 feet below the station. A dense gr of willows on each bank has been cleared away for 20 feet a and below the cable. The grade is heavy above the section, so high velocities are encountered at the highest stage, when only velocities can be taken.

SAN DIEGO BAY DRAINAGE BASIN.
The gage consists of a 2 by 6 inch pine timber painted white and graduated to feet and tenths. It is bolted to granite bowlders on the left bank, and is in three sections two for low water and one for high water. The graduations extend from 2.8 to 10.7 feet.
The initial point for soundings is the head of a big rail driven in the base of the oak tree anchorage on the right bank. The bench mark is the highest point on the bowlder to which the lowest low- water gage is fastened, and is 20 feet upstream from station 60 of cable. It is marked 0.0 in white paint and its elevation is assumed to be 3,300 feet. The zero of the gage is 5 feet below the bench mark, or at an elevation of 3,295.0.
During 1906 the gage was read twice a day by C. H. Ellis.
q/ <S
Date.
1905.
1900.
April 6.........April 18........April 20.......
June 19 ........
Hydrographer.
C. S. Lee.. ...................................
W. V. nardy ..................................
.. ..do..... ...................................
....do...................................... ..
.. .do.............................................do.............................................do........................................
.....do..... ......................................do..... .....................................do.........................................
.....do.............................................do..... ...................................
.....do........................................
.....do.............................................do........................................
.....do.........................................
.....do.........................................C. H. Lee... .................................B. 8. Hawlev.. ...............................
W. V. Hardy. ... .......... .................
Width.
J*c^.
36
0.5111040383H3«3433313011.74041
3531122.5
012
Area of section.
a?.//.0.91 q
1.74.93.7
413.)30
^2201.?. 012.45.1
3233141310.42.60.8
3.2
Gage height.
JfCf.
3.543.62
3.023.703.084. HO4.504.404.304.204.104.003.903.884.S54.654.27
4.053.603.103.153.203.48
Dis charge.
Src.^f. 0.41.12.5
0.34.8
11591!
5140322010.781743733244.31.11.14.4
» Weir measurement.
I*»y.
I'.Xj.'i.l. ..........
3. ..........4... .... ...
0. ..........
Nov. Dec. i
3.69
3.01
3. GO 3.583.58
Day.
S.........9
11.........
13.........
Xnv. 1)('C.
3.583.58
3.08
3. lio
I)«y.
16.........17.........
19....... .
21 ......... TK)
Nov.
3.53
Due.
3.603.60
3. 66
3.78 3.70
Day.
24.........25.........
*)Q
29.........
Nov.
3.54
3.64
3.713 7A
Dix\
"3.02
3.653.H9
a Estimated.

68 SURFACE WATER SUPPLY, 1906.
Daily ijtiije heli/Iit, hi fict, of Streetinitrr Hirer near Dexraumt, CaL, for 190.~>-/! Coi
Day.
1900. 1....... .......2...... ........is...............4. .............5. . ... ....
r....... .........7...............8...............9...............10...............
11.. ........ ....12...............13...............14...............15...............
10, ..............17...............18...............Hi..............20......... .....
21...............22...............23............... ^4
25...............
2(\.... ...........27...............28...............29...............3031...............
Jan.
3. 7 3. 05
3' 7 3. 05
3. 05 3.0 3.0 3. 0 3.0
3. 0 3. fi 3. 05 3. 75 3.7
3.7 3.05 3.05 4. 05 4. 15
3.0 3. 85 3.8 3. 75 3. 75
3. " 3. -
:i l
3. -
3.7
I-Vb.
3.05 3. 05 3. 053.7 3. 85
3. 95 3. 9 3.8 3.8 3. 8.5
3. 95 3.9 3.9 3. 9 4. 45
4.2 4.1 3. 95 3.93. S5
3. 95 4.0 3. 95 3.9 3. 85
3. 85 3. 85 3. 95
Mar.
4.03. 95 3.9 4.03. 95
3. 93. 85 3. 85 3. 85 3. 85
3.9 4. 95 5. 05 4.5 4.4
4. (35 5. 05 4. t 5 4.5 4.4
4. 35 4. 45 4. 35 7. 350.8
o.<;5. G 5. 2 4. 85 4.7 4.7
Vpr.
4.X 4.7 4.7 4.0 4.7
4.7 4. 05 4.0 4. fi4.5
4. 45 4.4 4.44. 35 4. 35
4.3 4.3 4. 25 4. 25 4.2
4.2 4. 15 4.1 4.15 4.15
4.1 4.1 4.4 4.4 4. 25
May.
4.2 4. 15 4.1 4.1 4.2
4. 15 4. 15 4.1 4. 25 4.0
4.0 4.1 4.0 4.0 3. 95
3. 9:;. 93. 9 3 9 3.9
3.9 3. 85 3. 9 3.9 3. 9
4.0.5 4.0 4.2 4.03. 95 3.9
.Iliac.
3. '.> 3. 85 3. 85 3. 85 3. 85
3. 85 3.8 3.8 3. 75 3.7
3.7 3.7 3.7
a 3. G5 a 3. 05
fi3.fi 3. G 3. 0 3.0 3 0
3. 55 3. 55 3. 55 3. 55 3.5
3. 55 3. 0 3. 55 3. 5 3. 45
July.
3. 45 3.4 3.4 3.4 3.4
3.4 3.4 3.4 3.4 3.4
3. 3.5 3. 35 3.35 3.4 3.4
3. 35 3. 35 3.3 3. 3 3.3
3.3 3.3 3.3 3.3 3. 35
3. 35 3.3 3. 25 3. 25 3.2 3.2
Aug.
3. 2 3. 2 3.2 3.2 3.2
3.2 3.2 3.2 3.2 3. 15
3. 15 a 3. 15
3. 15 3. 15 3. 15
3. 15 3. 3 3. 0 3. 0 3.5
3.45 3.4 3.43. 45 3. 35
3. 35 3. 35 3. 35 3. 35 3. 35 3.3
Sept.
3. 3 3. 3 3.3 3. 3 3. 3
3.3 3.3 3.3 3.3 3. 25
3. 25 3. 25 3. 25 3.3 3. 05
3. 45 3. 25 3.2 3.15 3. 15
3.15 3.1 3.1 3. 15 3.15
3. 15 3.1 3.1 3. 15 3.2
Oct.
3. 15 3. 15 3. 15 3. 15 3.1
3.1 3.1 3.1 3.1 3.1
3.1 3.1 3.1 3.1 3.1
3.1 3. 15 3. 15 3. 15 3. 15
3. 15 3.15 3.2 3.2 3.2
3.2 3.2 3. 25 3.25 3.2
"3.2
Nov.
" 3. 2 i 3. 2 " 3. 2 " 3. 2
3. 2
3.2 3.2 3.2 3.2 3. 1.5
3. 15 3. 15 3. 15 3.2
n 3. 2
a 3. 15 " 3. 15
3. 15 3.15 3. 15
3. 15 3.4 3.45 3. 35 3.3
3.3 3. 35 3.2 3.2 3.2
a Estimated.
Monthly diwhartjt of ftii-rrtirati r Riirr mar Ihscanso, Cal.. for 1906.
[Drainage area, 40 square miles.]
Month.
March............................April.............................May..............................
July..............................
October..........................
IMschai
Maximum.
4480
1.250 84 30 15
2. 0 4.6 5.8 1.4
12fit;
1,250
ge in second-feet.
Minimum. Mean.
2.0 4.2
17.0 20 13 2. 0 1.2 1.1 1.0 1.0 1.1 4.4
1.0
8.7 22.3
180 48. 5 21. 0 7.0 1.8 l.X 1.5 1.1 3.0
10.1
25.0
Total in acre-fret.
»,1,240
11.100 2.890 1.330
418 112 10S 90 (38
177 121
18,200
Run-
Sec.-ft. per sq. mile.
0.217 . 558
4. 50 1.21
. ,540
.170
.040
.044
.038
.028
.074
. 252
,fl.
Derme
.040
NOTE. Discharges were obtained from several rating tables covering short periods of time. V are fair.
SAX DIEGO RIVER XEAR LAKESIDE, CAL.
San Diego River has its headwaters on the west side of San Jaci Mountains-in the western portion of San Diego County, and flow a southwesterly direction, discharging into tie Pacific Ocean ^ north of San Diego city. This drainage basin lies just north of Sweetwater drainage basin and south of the Santa Ysabel ba

SAN DIEG-O BAY DRAINAGE BASIN. by
The extreme headwaters reach almost to the Santa Ysabel Indian Reservation on the north, and include the Cuyamaca reservoir. The topography of the basin is very rough, o\ving to numerous narrow canyons with small streams and mountain peaks, some of which have an elevation of 6,000 feet. The discharge is heavy in the spring and is of a torrential nature, but during the summer and fall there is no surface flow in the lower portion of the basin, the water disappearing in the sands 30 or 40 miles above San Diego city. The annual pre cipitation ranges from 10 to 20 inches near San Diego and from 20 to 30 or even 50 inches in the mountains, where some of it appears as snow. The formation is a loose, granite and there is orly a scrubby timber growth.
This station was established in December, 1905. It is located about 1 mile northwest of the Lakeside hotel and about three-fourths mile above the railroad station, on the road from Lakeside to Padre Barona Valley. It is 23 miles northeast of San Diego and is reached by the San Diego, Cuyamaca and Eastern Railway.
This station has a cable and car equipment, but, except in high stages, discharge measurements can always be made by wading. The bed of the stream is composed of a fine, shifting sand which supports no vegetation, and the channel is continually changing from side to side in low water. The left bank is high and rocky above the station and not liable to overflow, except below the measuring section. The right bank is composed of old river deposit and is subject to overflow above and below the station in very high stages. Th Q channel is straight for 200 feet above and 250 feet below the station. The willow growth on right bank has been cleared away 20 feet above and below the cable. In low stages the quantity of water flowing on the surface depends on the saturation of the sand, and measurements will appear inconsistent, owing to the filling and scouring.
The gage consists of a 2 by 6 inch pine timber painted white and graduated to feet and tenths. It is on the left bank r,nd is in two sections, a low and high water section, each bolted to granite bowlders.
The graduations extend from 2 to 7.8 feet.The initial point for soundings is the head of a largia nail on the
left bank driven into a soft granite rock and painted yellow. 0. 0 in yellow paint is placed on the rock. A reference bench mark has been established on the top of the flat bowlder lying between the sycamore tree supporting the cable on the left bank and the bowlder used for an anchor. It is 8 feet downstream from station 20 of cable and is surrounded by a ring of white paint and has the assumed eleva tion of 400 feet marked on it. The zero of the gage is 7.77 feet below the bench mark, or at an elevation of 392.23 feet.
During 1906 the gage was read once a day by J. H. Lucas.

70 SURFACE WATER SUPPLY, 1006.
Discharge measurements of San Diego River near Lakeside, Cal., in 1906.
Date.
1900.
April 7. ........
April 21 ... ...
April 30. . . .
Hydrographor.
AV. V. Hard v .......................................do......... ...................................do......... ..................................do..............................................do..............................................do..............................................do..............................................do........................................... ..do......... ......................... .......do.. ............................ .. .....do...................................
.....do.................................'... ......do.......... ............................... ..do.........................................
.....do...... ...................................
.....do.............................................do.............................................do.......... .................................do.................. .........................do......... . .............................do........... .........................C. H. Lee.... . . .......................
W. V. Hardv -...--... ............... ......
Widtl ,
Feel.
25.e
5f5554
5?
5f
1C
Area of section.
Sq.Jl. 0.7
1.22425423930
123
liO
39
4(i
30
Gage height.
Feet.2.073.042.903.203. 283.543.503.403.104.504. SO4.103.904.504. 254. 154.074. 253.923.80
3.45
3.30
U=cha
,SVc
a Estimated, water too shallow to measure.
Daily gage height, in feet, of San Diego River near Lakeside, Hal., for 1905-6.
1-. ...................2. .................... 3.....................4.....................
<;.
$.. ...... -9.......... . ... .
10............... .....
11.....................12.....................13.... .................14.....................15. ....................
1(1... ..................17.....................IS......... ............19..... ................ 20.....................
21.....................')')23.....................24..................... 2.3.....................
20............... ..... 27..................... 28.....................29 ... 30..................... 31.....................
1905.
Dec.
2.609 CO
2.602.60 2.602. (iO2.02
2.022 032. 032. 03 2.03
2. 032. 032.042. 04 2.00
2. 602.002.052.65 2.G5
2.05 2. 07 2.67 2.07 2. 60
Jan.
2. 66 2.60 2. 662. 67 2. 68
2.682. 68 2. 682.68 2.07
2. 602.652.052. 00 2. 06
2. 672.672. 072.74 3 91
3.403.353.683.07 3.00
2. 90 2.92 2.92 2.92 2.91 2.90
Feb.
2.90 2.91 2.912.91
2.983.02 3.123.02 3.12
3.153.183.183.20 3.28
4.003.043.483.41 3.28
3.263.543.483.38 3.24
3.22 3.18 3.18
Mar.
3.323. 20 3.203.203 9ft
3.183.12 3.113.10 3.08
3.083.204.504.10 3. 96
4.054.654.364.25 3 94
3.883.843.905.58 7.00
6.88 5.80 5.42 5.14 4.Q6 4.99
Apr.
4.94.75 4.654.64 E
4.54.54.554.45 4.4
4.354.354.254.2 4.2
4.24.24.24.15 4.1
4.154.14.14.05 4.05
4.0 4.0 4.05 4.2 4.25
19
May.
4.2 4.15 4.03.953 Q
3.953.9
3.85 3.8
3.85
3.93.85 3.8
3.83.8
3.8 3.75
3.753.753.753.75 3.75
3.75 3.85 3.75 3.95 3.85 3.8
00.
June.
3.8 3.75
3.75 3 7
3.73.7
3. 05
3.00 ft
3.03.0 3.55
3.553.5
3.5 3.5
3.53.53.53.5 3.45
3.45 3.45 3.5 3.5 3.5
July.
3.45 3.45
3.45 3 45
3.453.43 A
3.43 A
3.43 A
3.43.4 3.4
3.43.4
3.43 A
3.4
3.43.4 3.4
3.4 3.4 3.4 3.43.4 ' 3.4
Aug.
3.4 3.43 4.
3.43 4
3.43.43 A
3.43 4
3.43 4
3.43.4 3.4
3.4
0 A
3.43 4
3.43 4 ? 4
3.43 4
3.35 3. 35 3. 35 3.35 3.35
£ept.
3. 35 3.35o or
3.353 0
3.33.33 0
.......
.......
NOTE. The river was dry September 9 to December 3, 1900.

BERNARDO RIVER DRAINAGE BASIN.
Monthly discharge of San I)icgo Rivir near Lakeside, Cal.,for 1906.
[Drainage area. 208 square miles.]
71
Month.
Fel ruarv. ..... ..... ....Mi! Cll ....Ap il... ...................Ma ........................
Julv... --...-.-.-.-.----...
October. .....
December .....
Dischai
Maximum.
... .. 252
...... ',800
...... 890
.. ... 17051
... .S...... .3...... 0. ... 0...... 152
. . . 3,800
ge in second-feet.
Minimum.
0.0 1.4
15 105 39 2.8 .8 .4 0 0 0 0
0
Mean.
10 7 43. 0
083 277
05 7 15 1
1 2 (' 1 0 0
11.0
92. 8
Total in acre-feet.
1,030 2,420
42,000 10, 500 4,040
898 74 37
0 0 0
070
t.7,700
Run-off.
Sec.-ft. per sq. mile.
.080
.210 . 3.28
1.33 . 310 . 073 .0058 .0029 . 00048 .00 .00 .053
Depth in inches.
.09
. 22 3^78 ].4K
. 30
.08
.007
.003
. 0005
.00
.00
. 00
. 44r> 0. 08
NOTE. Discharges were obtained by the indirect method for shifting channels. Values are fair.
BEKNARDO RIVER DRAIXACiE BASIN.
DESCRIPTION OF BASIN.
Bernardo River, or Santa Ysabel Creek, as it is known at its source, rises in the Volcan Range, on of the western ranges of San Jacinto Mountains, in the western part of San Diego County, at an elevation of 5,600 feet, and flows in a westerly direction through the San Pas- qual Valley, below which it takes its true name and empties into the Pacific Ocean just north of the mouth of San Diego River. The upper part of this basin is on a loose granite formation and has a very rough topography, being cut up by numerous ravines in which small moun tain streams flow continuously throughout the year. Below the mouth of the canyon, however, the surface flow of the Bernardo dis appears in the sands of the San Pasqual Valley during the summer and fall.
The annual precipitation varies from 10 to 20 inches near San Diego, and from 20 to 30 or even 50 inches in the mountains, where some of it appears as snow. The heaviest discharge occurs in the spring, and is torrential in its nature. The drainage ar^a above the mouth of the canycn where the gaging station is located is 128 square miles.
Measurements in this basin are useful for irrigation purposes.
SANTA YSABEL CREEK NEAR ESCONDIDO, CAL.
This station was established in December, 1905. It is located at the mouth of the canyon and at the head of the San Paeiual Valley, about 13 miles east of the town of Escondido. It is reached by driv ing up through the San Pasqual Valley from Escondido to Pott's ranch, the station being directly east of and only a few hundred feet from the ranch house.

72 SURFACE WATER SUPPLY, 190G.
This station is equipped with a cable and car, but it is only dur very high water that they need to be brought into use, as measi ments can be made by wading, except in flood. The bed is compo of fine sand and is constantly changing. The channel is straight 150 feet above and 100 feet below the cable, and both banks are h and rocky and not liable to overflow at any stage. The grad heavy above the section, so that high velocities are encounterei flood stages, and in extremely high water only float velocities car taken.
The gage is a 2 by 4 inch timber painted white and graduated i feet and tenths. It is in one section and is bolted in an inclined p tion to a large granite bowlder on the left bank. It is located feet downstream from station 175 of the cable, and the graduati extend from 2 to 8 feet.
The initial point for soundings is the head of the eyebolt sulphu into the large granite bowlder on the right bank. A reference be mark has been established on the 'highest point of the bowlder which the gage is bolted, 11 feet downstream from station 18C cable. A circle of white paint indicates the point, and the assui elevation of 500 feet is marked on the bowlder. The zero of the £ is 11.66 feet below the bench mark, or at an elevation of 4SS.34 f
During 1906 the gage was read once a day by S. F. Potts.
Discharge measurements of Santa Ysabel River near Escondidn, C'aL, in 1^05-6.
Date.
1905.
November '^<S
1906.
March 27 .......
March 28.......April 14........
May 1°
Oecernoer 7
Hydrographpr. Width.
Frit.
C. II. Lee...... ..................... .........' 83.do..... . .... 24
W.V. Hardy... ............. ................. 8. ..do. ....... .................... .......... 27
.....do......... ............................. . 38
.....do......................................... 37. ..do. ....... ................ ........... (H
..... do ......................................... 72
.....do......................................... 0'3do..... . (ill.do........ . .............. ............ 119
.....do...... .................................. 108...do........ ................................ 108
.....do......................................... 95
.....do......................................... 91
.....do........ ................................ 91
.....do......................................... S3....do............................ ............' .r>8
.....do......................................... 52.. do ......... .............................. 77
.....do.................................. ...... 105C. 11. Lee...................................... :?'»11. S. Hawlev.. ................ .......... 10\\. F. Martin.................................. ........W. V. Hardv. ............................... . Hi.....do......................................... 15
Aren of Gage D section. height. cha
Sq.ft. Fie!. Sc<
24 3. 727. 2 3. 55
2. 5 3. y(i8. 4 3. 55
12. H 3. 5714. (i ' 3. (1421 3. 7017. 4 3. 7045 3. 754S 3. 52
r.54 4.00 5,401 2. 05 3.3(12 2.00 2,
177 O.S5IS' 1 0. 70143 0. ,iO4li 1.003S 1. 4551 1. S232 '_. 1 s14 1. 352. S L. 45
...... 1. 4(i(i. 4 L. 54(1 L. 047 2.70
i Stream (lowing in several channels.

SAN LFIS RKY KIVEK DRAINAGE EARIN. 78
</ai/i luifjlit, ;»/«/, nf Sir-i/a Yxubtl Ci/<l' mar Ewo ndiiJa, ('a]., for 1905-6.
1'iOI,.
1 .. . .
i. . . .
-
s. .....'»..... .
10. ....
11....... 1 '......l.i. ...15......
Hi. .... 17..... is.....111. ..... 20. ......
21.......22.......23.......24..... .25.......
27.......Jv. . ....2 1 ....... 10..... .11.. .....
Pee.
3 ."it,"
3.473. 47 3.4s
3.543.523. 50 3. 4,S 3. 4'.)
3.4S 3. 47 .!. is3.51 3.523. 55
Jan.
.;. 55
.i..J
.i.45
3.1,3.55 3. 55 3. 5 3. 55
3.55 3.»> 3.1,
3.I 1,
3. 5 3. 5;:.i.3. S5 3. 75
3.C,3.53.53. 55 3.5
3.5 3. 55 3.5.", 3. 55 3.55A 55
Feb.
3.5:i.:>3 5 3. 5 3. 5
3. (,53.1,, 3.55 3.1, 3. 5
3.i,r,H.(> 3.(>
:;.9
3.9 3. 75 3.7 3.7 3.7
3.1,5 3.7 3.73.t,5 3.1,5
3. <i.-> 3.1,5
Mar.
3.7 3..;.r. 3.05 3.7 3.7
3.115 3.05 3.7 3.05 3.7
3.7 4.2 4. 53. 75 3.7
3.X 4 25 3.11 3.1,5 3.0
3 55 3. 0 3. 5i',. 3 3.5
LSI(I.'.I ll.ti O.S
Apr.
0.7 U.'l 0.7 0.7 0. 75
0.55 0.4 0.45 0.7 0.7
0.7 (l.il 0 '1
.0
.0
.05
. !5 « . 15 « .15 " . 15
n .2 2 '.:\
.4
.15
.4
.5
.(,
. 7
May.
1 . S5 1 . S5 1..S I..S 1.9
1 . 95 1 . 95 1.95 2.0 2.0
2.0 2.2 2.2 2. 15 2. 1
2.2 2.2 2 2 2.2 2. 15
2. 2 2. 25 :2. 252.3 2.3
2. 45 2. 35 2. 25 2. 3 " 4
June.
2.4 2.4 2.4 2.35 2. 35
2.35 2.35 2.3 2.3 2.35
2.3 2.3 2.3 2.3 2.35
2.:-! 2.3 2.25 2.3 2.3
2. 3 2. 25 2.2 2.3 2.4
2 3 2. 35 2.4 2.35 ' .3
".4 .......
July.
2.4 2.4 2. 35 2.4 2. 35
2.4 2.4 2.4 2. 35 2.4
2. 35 2. 35 2.4 2.4 2.4
2.4 2.4 2.4 2.4 2.4
2.4 2.4 2.4 2.4 2.45
2 45 2.4 2.4 2.4 2.4 2.4
Aug.
2.4 2. 45 2.4
(2.4) 2. 35
2.4 2.4 2.4 2.4 2.45
2.4 2.4 2.4 2.4 2. 45
2. 45 2. 45 2.5 2.55 2. 45
2. 45 2.4 2.4 2. 45
(2.4)
2.4 2.4 2. 45 2.4 2.4 2. 45
Sept. Oct.
2. 45 2. 45 2. 45 2. 45 2. 45 2. 45 2. 4 2. 4.3 2. 45 2. 4
2. 45 2. 4 2. 5 2. 45 2. 4 2. 45 2. 45 2. 45 2. 45 2. 4
2. 5 2. 4 2. 5 2. 4 2. 5 2. 4 2. 5 2. 4 2.5 2.4
2.5 2.45 2.5 2.45 2.5 2.5 2.45 2.5 2. 4 2. 5
2. 4 2. 5 (2.4) 2.5 2.45 2,5 2. 45 2. 5 2. 5 2. 5
2.5 2.5 2..1 2.5 2.5 2.5 2. 5 2. 5 2. 45 2. 5
....... 2.5
Xov.
2. 5 2.5 2.5 2.5
2.5 2.5 2.4 2. 5 2. 45
2. 45 2. 45 2.5
« 2. 5 2. 55
2.5 2. 5 2. 5 2.5 2.5
2.55 2.55 2.(, 2.5 2. 55
2.0 2.55 2.552. 55 2. 55
Dec.
2. 55 2. 0 2. (i 2. (i 2. 115
2. (i 2. ti5 2.7 2.7 2.7
2.7 3.0 2.7 2.7 2.7
2.7 2.7 2.7 2.7 2. 7
2.7 2.7 2. 75 2.7 2.7
2.S 2.S 2. 75 2.7 2. 752. xr,
Kslimate'l.
<iisri!fir(/< <>/'Stith'a Yxahd Cn<k near Excondxlo, f \iL.for 1906.
;imi, 12s square miles.]
Mnnlli.
Mn rdi.............. ... ..... ...April..... .....................May................ ......... ...
July.....-------.................
September...... ....... . .........October.......... ...............November. .......................
Dischar
il;t\mium.
S3 95
\000 400
90 35 :,0
t, 4 7
15 21
.S.OOO
L'e ill seroinl-feet.
Minimum.
2,s
2'l 102 35 23
5 4 3 3 f,
11
2
Mean.
11.4 30. 5
(133 221
(V.I. 7 2S.4 12.4 4.2 3.1 4.7 9.11
12.4
Mi. 7
Total in acre-feet.
701 I,(i90
38,900 13, 200 4,2!IO 1 , (>90
702 25S 1S4 2S9 571 7ti2
(',3,300
"Run-
S-Vi-.-ft.por sq. mile.
O.Os'9 . 23.H
4.94 1.73
. 545
.222
.097
. 033
.024
.037
.075
.097
.1,77
off.
Depth in inches.
0.10 .25
5.70 1 . 93 .li.3 . 25 .11 .04 . 03 .04 .OS .11
9.27
XOTE. -Disr-hiirsres v\ ere <, ilaim- 1 i>y (lie iiudrcc t method for shifting channels. Values are approxi mate.
SA^ I.IIS JJKV RTVT-GIl DKA1XAGF, BASIN.
DESCHIPTIOX OF BASIN.
San Luis Key River rises on the western slope of the Coast Range in the northern portion of San Diego County, and flows in a westerly direction, discharging its waters into the Pacific Ocean near the town

74 SURFACE WATER SUPPLY, 1906.
of Oceanside. It has numerous small tributaries, none of which ha their sources at elevations above 5,000 feet. On the upper reaches this stream the country is rolling, with several small valleys which t under cultivation, being used principally for the raising of grain a the pasturage of stock. At a point below what is known as the W ner's ranch reservoir site the river flows through a deep, narrow a yoiiwith a heavy grade for a distance of about 10 miles. Below t point the grade is light, and the discharge is over a sandy and grave bed, where the water soon disappears, again rising in small quantit near the town of Pala, where the gaging station is located. Bel the station it flows f;>r a distance of about 25 miles on a light grr to the Pacific Ocean. There is a good soil covering throughout t basin, with a considerable growth of brush and grass, and with sin areas of timber on the extreme higher elevations. The water diverted at several points for irrigation, a considerable quantity be taken from the canyon above the gaging station and used ia vicinity of Escondido, which lies in an entirely separate draim basin. This stream is torrential in its character, the discharge be very light except during the winter season, in times of heavy rainf The mean precipitation varies from 10 to 20 inches and falls prir pally in the form of rain, there being only a light fall of snow on extreme higher elevations, which soon melts and only adds to the flr discharge.
SAN LULS KEY RIVER NEAR PALA, CAL.
This station was established October 9, 1903. It is located at Si ler's mill, 4 miles above Pala, Cal. It is reached by driving from F> brook or Temecula, stations on the Southern California Railway, and 13 miles distant, respectively. The conditions at this stat and the bench marks are described in Water-Supply Paper No. 1 page 91, where are given also references to publications that cont data for previous years. The datum of the gr.ge was lowered 4 feet November 13, 1906.

BAN LFIS REY EIVER DRAINA(IE BASIN 75
Discharge measurements of San Luis Rey River near 1'ala, C'al., in 1906.
Date.
February 9. ....
March 4........March 4........March 5 ........March 6........March 7........March JO.......March 17.......March 17.......March 17.......March IX.......March 19.......March 20.......March 21.......April 12........April 26........May 14.........
October 10.....November 13...
Ilydrographer. Width.
Fret. W. V. Harclv. ................................. 10
.....do.. ....................................... 12
.....do.. ....................................... 12
.....do.. ....................................... 19
.....do..--.-.-.-.-.------.-..--.-.-............ 1 22
.....do......................................... 22
.....do......................................... 20
.....do......................................... 20
.....do......................................... 72
.....do......................................... S9-....do....:.-.---.---.-.........-..........-... 79
.....do......................................... 72
.....do......................................... 07
.....<!(,. ........................................ 52
.....do. ........................................ 52
.....do...... .................................. 4XC'. IT. l.ee. ..-------------.-.---.------... ... . 33R. S. Hawley . . ................................ 11\v. F. Martin. ................................. 15W . V . Hardy .................................. 8
..... do...... ................... ................. 57
Are<i of section.
8q.fl.
8.3.-)..r)8.0
141618.S14.12.4
1102S7191150113ior,7304,S43758153.82.83.2 9.0
102
Gage height.
Feet. 0. d()0. IS0.130. Of.1.021.101.201 000 933.705. 304.704. 303. SO2. 702.50 2. 402. 201./32I. IX0.010.30
«5.27 "5.55"7.15
Dis charge.
Hrc.-tt.
14.710.417.93*434x3832
447],:.40
9S4XII5323(1723X1^2307119Hlf,285.93.03.5
13322
' T5y i ' gage.
Daily gage Juight. in feet, of San Luis Key Rirer near J'aJa, ('al., for 19()(L
Day.
2...............3...............4...............5 ...............
S. ..............9...............10.. .............
11...............12...............13...............14...............15...............
10...............17...... .........18...............19...............20.--..-.........
21...............22...............23. ..............24...............2.3...............
20............... 27...............28...............29...............30...............31...............
Jan.
0 75.7.7.7.7
.7 .7
.7
. 05
. 05
.0
.0
.7
.7
. 05
. 051.02.6
1.2.9.6.3.3
. 25
.2
. 18
.15
.15
.15
Feb.
0.1.1.9.9.15
.2
.3
.3
.25
.2
.05
.4
.8
2. (55.85.9.5.85.73
.951.095.9
.0
.0
.9
Mar.
O.X.X.8
1.01.2
1.0.95.7.0. 05
. 05.-,. o0. 55X. 552.3
2. 854.83. 052.952.5
2.42.52. 510.07.0
7. 25 4.04.44.13. 354.0
Apr.
3.352.92. 552.52. 75
3 03.03 052.02.0
2.452.22. 152.152. 15
2.052.051.951.951.85
1.81. 731.751.05l.C
1.5 1.451.71.71.0
May.
1.01.51.41.41.5
1.451.41.31.31.3
1.251.551.41.21.15
1.11.051.01.0.95
1.0.9.9.9.9
1.25 1.51.71.51.31.25
.Tune.
1.11.11.11.11.1
1.051.01.0.9. 85
.S
.7
.7
. 05
.0
.08 ri.8.7.6
.6
.65
.6
. 55
.5
.5
.5
.5
.5
.5
July. Aug.
0.5 0.5. 5 . 5. 5 . 5. 5 . 5.5 .5
.5 .5
. 5 . 25
.5 .3
. 5 . 25
. 5 . 25
. 5 . 3
.5 .25
.5 .2
.5 .2
.5 .2
.5 .2
.5 .2
.5 .8.7
.5 .0
.5 .3
. 5 . 25
. 5 25
.5 .2
.5 .2
.5 .2
.5 .2
.5 .2
.5 .2
.5 .2
Sept.
o,.2.2.2.2
.2
.2
.2
.2
.2
.2
.2
.2
.2
.5
. 35
2.2.2
.2
.2
.2
.2
.2
.2
.2
.2
Oct.
0.2.2.2.2.2
.2
.2
.2
.2
.2
.2
.2
.2
.2
.2
Nov.
5.255. 255. 25
5. 255. 255. 255. 255. 25
5. 255.55 055.05. 6
5.0 5.75. 05. 05.6
Dec.
5. 05.05. 555.555 55
5. 55. 55. 55. 45
5.4
7.2
5. 8
5.85.75. 655.65 55
5. 555. 55. 55. 455.4
5.8 0. 60.76.80.60.7
NOTE.--Gage heights after November 13 are by the new gage, the datum of which is 4.1.0 feet below that of the old gage.

SURFACE WATER SUPPLY, 1906.
Monthly rfiscJiqrc/f of Ran Luis Rcy River near Palafor 1906.
[Drainage aroa, 31X square miles.]
Month.
1.. ...........................
list...........................
Discharge in second-feet.
Maximum. Minimum. Mean.
232 9 241 10
13,000 17 (120 114 200 100 12S 19 19 19 43 3 19 3 3 3
2X 3 550 9
13,000 , 3
21.4 2S. 0
1,120 301 158 05. (i 19.0 10.3 3.7 3.0 S.3
79. 3
152
Total in acre-feet.
1,320 1 , 590
08,900 17,900 9,720 3,900 1,170
(133 220 IS4 494
4, SSO
111,000
Rim-
Sec .-ft. per sq. mile.
0. 007 .o:»
3.52.947 .497 .206 .000 . 032 .012 . 0094 .020 . 249
. 470
off.
Dei inc
ift'ns channels. -Values are f
SAXTA MATCGAKITA IIIVFJ1 DRAINAGE BASLNT.
DESCRIPTION OF BASIN.
Temecula Creek, as Santa Margarita River if known at its be iiing, rises on the western slope of the San Jacinto Mountains in northwestern part of San Diego County just north of the San Rey drainage basin, flows north into Riverside County, then \ about 15 miles to Temecula, where it flows southwest thro Temecula Canyon into San Diego County and empties into the Pa Ocean as Santa Margarita River. The highest elevation in the b is about 5,500 feet on the divide between Temecula and San Rey. Temecula Creek has few tributaries, and the topograph rather broken, though there are several small valleys in the u] reaches. The rock formation through which it flows is a loose gra with good soil covering, and there is considerable growth of sn scrubby timber. The annual precipitation varies from 10 to inches and occurs almost entirely as rain. The discharge is q heavy in the spring during the flood season, but is small during rest of the year.
Measurements are useful in connection with irrigation.
TEMECULA CREEK NEAR TEMECULA, CAL.
This station was established December 30, 1905. It is loc* about H miles south of the town of Temecula at the bridge on road from Temecula to Pala and Falbrook. It is reached by dri from Temecula.
The channel is straight for 500 feet above and 100 feet below, bed is shifting sand and the channel is continually changing, b

SANTA MARGARITA RIVER DRAINAGE BASIN. (1
usually in two channels at low water. Neither bank is liable to overflow at any stage.
During low water, discharge measurements are made by wading below the bridge. High-water measurements are made from the downstream side of the bridge.
The gage, which during 1906 was read once a day by Hugh McCon- ville, ia a 2 by 6 inch timber fastened to the downstream pier near est to the right bank by two pieces of strap iron. It is in one vertical section, painted white, and graduated into feet and tenths. The graduations run from 0.0 to 10 feet. Marks 10 feet apart are put on the bridge rail in yellow paint for use in soundings. The bench mark is a nail in the base of a, willow tree on the right bank cf the river below the bridge; elevation, 8.13 feet above the zero of the gage.
Date.
19(K.
%)(*cemtjpr ^Q
10W.
March 18 .......
June 26. ........
December 29 ...
Hydrographi r. Width.
JVW. W.H.Clapp. ..................... .. ........ 11\V. V. Rardv ................................. 9
W. V. Hardy ............................. ... S.....do....... ................................. S
.....do......... . ............................ H,.n...do..... ....... ....... . ................. 1?
....do..... ... ... . . ... ................. 1"......do..... ..... ..... ... ..... ....... . %.....do................... ... ......... ....... 27
.....do......................................... 15C. H. Lee.. ..... . ... .... .......... ..... 11R. S. Bawlev.. . . ..... ........ ............ a
W. V. Hardv . . ...... ................... 14. .I
.....do..................... . ........... .... 12
Area of section.
,9@. /?. 5.43. .3
4.1)4.1
in. n9.3
1S.O11.9l(i. 04.1.yo3.1n.sr; -
4.4IU)
Gage Dis- heiglit. charge.
JYcf. gfc.^/?. 3. 10 .1. S2.9S 4.0
.'JO 4.4i#4 4 9
. 09 4. 4
.20 3. a
.19 ti.O. 42 .k 4.32 Ki.S. (<9 12. II.S4 12.1.S2 j.U. 8S fi. 4.SO 2.U..... O.S
..... 3.9.1. SO T. (iH.OO 7.2U.](l 14.9

78 SURFACE WATER SUPPLY, 1906.
Dally (jwjf height, in fat, of Tcmccula Hirer near Temeeula, ( yal.,for 1906.
Pay.
4
r,
7S
12 . ... ..... ......................13....................................14 .. . . .....................15.... ...............................
17.. ...............................
19....................................20.... ....... .......................
21............ ................... ..
23 ............................ ......24...... ..... .......................25................................ ...
2t>
2930.. .................................
Jan.
3 0
:"2. 92.9
2.92.9
'"> g2.9
9 9o 90 93 13.0
3.03.03.03.03.0
3.02.9
2.9
2.9
Feb.
O Q
2.8
0 Q
2 95
3.0
3.03.0
3.253.25
3 25
3. 253.253.25
3.33 4
Mar.
3.45
o r.
3.9
4.94.9
3.7q p-
3.5
3.33 49.6
8.0
6.0
5 95 9
Apr.
5 95.8
5 g
5.8
5.8
5.85.8
5.8
5.8
5.75
5.75
5.75
5.75
5. 755. 755. 75
May.
5.7
5.75
5 75.7
5.85.85r; gc
5.9
5.85
5. 85
5.8
June.
5.85.85.85.85.8
5.85.8c g
5.75
5. 75
_
5.755 755.755.755.75
5.85.8
5.85.8
July. , D
S.S
S.8
S
.8
.8
S.8
.8
NOTE. No gage height record was kept from July 18 to December 2. Discharges have not been< puted oil account of the small number of measurements at times of excessive changes in channel.
SANTA ANA RIVKR DRAINAGE BASIN.
DESCRIPTION OF BASIX.
Santa Ana River has its source in the southern slope of the £ Bernardino Mountains. It traverses the San B Qrnardino Valley i southwesterly direction, breaks in a narrow canyon through Santa Ana Mountains, and finally discharges through the Santa £ Valle}7 into the Pacific Ocean below the town of Santa Ana. Num ous tributaries rise in the southern slope of the San Bernard Mountains, the surface flow of most of which reaches Santa Ana Rn where it traverses San Bernardino Valley only in times of flood c charge. The topography on the higher elevations is rough i rugged, reaching elevations of from 10,000 to 12,000 feet, the forr tion being of granite with good soil covering and considerable grov of timber. On the lower elevations the topography is less rough f the soil covering is principally of brush. A gaging station is loca on this stream at Warm Springs, about 8 miles above Redlar, Below this the river leaves the mountainous country and dischar over a sandy and gravelly bed through the San Bernardino Vail During the summer months the entire flow of the stream is diver above this gaging station and used for power development at

SANTA ANA RIVER DRAINAGE BASIN. 79
mouth of the canyon, below which point it is again taken out and used for irrigation 011 the higher elevations of the San Beriiardino Valley along the base of the mountains, where the country is under a high state of cultivation, principally for the raising of citrus fruits. The water rises to the surface in San Bernardino A'alley near the city of San Bernardino and is diverted and used extensively for irri gation in the neighborhood of Riverside. In addition to this surface flow, a large number of wells have been sunk in this territory, many of which are artesian, while others require pumping. This developed water is also used extensively for irrigation in the vicinity of Sail Bernardino and Riverside. The \vater is again forced to the surface by bed-rock obstructions at Riverside Narrows below the city of Riverside, and gradually increases in volume until it reaches Santa Ana Canyon, where it is diverted for irrigation on the lower valley lands in the vicinity of Santa Alia and Fullerton. During the sum mer months measurements are made of the flow at Rincoii, Cal., at the head of Santa Ana Canyon. There are only occasional flood dis charges of this river which flow continuously from the mountain to the sea. The mean precipitation throughout this basin is from 15 to 30 inches, which falls in the form of rain except on the higher ele vations of the San Bernardino Mountains, where there is a consider able snowfall, usually remaining on the extreme high elevations until midsummer. A storage reservoir has been constructed on Bear Creek, a tributary of this stream, and is known as the Bear Valley reservoir. This stored water is held until the summer months and used for irrigation in the San Bernardino Valley.
SANTA ANA RIVER NEAR MENTONE, CAL.
This station was established in June, 1896. It is located 5 miles northeast of Mentone, Cal., three-fourths of a mile below the head works of the Mentone Power Company's canal and opposite the warm springs in the canyon.
The Edison Electric Company diverts the greater portion of the water from Santa Ana River above the gaging station, but also returns all of it above the station. They, however, allow only limited portions of the water to pass out of their conduits during certain hours of the day, holding back the water for the purpose of obtaining additional power when the greatest demand exists.
The Mentone Power Company's canal, formerly called the Santa Ana canal, diverts water above the station, all of which is returned below the point of measurement. During the low-water season the entire flow of the river is diverted by the canals. The conditions at this station and the bench marks are described in Water-Supply Paper Xo. 177, page 94, where are given also references to publica tions that contain data for previous years.

80 SURFACE WATER h-FPPLY, 1'iKi.
Discharge ittfamimnents of X ant a Ana Sinr near. Menlvm , CaL, in I'.nHi.
Date.
February 11....February 11....
March 14.......Marcn Hi. ......March Hi.......March 17.......March 17. ......March IS.......March 23 .......March 25.......March 20.......March 20.......March 27.......April 10........April 21 ........May 12.........May 12. ........
October 11.....
Hydrographey.
(MI. Lee..
.....do
.....do
.....do
.....do
.....do
.....do
.....do
.....do
.....doM. P. 1
.....do
.....do
.....do
.....do(\ II. IM. P......do.....do.....do.....doR.S.I W. F. .....do
lawleyMartin
Discharge.
rivt. Iii
F
111
:!
.
:::
:
.' . i
Daily gage height, inftct, of Rnnta Ana Rii'<r near
Day.
I...... ........ >3...............4..............
9............ .
n.. ............12..............13............ .14..............15..............
10...---........17..............l^. .............W.. ............20............ .
21.. . . ....... 22 ............2\ ..........24.. .........25....... ...
21.. ... 2"
2V .'... '.'. '.".29 ............HO..............
Jan.
1.3 1.3 1.31.3 i 3
1.3
1.31.3 1.3
1.31.31 3 1.3i .; I..;1.31 3 2 4 2 2
1 7 1.5 1.51.4 1.4
1.3i..;1.3i.:;1.3 1.3
Feb.
~1..H1.3 1.3 1.3 1.3
1.3 1.3 1.3 1.3 1.3
1.3 1.3 1.3 1.3 1.3
1.3 1.3 1.3 1.3 1.3
1.3 1.9 2.0 2.0 2.0
2.0 2.0 2.0
Mar.
1.9 1.9 1.7 1.1) 1.5
1.5 1.4 1.4 1.41.4
1.4T). O
4.5 3.4 3.0
5.0 4. 15 3.7 3. 45 3. 25
3. 15 3.1 3. Or, 4.0 4. 95
5. 8 5. 2 4.9 4.0 4.3 4.2
, ,,,
3 9 3.4 3.3 3.43.4
3. 3 3. 2 3.1 3. 03.0
3.0 2.9 2.9 3.0 2.9
2. 9 2.9 2.9 2.9 3.0
3. 5 3.8 3.9 3.9 3.7
3.7 3.1 3. 3 3.S
May.
3.1 3. 0 2. 9 2.9 3.0
3.7 3.4 3.8 3.8 3.8
3.8 3.0 3.0 3.4 3. 3
3.3 3.2 3.2 3.2 3 2
3 2 3.4 3.5 3. 5 3. 2
3.2 3. 3 4.9 4.4 4.3 4.0
June. J
4.0 3. 5 3. 5 3.3 3.3
3. 3 3. 2 3.2 :-!. 2 3.2
3.4 3.2 3. 2 3.2 3.2
3.2 3.1 3.1 3.1 3.1
3.1 3.1 3.1 3.4 3.1
3.0 3.1 3. 1 3. 0 3.0
uly.
3. 0 3.0 2.9 2.9 3. 0
3. 0 3.0 3.0 2.9 2.9
2.9 2. 9 2.9 2. 9 2.9
3.0 2. 9 2.9 2.82.8
2.7 2.8 2.8 2.9 2.8
2.8 2.8 2.7 2.7 2.7 2.0
(t. f .17 .51 .57 .54 .45 .50
). 40 ). 80 1.15 { 85 .70 . 05 .90
,. 35 ' x 90 > 25 .00 .50
\. 00 .00 .50 .00 . 55
31 l i. 85
Mntlo
Aug.
2.1, 2. l> 2. 5 2. 5 2.4
2.4 2.4 2.4 2.4 2.4
2.4 2.42. r,2. 0, 2. 5
2. 1', 2.9 3.0
_ 2.7
2.5
2. 3 2.1 2.0
2.3 2.3 2.3 2.3 2.3 2.3
87 11 15.8 12. 8 0.7
351 .410 .870 077 597 405 150 913
2,250 .780 .200 130 214 14X 100 149
70 13 1 2.9
270
ne. ( 1a
Sept.
2.3 2.3 2.3 2.3 2.3
2.3 2.2 2.2 2.2 2.2
2.2 > o
2.2 2. 2 2. 2
2. 3 2.3 2.3 2.3 2.3
2.3 2. 5 2.5 2.5 2.5
2.5 2. 5 2 5 2.5 2.5
Mento Powc Coin
p.uiy cana
,8Yc.-/
I., for
Oct.
2. 5 2.5 2. 5 2. 5 2. 5
2.5 2.5 2.5 2.5 2. 5
2 52. 5 A 5 2. 5
. 2.5
2. 5 2.5 2.5 2. 5 2.5
2.3 2.3 2.3 2.3 2.3
2. 3 2.3 2.3 2. 3 2.3 2.3
ner
.
37 42 42 42 52 27 49 49 0 0
11 55 35 34 34 25 0,8 72 71 71 00 71 72 01 74
]<>
X
r<.t, ;
Hi.
IV.
2.3 2.3 2.3 A3 2.3
2.3 2.3 2. 3 2.3 2.3
2. 3 2.3 2. 3 2.3 2.3
2.3 2.3 2. 3 2.3 2.3
2.3 2.3 2.3 2. 3 2.3
2.3 2.3 2. 3 2.3 2. 3

SANTA ANA RIVEK DRAINAGE BASIN. 81
Daily discharge, in second-feet, of Mentonc Power Company's canal near Men-tone, Cal.,for 1906.
Day.
1... ............
3...............4...............
6...............7...............8...............9...............10...............
12...............13...............
10............. ..17...............18...............19...............20. ..............
21...............9023. ..............24...............25...............
26...............
()Q
2930...............31...............
Jan.
3433343434
3434343434
333435
44
443737
37
4850373741
38S535333333
Feb.
32
32
3535354441
5259
63
64514948
4860585655
535149
Mar.
5148484356
5251SO5050
4340°743
490
113544
4358557135
342555
21°7
Apr.
056555756
526570706S
7474
66
66686871
7271717170
717171
71
May.
7071717171
717170
71
7166
66
6666687070
6671717166
66640
6664
June.
716670
70
7070707070
707071
' 70
707171
7072717171
6471
71
July. Aug.
71 7266 72
71 7271 72
71 7271 7171 6871 7071 71
71 7171 7171 71
71 72
71 4571 4271 7271 72
71 7271 7271 7271 72
72 7072 7072 6672 6672 6572 66
Sept.
6358586363
636664G36°
6262596064
6358585656
5754525252
595962
64
Oct. Nov. Dec.
67 66 64 68
67 67
67 6260 6160 7062 | 7164 71
60 6160 5958 7454 7257 72
Monthly discharge of Santa Ana River near Mentonc, Cal., fo- 19W.
[Drainage area, 182 square miles.]
Discharge in second-feet. Run-off.
Month. Maximum.
March .... ................. ..... 2. 440April ..... ....................... 495May.............................. 53(5.1 uric .............................. 329July.............................. 140
The vear ................... 2, 440
Minimum.
343351
186163135906758665456
33
Mean.
46.863. 1
53027424517211980.564.171.460. 3
111
153
acre-feet.
2,8803,500
32,60016,30015, 10010, 2007,3204.9503,8104,3903,5906, 820
111,000
Sec.-ft. per sn. mile.
0. 257.347
2 911.501. 35.945. G54.442.352.392.331.610
.841
Depth in inches.
0. 30.36
3. 361.671. 561.05
.51
.39
. 4.5
.37
.70
11.47
NOTE. The discharge includes that of the Mentone Power Company's canal. Discharges for the river were obtained from rating tables covering short periods of time on account of the constant change in channel. Values are fair.
SEEPAGE MEASUREMENTS.
In the vicinity of Colton and San Bernardino large quantities of water are developed in addition to the natural surface flow. This water is used for the irrigation of land in the vicinity of San Ber-
8591 IRE 213 07 6

82 SURFACE WATER SUPPLY, 1906.
nardino, Colton, and Riverside, and also for domestic supply these towns. Much of this water returns to Santa Ana River bel Riverside, above a point known as Slover Mountain, and is ag diverted and used for irrigation on the lower l?,nds below Rivers a^d above what is known as Riverside Narrows. Below this po there are still further diversions which irrigate the lower la- along the river bottom, much of this water again returning to river above Riiicon. Measurements were made during the summ of 1905 and 1906 to determine the amount of water, including natural flow and developed water, above Colton, Cal. Also me urements wTere made of natural flow and developed water bel Slover Mountain and above Riverside Narrows, this all being reti water from irrigated lands on the higher elevations. Measureme were also made of diversion ditches and Santa Ana River bel Riverside Narrows and above what is known as the Auburnd Bridge. The following tabulations show the result of these me urements, which were made by K. Sanborn, of Riverside, Cal.
Measurements made during 1905 are contaiaed in Water-Sup' Paper No. 177, pages 99 to 102.
Natural flow, in second-feet, of return icater to Santa Ana River< compared uith develc water in San Bernardino aborc Colton, Cal., 1906.
[Measurements by Kingsbury Sanborn, engineer Riverside Water Company.]
Date.
June 23. .......
June 20........
September 20.. June 29 ........
June. 20 ........
June 19
June 19
June 19........
June 25........
June 27 ........
June 19 ........
June 19
June 14August 23.....June 19.. ......
June 23........
June 23 ........
June 18........
Location.
.....do....................................................
.....do....................................................Bloomington pumping plant ............................. .....do............. .......................................Citizens Water Co. pumping plant ....................... City of San Bernardino, Sixth street pumping plant. . . .
City of San Bernardino, Lytle Creek. ........................'.do.............----.-.:.-.......--....--------..-..--...... do.................. ................................. .
.....do....................................................
Carr pumping plant. ..................................... ..... do.......... .....................--.---....----.-.-...
Excelsior Land and Water Co ........................... .....do........-....--.-...-......-......--..-.-----.---...Grand Terrace pumping plant ...........................
.....do...............-..--...........-.----.-.--.....--...
Hunter pumping plant ...................................
Johnson & Hubbard pumping plant .....................
Lawson Well Co. pumping plant ......................... .....do............... ---.-....-.-.-......-.-----.-.--...--Loesdon & Farrell ditch .................................
De veloped.
1.301.50
10. 50 Li. 701.50 2.00 4.80
3. 50.70
1.602.701.94.40 .70
.60
.75
.30
.3522.9038.00
1.90 1.50.52 .48.00.00.60 .70
Natural.
0.00.00
1.90 2.00
.00
.00
8.30
8.30.00.05.08
.66
Tc

SANTA ANA RIVER DRAINAGE BASIN. 83
Jlow, in second-feet, of return water to Santa Ana Rieir, compand icith developed icater in San Bernardino above Colton, Cal., IMiti Continued.
Location.De
veloped. Natural. Total.
October 24..... Logedoii & Farrell ditch .June 20....... J Lytle Creek Water and Improvement Co. pumping , 0.00
plant. September 20.... ...do....................................................1 U)J une 28........ Merryfield pumping plant............................... J . f 0August 24..... .....do.................................................... .79June 18........ McKenzie ditch.
.do.AuguJune 28....... Meeks & Daley ditch.August 31..... ... ..do....... T........
ngust 2June 20........ Riverside Highland Water Co. pumping plant. .......... 3. (10September 20.. .... .do.................................................... (i. 10June 20........ Riverside Highland Water Co., Santa Ana River........ 1. 80September 7... .... .do.................................................... (i. 90June 20........ Rancheria pumping plant................................ 2.00
iguJune 19........ Riverside Water Co., upper canal........................ 2. 90August 31..........do.................................................... 23. 05June 23........ Riverside Water Co. mill pumping plant................. .00August 31..........do.................................................... .00June 20........ Riverside Water Co. flume.........................................
pumping pi2.40
me 23........ Swamp diAugust 29..... .... .doJune 27........ West Riverside 350-inch Water Co. pumping plant ...... (!. 00August 31..........do.................................................... (i. 50J une 22........ Whitlock ditch.....................................................October 24..... .....do......................................... .......... ..........October 24..... Whiting ditch......................................................June 20........' Ward and Warren ditch...........................................September 1... ... ..do..............................................................
0.00
.0010.9017.10
.00
.00
.00
.00
0.00 .00
.00
.80
.79
.00
.0010. 9017.10
.00
.00
.00
.003. fiO('.. 104.30li. 902.001.90.00.00
41.5050. 00
.00
.00Hi. 70
.00
.00
.00
.00
.00
.50
.001.002.40.00.24.80.114
(i. 000.50.00.00.00
5. 10.00
Return waters, in second-fat, in San Bernardino Valley below Sloirr Mountain and above Riverside Xarrows, 1906.
[Measurements by Kingsbury Sanborn, engineer Riverside Water Company.]
Date.
June 29. .......
June '^9
June ^0
June 23 ........
June 29. .......
June 27. .......
June 29 ........
September 13..
Location.
Cuttle's pumping plant ..................................
Riverside Bridge. .....do....................................................
..... do................................... ................ .
..... do........................................... ........ .
.....do....................................................Evans pumping plant 1,000 feet south of west end of
West Riverside Bridge.
Evans J urupa pumping plant ............................
.....do....................................................
De veloped.
2. 50 2. 50
1.40
3.00
5.53.00
Natural.
5.20
5. 00
.00
.001 90.00
.00
.002.70
2. M)3.25
.00
Total.
5. 20
5. 002. 50 2. 501.301.40.00
.001.90.00.00.00.00
2.703. 60
5.53.00
2.903. 25.70.00

84 SURFACE WATEK SUPPLY, 1906.
Return waters, in sicond-fiel, in San Bi'rnnnlinn Valley below filour Mountain above Riverside Narrowa. 190(> Continued.
Date. Location.De
veloped. Natural. To
,UuiP 2li........ Jurupa pumping plant to supply Rubidoux ditch........ 2.30 . ... ....September 3... .... .do................................................. ,r.. 20 ..........June 27........ Lower canal, Riverside Water Co.................................. 3. 10September 3........do............................................................. .00June 29........ J'ond's pumping plant................................... 1.30 .........September 7.......do................................................... 2. r,0 ..........June 2(1........ Kubidoux ditch at measuring box................................. 4. 40September 3... .... .do ............ .......................................... ...... 2. 00June21..... .. Riverside Power Co. canal at 1'edley crossing............ .......... 2/.70 '.September 29.. .....do........ .................................................... 35.00 JJune 29. ....... Rivmo Land Co. pumping plant No. 1 .................. .SO ..........September 7..... . .do.................................................... . 70 '..........September 13.. Rivino I,and Co. pumping plant No. 2 .................. . ,S3 ..........June 25........ Smith or Evans ditch 1 mile below Riverside County line. ......... 1. 70September 3... . ...do....... .... . ............................................... .00June 27. ....... Sequel ditch tit intake.............................................. (i. COAugust 2S. ....:.... .do ....................................................'.......... :>. 30June 23.... ..' Spring Brook pumping plant at weir at end of main .... .00 .... .....September 3........do ................................................ . (10 ..........June 2<i _....... Spanishtovm pumping plant at \veir at end of main.... 4. t.O ..........September 3... .. .do.... ............................................... . 00 ........June 30. ....... /immerman pipe line...............................................1 2. 20September 13.. .....do.................................................... ..........I .00
Discharge measurements, in second-fief, of canals between Riverside Narrows and Auburndale Biidtje harin;/ thdr source in Santa Ana River, 1'JOfi.
Date. Location. Disclu
.1 une 21........ Castile ditch near intake........................................September 29.......do...........................................................June 21..... .. Durkee ditch at Auburndale road crossing......................September 29.. .... .do...........................................................June 21........ Fuller ditch.....................................................September 29.. .... .do...........................................................June 21........ Crilliland ditch at Auburndalc road crossing....................September 29.. .... .do...........................................................June 21........ Newton ditch near intake.......................................September 29..'.... .do.... ......................................................June 21........1 Newberry ditch at Auburndale road crossing. ..................September 29.......do...........................................................June 21........ Roberts or LeUay ditch near intake, Santa Ana Rive".........September 2<l.. .... .do ...........................................................Tune 21........i Wilbur ditch at Rogers pipe trestle crossing, Santa Ana River.September 29.......do.............. ............................................June 21........ Santa Ana River at Auburndale Bridge........................September 29.. .....do...........................................................June 21........ Santa Ana River at Auburndale Bridge, including ditches.September 29.. .....do.
MISCELLANEOUS MEASUREMENTS IN SANTA ANA RIVER DRAIN/BASIN.
The following is a list of miscellaneous discharge measureme made in the Santa Ana River drainage basin during 1906.
Cable Canyon Creek near Glen Helen, Cal. This stream is a tri tary of the Santa Ana River. A measurement was made July 1906, at the diversion weir in the canyon:
Diversion over weir, LI second-feet; waste below weir, 2.1 seeond-feet; total of creek, 2.2 second-feet.
Cdjon Creel- near Kcenbrook, Cal. This stream is a tributary Lytle Creek. A measurement was made July 1(5, 1906, in the can at Keenbrook:
Width. 3 feet: area. L.3 square feet; discharge. 3.3 second-feet.

SAN GABRIEL RIVER DRAINAGE BASIX. 85
Cliino Creek near Rincon, Cat. This stream is a tributary of Santa Ana River. The following measurements were made during 1906, at the wagon bridge at Rincon road crossing, one-fourth mile above junction with Santa Ana River:
June 25: Width, 3 feet; area, 1.5 square feet; discharge, 3.9 second-feet.August 31: Width, 3.5 feet: area, 1.3 square feet; discharge, 2.6 second-feet.November 7: Width, 5.5 feet; area, 6.2 square feet; discharge, 10.3 second-feet.
Devil Canyon Creek near Trnngtort, Cal. This stream is a tributary of Santa Ana River. A measurement was made July 14, 1906, at the mouth of the canyon:
Width, 4 feet; area, 2.4 square feet; discharge, 5.2 second-feet. East Twin Creek near Arrowhead Springs, Cal. This stream is a
tributary of the Santa Ana River. A measurement was made July 14, 1906, in the canyon above the canal diversion:
Width. 2 feet; area, 1.8 square feet; discharge, 2.7 second-fed. Lytle Creek near Rialto, Cal. This stream is one of the principal
tributaries of Santa Ana River. A measurement was made Jul}T 16, 1906, at the head Of the Fontella Development Company's canal at the mouth of the canyon:
Diversion over weir, 25.4 second-feet; waste below weir, 50 second-feet; total flow of creek, 81.4 second-feet.
Santa Ana River near Rincon, Cal. The following measurements were made during 1906, at the Rincon wagon bridge, at the lower end of the San Bernardino Valley and at the head of the lower Santa Ana Canyon. These measurements, with the addition of those of Chino Creek, show the total discharge of Santa Ana River below all diversions in the San Bernardino Valley, and show the amount of water used for irrigation in the vicinity of Orange, Sarta Ana, Ana- heim, and Fullerton, Cal., diversions being made below this point of measurement:
June 25: Width, 47 feet; area, 40 square feet; discharge, 82 second-feet. August 3: Width, 47 feet; area, 33 square feet; discharge, 56 second-feet. November 7: Width, 43 feet; area, 45 square feet; discharge, 94 second-feet.
Waterman, Canyon or West Twin Creek near Arrou'ltead Springs, Cal. This stream is a tributary of Santa Ana River. A measure ment was made Jury 14, 1906, at the crossing on the road to Water man Ranch near the mouth of the canyon:
Width, 4.7 feet; area, 3.6 square feet; discharge, 4 second-feet.
SAN GABRIEL RIVER DRAINAGE BA^IN.
DESCRIPTION OF BASIN.
San Gabriel River rises in the Sierra Madre Mountains and, flow ing in a southwesterly direction through the San Gabriel and Los Angeles valleys, discharges its waters into the Pacific Ocean near Long Beach, Cal. In the upper reaches of this basin there are

86 SURFACE WATER SUPPLY, 1906.
numerous tributaries, which have their source in the higher ele tions of the Sierra Madre Range. The topography in the up reaches of this basin is rough and rugged, with deep and narr canyons, while on the lower elevations the country is rolling, w large areas of valley land. The formation on the higher mount elevation is of granite, with a light soil covering, with sparse tim growth. As one approaches the middle elevations the covering brush, with scattering timber, while in the foothill country therc nothing but a growth of grass. The gaging station on this stre is located at a point where the stream leaves the higher mounta in the vicinity of Azusa. Below this point the river enters the £ Gabriel Valley, where the stream has a comparatively light gra the bed being composed of bowlders, gravel, and sand, in which water quickly disappears, except in times of food discharge. ^ waters of this stream again appear on the surface at the lower e of the San Gabriel Valley, at the point of discharge from the foothi where an obstruction to the underground passage forces the wa to the surface, on which it flows for a short distance and again c appears in the sands of the flat country belov* the foothills. ^ entire flow of this stream during the summer rioiiths is diverted a point about 5 miles above the gaging station and is used for po^ purposes at the mouth of the canyon. From this point it is carried ditches and used for irrigation in the San Gabriel Valley. r water is again diverted where it appears on the surface at the lo\ end of this valley and is used for irrigation on the lower levels bel this point. The mean precipitation in this baem varies from 15 30 inches and is principally in the form of rain. On small areas the higher mountain elevations the precipitation is in the form snow, which melts in the early spring months.
SAN GABRIEL RIVER AND CANALS NEAR AZUSA, CAL.
Owing to the numerous diversions, it has been difficult to obt accurate discharge measurements at Azusa, but during 1898 the £ Gabriel Electric Company completed its system, and measureme are now obtained with greater ease and hence with greater accura The head works of this company are located about 6 miles above mouth of the canyon. The water is carried around the left side a series of tunnels and conduits, and a head of 400 feet is obtair where the electric power is generated. Weirs are placed on the c duit of the electric company and the water is measured at this poi The capacity of the conduit is 80 second-feet.
The cable and gage are located about 1 mile from Azusa- Dur the season of low water for a period of from six to eight months canals above the station divert the entire flow and there is no r ning water at the station. The total flow of the river is obtair by adding the daily discharge for the river to the. figures for the c

SAN GABRIEL RIVER DRAINAGE BASIN. 87
responding dates for the canals. The conditions at this station and the bench marks are described in Water-Supply Paper No. 177, page 104, where are given also references to publications thU contain data for previous years.
Discharge measurements of San Gabriel River and canals near Azusa, Col., in 1906.
March 18 .......
March 30.......
April 18........
June *^9
December 28 . . .
.....do.........................................
.....do...........--------.....-................
.....do.....-...-.....-.-...-.-.-.......-.-.--..
.....do..... ...................................
.....do.........................................
.....do.........................................
.....do........... .............................
.....do.........................................
.....do.........................................
.....do.........................................
.....do.........................................
.....do.........................................
.....do.. .......................................
.....do.........................................
.....do.........................................C.H.Lee......................................
W. B. Clanp andR. S. Ilawlev. ---....-.......
Gageheight.
Feet.
9 go'' 951.702.702.702. CO
r) 90
4 405. 28
4.70
4.005.10
3.803.80'? '¥>
3.55o on
o.20
Eiver.
Sec. -ft.
104110
3.560G949
4 940o op.n
1,2102,190
1,380
394430209212999273157
1.500
Discharge
Canal.
Sec.-ft. 0
76
15
40
7478
7879y9
70
70
70
Total.
Sec.-ft.
180
00
8489
2, 000
2,2709 9<1Q
1^520
760
4705129S5''88
346327
1011,580
Daily gage height, in feet, of San Gabriel River near Azusa, Ceil., for 1906.
Day.
1. ..........................9
3............... ............
5
T ........ ..................8. .............. . . .....910...........................
11. .................. ........1213 ...........................14...........................15 ...........................
19..................... .....
21.................22. .................. . ....23................... . ....24...........................25 ...........................
26......................:....27...........................28...........................29so..:........................01
Jan.
3.9
2.32.01.751.0
::::::::
Feb.
2.72. 7 2.7
Ij]
.0
1.92.32.01.91.9
1.8
Mar.
7.9
4.354.5
5.2
4.3
7.55
8.457.450.7
5. 1
Apr.
4.8
4.7
4.7
4.24.24.2
4.2 1. 14.04.0 4.0
3 9
) 0
3.0
3.53.53.7
3 4
May.
3.43.43.4
3.45
3 453.43.43.43.4
3.43.33.33.3 3.3
0 0
3.23.2
3.2
3.13.1
3.43.34.8
3.7
June.
3.0
3.5
3.4
3.43.43.33.3
3.23.2
3.1 3.1
3.03.03.03.0
2.95
2 93.0
2.9
2.952.92.85
July.
2.82.82 8
*> ">i9 "9 "9 "
2.02.02.02.0 2.0
2. 55
2.4
2.352.352.3
2. 15
Aug.
2.12.01.91 9
1.7
1.05
1.01.55
1.4 1.3
........
Dec.
4.03.83.5 3.0
2.1
2.1
........
2.05.23.8
3.2
NOTE. The river was dry January 1 to 18, January 20 to February 12, February 27 to March 3, March to 11, August 16 to December 11, and December 21 to 20.

88 SURFACE WATER SUPPLY, 1£%.
Daily discharge in second-feet of San (i-abnel Canals near Azusa, C*al., for 1906.
Day. Jan. Feb.
1............... 37 502............... 37 503............... 37 494............... 37 505............... 37 63
7............... 37 56S... ....... 37 470....... ..... 37 4710............... 36 57
11............... 36 7212....... ...... 37 6913............... 37 1514...............' 49 J515............... 52 15
10............... 41 1517............... 41 40IS..... ......... 42 74
20............... 76 74
21............... 76 7522............... 76 7423............... 76 7424............... 76 7425............... 66 70
26............... 66 7027............... 61 7328............... 57 7629..... ....... . 58 .......30............... 54 .......31............... 52 .......
Mar.
68
2020
7470707164
56747474j~
787878--
75
7271657876
787878
7678
Apr.
785258
78I87776
65
78
76
767276
76
7676
7676
76
76
May.
7676767676
7676
7676
76
76
76
76
76
76
7070767676
767676534860
June.
54525465
76
76767670"76
767670
76
7670767676
76
76
July. ! Aug.
76 7676 7676 7676 76
76 76
76 7676 7676 76
70 76
76 7676 7676 72
76 P8
76 68
76 64
76 60
76 59
76 58
Sept.
54
53
52
5050494949
4949505052
51504045Mr
444443434^
<-
43434242
Oct.
4242424241
4040404040
4040403938
3839394041
4040404040
403938383838
Nov.
3S38383838
3939393838
3838383838 ,
3838373738
4145
4545
40
45
45
Monthly discharge of San Gabriel River near Azusa, CaL.for 1906.
[Drainage area, 222 square miles.]
Month.
July..............................
Discharge in second-feet.
Maximum.
441 92
9,430 1,110 1,110
364 295 93 55 42 47
1.600
9,430
Minimum.
36 47 56
321 251 204 97 57 42 38 37 45
36
Mean.
68.1 68.1
2,160578 342 262 155 72.8 47.7 39.8 40.4
188
335
Total in ecre-feet.
4,190 3,780
133,000 34, 400 21,000 15. 600 9,530 4,480 2,840 2,450 2,400
11,000
245,000
Run-off.
Sec.-ft. per sq. mile.
0.307 .307
9.73 2.60 1.54 1.18 .698 .328 .215 .179 .182 .847
1.51
Dep inc'
NOTE. These discharges include the water in the canals. The discharge of the river has been obti from rating tables covering short periods of time, on account of the constant change in channel. V are fair.
JLOS ANGELES RIVER DRAINAGE BASIN.
DESCRIPTION OF BASIN.
Los Angeles River is formed by Tujunga, Pacoima, and other sr. creeks which have their source in the Sierra Madre Range of mo tains to the northeast of the city of Los Angeles. These streams le

LOS ANGELES RIVER DRAINAGE BASIN. 89
the mountains at a point about 25 miles above the city and enter the comparatively flat country of the San Fernando Valley, where, except in times of excessive flood, the waters disappear in the sand and gravel washes, to reappear at the lower end of this valley, when a secondary range of hills, extending from east to west, forces them to the surface to form what is known as Los Angeles River. Below this point the river discharges through the flat country of the Los Angeles Valley, finally entering the Pacific Ocean near the town of Lorg Beach, Cal. During the summer months the entire flow of Los Angeles River is diverted at a point about 5 miles above Los Angeles for the supply of the city, only a small amount of water passing this point except during flood discharges. The topography is rough in the upper reaches of this drainage basin, the streams flowing in deep, narrow canyons. In this portion of the basin the formation is of granite, with good soil covering and light timber and heavy brush growth. There is a con siderable area of foothill country within this basin, lying between the base of the Sierra Madre Range and the Los Angeles Valley, which has a light covering of brush and grass. The soil of the San Fer nando Valley consists, principally, of river wash, coarse sand, and gravel, except along the base of the mountains and foothills, where, the soil is of good depth and is under a high state of cultivation. The soil of the Los Angeles Valley, below the city of Los Angeles, consists of a light sandy loam and is under a high state of cultivation. The mean precipitation throughout the basin is from 15 to 30 inches and falls in the form of rain, except on small areas on the higher mountain elevations.
MISCELLANEOUS MEASUREMENTS IN LOS ANGELES RIVER DRAINAGE
BASIN.
The following is a list of miscellaneous discharge measurements made in Los Angeles River drainage basin during 1906:
Arroyo Seco near Pasadena, Cal. This stream is a tributary of Los Angeles River. The following measurements were made on this stream during 1906:
April 18, at mouth of canyon, 5 miles above Pasadena, Cal.: Width, Ki.5 feet; area, 11.6 square feet; discharge, 20 second-feet.
April 18, at Devils Gate, 3 miles above Pasadena, Cal.: Width, 11 feet; area, 5.9 square feet; discharge, 9.2 second-feet.
April 18, at submerged dam of Pasadena Land and Water Company at Pasadena, Cal.: Discharge, 0.0 second-feet.
Los Angeles River at Seventh Street Bridge, Los Angeles, Cal. The
following measurements were made on Los Angeles River:
March 13, a. in.: Width, 80 feet; area, 16G square feet; discharge, 850 second-feet. March 13, p. in.: Width, 80 feet; area, 136 square feet; discharge, 555 second-feet. March 16: Width, 58 feet; area, 43 square feet; discharge, 75 second-feet. March 17, a. in.: Width, 80 feet; area, 194 square feet; discharge, 1,200 second-feet. March 17, p. m.: Width, 73 feet; area, 103 square feet; discharge, 420 second-feet.

90 SURFACE WATER SUPPLY, 1906.
Diversions from Los Angeles River. During the summer of \. measurements were made to determine the amount of water diver by the city of Los Angeles for domestic supply, this being ascertar by measurements made in the 44-inch conduit and in the mr supply conduit. The supply is taken from the river near Burbf and includes both surface and underground diversions and constitu the entire flow of the river at this point during the summer mont Some return seepage water again appears in the river channel n Huron street, Los Angeles, near which point the city has an unc ground gallery or tunnel for collecting an auxiliary supply whicl pumped to the reservoir and used in the general distributing systf The following measurements were made of these diversions dur 1906:
Measurements of flow, in second-feet, of diversions from Los Angeles Hirer by the citLos Angeles in 1WJ6.
Date.
April20. ............. ... ....... ............. ... .............June 23 ................................................................
July 20. ................................................................August 22 ..............................................................
December 18. ..........................................................
44-inch conduit
discharge.
26.5936.2331.7634.7333.9530.4932.8638.1129.4832.7333.61
Main-sup ply conduit discharge.
6.587.67
15.86
10.2313.6711.304.43
13.2013.5015.66
To
NOTE. On February 24, 23.0 second-feet was passing intake and is not included in above total. April 20, 7.4 second-feet was passing intake and is not included in above, total.
MAZJBTT CRTSKK DRAINAGE BASIN.
DESCRIPTION OF BASIN.
Malibu Creek rises in the Santa Monica Mountains and enters Pacific Ocean about 15 miles above the town of Santa Monica. T stream is formed by Triunfo and Las Virgenes creeks, which dr the northern portion of the Santa Monica Range and the lower fo hill country to the north. The formation throughout this basir shale, sandstone, and conglomerate, with good soil covering. Th is a sparse growth of timber on the higher elevations, but the grea portion of this area has a covering of brush ^and grass and is n: extensively for pasturage, with limited areas of cultivated land the raising of grain. A reservoir has been constructed on the up reaches of the Triunfo Creek and the waters are used for irrigat within the basin during the summer months. This reservoir cov an area of about 300 acres when filled. The mean precipitatioi. about 25 inches and falls wholly in the form of rain.

MALIBU CREEK DRAINAGE BASIN. 91
MALIBU CREEK NEAR CALABASAS, CAL.
This station was established November 29, 1901, by S. G. Bennett. It is located at Chapman's ranch, 40 miles from Los Angeles by wagon road and 8 miles southwest of Calabasas, about one-fourth mile below the mouth of Las Virgenes Creek. The conditions at this station and the bench marks are described in Water-Supply Paper No. 177,page 111, where are given also references to publications that contain data for previous years.
Discharge measurements of Malibu Creek near Calabasas, Cal., in ]90fi.
Date.
March 11.......
May 24........
Hydrographcr.
C. II. Lee................................ ...do. .............................. ....... do.......... ...................... ......do......................................do.................................
Vv'idth.
Fed.. . (i
........ 33
........! 20
........' 16
Area, of section.
Sq.ft.
459411.16.4
Gage height.
Feet. 0. 852.302.801.301.00
Dis charge.
Sec.-ft. 1.0
122400
7.1
a Measured by floats.
Daily (jane height, infect, of Malibu Creek near Calabasas, fa/.,/or 1906.
Day.
1. .....
3............ ..4........ . ..
G... ............
X9...............
10...............
11. ..............12......... . .. 13...............14...............1.5......... . . .
16........ . ..17...............18........... ...19...............20...............
21........
23...............24...............
26............... 27.... ...........28. .....29...............30........ .. ..31...............
Jan.
0.0.6
.G
.7
_
.7
1.01.01.01.0
1.0 1.00.6
Feb.
0.6
7
.6
1.1
~
1.0 1.01.0
Mar.
1.01.01.0
.8
0 s
.92. 550 O
1.551 2
2.1
"1.61.45
1.551.53.49 99
5. 55 3.352.9
1.9
Apr.
1.851.8
1.4
1.4
1.4 1.2.".].2o
1.21.31.31 *}
1 31.051.051.051.05
1.05
May.
1.11.1
1.1
1.1
1.05
1.05 ] . 05
1.051.01.01.01.0
1.0a 1 0»1. 1
1.11.21.21.1
1.0
June.
1.01.01.01.01.0
1.01.01.0
1.0 1.01.01.0
1.01.0
1.01.0
1.01.0
.1.01.01.0
1.0 1.0
1.0
July.
1.01.01.01.0
.()'
.9
.9
.9
.9
.9
.9
.9q
.9
.9
.9q
.9
.9
.9
.9
.9
.9
.9
.9
.9
.9
.9
Aug.
0.9q
.99
q.9.9.9.9
.9
.9
gqq
.9
q.9.999
.9
q
g
Sept.
0.99
.99
.9
.9
.9
.9a gn 9
o.9
a! 9a. 9a 9
a. 85a. 85a. 85
a. 85
.8a. 8a g
a. 8 0.85o.85
Oct.
0.9.9.9q
.9
.9
.9
.9
.9
.9
.9
.9
.9
.9
q.9.9.9.9
.9
.9
.9
.9
.9
a. 9 a. 9o.9a. 9a Qa. 9
Nov.
a 0.9a. 9a. 9a. 9a .9
a .9a qa. 9a qa .9
.9
.9
.9
.9
.9
.9
.9
.9
.9
.9
.9
.9
.9
.9
.9
.9
.9
.9
.9
.9
Dec.
-0.9 .9 .9 .9 .9
.9
.9
.9
.9 1.0
1.05 1.4 1.0 1.0 0.9
.8
.851.852.61.451.22.2
o Estimated.

92 SURFACE WATER SUPPLY, 1906.
Monthly discharge of Malibu Creek near Calabasas, Cat. , for 1906.
[Drainage area, 97 square miles.]
# / Month.
July.......................
Discharge in second-feet.
Maximum.
.......' 3
....... 2,000
....... 02
....... 15
7....... 4. 4...... 4. 4....... 4. 4....... 4. 4
....... 2,000
Minimum.
0.8 .8 .9
9 7 7 4 4.4 2 4.4 4.4 2
.8
Mean.
1,3 1.8
223 22.1 9.1 7.1 4.8 4.4 3.0 4.4 4.4
19.8
25.5
Total in acre-feet.
80 100
13,700 1,320
560 422 295 271 214 271 202
1,220
Run-off.
Sec.-ft. per Dept sq. mile. inch
0.013 .019
2.30 .228 .094 .073 .049 ,045 .037 .045 .045 .204
18, 700 . 201
NOTE. Discharges were obtained by the indirect method for shif;ing channels. Owing to small number of measurements and the shifting conditions, these values are only roughly appr mate.
TRIUXFO CREEK, NEAR CALABASAS, CAL.
This station is located 8 miles southwest of Calabasas, Cal., ab( one-half mile above the mouth of Las Virgenes Creek. The con tions and the bench marks are described in Water-Supply Paper 1 177, page 113, where are given also references to publications that c< tain data for previous years.
Discharge'measurements on Triunfo Creek near Calabasas, Cal., by C. H. Lee, in 1[
Date. Width.
Feet.
0.034
12004
Area of Gage | Dis section. t height . j charge.
1 Sq. ft. Feet. Scc.-ft.
1.10 1.25 0.81.5 1.3S 1.8
29 2.25 98114 2.95 459
81 2.79 313'
Date.
April 18........May 24. ........
Width.
Feet. 114
2211
Area of section.
Sq. ft. 100318
10.55
Gage height.
Feet. 3.004.502.002.05
Dcha
Sec 3
1,3
'i Measured by floats.
Monthly discharge of Triunfo Creek near Calabasas, Cal., for lf)06.
[Drainage urea, 72 square miles.]
Month.
July ..............................
December
Discharge in second-feet.
Maximum. ^ Minimum. Mean.i
0.7 10
2,000 55
6 6 30 04
100
2,000
0 0.2 0 1.1 6 155 8 19.3 5 6.9 6 6.0' 3 3.6 0 1.7 0 0.0 0 0.0 0 1.5 2 10.8
0 17.2
Total in acre-feet.
12 61
9,530 1 , 150
424 357 221 105
0 0
89 664
11,600
Run-off.
Sec.-ft per sq. mile.
0. 0028 .015
2. Ifl.268 .096 .083 .050 .024 .00 .00 .021 .150
0.238
Dept inch
0
3
NOTE. The above values are based on very meager data and are onlj- approximate.

SANTA YNEZ RIVER DRAINAGE BASIN. 93
VENTURA RIVER DRAINAGE BASIN.
DESCRIPTION OF BASIN.
Ventura River rises in the Santa Ynez Mountains (a portion of the Coast Range), in Ventura County. It flows in a southerly direction, discharging its waters into the Pacific Ocean at Ventura, Cal. Above the Ojai Valley this stream is known as Matilija Creek. The drainage basin is not large, but heavy floods of short duration ar3 of frequent occurrence during the winter months. Owing to the heavy grade of the stream and the rough and broken character of the topography throughout the basin, its flood waters quickly reach the ocean. Its principal tributaries other than Matilija Creek are Sail Antonio Creek, which drains a considerable mountain area to the east of Matilija Creek, and Coyote Creek with a small drainage area at a lower eleva tion to the west. Water is diverted from the main river and its tribu taries during the summer months for irrigation and domestic supply in the Ojai Valley and at Ventura.
MISCELLANEOUS MEASUREMENTS IN VENTURA RIVER DRAINAGE BASIN.
The following is a list of miscellaneous discharge measurements made in the Ventura River drainage basin during 1906:
Matilija Oreek near Matilija, Cal. This stream is the principal tributary of the Ventura River. A measurement was made October 24 at the road crossing below Matilija Hot Springs Hotel and above junction of North Fork:
Width, 7 feet; area, 4 .square feet; discharge, 7.7 second-feet.
North Fork Matilda Creek, near Matilija, Cal. This stream is a tributary of Matilija Creek. A measurement was made October 24 at point 500 feet above its junction with Matilija Creek and above the flume diversion:
Width, 5 feet; area, 1.9 square feet; discharge, 2.2 second-feet.
San Antonio Creek near Nordhoff, Cal. This stream is one of the principal tributaries of Ventura River. A measurement was made October 24 near the crossing of the Nordhoff-Ventura road, 1J miles below Nordhoff and above the canal diversion:
Width, 8 feet; area, 3.8 square feet; discharge, 4.4 second-feet.
SANTA YNEZ RIVER DRAINAGE BASI1 T.
DESCRIPTION OF BASIN.
Santa Ynez River rises in the mountains of Santa Barbara and Ven tura counties and flows westerly with a flat grade to the Pacific Ocean, having a length of approximately 75 miles. The Santa Ynez Range of mountains, varying in elevation from 3,000 to 4,000 feet, forms

94 SURFACE WATER SUPPLY, 1906.
the southern boundary of this drainage basin. The northern div ranges from 4,500 to 5,500 feet in elevation, culminating in Mo~ Pinos, the elevation of which is 8,826 feet. The northern part of watershed is drained by streams running in a southerly direction f uniting with Santa Ynez River proper, which runs close to northerly base of the Santa Ynez Mountains, flowing westerly F paralleling the Coast Range. The principal tributary, Mono Ore enters from the north. There are several reservoir sites on Sa~ Ynez and its tributaries which have been surveyed.
The formation throughout the entire drainage basin consists chit of shale and sandstone, the strike being parallel to the coast and dip nearly vertical, inclining somewhat to the south. The grea portion of the drainage is sparsely covered with brush and small tn only a small area on the higher elevations having any considera growth of timber. The mean annual precipitation is estimated at inches for the entire area and falls almost entirely in the form of r?
SANTA TNEZ RIVER NEAR SANTA BARBARA, CAL.
This station was established November 1, 190?. It is located at Gibraltar dam site, 5 miles below the original station, and is below mouth of Mono Creek. It is 9 miles above the San Marcus ranch t halfway between the old quicksilver mines. Tv « conditions at t station and the bench marks are described in Water-Supply Pa No. 177, p. 117, where are given also references to publicatic that contain data for previous years.
Discharge measurements of Santa Ynez Jilver near Santa Barbara, Cat., by L. J/". //in 1906.
Date.
January 12.... . January 26.... . February?... . February 10. . . February 11.. . February 15. . . February 16.. .
March 14...... .
March 10».. . . March 16 o . . . . March 16 " .... .
Width.
Feet. 16 20 18 18 42 75 46CO
488080 SO85
Area of section.
Kq. ft.9.0 7. 7
10.0 18.3 38 80 38 18
296414 503 005
Gage height.
Fret. 2.10 2.18 2.21 2.40 2.61 2.94 2.53Q 07
5.306.70 7.65 8. 65
Dis charge.
flee. -ft. 4.7
10.1 10.1 37 03
144 59
291189
2,4404,170 5,440 0,700
Date.
March 17 o.. ... March 17 o.. ... March 17« . March 17 a. March 18» . March 18» . April 17a..
July 9..........July 27.........August 17...... September 24. . December 27 . .
Width.
Feet.72 72 72
72
02 32
13.376.2 6.5
74
Area of section.
Sq ft- 216 201 216 201 172 172 77 392511.73.21.7 1.7
150
Cage height.
Feet. 4.30 4.10 4.30 4.10 3.74 3.74 2.80 2.502.212.101.951.82 1.82 3.90
Pchj
Se< c
c
i
a Measured by floats.

SANTA YNEZ RIVER DRAINAGE BASIN. . V)
Daily gage height, in feet, of Santa Ynez River near Santa Barbara, Cal.,for 1906.
Day.
1...... .........
3. ..............4..... ..........5...............
6. .............. 7............... 8...............9...............
10...............
11............... 1°13...............14.-.....-.-.....15...............
10. ..............
18........... ...
20.......... ....
21...............22...............23....... ....... .24-.....----.-.-.25-......-...-...
26...............
28...............29.......---.-.--
31...............
Jan.
2.0 2.02.052.052.05
2.05 2.05 2.052.05 2.05
2.05 2.12.152.252.25
2.252.252.25 2.82.5
2.35
2.32.252.25
2.22.152.152.152.152.15
Feb.
2.15
2.12. 12.1
2.22. 2
2.15
2.0 2.4
o 4
3.05
2.52.42.35 2.3O Q
2.42.42.32.32.3
2.32.252.25
Mar.
2 25 2.252.252.82.5
2.4 2.35 2.32.3 2.3
6.46.03.73.05
4.23.05 3.353.15
3.13.03.856.66.75
7.14 Q4.44.03.83.7
Apr.
3.6 3.553.53.43.3
3.33.2 3.13.1 3. 05
3. 05 3.03.02.92.8
2.82.75
2.7
o 72.72.72.72.65
2.652.62.62.6
May.
2.55 2.5
2.52.5
2.45 2.45 2.452.452.45
2. 4 2.42.42.42.4
2.42.42.35 2. 352.35
2.352.352.352.352.35
2.53.153.92.92.72.55
June.
2.5 2.52.452.452.4
2.4 2.4 2.352.35 2.35
2.3 2.32.32.32.3
2.32.252.25 2.252.25
2.252.252.252.252.25
2.22.22.22.22.2
July.
' 2^22.22.152.15
2.15 2.1 2.12.1 2.1
2.1 2.12.12.12.1
2.12.12.1 2.12.05
2.052.052.02.02.0
2.0
1.951.95
Aug.
1.95 1.951.91.91.9
1.9 1.91 Q1.91.85
1.851.851.851.851.85
1.81.81.81.81.8
1.81.81.81.81.8
1.81.81.81 ft
1 ft
1.8
Sept.
1.8 1.81.81.81.8
1.8 1.8 1.81.8 1.8
1.8 1.81.81.81.8
1.81.81.8 1.81.8
1.81.81.81.81.8
1.81.81.81.81.8
.......
Oct.
1.8 1.81.81.81.8
1.8 1.8 1.81.8 1.8
1.8 1.81.81.81.8
1.81.81.8 1.81.8
1.81.81.81 ft
1.8
1.81.81.81.8
1.8
Nov. .
1.8 1.81.81.81.8
1.8 1.851.851.85 1.85
1.85 1.851.851.851.85
1.851.851.85 1.851.85
1.851.851.851.851.85
1.85
1.851.951 9
Dec.
1.9 1.9 1.9 1.9 1.9
1.91.91.91.952.1
2.253.852.52.42.3
2.2 2.15 2.1 2.1
2.12.052.052.052.05
2.63.352.82.752.753.0
Rating table for Santa Ynez River near Santa Barbara, Cal.,for 1906.
charge.
Sec. -ft.
Gageheight.
Feet.1.801.902.002.102.202.302.402.50
Discharge.
Sec.-ft.1236
122235 19
Gageheight.
Feet.2. 602.702.802.903.003.103.20
Discharge.
Sec.-ft.6583
10412915(118622.3
3. 30 265
Gageheight.
Feet.3.403.503.603.703.803.904.004.20
Gage height.
Feet. 4.404.604.805.005.205.40.5. 605.80
Dis charge.
Sec.-ft. 1,0651,2851,5101,7501,9902, 2502, 5102,790
Gag- heigh t.
Feet. 6.006.20
Dis charge.
Scc.-ft. 3,0703,360
6. 40 3, 6506. 60 3, 9406.80 4,2307.00 4,5207.20 4,810
NOTE. This table is based on discharge measurements made during 1906 and is fairly well defined.
Monthly discharge of Santa Ynez River near Santa Barbara, Col., for 1906. [Drainage area, 207 square miles.]
Discharge in second-feet.
Month. Maximum.
March ............................ 4, 810April .......................... . . 430May.............................. 635
July...................... ....... 12
The year...... ............. 4,810
Minimum.
3 6
17 65 28 12 2.5 1.0 1 1 1 2
1
Mean.
14.8 27.4
1,050 158 67.4 23.9 5.7 1.4 1 1 1.4
52.1
117
Total in acre-feet.
910 1,520
64,600 9,400 4,140 1,420
350 86 60 61 83
3,200
85,800
Run-off.
Sec.-ft. per sc . mile.
0.071 .132
5.07 .763 .326 .115 .028 .0068 .0048 .0048 .0068 .252
.565
Depth in inches.
0.08 .14
5.84 .85 .38 .13 .03 .008 .005 .006 .008 .29
7.76
NOTE, The above values are fair.

96 SURFACE WATER SUPPLY, 1906.
MISCELLANEOUS MEASUREMENTS IN SANTA YNEZ RIVER DRAIJ
BASIN.
The following miscellaneous discharge measurements were mac the Santa Ynez River drainage basin during 1905 and 1906:
Santa Ynez River near Lompoc, O'al. At the old head works cj Southern Pacific Milling Company's canal (not in use), 2\ miles a Lompoc, Cal.:
1905 September 25: Width, 21 feet; area, 7.7 square feet: discharge, K.H se feet.
1906 April 19: Width, 97 feet; area, 135 square feet; discharge, 358 second-ft July 25: Width, 28 feet; area, 15 square feet; discharge, 21 second-feet September 25: Width. 14 feet; area, 6.1 square feet; discharge, 7.1 pe
feet.
At the wagon bridge, 1 j miles above Lompo", Oal.:
1906 November 10: Width. 36 feet: area, 12.8 square feet; discharge, 10 sefeet.
December 12: Width, 107 feel: area, 144 square feet; discharge, 259 se feet.
SANTA MARIA RIVER DRAINAGE BASIN.
DESCRIPTION OF BASIN.
The Santa Maria River drains the northern slope of the San Rs Mountains and a limited area of foothill country to the north of range. It flows in a westerly direction, finally discharging its w* into the Pacific Ocean at Guadalupe, about 25 miles south ot San Obispo. Its flow is torrential in character, subject to floods of s duration during the rainy period, but being practically dry during summer months. It has numerous tributaries, the most importa,' which is the Sisquoc, which enters it about 12 miles above the tov Santa Maria. The gaging station is located about 25 miles above town of Santa Maria and above most of its important tributa The country throughout this basin consists of rolling foothills, the exception of the higher elevations of the Pan Rafael Mount which reach an elevation of 6,000 to 8,000 feet. The river br from the foothills at the point where it is joined by the Sisquoc flows through the flat country of the Santa Maria Valley for a tance of about 25 miles until it joins the Pacific Ocean at Guaclal The formation throughout this basin is of shale, sandstone, and glomerate, with a good covering of heavy clay soil. There is coi erable growth of timber on the higher elevations of the San R:O o
Mountains, but over most of the area the growth of timber is 1. with large areas of brush and grass. The pasturage of stock is ca: on extensively throughout the basin. There are no diversions a this stream for irrigation, although tunnel work has been attem above Santa Maria for the development of underground water,

SALINAS RIVER DRAINAGE BASIN. 97
poor results. There are numerous wells in the vicinity of Santa Maria which produce considerable water for the irrigation of land in that locality, the soil being very deep and of exceptional quality, suscep tible to the highest state of cultivation. The mean precipitation in this drainage basin is probably about 25 inches. The greatest rain fall occurs on the lower elevations near the coast. The higher eleva tions receive some snowfall, which melts early in the spring and does not tend to keep up the flow of the stream through the summer.
SANTA MARIA RIVER NEAR SANTA MARIA, CAL.
This station was established October 22, 1903, by W. B. Clapp. It is located near the ranch house on Dutard's ranch, 21 miles above Santa Maria, Cal., a station on the Pacific Coast Railway. It is reached by driving from Santa Maria. The conditions £,t this station and the bench marks are described in Water-Supply Paper No. 177, page 120, where are given also references to publications that con tain data for previous years.
Gage heights observed at this station in 1906 are of no value, therefore no discharges can be computed.
Discharge measurements of Santa Maria River near Santa Maria, Cal., in 1906.
Date.
February 23....
Hydrographer.
.....do.........................................
.....do.............. ...........................
Width.
Feet. 282420
Area of section.
8q. ft. 14.812.87.0
Oage height.
Feet. 0.90
« 2. 20
Dis charge.
Sec.-ft.
4 9
a Zero of gage lowered 2 feet.
SAUNAS RIVER DRAINAGE BASIN.
DESCRIPTION OF BASIN.
The Arroyo Seco is the most northern tributary of any size of Salinas River and rises on the slopes of the highest portion of the Santa Lucia Range, one of the ranges that go to make up the Coast Range of California, extending in a general southeast direction from San Francisco Bay. The upper valleys of this stream are far back in the range, surrounded by high mountains.
The drainage area of the Arroyo Seco is almost entirely made up of sharp ridges and V-shaped canyons. The western portion is well covered with brush and trees of medium size. Toward the east this growth decreases until at the Salinas Valley the country is bare. The stream beds of this area fall rapidly, the Arroyo Seco rising at an elevation of nearly 6,000 feet and discharging into the Salinas at an elevation of 170 feet.
8591 1KB 213 07 7

98 SURFACE WATER SUPPLY, 190C,
Below the gaging station several canals divert water from th stream before it reaches the broad wash of sand and gravel on the fl floor of the Salinas Valley, into which it sinks during the dry seas^ and from which it receives its name, "Arroyo Seco."
On the stream and its tributaries five reservoir sites of more or le value for possible storage have already been surveyed.
This portion of the range undoubtedly receives as great rainfr as any other locality in this region; it is estimated that the avera annual precipitation is from 30 to 50 inches and falls almost entire in the form of rain.
ARROYO SECO NEAR SOLEDAD, CAL.
The original gaging station on this stream was established t W. W. Cockins, jr., in December, 1900, at Foster's ranch, near Pine Cal. High water of January, 1901, enlarged an old side chanr dividing the stream into two channels. The gag:ng station was th< removed to Pettitt's ranch, 4 miles below the old station. T1 conditions at this station and the bench marVs are described Water-Supply Paper No. 177, page 123, where are given also refe eiices 10 publications that contain data for previous years.
Discharge measurements of Arroyo Seco near Soledad, Cal., by Hawley and Pettitt. in 19<
Date.
February 24 ....
March 13 ........March 13........
March 16........
March 20........March 23........
March 20 ........March 30 .......March 31........Aprils.........April 15. ..... .
Width.
Feet. 124 123 123 122 140 130 137 136 134 132 128 135 135 133 129 133 124 122
Area of section.
Sq.ft. 181 186 169 157 882 389 562 466 405 349 285 680 446 475 353 496 244 187
Gage height.
Feet. 6.52 6.22 6.30 6.15
11.90 8.20
10.10 9.32 8.45 7.88 7.38
11.40 8.75 8.9,i 8.10 9.25 6.95 6.35
Dis charge.
Sec.-ft. 396 436 388 328
5,700 1,530 3,330 2,440 1,790 1,240
850 3,990 1,900 2,430 1,410 2,510
633 414
Date.
April 22. ........April 29.........May 5. ..........
May 28. .........
Julv4.... .......July 13 .........July 29.........August 12 ..... August 26 ..... September 18. . October 27. .. . December 31 . .
Wi-nh.
Feet. 122 121 120 120 119 124 121 62 75 47 40 34 31 31 31 18
124
Area of section.
Sq.ft. 165 154 141 133 121 287 154 65 56 67 47 37 29 29 28 18.8
275
Gage Dis height, char
Feet. 6.15 6.00 5.81 5.72 5. CO 7.40 6.00 5.93 5.50 5.35 5.25 5.13 5.05 5.02 4.90 5.01 7.20
Sec. 33 28 22 19 16
1,01 29 26 12
8 5 2 1 1 1 1 8

SALINAS BIVEE DEA1NAGE BASIN.
Daily gage height, in feet, of Arroyo Seco near Soledad, CaL, for 1906.
99
Day.
1.. .............o'!
<
<;-*
1 ...... ... ....
11.....
I 7 .... ....I'...............r... . ..i 1 '.17.. . . . ....i ...... ........i".-. ............2 1 "
0]9£972''9-
0 .
27...............21 "
3 ...............31...............
Jan.
5.555 525 525 53
5.525 52
5 515.51
5 526 QC
7.487.30
6 757.987.98
10 128.0
7.26 86 56 36.15
6 05.955.95 855 755.7
Feb.
5 655 65 585 55
5 65.55 495.45
5 75 515 85 927.05
6.456 36 286.186.1
6 36.856 66 596.49
6.396 36.3
Mar.
6.26.156 68.456 9
6.656 5
6 36.21
6.28n o
7.810.1
9.258.47.887.67.3
7 957.488 948 858.7
9 08 358 07.78 129.08
Apr.
8.38 07.757.557.35
7.27.0
6.86.7
6.66.56.56 46.35
6 36 36.26 26.2
6 26 26 26 26.2
6.056 056 06 06.0
May.
5 955 95 95 95.8
5.85 8
5 75.7
5.85 7X
5 7
5 75.7
5 75 655 65 65.6
5.65 65 65 65.6
6.558 37 36 756.456.4
June.
6.16.056.06 05.9
5.95.855 85.8
5 75 7c 7
5 655.65
5 65 65 65.555.5
5.55.55 55 55.5
5.55.55.55 455.4
July.
5.45.45.45 35
5 355 35 35 3^ ")
5 35 OK
5 OK
5 255.2
5.25.25.25 25.2
5 25 2^ 05.25.2
«; 1 ^5 1
5.155 15.1
Aug.
5!5.15.15.15.1
5 15.15 15.15.1
5 05
5 055 055.0
5 05 05 05 05.0
5 05 055 055 055.05
5 05 04 94 84 74.6
Sept.
4.54.54.74.64.6
4.64.64.64.54.6
4.64.64.64 64.7
4.74.84.94.95.0
5 05 05 05 05.05
5 055 055 055 05.0
Oct.
5.05.05 05 05.0
5 04.P4 84.84.8
4.84.?5 05 05.0
5 05 05.05 05.0
5 05 055 055 055.05
5 055 05
5 05
5.05
Nov.
5.055.055 055 255.5
5.255 155.155.15.1
5.15.15.15.15.1
5.15.15.15.15.1
5.15.155.155.1
5.155 155 155 2^ o
Dec.
5.25.155.155.155.15
5.155.155 35.3
alS.O
7.26.66.2
6.15.855.85.75.6
5.555.55.55.55.5
7.457.26 76 356 257.2
a Estimated.
ftating table for Arroyo Seco near Soledad, CaL, for 1906.
Gage height.
Feet.4.504.004.704.804.905.00
Dis charge.
Sec.-ft.01358
145. 10 ! 245.205.305.405.50
406391
121
Gage height.
Feet.5.605.705.805.906.006.106.206.306.406.506.60
Dis charge.
Sec.-ft.153185218252286320356393431470510
Gage height.
Feet.6.706.806.907.007.107.207.307.407.507.607.70
Dis charge.
Sec.-ft.553599648700754810868928990
1,0551,125
Gage height.
Fe°t.7.807.908.008.208.408. CO8.809.009.209.409.60
Dis charge.
Sec.-ft.1,1951,2651,3401,4951,6601.8402,0202,2002,3902,5802,780
Gage height.
Feet.9.80
10.0010.2010 4010.6010.8011.0012.0013.00
Dis charge.
Sec.-ft.2,9803,1803,3803,5803,7803, 9804,1805,1806.250
NOTE. This table is based on 35 discharge measurements made during 1906 and is well defined between gage heights 5 feet and 10 feet.

100 SURFACE WATER SUPPLY, 1906.
Monthly discharge of Arroyo Seco near Soledad, CaL.for 1906.
[Drainage area, 215 square miles.]
Month.
July..............................
Discharge in second-feet.
Maximum. Minimum.
3,300 124 727 94
4, 480 338 1 , 580 286 1,580 153
320 91 91 24 24 1 19 0 19 5
121 19 6,250 32
6, 250 0
Mean.
556 302
1,360 558 297 178 50.8 17.3 7.1
14.1 31.8
492
322
Total in acre-feet.
34, 200 16,800 83,600 33,200 18, 300 10,600 3,120 1,060
422 867
1,890 30,300
234. 000
Run-off.
Sec.-ft.per sq. mile.
2.59 1.41 6.32 2. 60 1.38 .828 .236 .080 .033 .066 .148
2.29
1.49
Dein
NOTE. Values are rated as follows: January to June, excellent; July and December, good; ' to November, fair.
SAN FRANCISCO BAY DRAINAGE BASIN.
GENERAL FEATURES.
Sacramento River, rising in northern California and flowing sc and San Joaquin River, rising in the southern Sierras and fie~ north, drain the western slope of the Sierra Nevada and the eas slope of the Coast Range north of San Francisco. They meet Suisun Bay, finally discharging their waters into the Pacific O through San Francisco Bay.
SACRAMENTO RIVER DRAINAGE BASIN.
DESCRIPTION OF BASIN.
Sacramento River is the principal river of California, and d"" all of the territory south of Mount Shasta and between the C Range and Trinity Range on the west and the Sierra Nevada on east. The portion of the drainage basin above Red Bluff, extends from the Trinity Mountains on the west to Warner Mount near the California-Nevada State line on the east. The water; on the west from the Trinity Mountains is comparatively nar being only from 10 to 35 miles in width, and furnishes a very s proportion of the discharge of this river, but from the east Pit R which is the most important tributary, drains a large area exten about 120 miles east from Sacramento River between Mount Sh on the north and Lassen Peak on the south. The greater poi of this basin is composed of lava and shows other evidences of canic activity, such as volcanic cones and craters. Nearly all streams tributary to Pit River have their origin in large spri many of which discharge several hundred second-feet. The i

SACRAMENTO RIVER DRAINAGE BASIN. 101
important tributary of the Pit is McCloud River, draining the south eastern slope of Mount Shasta. It derives its wattrs principally from the melting of the snow on the high elevations of this mountain. The western portion of the watershed extending along the Trinity Range is well timbered, as is also that portion of the drainage area in the Sierra Nevada lying between Mount Shasta and Lassen Peak. Farther east, however, there is little or no forest covering, and the country is used extensively for pasturage. The rainfall is very unequally distributed, varying from less than 10 inches in the eastern portion of the basin to 50 inches along the iiortherr and western portion. Below the gaging station the river enters the Sacramento Valley, through which it flows on a comparatively light grade until it reaches Suisun Bay. During the winter months, when the Sacra mento and its tributaries are in flood, large areas of the Sacramento Valley are overflowed. The floods that occur in the latter part of the rainy season, after the large overflow areas or basins are filled, cause great damage in the lower portion of the valley.
MAIN SACRAMENTO RIVER.
SACRAMENTO RIVER NEAR RED BLUFF, OAL.
The gaging station at Jellys Ferry, which is located rbout 12 miles above the town of Red Bluff, was established April 30, 1895. The right bank of the river is high, but the left bank is liable to overflow when the river rises above the 25-foot mark. The river has been known to reach the 35-foot mark. Because of the liability to over flow it was deemed advisable to select a new gaging station, where the water at flood stage could be more confined. A point in Iron Canyon, where the river had been gaged by the State engineering department in 1879 and by commissioner of public works in 1893-94, was chosen as a new gaging station. The conditions at this station and the bench marks are described in Water-Supply Paper No. 177, p. 128, where are given also references to publications that contain data for previous years.
Discharge measurements of Sacramento Hirer near Keel Bluff, f'al., by R. S. Hawley, in1906.
Dat( .
February 27..... February 27. . . . .
March 26 u ...... April 11.........May 3... ........
Width Arca of Gage v lul n ' section, height.
Feet. Sq. ft. Feet. 550 8,230 10.30 540 7,850 ' 9.45 550 7,920 9. (JO 550 7, 780 9. 30 590 12,900 18.30 536 6, 550 7. 00531 5, 570 5. 25
Dis charge.
Sec.-ft. 41, 600 36,000 38,200 36,900 92,900
18,500
Date. Width. ^-
May 16.........May 18.........June 12. ........June 13. ........ July 7. .........
December 11 ...
Feet. Sq. ft. 529 5, 290 527 4, 980 534 6, 270 532 5, 890 520 4, 360 496 3, 330 538 6, 570
Gage Dis- height. charge.
Feet. Sec.-ft. 4. 64 15, 700 4. 14 13, 800 6. 50 23, 900 5. 68 19, 600 2. 90 9, 900 1. 63 5, 470 7. 60 26, 900
Measured by floats.

102 SUKFACE WATER SUPPLY, 1906.
Daily gage height, in feet, of Sacramento River near Red Bluff, Cal.,for 190
Day. Jan.
1...... ......... 1.5 2..............J 1.43............... 1.4 4............... 1.45............... 1.4
6. .............. 1.457............... 1.458............... 1.459............... 1.5
12............... 3.313............... 4.6514......... .. ., 4.315...... .........1 4.35
1
17....... . .. . 9.85
19..... .. .'22.6
21............... 5.822............ .. 4.7 23......... .. .. 4.324. .............. 4.025............... 3.75
26............... 3.55
28............... 3.429......... ..... 3.2530. .............. 3.231............... 3.05
Feb.
2.92.82.7 2.72.6
2.552.52.52.62.7
3.253.9
3.3510.95
7.457.3
8.5
9.910.0 12.7511.5
8.4 9 18.5
Mar.
7.65 6.95
10.65 10.758.2
7.36.96.66.6
6.4514.859.99.557.75
6.6
5.355.85
8.312.95 10.714.8516.6
17.95 15.4512.610.812.8523.35
Apr.
15.512.5510.75 9.68.55
7.97.57 3
7.25
6.96.556.26.55.9
5.85.85.755.65.6
5.75 6.05.86.1
5.5
6.25.65.55
May.
5.5
5.3
5.3
5.04 94.84 9
4.554.554.9
4.64.3
4.14.0
4.03.9 3.83.7
9.6 11.0
8.957.356.5
June.
5.6 5.55.5 8.857.75
7.86.856 26.05.6
6.355.65.255.0
5.4
4.05
4.34.1 3.953.753.7
3.63 7C
3.73.53.35
July.
3.3
3.2 3.13.0
o 952.92 O
2.8
9 7962.62.52.5
2 A
9 42.42.30 3
2.252.2 2 92.1
2.1 2.02.02.02.01.9
Aug.
1.9 1.91.9 1.91.9
1.8
1 81.8
1.75
1.71.7
1.71.71.651.71.7
1.71.75 1.751.7
1.7
1.71.71.7
Sept.
1.71.651.65 1.651.65
1.6
1.61.61.6
1.7
1.651.651.61.6
1.61.6 1.651.7
1.6 1.61.61.61.6
Oct.
1.6 1.61.6 1.551.55
1.55
1.551.55
1.551.551.551.6
1.61.61.61.6
1.551.6 1.61.61.6
1.6 1.6
1.61.61.6
Nov
1.6 1.61.8; 2.43.2-
2.22.01.9i.s:1.8
1.81.7f1.7f1.7f1.8
1.81.8
1.7
1
i!i.
i."i.\f1.7
Rating table for Sacramento River near Red Bluff, CaL.for 1904-1906.
Gage height.
Dis charge.
Feet. < Sec.-ft.1.40 5,4101. 50 5, 650l.CO1.701.801.902.002.102.202.302.402. 50
5,9206, M)6,4606,7307,0007,SOO7, COO7,5008,2008,500
Gage height.
Feet.2.602.702.802.903.00
Dis- ! Gage charge, height.
Sec.-ft. Feet.S, 810 3. 809, 120 3. 909,430 4.009, 740 4. 20
10, 050 , 4. 403. 10 10, 3803.203.303.403.50a eo3.70.
10,71011,04011,37011,70012, 04012,380
4.604.805.005.205.405.605.80
Dis charge.
Sec.-ft.12, 72013,06013,40014, 12014,84015,58016,34017,10017,90018,70019, £0020,300
Gape Dis- Gage height, charge, height.
Feet.6.006.206.406.606.807.008.009.00
10.0011.0012.0013.00
Sec.-ft.21,100
Feet.14.00
21,940 15.0022, 78023, 62024, 4CO25, 30029, 70034,30039,10044,20049,70055,600
16.00
Dis charge.
Sec.-ft.61, 70068, 20075, 100
17.00 82,:CO18.0019.00
89, 70097, COO
20.00 105,90021.00 114, COO22.0023.0024.00
123, 700133, 200143. 100
NOTE. This table is based on discharge measurements made during 1902-1906 and is well defr
Monthly discharge of Sacramento River near Red Bluff, Cal.,for 1906. [Drainage area, 9,300 square miles.]
Month.
July..............................
The vear. ..................
Discharge in second-feet.
Maximum.
129,000 54,100
137,000 71,600 44, 200 33,000 11,000 6.730 6,320 5, 920
10, 900 59,500
137,000
Minimum.
5,410 8,500
18,500 19,100 12,400 11,200 6,730 6,OCO 5,920 5,780 5,920 6,060
5,410
Mean.
14, 700 23,200 42,500 26,300 19,400 18, 100 8,530 6,330 6,020 5,870 6,570
15,400
16,100
Total in acre-feet.
904, 000 1,290,000 2,610,000 1,560,000 1,190, COO 1,080, COO
524, 000 389,000 358, 000 361,000 391,000 947, 000
11,600,000
Run-
Sec. -ft. per sq. mile.
1.58 2.49 4.57 2.83 2.09 1.95 .917 .681 .647 .631 .706
1.66
1.73
NOTE. These values are excellent.

SACRAMENTO EIVEB DRAINAGE BASIN. 103
MISCELLANEOUS MEASUREMENT IN SACRAMENTO FIVER DRAINAGE
BASIN.
The following measurement was made of Sacramento River at Baird station, on the Southern Pacific Railway, ner.r Gregory, Cal., October 9, 1906:
Width, 115 feet; area, 300 square feet; discharge, 315 second-fe-st.
PIT RIVER DRAINAGE BASIN.
DESCRIPTION OF BASIN.
Pit River has its source in the Warner Mountains in the extreme- northeast part of California. It flows in a southwesterly direction, dis charging its waters into Sacramento River a few miles above Redding, Cal. It has numerous tributaries, the larger of which have their source in large springs, which discharge from crevices in the lava formation. About 50 per cent of the area of this drainage basin is barren of timber and composed principally of lava with a light soil covering, being used extensively for pasturage and the raising of stock. There are numerous small valleys with light grades, which hold the water throughout the summer months principally in the ptate of swamps. These areas are used mainly as meadow land and for the raising of stock feed. Pit River does not discharge in any great volume until it reaches a point near Fall River Mills, which lies about midway between the point where the Pit River enters the Sacramento and its source. Fall River, which is the principal tributary of the Pit from the north, receives its water supply from large perennial springs which discharge 1,500 second-feet. Hat Creek and Burney Creek are also large tributaries from the south and drain the northern slope of Lassen Peak. Their principal sources are also f:-om large peren nial springs in the lava formation.
West Valley Creek is a tributary of South Fork of Pit River. Ash Creek flows into Clear Creek, through which it enters Pit River from the south. There is considerable timber scattered throughout this drainage basin, the principal growth lying in the southern portion of the basin and also in that section lying north of Pit River and between Fall River and the upper Sacramento. There are numerous reser voir sites on the upper reaches of this stream, all of which have been or are being surveyed. Several gaging stations aro maintained on Pit River and tributaries at points where surveys have been made for the construction of storage reservoirs. The rainfall throughout this basin is very unevenly distributed, ranging from 10 inches in the eastern portion to 50 to 75 inches in the western and northwestern portion. About 50 per cent of the precipitation falls in the form of snow, but does not remain any length of time except on the higher elevation of Mount Shasta and Lassen Peak.

104 SURFACE WATER SUPPLY, 1906.
McCloud River drains the southeastern slope of Mount Sha Its drainage area is comparatively small, covering 676 square m It is long and narrow, extending from north to south. There few tributaries. Its main water supply comee from Mount Sha on which the snow remains during the entire year. It is also fee numerous large springs scattered throughout the drainage b& The precipitation is very heavy and is principally in the form of r except on the higher elevations of Mount Shasta. The discharg this stream seldom falls below-1,200 second-feet. It discharges : the Pit River a few miles above the junction of the Pit with the ! ramento. The entire basin is well timbered.
PIT RIVER NEAR BIEBER, CAL.
This station was established January 22, 1004. It is locate:" miles below Bieber, Cal., near Muck Valley. The conditions at station and the bench marks are described ir Water-Supply PF No. 177, page 136, where are given also references to publications 4 contain data for previous years.
Discharge measurements of Pit Hirer near Bieber, Cal., by F. H. Holabird. in 19
Date.
January 29 « . . February 3 a.. February 5 a.. February 80.. February 10 a. February 12 . . February 14 . . February 16 . . February 17 . . February 19 . . Februarv 21 . . February 23 . . February 26 . . February 28 ...
March 12.......
March 18.......March 20.......March 21. ......
March23b.....
April 8. ........
AVidth Area of Width. sectton
Feet. 213 209 209 207 207 205 207 220 219 220 220 224 220 224 215 224 230 219 219 222 224
224 224 224 224224
Sq.ft. 870 680 680 615 615 637 723 962 942 987
1,050 1,100
942 1,120
892 1,150 1,270
942 942 985
1,210 1,680 1,190 1,100 1,080 1,100 1,100
Gage height.
Feet. 5.90 5.00 5.00 4.70 4.70 4.80 5.20 6.30 6.20 6.40 6.70 6.90 6.20 7.04 6.00 7.10 7.65 6.25 6.20 6.50 7.52 9.50 7.30 6. 90 6.85 6.90 6.95
Dis charge.
Sec.-ft. 1.820 1,320 1,180
938 877 983
1.310 2,660 2,430 2,690 3.190 3,530 2,420 3,680 2,090 3 640 4,610 2.3SO 2.390 2,760 4,340 9,500 3,930 3,330 3,260 3,280 3,310
Date.
April 9.........April 12. .......April 13........April 14. .......April 15........
April 19. .......April 20........April 27........
May 12.........May 19.........
August 11 ..... August 25 .... September 1 . . September 8 . . September 15 . September 23 September 29 October 7 . . . - October 14. . . October 26. . .
Width.
Feet. 224 220 219 219 214 217 214 210 207 207 207 207 207 207 193 193 98 68 68 68 68 68 68 68 68 98
Area of section.
Sq. ft. 1,100
986 942 917 870 853 826 807 740 616 616 660 596 573 512 473 176 128 128 128 132 137 128 130 141 208
Gage height.
Feet. 6.90 6.40 6.20 6.10 5.90 5.80 5.70 5.60 5.32 4.70 4.70 4.90 4.60 4.50 4.35 4.10 2.30 1.80 1.80 1.80 1.90 2.00 1.85 1.90 2.00 2. fiO
cr
s
a Measured by Toler and Holabird.* Velocities not measured in entire cross section; discharge probably too great.

PIT RIVER DRAINAGE BASIN. 105
Daily gage height, in feet, of Pit River near Bieber, Cal.,for 1906.
Day. Jan.
1..... .............. ........9
3................... ........4. .................. ........
8................... ........Q
10................... ........n:............. .............12. .........................1114.. .............. . .......15. .................. 3. 4516. .................. 4. 3517. .................. 4. 2518........... ..... . 4.619................... 5.820. .................. & 4
23. .................. 7. 324. .................. 7. 8
26................... 6.027...................I 6.128................... 6.199 g 1
31................... 5.8
Feb.
5.55.05.05.05.04.84 74.7
4.7
4.74.85.15.25.86.3
6.26.26.46.4
7.2a Q
6.56.26.47.0
Mar.
6.76.56.36.056.16.06.06.06.46.87.07.1
7. 16.86.36. 1P. 9
6.46.26 47.49
'K
11.5
11.010.29.38.6
8.4
Apr.
9.18.37.87.36.96.856.96.956.96.8
6.5a46.26.16.05.95.85.8
5.55.45.45.2
5.25.35.35.2
May.
5.15.14.94.84. 74.4.4.4.4.
4.4.4.84.94.94.84.84.84.9A Q
A Q
4.8
4.654.6
4.64.64.64.64. 64.6
June.
4.54.54.54.54.54.44.44.44.354.3
4.34.2
4.24.2414.14.04.0
3.43.35
3.554.2
4.24.24.24.24.1
July.
4. 14.04.03.83.83.83.83.853.853.7
3.73.73.73.53.53.53.43.43.353 0C
Aug.
2.62.62.62.62.62.52.52. 42.32.32.32.3<7 Q
2.92.62.42.22.2
1.8
1.81.81.81.81.81.8
Sept.
1.81.81.81.81.81.81.81 Q
1.91.92.02.02.01 9
1.91 92.02.02.0
1.91.91.91.85
Oct.
1. 851. 851.91.91.91.91.91.91.92.02.02.02.0
Rating table for Pit Rivtr near Bieber. Cal.,for 1906.
Gage Dis-height. charge.
Feet. Sec.-ft.
Gageheight.
Feet.
Discharge.
Sec.-ft.1.80 21 2.90 1081.90 24 3.00 1202. 00 29 ' 3. 102. 10 35 3. 202.20 41
.30 49
.40 57
.50 66
.60 76
.70 86
.80 96
3.303.403.50
135154177205240
3. 60 2763.70 3163.80 , 3563.90 400
Gageheight.
Feet.4.004.104.204.304.404.504.604.704.804.90
Discharge.
Gageheight.
Sec.-ft. Feet.450500560620
5.005.205.405.60
685 5. 80755 6. 00825 6. 20900 6.40980 6. 60
1,060 6.80
Dis- Gagecharge, height.
Sec.-ft. Feet.1,140 7.001,3201,5001,7001,9002.1202,3602,630
7.207.407.607.808 009 00
10 002,920 11.003,220 12.00
Discharge .
Sec.-ft3,5203,8404,1604,4804,8205,1807,1409,600
12,40015,200
NOTE. This table is based on 53 discharge measurements made during 1906 and is well defined below gage height 7.5 feet.
Monthly discharge of Pjt River near Bieber, CaL.for 1906. [Drainage area, 2,950 square miles.]
Month.
April.............................
July (1-21)..... ..................
Discharge in second-feet.
Maximum.
4,820 3,840
13,800 7,360 1.230
755 500 108 29 29
Minimum.
222 900
2,120 1,280
825 190 177 21 21
Mean.
2,150 1,930 4,640 2,590
948 544 311 «51 « 24
- 25
Total in acre-feet.
72,500 107,000 285,000 154,000 58,300 32,400 13,000 3, 140 1,430
645
727,000
Run-off.
gee. -ft. per Depth in sq. mile. inches.
0.728 .654
1.57 .878 .321 .184 .105 .017 .008 .008
0. 46 .68
1.81 .98 .37 .21 .08 .02 .009 .004
a Discharges interpolated for days when gage was not read.
NOTE. Values are rated as follows: January to June, excellent; July, good; Aupust to October, fair.

106 SUEFACE WATER SUPPLY, 1906.
M'CLOUD RIVER NEAR GREGOEY, CAL.
This station was established March 23, 1902, in cooperation the McCloud River Electric Company. It is located at Johns C near Hirze Mountain, 14 miles east of Gregory post-office, Cal. Station, on the Southern Pacific Railroad, is just across Sacran River from Gregory. The conditions at this station and the t marks are described in Water-Supply Paper No. 177, page 147, v are given also references to publications that contain data for pre years.
Discharge measurements of McCloud River near Gregory, Cal., in 1906.
Date.
April 12. .......Mav 17. ........
Hydrographer.
.....do.........................................R. S. Hawley ..................................
.....do.................. ...... ..............
Width.
Feet. 143152104105104100
Area of section.
Sq.ft.1,0801,330
556085637576
Gage height.
Feet. 6.057.401.903.072.451.56
a. Measured by floats.
Daily gage height, infect, of McCloud River near Gregory, Cal.. for 1906.
Day.
1.... ...........
3...............4...............5 .
6...............7...............8...............910...............
11...............12...............13...............14...............15... . .......
16...............17...............ift19...............20..... ....
21...............22...............23...............
25...............
20...............27. .. ...... 2f>.. ...... .......29...............30. ..............31...............
Jan.
1.61.61.551.55
1.55
1.551.551.6
1.72.82.252.12.55
6.153.1c: Qc
5.353.35
3.153.13.02.92 7
2.62.42.22.12.01.9
Feb.
1.851.851.851.81.8
1.81.751.751.81.9
1.91.92.03.23.95
3.352.853 03.63.55
4.453.953.653.83.4
3.23.63.4
Mar.
3.33.33.553.33.0
2.752.82.852.92.85
2.93.93.53.152.95
2.72.62 CC
2.52.5
3.44.44.155.56.45
6.35.24.44.05.257.4
Apr.
5.64.64.153.753.5
3.43.33.33.33.3
3.23.052.952.92.9
2.92.92 Q
2.92.9
2.92.93.053.053.1
3.02.952.952.92 Q
May.
2.852.82.82.82.75
2.72.72.72.652.65
2.652.62.52.75
2.62.52 42.42.35
2.32.32.25
2.25
6.66.255.3
3.7
June.
3.63.64.656.55.65
5.354.64.13.93.8
3.63.453.33.15
3.1'
2.952 QC
2.82.65
2.62.552.52.42.4
2.42.452.42.352.3
July.
2.32.252.252.22.2
2.152.22.152.12.1
2.052.02.02.02.0
1.95
1 Q^
1 91.9
1 9
1.851.85
1.851.81.81.8i fti ft
Aug.
1.81.81.81.81.8
1.81.81.81.751.75
1.71.71.71.71.7
1.71.71.71.71.7
1.71.71.71.71.65
1.651.651.65
Sept.
1.61.61.61.61.6
1.61.61.61.61.6
1.61.61.61.61.6
1.61.61.61.61.6
1.61.61.61.61.6
1.61.61.61.6
Oct.
1.61.61.61.61.6
1.61.61.61.6
1.551.551.55
1.55
1.551.55
1.551.55
1.55
1.55
1.55
Nov
1.5?1.61.72.3?1.7?
1.61.6
1.55
1.5?1.5?1.5?
1.5?1.5?1.5?1.5?1.5?
1 5?1.5?1.5?1.5?1.5?
1.5?
i cr

STONY CREEK DRAINAGE BASIN. 107
Rating table for McCloud River near Gregory, Cal.,for 1902-1906.
Gageheight.
Feet.1.501.601.701.801.902.002.102.202.30
Dis- |! Gage Discharge, height, charge.
Sec.-ft. Feet. Sec.-ft.1,340 2.40 2,0421,402 2.50 2,1401,<63 2.60 2,2421,538 2.70 2,3491,612 2..SO i 2X611,6 JO , 2.90 i 2,5781,772 , 3.00 2,7001.858 i 3.10 , 2,825
Gage Dis-height, charge.
Feet.' 3.30
3.403.503.603.703.803.904.00
1,948 l 3.20 ! 2,955 j 4.20i! i 1
Sec.-ft.3,0903,2303,3803,5353,6053,8604,0304,2104,585
Gageheight.
Feet.4.404.604.805.005.205.405.60
! 5.806.00
Discharge.
Sec.-ft.4,990
Gageheight.
Feet.6.20
5,410 6.405,8406,2806,7207,1707,6308,1108,600
6.606,807.008.00
Discharge.
Sec.-ft.9,1209,650
10, ICO10,74011,30014,250
NOTE. This table is based on discharge measurements made during 1902-1906 and is well defined.
Monthly discharge of McCloud River near Gregory, CaL.for 1906.
[Drainage area, 608 square miles.]
Discharge in second-feettMonth.
Maximum. Minimum.
January. Februa'ry March... April.... May..... J une..... July..... August.. September October November December.
The year.
......................... I 12,400
......................... 7, 630
......................... 10,200
......................... 9, 920
......................... 1,540r........................ 1,400........................ 1,400r... ..................... 2,000........................ .5,620
2,12,51,81.9
1,41,41,31,31,3
Mean.
2,5402,6004,1603,1103,0703,4801,6901,4801,4001,3801,4002,070
Total in acre-feet.
156,000144,000256,000185.000189,000207,000104.00091,00083,30084,80083,300
127,000
Run-off.
fee.-ft. per , Depth in sq. mile. inches.
4.184.286.845.125.05
2.782.432.302.272.303.40
12. 400 I 1.340 2,360 1,710,000
NOTE. These values are excellent.
STONY CREEK DRAINAGE BASIN.
DESCRIPTION OF BASIN.
Stony Creek drains a portion of the Coast Range. It flows in a northerly direction and discharges its waters into the Sacramento River near Orland, Cal. It has numerous tributaries, all of which are torrential in their character. The formation on the higher ele vations is of granite, with good soil covering, and is heavily tim bered. In the lower portion of the drainage basin the formation is shale, sandstone, and conglomerate, with heavy growth of brush and grass. This portion of the basin is used extensively for pas turage. The soil being heavy, it packs readily, causing a large per cent of run-off. The mean average rainfall on the higher elevation is about 40 inches, while on the lower reaches it is 20 inches. The precipitation is almost wholly in the form of rain, with some snow on the upper reaches, which soon melts and only adds to the flood discharge.
The gaging station on this stream is located near th0, point where it emerges from the foothills and enters the Sacramento Valley.

108 SURFACE WATER SUPPLY, 1906.
STONY CREEK NEAR FRUTO, CAL.
This station was established on January 30, 1901. It is lo at Julian's ranch, 7 miles northwest of Fruto, and If miles ? the proposed mill-site dam. The conditions at this station an bench marks are described in Water-Supply Paper No. 177, 153, where are given also references to publications that contain for previous years.
Discharge measurements of Stony Creek near Fruto. Cal.. in 1906.
Date.
March 8........
March 16.......
Mavl8.........
October 14 6 ...
Hydrographer.
R. S. Hawley . . .................. .............
.....do............. ...........................
.....do.........................................
11. S. Hawlev- . .....................................do..............................................do.........................................S. G. Bennett .................................
Width.
Feet. 137
146140140
132
27
26
Area of section.
Sq. ft. 216
412
336271992
94
17 625
Gage height. c
Feet. I 5.70
6.40
6.00
5.025.033.65
3.65
a During the high water of January 18, 1906, the channel at the cable was raised by a del gravel, which was gradually removed during the two or three months following. These m ments were made before the channel had assumed its normal condition.
b Measurement made by wading at section below the gage.
Daily gage height, in feet, of Stony Creek near Fnito, CaL.for 1906.
Day. Js
1...... ......... 42.... ........... 43............... 44............... 45. .............. 4
6. .............. 47............... 48............... 4i) 410............... 4
11............... 412............... 6
14............... 715............... 8
16............... 1217............... 718............... 1419..---..-.....-. 1120. .............. 8
21...............1 722............... 723............... ' (24. .............. t25. .............. t
26. .............. (27............... (28............... (29 ... . . 630............... 531......... .. 5
n. Feb. Mar.
0 5. 8 6 750 58 6 550 58 9 350 58 7. 250 5. 8 6. 7
0 57 650 57 6. 50 57 6. 40 5 7 ' 6. 40 5. 8 6 3
0 60 6 952 61 6 6565 60 6. 4525 7. 85 6 250 7. 35 6 05
5 69 6 06 7. 25 ) 6 05 ' 7 05 5. 90 80 5865 ' 7. 5 58
65 i 7. 45 091 | 7. 25 6 6575 i 7. 15 8055 7. 1 7. 635 7. 0 8. 25
25 6. 8 7. 651 7. 15 7. 451 7. 05 7. 25
9 ....... 11.08 ....... 8. 35
Apr. May
7. 85 5. 47.4 547.05 5.3
6. 55 5 3
64 5263,52
61 52G. 1 o. 2
60 5160 5160 5159 5159 51
5. 8 5. 1
56 50
55 50
5.5 505.4 50
55 5.15. 5 5. 2
5.4 535. 4 5. 5
....... 5. 4
June. July.
53 4.553 4.553 4.45 4 i 4. 45. 3 4. 3
53 4.353 4.25. 2 4. 25 2 4. 25. 1 4. 2
5. 1 4250 4150 4150 4. 150 41
5 1 4. 150 4150 4.150 4.1
, 4. 9 4. 1
4. 9 4. 14. 9 4. 04.8 404. 8 4. 04. 8 3. 9
4.8 394.8 39
> 4. 8 39> 4. 7 3. 8
4. 6 3. 8....... 3.8
Aug.
3 83 83.83 83.8
3 83.83 83.83.8
3 83 '3 '3 '3 -
3 -3 -3 -3. -3."
3 "3 "3 "3 73."
3.63 63 63 63.63.6
Sept. Oct.
3 6 3736 3.73.6 3.73.6 373. 6 . 37
3. 6 3736 3736 373 G 33 6 3.
3 6 3.36 336 33. 6 33 6 3.
36 336 33. 6 33.6 3.3. 6 3
3.6 33.6 3.37 3.37 33.7 3.
37 3.37 3.37 337' 3.3.7 3.
....... 3.
Nov.
3 73 73 83 83.9
3 93 93 93 93 9
3 93 93 93 93.9
3 93 93 93.93.9
3 93.93 93 93.8
3.83 83 83 83.8

CACHE CREEK DRAINAGE BASIN. 109
Rating table for Stony Creek near Fruto, Cal.,from March 8, 1906, to December 31, 1906.
Gagoheight.
Feet.3.603.703.803.904.004.104.20
Discharge.
Sec.-fl.1329487093
119149
4.30 179
Gageheight.
Feet.4.404.504.604.704.804.905.005.10
Discharge.
Sec.-ft.213250290335380430480530
Gageheight.
Feet.
Discharge.
Sec.-ft.5. 20 5805. 30 ! 6405.405.505.605.705. 80.'.90
705780865955
1.0501,150
Gageheight.
Feet.6.006.206.406.606.807.007.207.40
Discharge.
Sec.-ft.1,2501, 4001,6801,9052,1402,3902,6402,890
Gage Dis-hei^ht.
Feet.7.607.808.009.00
10.0011.00
charge.
Sec.-fl.3,1503,4103, 6905,2707,2SO
10.200
XOTE. This table is based on 9 discharge measurements made during 1906 and 3 during 1904, and it, well denned below gage height 6.4 feet.
Monthly discharge of Stony Creek near Fruto, Cal.,for 1^06.
[Drainage area, 760 square miles.]
Month.
Vpril.............................
July..............................
Discharge in second-feet.
Maximum.
22,200 3,320
Kt,200
1,200 705 250
48 29 29 70
5,270
22,200
Minimum.
150 480
1,050 705 480 290
48 13 13 29 29 48
13
Mean.
2,230 1,540 2,500 1,280
610 495 127 32.6 17.3 29.0 61.4
582
792
Total in ac re-feet.
137,000 85, 500
154,000 76,200 37.500 29,500 7,800 2,000 1,030 1,780 3,650
35.800
572,000
Run-off.
S°c.-ft. per sq. mile.
2.93
Depth in inches.
3.382.03 2.113. 29 3. 791.68 1.87.803.651
.93
.73. 167 . 19. 043 . 05.023 ! .03.038.081.766
1.04
.04
.09
.88
14.10
NOTE. Discharges were obtained from the 1905 table, January 1 to 15, and by the indirect method for shifting channels, January 16 to March 7. Values are rated as follows: March to July and Decem ber, good; remainder of 1906, fair.
MISCELLANEOUS MEASUREMENTS IN STONY CREEK DRAINAGE BASIN.
The following miscellaneous measurements were made of Stony Creek just above its junction with Little Stony Creek:
September 18: Width, 26 feet; area, 38 square feet; discharge, 26 second-feet. October 13: Width, 26 feet; area, 34 square feet; discharge, 21 second-feet.
CACHE CREEK DRAINAGE BASIN.
DESCRIPTION OF BASIN.
Cache Creek drains that portion of the eastern slope of the Coast Range directly north from the Puta Creek basin. This basin is long and narrow, extending from northwest to southeast; it has numerous tributaries, of which North Fork is the largest. Most of these tribu taries are torrential in their character, but the flow of the main stream is regulated largely by its discharge from Clear Lake, which is fed by numerous creeks having their source in the higher portion of the drainage basin. The lake covers an area of 65 square miles, and

110 SURFACE WATER SUPPLY, 1906.
has a drainage area of 417 square miles. The streams that ent' Cache Creek below Clear Lake are practically dry during the sumrr months. There are large cultivated areas on the west side of Clef Lake, a greater portion of which is meadow land need for stock raisins There are two gaging stations located on this stream one at Low( Lake directly at the point where the stream discharges from the ta 1 and one at Yolo a short distance below where it emerges from the foo hills. There are numerous diversions above the gaging station ( Yolo which take practically the entire flow during the summer month. This water is used for irrigation in the vicinity of Woodland and Yo1 where the soil is rich and deep and susceptible of the highest state ( cultivation.
CACHE CREEK AT LOWER LAKE, CAL.
This station was established January 1, 1900. It is located thre' fourths mile from Lower Lake, Cal. The conditions at this statio and the bench marks are described in Water-Supply Paper No. \T page 169, where are given also references to publications that contai data for previous years. The following measurement was mad March?, 1906:
Width, 64 feet; area, 301 square feet; gage height, 6.80 feet; discharge, 999 seconc leet.
Daily gage height, in feet, uf Cache Creek at Lower Lake, Cal., for 1'HHJ.
Day.
1... ............
3...............
ti... ............
i5::: : ::::::::::: 11............... 13'...'..'.....'.....15...............
16.... ...........i $
21...............99i:::::::::::::::24... ............
26...............27...............28............... 29...............30...............31...............
Jan.
2.52.59 52.5
2.5 2.452.5 2X5 2.5
2.5 2.75 2.9 3.053.2
4.754.0
5.3
5.3K. A
5.4 5.4 5.45
5.45.45.4 5.45.45.35
Feb.
5.35 5.35.3
5.3
5.35.255.25 5.25 5.25
5.25 5.2 5.2 6.15.4
5.4c A
c r:
5.9
:> s5.96.1 6.26.2
6.26.46.5
Mar.
6.35 6.257.2 6.756.8
6.8 6.86.8 6.8 6.8
6.8 7.1 7.1 7.37.0
7.07.06 9
7.2
7.3
7.5 7.6 7.75
8.058.18.1 8.18.89.3
Apr.
8.9 8.98.95 8 98.9
8.85 8.858.8 8.8 8.75
8.55 8.45 8.35 8.38.4
8.2
7 9
7.65
7.67.47.4 7.35 7.3
7.257.57.2 7.17.0
May.
7.0 6.96.9 6.86.75
6.65 6.66.o5 6.5 6.45
6.5 6.35 6.35 6.56.35
6.36.25
6.156.1
6.05 6.05.9 5.85 5.9
5.95fi.O5.95 5.955.95.9
June.
5.85 5.855.8 5.8
5.75 5.75.7 5.65 5.6
5.6 5.55 5.5 5.55.45
5.45
5.45.45
5.4 5.355.3 5.3 5.25
5.255.255.2 5.155.1
July.
5.1 5.15.05 5.055.0
5.0 4.954.95 4.9 4.85
4.85 4.8 4.8 4.84.75
4.7
4.6
4.6 4.554.55 4.4 4.5
4.454.454.44.44.44.35
Aug.
4.35 4.34.3
4.25
4.25 4.254.25 4.2 4.2
4.15 4.15 4.1 4.14.05
4.0
3 QE
3.93.85
3.85 3.853.8 3.8 3.8
3.753.753.7 3.73.73.65
Sept.
3.65 3.63.6 3.63.6
3.55 3.553.55 3.55 3.4
3.4 3.45 3.5 3.453.4
3.350 Or
> «ie
3.3
3.3 3.253.35 3.35 3.25
3.253.253.25 3.23.2
Out.
3.2 3.25
3.25
3.2
3.15 3.153.15 3.15 3. 15
3.2 o. 2i 3.15 3.13.1
3.15
3.13.03.0
2.95 2.92.9 2.9 2.9
2.92.92.9 2.9
2.9
Nov.
2.92.852.85
2.85
2.9 2.92.9 2.9 2.9
2.9 2.95 2.95 2.952.95
2.93.09 9
2. 852.85
2.952.8
2.85 2.85
2.82.752.752 O
DM
2.
9.-,
99
2. . 3!
a.:3.,3.;
3
3
3.
3. 3.3,
3.3.3v3 (4.(

CACHE CEEEK DRAINAGE BASIN. Ill
Rating table far Cache Creek at Lower Lake, Cal.,for 1905-6.
Gage height.
Feet.2.402.502.602.702.802.903.003.103.20
Dis charge.
Sec.-ft.27374859718395
108121
Gage height.
Feet.3.303.403.503.603.703.803.904.004.10
Dis charge.
Sec.-ft.135149163178194212232252274
Gage height.
! Feet.
Dis charge.
Sec.-ft.4.20 , 2964.304.404.504.604.70
318341365390416
4. 80 4424. 90 4695. 00 | 4S6
Gage height.
Feet.5.205.405.605.806.006.206 406 606.80
Dis charge.
Sec.-ft.552610670732795859923988
1,054
Gage height.
Feet.7.007.207.407.607.808.009.00
Dis-height.
Sec.-ft.1,1201,1881,2561,3241,3921,4601,840
NOTE. This Table is based on discharge measurement * made during 1904-6 and is we1 ] defined below ; ge height, 7 feet.
Monthly discharge of Cache Creek at Lower Lake, Cal.,for 190H.
[Drainage area, 500 square miles.]
Month.
\ ->ril .............................
riiv. .............................
Discharge in second-feet.
Maximum.
625 955
1,960 1,820 1,120
748 524 330 186 128 95
252
1,960
Minimum.
32 552 875
1,120 748 524 330 186 121 83 65 59
32
Mean.
316 676
1,220 1,510
894 639 423 256 150 103 79.4
133
533
Total in acre-feet.
19,400 37,500 75,000 89,800 55,000 38,000 26,000 15.700 8,930 6,330 4,720 8,180
385,000
Run-off.
See. -ft. per sq. mile.
0.632 1.35 2.44 3 02 1.79 1.28
.846
.512
.300
.206
.159
.260
1.07
Depth in inches.
0.73 1.41 2.81 3.37 2. 00 1.43 .98 .59 .33 .24 .18 .31
14.44
NOTE. These values are excellent.
CACHE CREEK NEAR YOLO, CAL.
This station was established January 1, 1903. It is located at the vagon bridge on the road from Woodland to Yolo, about 1,000 feet a,bove the Southern Pacific Railroad bridge. A new wagon bridge, vhich greatly improves the channel conditions, was erected during 1904. The station was reestablished on the new bridge December 4, 1904. Numerous diversions are made from Cache Creek above this station which take practically all of the summer flow. The condi tions at this station and the bench marks are described in Water- Supply Paper No. 177, page 172, where are given also references to publications that contain data for previous years.

112 SUKFACE WATEE SUPPLY, 1906.
Discharge measurements of Cache Creek near FoZo, Cal., in 1906.
Date.
February 20.. .
March 13 ......April 13 .......
May 1 -..-.....
May 7 .........
May 7 .........May 7 .........May 1 .........May 8 .........May 15........
July 30........
Hydrographer.
F. R. S. Buttemer. ............................
.....do.........................................
.....do.........................................R. S. Hawlev.... ..............................
. ....do. ...'.. ...................................
......do.........................................
.....do.........................................
.....do........................................
.....do.........................................
.....do............................................do.........................................
.....do.........................................R. S. Hawley.......................................do..............................................do.........................................
Width.
Feet. 939797
10210299979683
1331331331331339896999110
Area of section.
8g. ft.262445479578592482428380127
2,1802,1502,2302,2402,270
40033816013728
Gage height.
Feet. 3.885.155.796.606.856.055.364.952.25
19.9519.7220.4020.4320.654.994.492.502.101.00
ch
£
<
''
11(1'1V
NOTE. A landslide occurred in Cache Creek canyon, above the station, on May 2, damming th This dam was overtopped on May 7, when the creek rose to a maximum gage height of 20.8 feet measurements of this date were made at the crest of the flood.
Daily gage height, in feet, of Cache Creek near Yolo, Cal.,for 1906.
Day.
1.. .............03".".".!!!"."!".!!".".4
789.
10. .............
11...............
13...............14...............
16...............17...............18...............19...............20...............
21 ... ...........22...............23... ...........24...............25...............
26. .. ....... . . 27...............28............. . 29. 30. . ............ 31.. .. ......
Jan.
4.356.3A AZ
9.914.014.0525.710.25
6.755.85.355.054 0
5.6 4.44.3 4.2 4.15 4.1
Feb.
4.054.0 3.951 Q^
3.9
3.853.8
3.75
3.73.73.73.76.85
5.2
5.456.655.8
7.87.256.48.37.45
6.0 5.655 8
Mar.
5.55.2 5.558.56.7
5.855.65.55.4
5.39.37.256.45
5.85.65.55.45.3
7.257.06.7
10.79.95
11.0 9.257.95 7.3 9.65
15.85
Apr.
10.08.6
7.67.3
7.06.86.7
6.4
6.356.36.16.05.9
5.85.75.75
5.55
5.455.45.45.35.25
5.2
5.3 5.2 5.1
May.
5.04.55
2.62.25
2.212.15.14.74.6
4.6
4.64.5
4.4
4.34.34.25
4.24.15
4.054.2
4.55 4.74.85 4.7 4.45
June.
4.34.2
4.14.1
4.03.95 } Q
3.83.83.83.75o 7
3.653.653.653.63.5
3.43.43.353.33.25
3.2 3.23.2 3.2 3.15
July.
3.13.1O (\
3.0
2.652.62.62.6
2.52.52.52.52.45
2.45
2.42 OK
2.3
2.32.32.352 32.3
2.25
2.2 2.2 2.15 2.15
Aug.
2.152.1
2.02.0
1 Q^
1.951.951 QC
2.0
2.02.02.02.02 o
2.0
1.951 Q^
1.8
1.71.71.651.71.75
1.75 1.71.7 1.65 1.65 1.65
Sept.
1.651.65
1.61.6
1ft1.51.51.51.5
1.51.51.451.451.45
1.45i 4C
1.45
1.35
1.31.31.3i 9<;1.25
1.2
1.15 1.1 1.1
Oct.
1.11.1
1 Q
1.05
1.01.0
1.01.01.0
95
.95
9g
9.9
9.85
.85e£
.85
.85
.85
.85
Nov.
0.85.85
OC
.8
.8
.75
.75
NOTE. The creek was dry January 1 to 12 and November 17 to December 10. The gage hei May 7 is the mean of a large number of readings at short intervals.

PUTA CREEK DRAINAGE BASIN. 113
Rating table for Cache Creek near Yolo, Cal.,for 1906.
Gage height.
Feet.0.901.001.101.201.301.401.501.601.70
Dis charge.
Sec.-ft.03
1732486585
105125
Gage height.
Feet.1.801.902.002.102.202.302.402.50
Dis charge.
Sec.-ft.145169193217243271299328
Gage height.
Feet.2.602.702.802.903.003.103.203. 30
Dis charge.
Sec.-ft.358388420455491530570610
Gage heignt.
Feet.3.403.503.603.703.803.904.004.20
Dis charge.
Sec.-ft.650692737785835887941
1.053
Gage height.
Feet.4.404.604.805.005.205.405.605.80
Dis charge.
Sec.-ft.1,1681,2841,4051,5371,6711,8051,9392,073
NOTE. This table is based on discharge measurements made during 1906 and is well defined between gago heights 1 foot and 7 feet. Above gage height 5 feet the rating curve is a tang?nt, the difference being 07 per tenth.
Monthly discharge of Cache Creek near Yolo, Cal.,for 1906.
[Drainage area. 1,280 square miles.]
Month.
April.............................
lulv. ..........---...--...--.....
Discharge in second-feet.
Maximum.
15,400 3,750 8,810 4,890 6,290 1,110
530 229 115 181
0 3,250
15,400
Minimum.
.785
1,670 1,600
243 550 229 115
17 0 0 0
0
Mean.
2,000 1,660 3,040 2,360 1,270
784 333 166 69.4 13.6 0
435
1,010
Total in acre-feet.
123,000 92,200
187,000 140,000 78,100 46,700 20,500 10,200 4,130
830 0
20,700
729,000
Run-off.
Sec.-ft. per sq, mile.
1.56 1.30 2.38 1.84 .992 .613 .200 .130 .054 .011 .00 .340
.7BO
Depth in inches.
1.80 1.35 2.74 2.05 1.14 .OS .30 . 15 .00 .01
1.00 .34
10. 07
NOTE. Values are rated as follows: January and September, pood; October, fair; remainder of 1906, excellent.
PUTA CREEK DRAINAGE BASIN.
DESCRIPTION OF BASIN.
Puta Creek drains a portion of the eastern slope of the Coast Range, its waters discharging into Sacramento River, through what is known as the Yolo basin, in the vicinity of Davis, Cal. This basin is rather long and narrow, extending from west to east; it has numerous tribu taries which have a heavy flood discharge during the winter months, but are practically dry during the summer. This stream is torrential in its flow. It has a comparatively small drainage basin with an exceptionally heavy rainfall, especially on the higher elevations in the vicinity of Mount St. Helena. A five-year rainfall record at Helen Mine, on the northern slope of Mount St. Helena, gives an average of 99.52 inches. The precipitation is less at lower elevations. The upper reaches of the basin are well timbered, but the lower part is comparatively barren of timber, though it has a considerable growth of brush extending to a point where the stream leaves the foothills.
8591 IBB 218 07 8

114 SURFACE WATER SUPPLY, 1906.
The areas in the lower portion of the basin are used principally pasturage. The topography of the country is rough and precipi' The underlying rock is an impervious slate and serpentine, with a soil covering. There is comparatively little tilled land in the V above where the stream emerges from the foothills at Win Below this point the soil is deep and susceptible to high cultiva and at present is used for raising grain and fruit.
PUTA CREEK NEAR GUENOC, CAL.
This station was established February 12, 1904. It is loc about 2 miles below the old town of Guenoc, near the Asbill r house and at the Guenoc dam site. The nearest post-office i Middletown, Cal. The conditions at this station and the bench m are described in Water-supply Paper No. 177, page 180, where given also references to publications that contain data for years.
Discharge measurements of Puta Creek near Guenoc, Cal., in 1906.
Date.
March 21 .......
May 7..........
July 27. ........July 28.........
Hydrographer.
S. Asbill...................... .....................do..............................................do..............................................do..............................................do..............................................do..............................................do................................. .............do.........................................R. S. Hawley......... ..............................do..............................................do. .............................................do..............................................do. ............................. ...........
.....do.........................................
.....do.........................................
.....do.........................................
.....do.........................................
.....do.........................................
Width.
Feet. 1451521261241241259494939382
114174
8282
632&32&20b20
Area cf section.
1,300'1.8CO
070
8308152022291531361674?0320
7878
o39b37
b 13. o&13.2
Gage height.
Feet.
14.258.608.007.807.906.256. 355.595.505.487.006.525.004.994.844.824.294.28
Cb
£
a Measured by floats. & Wading section.
Daily yaye height, in feet, of Puta Creek, near Guenoc. CaL.for 1906.
Jan.
3.73.73.73.73.7
3.73.73.73.7
4.08.59.2
10.510.0
Feb.
4.94 94.94.94.8
4.85.04.94.94.8
7.06.96.456.355.55
Mar.
5.56.06.656.355.8
5.45.45.35.35.3
5.35.25.45.65.5
Apr.
6.3
6.05.85.7
5.65.65.65.55.5
5.45.45.45.35.2
May.
4.94.94.94.84.8
4.84.84.84.84.8
4.84.84.84.84.8
June.
5.05.2"5.95.45.1
5.15.05.05.05.0
5.55.35.25.15.0

PUTA CREEK DRAINAGE BASIN. 115
Daily gage height, in feet, of Puta Creek, 'near Guenoc, Cal.,for 1906 Continued.
Day.
16............................................17............................................18............................................19............................................20............................................
21 ............................................22............................................23............................................24............................................25............................................
20 ............................................97
2930............................................31............................................
Jan.
11.059.55
13.258.256.15
5.7
5. 45
5.25
5.25.25.1
5.05.0
Feb.
5.45.76.26.56.6
6.456.67.157.46.5
6.1
Mar.
5.45.45.55.56.4
6.350.357.48.17.8
7.56.36.3
6.47.8
Apr.
5.15.04 94.94.9
4.84 95.15.15.0
5.05.05.04.94.9
May.
4.84.84.'8
4.8
A 0
4.84 0
4.86.8
6.65. 6£5 4
5.15.0
June.
5.04.94.94.84.8
4.8
4.74.74.7
4.74.74.6
4.6
July.
4.34.34.34.34.3
4.34.34.34.34.3
4.24.2
4.24.2
Rating table for Puta Creek near Guenoc, Cal.,for 1906.
Gage height.
Feet.4.004.104.204.304.404.504.004.704.804.90
Dis charge.
Sec.-ft. ;1
Gage height.
Feet.5.00
4 . 5. 109 ' 5. 20
19 5.3029 5. 4043 5. 50
Dis charge.
Sec.-ft.155190230270315365
63 5. 60 42083 5. 70
105 .5. 80129 5. 90
480540010
Gage height.
Feet.6.006.10
Dis charge.
Sec.-ft680760
6. 20 8506. 30 9406.40 1,0356.506.606.706.806.90
1,1351,2401,3601,4801,600
Gage height.
Feet.7.007.237.407.607.808.008.208.408.008.80
Dis charge.
Sec.-ft.1,7201,9002,2002,4802,7603,040
Gage height.
Feet.9.009.209.409. CO9.80
Dis charge.
Scc.-ft.4, 6<05,0005,3CO5, 7200, 080
10.00 0,4403,340 i 11.00 8,2403,650 i 12.00 10, 0^03.970 1.3.004,300
11,840
NOTE. This table is based on discharge measurements made during 1906, and is well defined between gage heights 4.3 feet and 8 feet.
Monthly discharge of Puta Creek near Guenoc, Col., for 1906.
[Drainage area, 91 square miles.]
Month.
February ............ ...... ....
July..............................
Discharge in second-feet.
Maximum.
12,300 2,200 3,190
940 1.480
365 63
Minimum.
0 105 230 105 105 63
9
Mean.
1,800 727 916 302 215 165 26.8
Total in acre-feet.
111,000 40,400 56,300 18,000 13. 200 9,820 1.650
Run-off.
Sec.-ft. per sq. mile.
19.78 7.99
10.07 3.32 2.36 1.81 0.294
Depth in inches.
22.81 8.32
11.61 3.70 2.72 2.02 0.34
NOTE. -Discharges interpolated for days when gage was not read. Values are rated as follows: January and July, good; remainder of the period, excellent.

116 SURFACE WATEE SUPPLY, 1906.
PUTA CREEK AT WINTERS, CAL.
Tliis station was established September 26, 1905. It is loc about 450 feet below the Southern Pacific Railroad bridge and a 800 feet southeast of the depot at Winters, Ol. The conditior this station and the bench marks are described in Water-Supply P No. 177, pages 182-182.
Discharge measurements of Puta Creek at Winters. Col., in 1906.
Pate.
May 15.........
July 26.........Julv27.........
Ilydrographer.
R. S. Hawlev. ................................F. R. S. Buttemer. .......................... ......do....................................... ......do..............................................do..............................................do.........................................
R . S. Ilawlev. .................................
.....do.........................................
.....do.. .......................................
.....do.........................................
Width.
Feet. 178170182180178179128123150805050505050
Area of section.
8q. ft. 1,240
2871,300
809410036160146134
754446262420
Gage height.
Feet. 9 90
10.558.507.02
5.805.784.904.754 7<i4.62
4.70
eh
Sc
r
1
a New gage; old gage reading 4.60 feet.
NOTE. Measurements of May 4 and after were made by wading 200 feet above the cable,
Daily gage height, in feet, of Puta Creek at Winters, CaL.for 1906.
Day.
1... ............
3...............4............... 5.. .............
6............ ..
8g10...............
11. .............1213...............14............... 15...............
16. .............. 17...............18...............19...............20........... ...
21 . ........ »23............... 24...............
26...............27............... 28...............29...............
31..............
Jan,
4.604.614.624.62 4.63
4.644. 644.634.644.64
4.664. 85
10. 7013.00 10. 75
21. 60 12.2022. 8524.0010.80
K. 457.400.91 0.700. 35
6.005.82 5.70 "» "\^
5. 35
Feb.
5.285.205.105.05 5.00
4.954.934.904.874.85
4.905.004.904.90
12.50
7.33 0. 007.158. 267.10
10.088. 607. 55 8.90
a 8. 00
7.100. 75 0.88
Mar.
6.586.35
11.2010.107.62
7.006.886.60
o6.30
6.2011.409.058.28 7.90
7.38 7.126.857.757.60
11.098.759.65
13.5011.80
11.859.70 8.507-88
15. 50
Apr.
10.008.858.007.80 7.50
7.357.157.056. 950.85
0.706.000.50 0.50
0.50 6.400.300.300. 30
0.300.250.30 0.300. 25
0.200. 20 0.20
May.
a6.10a 6. 1006. 05
6.00 o6.00
5.955.905.90
5.80
5.805.80
a5.805.80 5.80
5.85 5.805.705.705.70
5.655.605.60 5. 605.60
6.60a 0. 80
7.00
0. 156. 05
June.
0.005.805.755.80 0.00
5.905.805.80
5.60
5.605.555.705.55 5.50
5. 505.455.405.355.20
5.205.105.10 5.155.20
5.105. 30 5.00
5. 00
July.
4.954.904.904.85 4.80
4.804.754.754.654.65
4.054.604.604.60 4.60
4.60 4.554:554.804.70
4.704.754.754.74.75
4.754.75 4.75
4.704.70
Aug.
4.704.704.704.75 4.75
4.754.804.804.804.80
4.754.854.84.75
64.80
4.75 "4.75
4.704.754.75
4.754.754.70 4.704.70
4.754.704.75
a4.754.754.70
Sept.
4.754.754.754.80 4.75
4.754.704.704.704.70
4.704.70
04.704.70 4.70
4.70 4.704.654.704.05
04.704.704.70 4.704.70
4.704.70
04.704.704.70
Oct.
4.704.704.704.65 4.65
4.654.654.654.65
o4.70
4.704.75
o4.754.75 4.70
4.70 4.704.704.704.70
4.654.654.70 4.704.70
4.70o4.70
4.704.754.754.75
Nov.
4.754.704.754.85 4.00
4.904.904.95
4.90
4.904.904.854.85 4.85
4.85 4.854.854.854.85
4.854.85
o4.85 4.854.85
4.854.90 4.904.904.90
a Gage height estimated. A new gage was put in August 15 and read after that date

PUTA CHEEK DRAINAGE BASIN.. 117
I>aily discharge, in second-feet, of Puta Creek at Winters. CaL.for 19U6.
Pay. Jan, ' Feb.
1............. 22 360 ) 99 ggQ
3............. 22 3304 O9 <X)Q
5............. 25 250
0. ............ 25 i 2207............. 25 1 2008. ............ 25 150
10...... ....... 25 100
11 ''"» 10012.. ........... 46 11013... .......... 4.840 SO14............. 7,140 7015.. .......... 4,840 6, (520
1(5............. 17,800 i 1,60017....... ...... 6,300 98018. ............ 19,400 1,53019............. 20,900 2,(ilO 20............ 4,890 1,570
22...... .......I 1.600 ! 3,04023...... ...... 1,160 2,040
26..-....-..-.. 560 i 1,600
28............. 430 i 1,36029 ... .... 400 ... 50............. 380 .... ..31............. 360 .......
Mar.
1,080880
2.020
1,4401,3001.050
920780
6805.6403,2802.5302.170
1,7001.4301,2002,010 1,870
5, 160
3,810.7,760
6,000
2,7109 1302,700
Apr.
4,1403,020
2,0201.740
1,6001,4201,3301,2401.150
1.010920830830
830
660660 660
660610660660610
570
570
May.
480480
390390
365340340315290
290290990290290
315290250250 250
230210210210
895
1.250
530480
June.
450350
450
4003503503019Q4
2872SO273TiO259
252
238231 994
217210203195187
179
163
147
July.
139131
115107
104101989592
8986838076
7°686460 56
' 5248444036
323231313030
Vug. Sept. Oct. >
29 18 1429 18 14
27 18 10
27 18 1026 14 1026 14 1025 14 1025 14 14
24 14 1424 14 1823 14 1822 14 1824 i 14 14
18 , 14 1418 1 14 1414 | 10 1418 i 14 14 18 10 14
18 14 1018 14 1014 14 1414 14 1414 14 14
18 14 1414 14 1418 14 14
18 14 18
>Tov. Doe.
18 4014 40
31 4040 40
40 4040 5252 6452 4040 116
40 4, 79040 1 , 20531 64031 40031 290
31 27331 23931 20631 175 31 160
31 14531 14531 16031 16031 160
31 8, 13040 4, 09040 1,565
40 725. . . . . 725
NOTE. These discharges were obtained by the indirect method for shifting channels, except for the high water in January, which are based on a rating table, using high-water measurements made in January, 1907.
Monthly discharge of Puta Creek at Winters. CaL.for 190ti.
Month.
May........................................
July........................................
Discharge in second -feet.
Maximum. Minimum. Mean.
.......... 20,900. .' 6,620
............! 10, 000......... 4,140
........... 1,250
........... J 450. .... 139
............ 29
............ 24
............ 18
............ 52
............ 8, 130
20,900
22 70
680 525 210 147 30 14 10 10 14 40
10
3, 100 1,330 3,060 1,130
411 266 72.4 21.0 14.7 13.7 34.0
836
857
Total in acre-feet.
191,000 73, 900
188,000 67, 200 25, 300 15, 800 4,450 1,290
875 842
2,020 51,400
622,000
NOTE. The discharge for gage heights above 11 feet is based on measurements made in January, 1907. Values are rated fair.

118 SURFACE WATER SUPPLY, 1906.
FEATHER RIVER DRAINAGE FASIN.
DESCRIPTION OF BASIN.
Feather River drains a portion of the western slope of the Si Nevada extending east nearly to the Nevada State line, a distr of about 75 miles, and north and south for a distance of from ? 40 miles.
The greater portion of the watershed is rough and mountair and has numerous tributaries which drain the slopes of the hi^ mountains. The formation in the southern ard eastern part of basin is of granite, with a comparatively deep soil covering. T1 is also a considerable area composed of lava and other vole matter in the northern part of the basin. Numerous meadows valleys also exist, which tend to maintain a steady flow during dry season. The soil is generally porous and absorbs the mois readily. The entire watershed is well covered with a growth brush and timber, much of which is large enough to make lum ing a profitable industry, with the exception of the meadow IP and valleys, which are used for stock ranges and grazing la There are numerous large springs, especially in the lava distr which supply a more or less steady flow throughout the year. Tl are especially noticeable on North Fork, where there are peren springs discharging from 50 to 100 second-feet. There is little i ficial storage in the drainage area, and the water used for irriga in the valleys is taken from the natural flow of the streams.
The mean annual precipitation is probably from 40 to 60 ir and is well distributed over the area. It falls largely in the forr snow, but disappears in the early part of the summer.
The drainage basin of North Fork of Feather River lies in high sierra almost wholly in the northwestern portion of Plu County. The junction of North Fork with East Fork, or Fea River proper, is in the western part of Plumas County, abou' miles north of Oroville and 15 miles south of Prattville. The er length of the North Fork basin does not exceed 40 miles, ar: area is probably less than 1,000 square miles. This basin is re and mountainous, though there are many large valley mead above Prattville ranging in elevation from 4,000 to 6,000 feet, formation consists of broken and porous lava and other vole matter, especially in the upper reaches, where numerous cones, ters, ashes, and lakes indicate recent volcanic activity. There good covering of porous soil, which absorbs moisture readily equalizes the annual flow in the large number of tributaries in basin. Except in the case of the highest peaks, like Lassen P with elevation of 10,437 feet, which are rocky and barren, there good growth of timber and brush, and on the higher slopes

FEATHER RIVER DRAINAGE BASIN. 119
growth becomes comparatively heavy and suitable for lumbering. A large per cent of the area, however, is meadow land, which per mits profitable stock raising.
This basin has a mean annual precipitation of from 40 to 60 inches, a large percentage of which occurs as snow. A good portion of the rainfall and snow is collected and conserved in the numerous lakes on the higher elevations near the divide, but by far the greater per centage of the precipitation in this basin percolates through the porous surface soil into the vast beds of broken lava and volcanic gravels and sands beneath, where it is impounded in subterranean reservoirs. From the melting snows above and the perennial un derground basins below a well-regulated flow issues from the highest reaches through the numerous mountain streams which gather into a few good-sized channels in the meadows below the higher elevations. These underground reservoirs also supply the many large perennial springs which issue from the borders of the meadows with discharges of from 50 to 100 second-feet. One of the largest of these springs is Dotta Spring, about 3 miles east of Prattville; it has a maximum discharge of 100 second-feet and a minimum of 70 second-feet.
As yet no irrigation or power developments of importance have been made, but the Great Western Power Company has carefully investigated the stream flow near Prattville and the storage possi bilities in a portion of Big Meadows with a view to earV development.
The watershed above Prattville is divided into two smaller basins of almost equal size, the eastern basin being drained by what is known as Hamilton Branch and its tributaries and the western basin by North Fork and its tributaries. The eastern basin ranges in ele vation from 4,300 to 7,500 feet, has an area of 230 scuare miles, and includes the East Arm of Big Meadows and the large, level area called Mountain Meadows, but its run-off is only about half as large as that from the western basin, which has an area of 245 square miles varying in elevation from 4,300 to 10,000 feet and including the West Arm of Big Meadows and the higher elevatiors about Lassen Peak. Hamilton Branch and North Fork unite about 3 miles east of Prattville in the lower edge of Big Meadows. A gaging station is maintained on each stream a short distance above the point of confluence.
For the purpose of studying the water resources of North Fork of Feather River the Great Western Power Company has established and maintained a number of regular stations in the basin at which complete records are kept. These stations were established in the summer of 1905 by W. E. Spear under the direction cf John R. Free man, consulting engineer for the company. During 1906 they were maintained by L. J. Bevan under the direction of ^iele", Cooper & Blackwell, consulting engineers for the company.

120 SURFACE WATER SUPPLY, 19)6.
FEATHER RIVER AT OROVILLE, CAL.
This station was established January 1, 1902. It is located at northeast edge of the town of Oroville, Cal., where Feather Hi breaks from the foothills on the western slope of the Sierra Nevr into Sacramento Valley. The drainage area ie 3,640 square mi The conditions at this station and the bench marks are described Water-Supply Paper No. 177, page 155, where are given also rei ences to publications that contain data for previous years.
Discharge measurements of Feather River at Oroville, Cal., by Havley and Sawyer1906.
Date.
February 16 .... February 28. ...
April 11 .........April 10.. .......
April 25.........
Width.
Feet. 291 311 307 316 340 309 309 307 307
Area of Gage Dis- i; . section, heights charge. ^uc.
Sq. ft.4,690 5,340 5,260 5,810 7,280 4,830 4,840 4,620 4, 560
Feet. 9.00
11.35 10.90 12.72 17.00 11.25 11.14 10.61 10.42
Sec.-ft. 11,500 19,600 18,400 23,000 48,600 18,400 18, 100 17,000 16,600
May 2..........May 11. ........
July 6.........:July 26.........September 5 ... October 12... .. November 1.... December 10 ...
Width.
Feet. 309 312 298 279 273 272 271 272 274
Area of section.
Sq. ft. 4, 760 5,270 4,280 3,240 2,380 2.100 2,060 2,060 2,410
Gage height, a
Feet. 10.88 11.95 9.30 6.25 3.10 1.90 1.73 1.73 3.05
D chf
Set 1* 2;i:
« Gage heights refer to the gage at the station.
Daily gage height, in feet, of Feather River at Oroville. Cal., for 1906.
Day.
1...............
3...............4...............
8.. ............9...............10...............
11...............12...............13...............14.... ...........
16...............17...............18...............19...............20...............
21...............22. ..............23...............24...............25...............
26. ..............97
28. ..A ..........9Q
30. ..............31
Jan.
0 9T.95.9.95.85
.85
.85
.85
.91.0
1.34.38 0q 459.35
18.113.424.921.714.75
12.210.18 Q
8,17.4
7.06.26.25fi 9
6.26.0
Feb.
5.455.0
4.74.75
5.25.35.355.455.6
5.655.755.858.59.9
9.18.35
10.6511.411.0
11.1510 9
10 9
10.5511.211.6
Mar.
10.4
9.59.49.6
8.48.38.38.158,1
8.38.4
11.210.310.85
10.49 69 559.4
11.2
11.311.35
17.117.1
15.55
13.6
17.65
Apr.
14.713.313.112.612.1
12.210.3510.1510.1511.4
11.111.410.7510.8511.1
11.111.1511.111.1511.45
11.411.7512.0511.7511.0
10.110.259.95
10.0
May.
10.6510.9511.8511.512.0
12.0512 212.0512.112.05
11.711.4510.7510.2511.55
10.359.459.99.49.05
9.48.658.658.459.0
12.112.2512.8511.711.0
June.
10.710.3511.113.011.7
11.310.69.6
10.459.95
10.2510.311.110.89.75
9.5510.59.89.69.25
9.758.758.77.857.8
7.77.67.16.96.75
July.
6.16.06.86.556.45
6.656.556.46.36.1
6.15.65.455.355.6
5.85.94.04.24.5
4.54.65
4.83.95
3.13.13.053.053.03.0
Avg.
2.952.92.92.852.8
2.82.752.72.72.65
2.62.62.552.552.5
2.52.452.452.42.4
2.352.32.32.252.25
2.22.22.152.152.1
Sept.
2.052.02.01.951.9
1.91.91.91.851.85
1.851.851.851.91.9
1.91.91.91.91.85
1.81.81.81.81.85
1.81.81.81.8
Oct.
1.81.81.81.81.8
1.81.81.81.81.8
1.81.81.81.81.8
1.81.81.81.81.8
1.81.81.8
ol.81.8
1.8
1.8
i ft
Nov.
1.81.82.56.955.25
3.52.52.02.02.0
2.02.02.02.02.0
2.02.02.02.02.0 >*2.02.02.0
1.951.951 9
a Estimated.
NOTE. These gage heights are for the station gage, 1,000 feet upst-eam from the bridge gagt which readings were made during 1905. The gage at the station was read from March 1 to July 24, From January 1 to February 28 and from September 5 to December 31 the gage at the bridge was r these readings have been reduced to equivalent readings at the station gage. From July 25 to tember 4 no readings were made and the gage heights have been estimated.

FEATHER RIVER DRAINAGE BASIN. 121
Rating table for Feather Hirer at Oroville, Col., for 1906.
Gage Dis- height. charge.
Feet. Sec.-ft.0.75 1,200
.80 1,230
.90 1,2951.00 1,3601.10 1,4301.20 i 1,5001.30 ' 1,5701.40 1,6401.50 , 1,7101.60 ' 1,7801.70 , 1,8501.80 1,9201.90 1,990
Gage height.
Feet.2.002.102.202.302.402.502.602.702.802.903.003.103.20
Dis charge.
Sec.-ft.,060,140,220,310,400,490,580,670,760,860,960
3,0603,160
Gage height.
Feet.3.303.403.503.603.703.803.904.004.204.404.604.805.00
Dis charge.
Sec.-ft.3,2603,3603,4603.5603,6603,7603,8603,9604,1804,4004,6204,8405,060
Gage height.
Feet.5.205.405.605.806.006.206.406.606.807.008.009.00
10.00
Dis charge.
Sec.-ft.5,3005,5405,7806,0206,2606,5206,7807,0507,3307,6409,450
11,60014,260
Gage height.
Feet.11.0012.0013.0014.0015.0016.0017.0018.0019.0020.0021.00
Dis charge.
Sec.-ft.17,60021,50026,00031,00036,50042,00047,50053,50059,50065,50071,700
NOTE. This table is based on discharge measurements made during 1904-1906, ard is well denned below gage height 17 feet.
Monthly discharge of Feather Hirer at Ororille, ("aL.for 1906. [Drainage area, 3,640 square miles.]
Discharge in second-feet. Run-off.
Month.
April.............................
July..............................
December ........................
Maximum. Minimum. Mean.
96,300 19,900 53,200 34,800 25,300 26,000 7,330 2,910 2,100 1,920 7,500
43,400
1,240 4,730 9,640
14,100 10,300 7,260 2,960 2,140 1,920 1,920 1,920 1,990
14,500 11,100 21,600 19,200 17,500 13.800 5,240 2,490 1,970 1,920 2,410 7.070
acre-feet.
892,000 616,000
1,330,000 1,140,000 1,080,000
821,000 322,000 153,000 117,000 118,000 143,000 435,000
Sec.-ft. per sq. mile.
3.98 3.05 5.93 5.27 481 3.79 1.44 .684 .541 .527 .662
1.94
Depth in inches.
459 3.18 (i. 84 5.88 5.54 423 1 66
79 60 61 74
2 24
The vear. 90,300 1.240 9,900 ! 7.170,000 2.72
NOTE. Values are rated as follows: January to June, and September, good: remainder of 1906 fair, as gage heights may be liable to error.
GRIZZLY CREEK NEAR BECKWITH, OAL.
Grizzly Creek is tributary to the Middle Fork of Feather River from the north, and has a small drainage basin. There iir a reservoir site in this basin which has already been surveyed by tte Reclama tion Service, and gagings on Grizzlv Creek are of utility in deter mining storage possibilities.
This station was established December 17, 1905. It is located at Reno camp, about 4 miles west of Beckwith and 1 mile above Wil low Glen Hotel. It is about 1,500 feet below the falls, the present- terminus of the Boca and Loyalton Railroad, and is reached by driving from Beckwith. The drainage area above the station is 51 square miles.
The channel is straight for about 200 feet above and below the measuring section. The current is rather sluggish at lov^ water but swift at high stages. The right bank is high and rocky and can not be overflowed. The left bank is low and overgrown with cotton- woods near the water's edge, and may be overflowed at high water. The bed of the stream is rocky and not subject to material change.

122 SURFACE WATER SUPPLY, 1906.
Discharge measurements are made from a car on a cable, cable is anchored to a pine stump on the right bank, while <r left bank it is supported by a tower and is anchored by means large rock buried in the ground at a depth of 4 feet. The i point for soundings is the near side of the pine stump supportin cable.
The gage is 2 by 4 inches vertical timber, graduated to feet tenths, and nailed securely to a large cottonwood tree about 80( above cable and 200 feet below the Reno camp boarding h The bench mark is a spike in the root of the tree to which the is fastened; elevation, 4 feet above the zero of the gage.
Discharge measurements of Grizzly Creek at Beckuith, Cal.
Date.
1905.
1906. May 26.........June 6.........
June 22........June 28........July 7..........
Hydrographer.
R. S. Hawlev..................................
W. N. Hardy. . .....................................do..............................................do..............................................do..............................................do..............................................do............................................ .do..............................................do..............................................do.........................................
Width.
Feet. 4
373<334343<3'3666261.662.0
Area of section.
Sq. ft. 1.8
70614139322464.861.660. 6ft 1.6
Gage height.
Feet.
2.30
1 481 30
9242412240
c
£
a Ice 5 inches thick at the gage. 6 Wading section.
Daily gage height, in feet, of Grizzly Creek near Beckwith, Cal., for 1906.
Day.
o3...........................
6...........................7...........................8................ ..........9...........................10...........................
11...........................12...........................13...........................14...........................15...........................
1(1...... ... ..............17...........................18...........................19...........................20...........................
21...........................22...........................23...........................24... ........ ....... ......25... ....... ..............
2fi...... ....................27...........................28...... .... ...............29...........................30........................... 31...........................
Jan.
0. 55
.55
.55
.55
.55
.70
.70
.90
.SO1.001.00.80
1.00l.CO1.802.001.40
1.00.70.90.90
1.20
1.101.55l.<01.401.90 2.40
Pel-.
1.902.102.301.651.85
1.851.902.002.152.10
2.002.001.801.801.75
1.801.851.851.851.85
1.851.751.751.851.95
1.801.651.65
Mar.
i.col.CO1.651.65i ^n
1.501.651.651.651.65
1.952.452.302.151.85
1.851.851.801.851.85
1.902.152.202.652.60
2.602.652.702.802.83 3.10
Apr.
3.102.802.352.45
2.502. CO3. CO3. CO3.85
3.803.803. CO4.104.10
4.204.404.304.104.00
3.603.603.403.403.80
May.
2.5C
June.
2. CO2.401.801.701.70
1.751.701.701.702.30
l.CO1.701.65l.CO1.50
1.401.401.401.401.40
1.35I.JO1.201.201.15
July.
1.101.101.051.001.00
1.00O.COO.COO.CO0.80
0.750.70O.fOo.,r o0.50
0.500.450.420.420.42
0.420.420.410.410.41
0.410.410.400.400.36 0.34
Aug.
0.34.33.32
.26
.25
.25
.25
.25
.25
.20
.20
.20
.20
.20
.20
.20
.30
.20
.15
.15
.15
.15
.15
.15
.15
.15
.15
.15
.15

FEATHEK RIVER DRAINAGE BASIN. 123
Rating table for Grizzly Creek near Beckwith, Cal.,for 1906.
Gage 1 Dis- height. charge.
Feet . Sec. -ft.0.10 0
Gage Dis- height. charge.
Feet.0.90
0. 20 0. 5 1. 000. 30 1. 6 1. 100. 40 3. 20. 50 5. 50.60 90. 70 13
1.201.301.401.50
Gage height.
Sec.-ft. Feet.22
Dis charge.
Sec.-ft.1. 70 87
Gage height.
Feet.
Dis charge.
Sec.-jt.2. 50 225
28 1.80 98 2.60 2493442505867
0.80 , 17 j 1.60 77
1.90 110 2.70 2732.00 124 2.80 297
' 2.10 | 1412.202.302.40
1592. 90 3213. 00 345
179 3. 20 393202 3.40 441
Gage height .
Feet.3.<03.804.004.204.404.604.805.00
' Dis charge.
Sec.-ft.489537585633681729777825
NOTE. The above table is strictly applicable only for open-channel conditions. It is based on 10 discharge measurements made during 1906 and is well defined between gage heights 0.2 foot and 2.5 feet.
Monthly discharge of (frizzly Creek near Beckwith. Cal., for 1906.
[Drainage area, 51 square miles.]
Discharge in second-feet.
Month.
Vpril 1-25.........................June 6-30... ......................July.. ............................
Maximum.
202179369681202
342.21
Minimum.
_8267
190382.20.20.2
Mean.
4011015346983.611.90.730.51
acre-feet.
2,4606,1109,410
23,3004,150
7324530
46,200
Sec.-ft. per sq. mile.
0.7842.163.009.201.64.234.014.010
Depth in inches.
0.902.243. 46S. 551 . 52
27.02.01
Run-off.
NOTE. Values are rated as fair, except January and February, which are liable to greater error on account of ice conditions.
INDIAN CREEK NEAR CRESCENT MILLS, CAL.
Indian Creek is a tributary from the east to North Fork of Feather liver, entering below the Prattville station; it has a considerable drainage basin. A reservoir site has been surveyed by the Reclama tion Service, and measurements are of utility in computing storage oossibilities.
The station was established November 29, 1905. It is located about 1J miles from Crescent Mills on the Greenville-Quincy road, °nd is most easily reached by driving from Taylorsville, a distance of 5 miles. It is 2,000 feet below the Arlington Bridge and near 1:C. Cook's residence.
The channel is straight for 1,000 feet above and 200 feet below, ",nd the current is very sluggish. Both banks are high and not liable 4 o overflow. They are covered by a thick growth of brush up to the " igh-water line and above this by oaks and pines. The bed of the rtream is composed of silt and is not liable to change materially. At low water the maximum depth is about 12 feet. Discharge measurements are made from a car on a cable. The initial point for roundings is the oak stump to which the cable is fastened on the right bank.

124 SURFACE WATER SUPPLY, 1906.
The gage is a vertical 2 by 6 inch timber, graduated to feet tenths, and is in two sections. It is on the right bank aboi feet above the cable. The lower section is about 5 feet long a fastened to an overhanging willow; the upper section is aboi feet in length and is fastened to a cottonwood tree. The bench is a spike driven in the cottonwood tree to which the high-water is attached; elevation, 8.00 feet above the zerc of the gage.
Discharge measurements of Indian ('reck at Crescent Mills, Cal.. by Hawlei/ and Ha1905-6.
Date. Width.
1905. December 14 ....
1906. May 29. ..... ...Mav 31 ....
June 18.'. .......
Feet. 45
190 186182 182 181
Area of section.
Sq.ft. 66
2,080 1,960 1,850 1,810 1.680
Gage height.
Feet. 1. 35
6.25 5.56 4.87 4.69 3.80
Dis charge.
Sec.-ft.76
1.940 1,580 1.120 1.020
( ; 08
Date. Wid
1936. Ft July 3. ..........July 11.. .......July 20..........July 30. .........
August 27 ...... September 9. ...
fh Area of 1 section.
et. Sq.ft. 180 1,570 67 288 65 211 65 184 65 172 64 176 64 171 64 171
L
Gage height.
Feet. 3.32 2.45 1.70 1.35 1.12 1.20 1.05 1.10
NOTE. These measurements were made at different sections.
Daily gage height, infect, of Indian Creek at Crescent Mills, Cal.. for 1906.
Day. Jan. Feb.
1.... ...........' 1.45 3.15 2......... ..... 1.5 3.03............... 1.5 3.04............... 1.5 2.95
6............... 1.5 2.957............... 1.5 2.958............. . 1.45 2.959............... 1.5 2.95
10............... 1.5 3.0
11......... ... 1.6 3.012. ..... 2.3 3.013............... 2.9 3.0514... ...... 3.95 3.415............... 2.8 3.6
16............... 1 7.1 4.617............... 7.1 4.318............... 9.22 4.35 19......... ... 10. 68 , 5.120......... ..... 7.5 5.5
21... ..... . 5.45 6.122......... .... 4.5 5.723............... 4.15 5.224............... 3.8 i 4.925............... 3.45 4.65
26............... 3.4 4.527............... 3.3 5.528.......... ..... 3. 3 ' 6.629. ..... 3.3 .......30 3. 231 ............... 3. 1 .......
Mar.
5.75
4.954.7
4.454.454.65.05.3
5.87.88.06.96.1
5.65.32-24.6
4.95.96.958.18.85
8.98.587.857.357.258.58
Apr.
8.45 7.356.76.35.95
6.06.57.07.5
7.67.37.17.17.3
7.5
7.6 7.5
7. 77.8
7.256.8
6.356.16.16.156.3
May.
6.4 6.56.86.95
7.06.96.86.76.75
6.86.86.46.26.1
5.85.45. 1 4.9
4.84.74.64.54.5
5.15.756.256.155.755.55
June.
5.4 5.45.35.55.5
5.355. 154.954.94.9
4.94.954.954.84.7
4.754.84.65 4.54 4
4.354.254.03.853.8
3.753.73.63.53.4
July.
3.3 3.33.33.25
3.02.92.82.72.6
2.42.32.32.22.2
2.01.91.9 1.81.7
1.61.551.51.51.5
1.451.451.41.351.351.35
Aug.
1.25 1.151.11.11.1
1.11.11.41.31.2
1.21.151.251.351.25
1.21.21.2 1.151.15
1.051.051.051.051.1
1.21.21.051.051.11.1
Sept.
1.1 1.11.151.151.15
1.151.151.151.11.1
1.11.151.151.151.2
1.251.251.25 1.251.2
1.151.151.151.21.25
1.31.31.351.41.4
Oct.
1.5 1.51.451.451.45
1.451.451.451.51.5
1.51.51.51.51.5
1.51.51.5 1.51.5
1.51.51.51.51.5
1.451.451.451.451.41.4
Noy.
1.45 1.45
2.22.8
2.352.01.851.81. 7
1.651.651.61.61.6
1.71.751.7 1.61.6
1.61.61.61.551.55
1.551.51.51.51.5

FEATHER RIVER DRAINAGE BASIN. 125
Rating table for Indian Creek at Crescent Mills, Cal.,for 1906.
Gageheight.
Feet.1.001.101.201.301.401.501.601.701.801.90
Dis- Gage Discharge, height.
Sec.-ft.354658718498
113129146164
Feet.2.002.102.202.302.402.502.602.70
charge.
Sec.-ft.182200219238258278299 !321
2. 80 3452. 90 369
Gageheight.
Feet.3.003.103.203.303.403.503.603.703.803.90
Dis- 1 Gaeecharge. height.
Discharge.
Sec.-ft. '' Feet. \ Sec.-ft.395421448475502530560595630665
4.004.204.404.604.805.005.205.405.605.80
700785880980
1,0801,1801.3001,4201,5401,660
Gageheight.
Feet.6.006.206.406.606.807.008.009.00
10.0011.00
Discharge.
Sec.-ft.1,8001,9402,0802,2202,3602,5003,2003,9004,6005,300
NOTE. This table is based on 14 discharge measurements made during 1905-6, and is well denned below gage height 6.2 feet.
Monthly discharge of Indian Creek at Crescent Mills, CaL.for 1900.
[Drainage area, 740 square miles.]
Discharge in second-feet. - Total in
Run-off.
Maximum. Minimum. Mean. «*» ***
January. ............... . .February ......March .......... ... ...April ............. ..... . .May............... .........June ............ . . .July............ .....August.. ............ . . .September. ......... ... . .October. ...................November ..................December. ..................
The year. ..........
...... 5,080. . 2,220
...... 3,830
......! 3, 520
...... 2, 570
...... 1,480
...... 475
...... 84
...... 84
...... 98
...... 345
...... 2. 430
...... 5.080
91382905
1,760930502
868824
2,0002,5501,7901,010
78 22640 53. 146849191
40
57.994.8132534
845
53, 40045,800
123, 000152,000110,00060, 10013, 9003, 2f,03,4505,8307, Sf.0
32, 800
611,000
1.171.112.703.452.421.360.3050.0720.0780.1280.1780.722
1.14
1.35l.lh3.11 A. 852.791.520.35.08.09.15.20.83
15.48
NOTE. These values are excellent.
NORTH FORK OF FEATHER RIVER BELOW PRATTVILLE, GAL.
This station was established November 22, 1905. Previous to that date, however, the Great Western Power Company had installed a gage rod and maintained a daily record since June 13, 1905, making gagings by means of a boat. This station is located in the canyon at the proposed dam site of the Great Western Power Company, about 3 miles below the Meadow View bridge crossing on the Pratt- ville-Greenville road, and about 5 miles southeast of Prattville. The drainage area above this point is only 506 square miles, but the run-off during the months of low flow is about half the total run-off at the Oroville station from a drainage area of 3,640 square miles.
The equipment for gaging at this station consists of a f-inch cable anchored to a large rock on the left bank and to a spruce tree on the right, having a clear span of 155 feet and supporting a car with a lock box. Parallel to the cable and 35 feet upstream a guy wire spans the channel for staying the meter in the higher stages. The cable is marked with a ring of white paint every 5 feet for conven-

126 SURFACE WATER SUPPLY, 1906.
ience in sounding, and the initial point is an iron bolt in the ro the tree supporting the cable. The car is used for making mea ments at all stages. The gage rod is inclosed in the clock register which is on the right bank about 700 feet above the cable. The which protects the gage from the thin surface ice in winter, is on the inside with building paper to prevent freezing and is pro^ with a hinged door on the river side to permit easy access for re? direct and comparison with clock register. The reference bench - is a point surrounded by a ring of white paint on a rock 8 feet sc west of the gage; elevation, 7.62 feet above the zero of the gage
The channel is straight for 400 feet above the cable and for 20( below. The bed is rocky and not liable to change materially. '. banks are high and steep and not subject to overflow at any s There is a growth of small willows along the water's edge and for a: distance back of it, while higher up are found spruce and fir t The stream is in one channel at all stages and is swift in high wate* has moderate velocity at other times. The cross section is re and not subject to much change, the width of the stream being a 60 feet at low water with a maximum depth cf 9 feet.
This station is maintained in cooperation with the Great We, Power Company, whose hydrographer, Mr. L. J. Bevan, has kep gage-height record and made meter measurements since it was e lished in 1905. The data collected at this point indicates the qua of water that could be impounded in the proposed Big Meadows ervoir, and the water thus stored would be available for power irrigation and could be utilized in the control of Sacramento Riv
Discharge measurements of North Fork of Feather River below Prattmlle, Cal.,inl
Date.
1905.
June 21 ......Julvl........July 10 ... July 17. ......
October 18 . .November 25
Do.. . .
1906.
March?......March 2b.....April 11......May5........May 30.......
Hydrographer.
"\vr . E. Spear.......
R. \V. Armstrong. . W. E. Spear.......
... ..do.............
.....do...............do....... .....
Hawley & Bevan. .
.....do.............
.....do.............
Gage height.
Feet. 3.453.002.582.40 2.322.102.112.002.011.961.96
4.193.124.262.976.505.476.875.80
Dis charge.
Sec.-ft. 1,2561,061
869761 739668663
621f02601
1,5141,0571,6001,0072,8522,1253,1372,539
Date.
1906.
June 19 a. ...
June 23 a. ...
July 2. ......JulyS.......July 9.......July 12...... July 21......July 24...... July 31......
October 21..
Hydrographer.
L. J. Bevan.. ..........do.............W. V. Hardy......Jb. J. Bevan........ .....do..................do...... .......W. V. Hardv......
..... do...... '.......
.....do.............W.V. Hardy...... .....do.............L. J. Bevan. .......W. V. Hardv..-.- .
.....do.............
.....do.............
.....do.............
Gage height.
Feet. 5.175.17
5.73 5.734.824.82
4.213.833.53 3.052.93 2.752.712.652.502.252.152.252.13
45-pound boiler weight used as anchor for meter.

FEATHER RIVER DRAINAGE BASIN. ' 127
Daily gage height, in feet, of North Fork of Feather River below Prattville, Cal.,for 190o-«.
Day.
1905.
9
3
8...............910...............
n........ .......10
15...............
16...............
is1Q
20...............
21...............22. ..............90
2425...............
26...............27...............00
30...............31...............
1906. 1.... ...........2...............
ti. ..............
8. ..............9...............10...............
I 9
14...............
16...............17...............18...............1920...............
23...............24...............25............ ..
20. ..............27...............28...............29...............30...............31...............
Jan.
.......
1 91
1.931.921.901.941.94
2.032.112.152.352.20
2.803.124.254 654.30
3.80
3.323.283.13
3.173.32
Feb.
.......
2.98
2.912.872.852.862.90
9 Q73.073.113.583.85
3 793.684.004.274.31
4.28
3.743.703.62
3. 453.653.80
Mar.
3.60 3.453.353.153.12
3.05 3.013.003.083.24
3.754.35
3.603.453.333.30
3.904 65
5.856.30
6.475.905.254.805.156.35
Apr.
.......
5.95 5.154.704.504.40
4.45 4.604.775.085.46
5.385.125.055.10
5.365.485.505.58
5.88
6.406.356.00
5.655.505.605.555.C9
May.
5.85 6.056.236.606.93
7.10 7.207.187.177.27
7.567.687.156.736.80
6.656.056.165.505.45
5.45
5.325.185.27
6.360.336.175.785.48
June.
3.45
3.173.053.01
3.012.902.87
2.78
2.772.692.66
2.58
5.30
5.295.586.00
5.92 5.595.255.185.37
5.605.525.405.33
5.606.286.055.735.58
5.205.024.86
4.804.684.524.354.25
July.
2.592.572.552.532.48
2.50
2.43
2.42
2.392. <02.392.382.39
2.342.33
2.322.31
2.322.282.282 00
2 99
2.24
2 222.21
4.22 4.234.224.184.14
4.04 3.983.923.?33.73
3.603.523.503.473.43
3.283.243.203.13
3.08o m
2.962.942.90
2.87
2.832.802.782.76
Aug.
2.16
2.172.17
2.162.172.142.142.09
2.112.16
2.112.11
2.122.112.102.102.09
2.112.142.14
2.11
2.062.082.079 Q6
2.052.06
2.76 2 722.682.662.63
2. C32.622. CO2.582.56
9 <W
2.592.562.532.51
2.502.472.47
2.25
Sept.
2.06
2.04
2.042.042.052.03
2.032.0-12.042.052.04
2.052.032.032.032.01
2.012.001.992.012.01
2.002.022.16
2.06
2.17
2.10
2.08
2.20
2.25
2.222.202.212.232.22
2.202.192.192.182.17
0;t.
2.022.012.00
2.00
2.002.042.032.02
2.012.012.012.012.01
2.012.01
2.00
2.17 2.172.162.162.16
2.16 2.162.162.152.15
2.152.152.15
2.13
2.132.132.132.132.13
2.122.112.112.102.102.13
Nov.
1.981.98
1.99
1.99
1.981.9C1 981.971.97
2.01
2.13 2.152.252.622.88
2.65 2.422.302 942.20
2.182.172.162.152.16
2.242.212.162.102.10
2.112.102.022.042.05
2.042.022.011.972.01
Dec.
2. 15
1.85
1.83
1.93
2.01
1.81
1.84
1.91
2.00
1.99 2.002.012.012.02
2.05 2.072.172.252.44
2. 182.102.182.242.29
2.352.442.332.332.33
2.31
2.382.483.42
4.404.574.654.353.953.60

128 SUEFACE WATER SUPPLY, 1906.
Rating table for North Fork of Feather River below Prattville, Cal.,for 1905-6
Gageheight.
Feet.1.801.902.002.102.20
Discharge.
Gageheight.
Sec.-ft. ' Feet.570 2. 50600 2.60630 [ 2. 70665700
2. 30 7352. 40 770
, 2.80! 2.90
3.00i 3.10
Discharge.
1 Sec.-ft.
805 '845 j885925965
1,0051,045
Gageheight.
Feet.3.203.303.40
Discharge.
Sec.-ft.1.0901,1351,180
3.50 1,2253.60 1,2703.70 1,3153.80 1,360
I Gageheight.
Feet., 3.90i 4.001 4.10i 4.20 4.30' 4.40| 4.50
Discharge.
Sec.-ft.1,410
Gageheight.
Feet.
Discharge.
Sec.-ft.4.60 1,770
1,460 4.70 : 1,8251,510 4.801,5601,6101,6601,715
4.905.005.105.20
1,8801,9351,9902,0452,100
NOTE. This table, is based on 40 discharge measurements made during 1905-6 and is well d Above gage height 5.2 feet the rating curve is a tangent, the difference being 60 per tenth.
Monthly discharge of North Fork of Feather River below Prattville, Col., for 190f
[Drainage area, 506 square miles.]
Month.
Discharge in second-feet.
Maximum. Minimum. Mean.
I Run-of Total in - - - acre-feet. ' Sec.-ft. per De
, sq. mile. in
July.......August....September. October... November. December..
1905.
The period.
January... February.. March.....April......May.......June.......July.......August....September. October... November. December..
The year.
845700682647630G82
845
1,8001,6102,850
700 : 761647630630615570
570
600945
1,0002,820 ' 1,6603, 600 2, 1002,760 1,5801,580 , 905905 700717 665682 665965 615
1, 800 630
3,600 600
670644631628607
657
46,80042,00038,30038,80037,40037,300
241,000
937 57, 6001,2101,590
67,20097,800
2,210 ' 132,0002,770 170,0002,190 130,0001,200 73,800795 48;900688679
40,90041,800
698 41 ; 500894
1,320
55,000
956,000
1.501.321.271.251.241.20
1.30
1.852.393.144.375.474.332.371.571.361.341.381.77
2.61
NOTE. Discharge estimated on days when gage heights are missing. Values are excellent.
NORTH FORK OF FEATHER RIVER ABO^E PRATTVILLE.
This station was established June 12, 1905. It is 3 miles ea, Prattville and about £ mile above the junction with Ham Branch. The drainage area above the station is 245 square n
The channel of the stream is straight for 200 feet above and 300 below the measuring section and has a shale bottom subject to s change. Gagings are made from a boat. Tv e section is abou feet wide and 5 feet deep at low water; at very high water there diversion overflow around the station, leaving the main stream a \\ miles above the point of measurement.
The gage is nailed to a willow stump 15 feet above the me* ing section. Up to October 15, during 1905, the gage was read d after this date, weekly.

FEATHER RIVER DRAINAGE BASIN". 129
Discharge measurements of North Fork of Feather River above Prattville, Cal., in 1&05-6.
Date.
1905.
July 28 ........
1906.
April 12 .......May 15 .......July 7 .........
Hydrographer.
.....do............................................................
W. E . Spear ......................................................
.....do............................................................
.....do............................................................
..... do --.....-.-.--------.--......-.....----.--.......-.-,-.-.--- -
..... do..................................... -.-................--- -
.....do........................................ ..................
.....do.................. ......-............-.....----.-.--.-.-.--
Gage height.
Feet. 2.331.791.481.231.09.99.90.80
1.822.773.832.481.34
Dis charge.
Sec.-ft. 890620520407399370345330
6691,0461.524
929502
Daily gage height, infeet. of North Fork of Feather River above Prattville, Cal. ,/or 1905-6.
Day.
1905.
8...............9
10..........-.---
11...............12...............1314...............15...............
16...............17...............18...............19
212200
24...............OK
26..........---..27..-......----..00
30. ..............31
1906. I...............
6...............7...............8...............9
1 0
14...............15...............
Jan.
.......
O QQ
Feb.
1 19
.....-------
Mar.
. i.. . . .
Apr.
9 ^1
May.
3.92
4.15
3.83
June.
2.08
1.971.90
1.861.801.781.761.69
1.671.591.551.531.51
O S7
July.
1.501.481.471.461.39
1.401.351.331.321.31
1.291.271.261.241.23
1 90
1.20
1.181.18
1.161.151.141.161.15
1.141.141 091.101.07
. ...
2 AQ
2.06
Aug.
1.051.06
1.051.05
1.041.021.011.021.01
1.000.99
.99
.99
.99
.97
.95
.95
.94
.94
.95
.97
.96
.98
.95
.90
.94
.92
.91
.90
.90
1.40
1.34
1.34
Sept.
0-90.91.90.90.90
.88
.87
.90
.90
.87
.86
.86
.89
.89
.90
.88
.87
.86
.85
.84
.82
.82
.84
.85
.84
.87
.90
.95
.90
1.04
1.06
Oct.-
0.88.85.84.84.85
.85
.90
.90
.88
.87
.87
.86
.86
.87
.86
0.85
6.90
0.89
Nov.
0.82
0.83
0.82
0.87
.......
1.00
0.95
Dec.
0.75
0.80
0.81
0.87
0.94
0.95
8591 IBK 213 07 9

130 STJBFACE WATEE SUPPLY, 19C6.
Daily gage height, in feet, of North Fork of Feather River above Frattville, Cal., for 1905-Continued.
Day.
1906 16...--.......-..17.... ...........18...............19...............20...............
2223...............24...............25...............
26. ..............27...............28...............29...............30...............31...............
Jan. Feb.
1.82
Mar.
2.04
Apr. May.
o 90
3.18
June.
3.30
3.32
2.57
July.
1.80
1.48
Au?.
1.20
1.18
Sept.
0.96
Oct.
0.88
0.86
Nov.
i
O cm
HAMILTON BEANCH NEAE PEATTVILLE, CAL.
This station was established June 12, 1905. It is located abou miles east of Prattville and l\ miles above the junction of Hamilt Branch and North Fork. The drainage area above the station is 1 square miles.
The channel is straight for 200 feet above and below the meas" ing section and has a shale bottom subject to a very slight change.
Discharge measurements are made from a boat at a section abc 70 feet wide and 4 feet deep at low water. The stream ne~ overflows.
The gage is in two parts, nailed to posts driven into the stre* bed near a clump of willows. Up to October 15, during 1905, 4 gage was read daily; after that date, weekly.
Discharge measurements of Hamilton Branch near Prattville, Cal., in 1905-6.
Date.
1905.
July3..........July 28 .........
1906.
April 12........
July7. .........
Hydrographer .
W. E . Spear ...........................................................do.................................................................do............................................................
.....do..........----......----.-....------......-.................
.....do.....--..-...-......----.......---...............--.........
..... do........... ................................. ................
.....do............................................................
.....do................................................ ...........
.....do............................................................
.....do...........-.---......--...-...-..--..........--............
Gage height.
Feet. 3.082.742.622.562.562.552.40
3.603.924.435.213.192.77
Dis char
Sec.-
i

FEATHER RIVER DRAINAGE BASIN. 131
Daily gage height, in feet, of Hamilton Branch near Prattville, l"al.,for 190,5-6.
Day.
1905. 1.... ...........2...............3...............4...............
7...............
9...............10...............
12...............13...............14...............
17...............18...............19............... 20...............
21.. .............22...............23...............24...............
20.. .............27...............
29.............. 30...............31 ..............
1906. 1........ .......2 ..............
5...............
fi............. .
8...............9...............
10...............
11...............12..............13.. .............14...............
16...............17..............18...............19...............20...............
22...............
24...............25...............
26...............27...............28...............29...............30...............
Jan.
2.39
2.81
3.60
Feb.
3.22
3.71
3.93
3.92
Mar.
3.57
4.88
Apr.
4.30
May.
4.62
5.17
5.75
4.45
4.95
June.
2.91
2.842 Q9
9 go2.762.742.722.70
2.672.672.65 2.62
4.22
4.18
4 00
3.50
July.
2.662 642.642.63
2.632.61 2.602.59 ' 59
2.582.582.58 2.572 *7
2.58
2.58
2.582.592 62
2.002.602.572.56 2.56
3.42
3.00
2.85
2.78
Aug.
2.562.56
2.56
2.562.56 2. 552.56
2.552.562.56 2.5.5
2.572.562.572. 58 2.57
2.582. 592.58
2.572.562.55 2.552.56
2.75
2.77
2.76
.....
2.71
2.68
Sept.
2.552.552.552.55
2. 54 2.542.54
2.532.532. 53 2.53
2.532.532. 532.53
2.522.522 £9
2.502.542.54 2.52
2.68
2.65
2.69
.......
2.61
2.60
-------
2.59
Oct.
2.542.532.532.509 48
2.50 2.502.50
2.492.492.492.48 9 49
2.4S
2.48
2.58
:2.57
2.58
2.51
:::::::
Nov.
2.47.......
2.4(1
> 45
2.44
2.62
'
2.57
:::::::
2.60
2.60
Dec.
2.40
2.40
o 40
2.44
2.59
2.60
2.72
4.13

132 SURFACE WATER SUPPLY, 1906.
BUTT CREEK AT BUTTE VALLEY, CAL.
Butt Creek rises in the extreme western part of Plumas Coi and flows eastward, discharging into North Fork of Feather K about 9 miles south of Prattville.
This station was established June 14, 1905, about 2 miles at the mouth of the river, and 100 feet below the footbridge at lower end of Butte Valley. The drainage area above the static 73 square miles.
The measuring section is 20 feet wide and 2 feet deep at low w when measurements are made by wading; in high stages meag ments are made from the footbridge. The bottom of the chann composed of coarse gravel and is not subject to much change.
The gage rod is nailed to a post in a clump of willows 15 feet b the measuring section. During 1905 and until July, 1906, the was read daily by B. F. Barbee. Since July, 1906, W. W. Saver has made readings whenever there was any material change of st
Discharge measurements of Butt Creek at Butte Valley, Cal., in 1905-6.
Date.
1905.
July 18........
September 9. . . .
1906.
June 21 ........July 24.........Aueust 30......
Hydrographer.
.....do. ...........................................................
.....do............................................................W. E. Spear. .....................................................
.....do............................................................
.....do............................................................
.....do............................................................
.....do............................................................W. V. Hardv .....................................................
Gage height.
Feet.
2.512.392.38
454
3.542.68
ch
S'
NOTE. About 5 second-feet are diverted 0 miles above this station from Butt Creek into Creek watershed.
Daily gage height, in feet, of Butt Creek at Butte Valley, Cal.,for 1905-6.
Day.
1905.
9
3...............4...............5...............
6...............7...............
g
12...............13. ..............14. ..............15...............
16...............17...............18...............19...............20...............
Jan. Feb. Mar. Apr. May. June.
2.84
July.
2.51
Aug.
2.39
Sept. Oct.
2.38
2.37
2.382.382.382.38
2.382.382.382.382.38
Nov.
2.382.382.382.382.38
2.382.382.382.382.38
2.382.382.382.382.45

FEATHER ETVEB DRAINAGE BASIN. 133
Daily gage height, in feet, of Butt Creek at Bntte Valley, CaL, for 1905-6 Continued.
Day.
1905. 21...............99
23
''")
26...............27...............28...............29...............30...............31...............
1900. 1.. .............23'.'.'.'.'.'.'.'.'.'.'.'.'.'.'.
4...............5...............
6............... 7... ... . .8... . ... . 9............... 10...............
11... .... ...... 12...............13...............
16... ....... ...17............... 18...............19
21............... 22............... 23...............24...............25...............
26..... .........
2&'.'. ...'... ....'..'.2930............... 31...............
Jan.
2. 85 2.88 2.912.942. %
2.99
3. 03 3.07 3.10
2.769 OQ
2.85 2.93O QG
4.665.14 7. fi96.725.45
5.15 5. 53 3.163.002.90.
2.81
2.70 2.70
Feb.
2.70 2. 68 2.682.682.69
2.69 2.692.71 2.71 2.94
2.95 o qy2.97 3. 25
3.303.24 3.604.093.75
3.95 3.65
3.423.35
3.304.09 4.10
Mar.
3.42 3.31 3.283.253.17
3.15 3.1(iS.24 3.34 3.46
3.73
5. 15 4.30
3.783.47 3.353.273.27
3.42 4.22 4.404.904.90
4.565.54 4.204.105.00 6.00
Apr.
5.15 4. 50 4.174.023.96
4.06 4.304.38 4.70 4.72
4.35
4.42 4.41
4.704.57 4.534.564.73
4.884.87 4.634.434.25
4.134.12 4 224.204.28
May.
4.30 4-. 33 4.534. 654.80
4. "24. "84."0 4. "24. "6
4. 05 4 484.33 4.344.37
4.003.83 3.70
3.70
3.71 3.68 3.673.683.84
4.554.50 4.384.204.10 3.97
June.
3.94 3.99 4.024.424.20
4. 22 4243.87 3.83 3.83
3.79
3.75 3.68
4.183.87 3.713.643.39
3. 55 3.47 3.403.333.30
Q OT
3.22 3.213.123.09
July.
3. 06 3.13 3.022.982.93
2.90 2.892.87 2.83 2.81
2.79 2.772.80
2.752.74 2.742.72
2.71 2.71 2.692.692.68
2.67 2.662.642.62 2.61
Aug.
.61
.61
.01
.59
.59
.59
.59
.59
.58
.60
.61
.01
2.00
Sept.
.
2.57
2.57
2.63 2.61
"2." 59 ~
2.56
Oct.
2.382.382.382.382.38
2.382.382.382.382.382.38
2. 54
2. 55
2.55
2.55
Nov.
2.422.422.442.432.43
2.432.442.432.432.45
2.93
2.65
"i'ei"
2. 58
2.45
Dec.
2 762 762 732 732 73
2 762 712 682 682 672 78
2.43"i'as
2. 670 10
3. 13
3.103.112.682.632.63
2.61 2.602.672.723.28
4.434.33 3.423.10
NORTH FORK OF FEATHER RIVER NEAR BIG BEND, CAL.
This station was established June 13, 1905. It is located 300 feet above the head of the Big Bend tunnel, about 20 iriles north of Oroville. The drainage area at this point is 1,940 square miles.
The channel is straight for 500 feet above and below the station, and is in rock, with little probability of change. A low-water gage graduated from 0.0 to 7.5 feet is bolted into rock 011 the west bank 10 feet below the measuring section, and a high-water gage gradu ated from 7 to 22 feet is nailed to a poplar tree on the west bank 100 feet above the measuring section. The zero of the gage is 870.22 feet above sea level and 7.89 feet below the reference bench mark, which is a knob on the top of the rock to wl ich the low- water gage is fastened.
Discharge measurements are made by means of a boat when the gage is below 11 feet, and for higher stages float measurements only

134 SURFACE WATER SUPPLY, 1906.
are made at this point, while check measurements are made 2 n downstream from the cable of the Golden State Power Comp r At low water the stream at the station is about 85 feet wide 19 feet deep, with a uniform but sluggish current. During 1905 1906 the gage was read every other day by Henry Turner.
Discharge measurements of North Fork of Feather River near Big Bend, C'and Bi'ran, in, 19(15-6.
Dato.
1905.
July 13........................
1900.
Gage Dis- height. charge.
Feet. Sec.-ft. 4 15 3,750 2 75 1,352 2 14 1,048 2 07 i 1,003 2 15 1,038 2 25 1,101
4.79 3,017
Date.
1906. March 13 ................ ...April 18......................April 28......................
July 13.... ...................
October 11 ...................
Gage height.
Feet. 12.25 10.248.98
9.084.73 3.03 2.44
reh;
Se
Daily gage height, in feet, of North Fork of Feather Rirer near Big Bend, f'al., for 19
Day.
1905. 1..............2...............3...............4...............5.......... .. .
n...... ... ....7gQ
10
Jan. Feb. Mar. Apr.
ii
May. June. July.
1!
1 : !
11 ...... \ . .... ...... .......12...............13.......... ....14...............15...............
17...............18...............19. ..............20...............
21...............22...............23...............24. ..............
26............... .......27............... .......28....29.... ........... i....... .......30. ............................31.. .....
190<i. 1...............
3. ..............
6. ..............7
2.24
2.24
2. 30
2.31
4.80
4.54
9...............'....... .......10. .............. 2. 30 4. 65
7.65
7.30
11.80
9.55
(). 58 1 8. 76 6. 50 ;.......
1 9. 60
9.85
10.60
11.20
11.25
10.70 ii. S5
2.75
2.66
' 2.62
... . 2. 60
....... 2. 55
....... 2. 50
2.46
....... 2. 35
....... 2.34
10. 658.95
11.20
9.55 9.15
9 05
2.28
Aug.
2.26
2.06
o 94
2.21
2.17
2.162.16
2.17
2.15
2.132.10
2.13
2.20
2.14
2.11
2.07
2.06
3. 256.25 ' 3.20
6.23
5.85
5. 50 . _
3.08
s no
....... 5. 25 2. 97
Sept..
2.06
2.06
2.07
2.06
2.05
2.05
2.08
2.06
2.05
2.07
2.35 2.25
2.62
2.582.58
2.58 2.58
9 ^
Oct.
2.182.15 2.102.08
2.16
2.11
2.13
2.12
2.11
2.10 2.12
2.15
2.18
Nov.
2.17
2.17
2.17
2.18
2.17
2.18
2.17
2.18
2.18
2.27 2.37 2.19
2.18
2.20 ! 2.571
2. 19 2. 37 2.18 .......
2.53 .......
2.40 3.02 5.90 4.60
"~3."46"
3.00
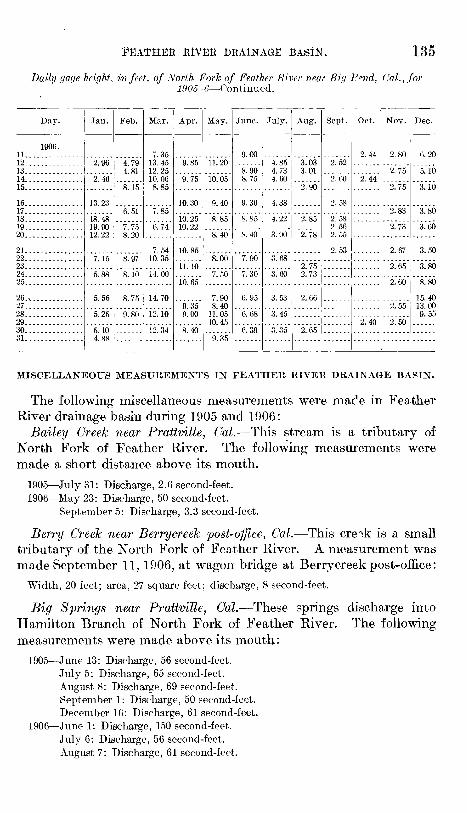
FEATHER RIVER DRAINAGE 135
Daily gage height, in feet, of North Fork of Feather River near Big Pend, Cal.,for1905-fi Continued.
Day.
1906.
12...............13...............14...............
16...............17...............18...............1920...............
21...............
23...............24...............25...............
26...............27...............
29...............30. ..............31...............
Jan.
2.96
2.46
13.23
19 90
7.15
5.88
5.25
5.10A QC
Feb.
4.794.81
8 1 n
6.51
7.75
8 97
8.10
8 7K
9 80
Mar.
7.3513.4512.2510.06
7.85
7.5410.35
14.00
14.70
12.10
Apr.
9.85
9.75
10.30
10.25
10.85
11.10
10.65
9.359.00
8 40
May.
11.20
10.05
9.40
8.85
8.40
7.50
7.908.40
11.0510.45
9 on
June.
9.00
8.908.75
9.30
8.85
8.40
7.90
7.30
6.95
6.68
6.39
July.
4.854.734.60
4.38
4.22
3.90
3.68
3.60
3.53
3.45
3.35
Aug.
3.033.01
2.90
2.85
2.78
2.752.73
2.66
Sept.
2.52
2.60
2.58
2.582.562.55
2.53
Oct.
2.44
2.44
2.40
Nov.
2.80
2.75
2.75
2.83
2.73
2.67
2.65
2.60
2.55
2.50
Dec.
5.10
3.10
3.80
3.60
3.50
3.80
8.80
15.4013.009.55
MISCELLANEOUS MEASUREMENTS IN FEATHER RIVER DRAINAGE BASIN.
The following miscellaneous measurements were macT e in Feather River drainage basin during 1905 and 1906:
Bailey Creek near PrattviTle, Col. This stream is a tributary of North Fork of Feather River. The following measurements were made a short distance above its mouth.
1905 July 31: Discharge, 2.6 second-feet.1906 May 23: Discharge, 50 second-feet.
September 5: Discharge, 3.3 second-feet.
Berry Creek near Berrycreek post-office, Cal. This cre^k is a small tributary of the North Fork of Feather River. A measurement was made September 11, 1906, at wagon bridge at Berrycreek post-office:
Width, 20 feet; area, 27 square feet; discharge, 8 second-feet.
Big Springs near Prattville, Cal. These springs discharge into Hamilton Branch of North Fork of Feather River. The following measurements were made above its mouth:
1905 June 13: Discharge, 56 second-feet. July 5: Discharge, 65 second-feet. August 8: Discharge, 69 second-feet. September 1: Discharge, 50 second-feet. December 16: Discharge, 61 second-feet.
1906 June 1: Discharge, 150 second-feet. July 6: Discharge, 56 second-feet. August?: Discharge, 61 second-feet.

136 SURFACE WATER SUPPLY, 1906.
Butt Creek near Prattville, Col. This stream is a tributary of Nc Fork of Feather River. The following measurements were made the bridge on Prattville-Sterling road:
1905 July 11: Discharge, 21 second-feet.1906 March 27: Discharge, 156 second-feet.
June 21: Discharge, 142 second-feet. July 20: Discharge 54 second-feet.
Clear Creek near Prattville, Col. This stream is a tributary Hamilton Branch of North Fork of Feather River. The follow measurements were made in 1905 a short distance above its mou
July 5: Discharge, 29 second-feet. August 8: Discharge, 28 second-feet. September 1: Discharge, 27 second-feet.
Chester Branch of North Fork of Feather River near Prattville, Co' The following measurements were made at the wagon bridge Chester, Cal.:
1905 July 7: Discharge, 35 second-feet.August 5: Discharge, 23 second-feet. August 31: Discharge, 21 second-feet. October 4: Discharge, 23 second-feet.
1906 March 1: Discharge, 48 second-feet. June 23: Discharge, 95 second-feet. July 11: Discharge, 70 second-feet. September 5: Discharge, 45 second-feet.
Dotta Spring near Prattville, Cal. This spring discharges into No Fork Feather River. The following measurements were made : feet above its mouth.
1905 June 12: Discharge, 50 second-feet. July 3: Discharge, 99 second-feet. August 5: Discharge, 84 second-feet. September 2: Discharge, 89 second-feet. October 18: Discharge, 90 second-feet. December 14: Discharge, 77 second-feet.
1906 June 21: Discharge, 122 second-feet. August 3: Discharge, 94 second-feet.
Feather River near Bidwell Bar. The following measurements w made 2 miles below Bidwell Bar and above the junction with No Fork of Feather River during 1905:
June 11: Discharge, 1,525 second-feet. July 25: Discharge, 410 second-feet. August 19: Discharge, 279 second-feet. September 17: Discharge, 256 second-feet.
Flournoy ditch near Genesee, Cal. This ditch diverts water fr Red Clover Creek for irrigation at Flournoy's ranch. A measi. ment was made August 21, 1906, 1J miles southeast of Flournoy short distance below the point of diversion:
Width, 4 feet; area, 3.6 square feet; discharge, 9.5 second-feet.

FEATHER RIVER DRAINAGE BASIN. 137
Hamilton Branch of North Fork of Feather River near Prattville, Cal. The following measurements were made a short distance below its junction with Clear Creek:
1905 July 5: Discharge, 108 second-feet. August 8: Discharge, 79 second-feet. September 1: Discharge, 93 second-feet. October 2: Discharge, 83 second-feet. December 15: Discharge, 74 second-feet.
1906 June 1: Discharge, 498 second-feet. July 6: Discharge, 250 second-feet. August 7: Discharge, 139 second-feet.
The following measurements were made at wagon bridge on east side of Big Meadow and below its junction with Rock Creek:
1905 June 23: Discharge, 169 second-feet.1906 September 1: Discharge, 232 second-feet.
Hot Springs Valley Creek at Hot Springs VaUey. This creek is a tributary of Warner Creek. The following measurements were made a short distance above its junction with Warner Creek:
1905 June 28: Discharge, 44 second-feet. August 2: Discharge, 30 second-feet. August 30: Discharge, 28 second-feet. October 4: Discharge, 25 second-feet.
1906 May 23: Discharge, 117 second-feet. July 11: Discharge, 80 second-feet. September 4: Discharge, 35 second-feet.
Hosselkus ditch near Genesee, Gal. This ditch diverts water from Little Grizzly Creek. A measurement was made August 20, 1906, 1J miles southwest of Genesee post-office and a short distance below point of diversion:
Width, 5 feet; area, 3.5 square feet; discharge, 5 second-feet.
Indian Creek. This creek is one of the principal tributaries of North Fork of Feather River. The following measurements were made a short distance above its moiith during 1905:
June 16: Discharge, 321 second-feet. September 8: Discharge, 106 second-feet.
Indian Creek near Genesee, Cal. -A measurement of this stream was made August 21, 1906, one-half mile northwest of Flournoy's and above its junction with Red Clover Creek:
Width, 6.5 feet; area, 4.3 square feet; discharge, 3.8 second-feet.
King Creek at Hot Springs Valley, Cal. This stream is a tributary of Warner Creek. The following measurements were made at crossing of the Prattville-Lassen Peak road, one-half mile above the junction with Warner Creek:
1905 June 28: Discharge, 66 second-feet. August 2: Discharge, 29 second-feet. August 30: Discharge, 18 second-feet. October 4: Discharge, 12.6 second-feet.
1906 May 22: Discharge, 151 second-feet. July 11: Discharge, 117 second-feet.

138 t-ttTKFACK WATER StTpfLY, 1906.
Little Grizzly Creek near (renesee, Cal. This stream is a tribu of Indian Creek. A measurement was made August 20, 1906 miles southwest of Genesee post-office, above the diversion of Hosselkus ditch:
Width, 21 feet; area, 21 square feet; discharge, 14.7 second-feet.
Middle Fork of Feather River near Beckwith, Cal. A measurer of this stream was made August 12, 1906, 2 n^iles west of Beckv Cal., and one-half mile above its junction with Grizzly Creek:
Width, 10 feet; area, 4.4 square feet; discharge, 5 secord-feet.
North Arm Creek near Taylorsville, Cal. This stream is a tribu of Indian Creek. A measurement was made August 22, 1906 "Dead Fall" bridge, If miles north of Taylorsville, Cal.:
Width, 14 feet; area, 12.4 square feet; discharge, 5.1 second-feet.
North Fork of Feather River near Tyler, Cal. The following ir urements were made at the bridge on the Prattville-Red Bluff r
1905 June 29: Discharge, 52 second-feet.August 2: Discharge, 17.4 second-feet. August 30: Discharge, 12.4 second-feet. October 4: Discharge, 11.4 second-feet.
1906 May 23: Discharge, 91 second-feet. July 10: Discharge, 117 second-feet.
North Fork of Feather River. The following measurements * made a short distance above its junction with Warner Creek:
1905 August 30: Discharge, 84 second-feet. October 3: Discharge, 64 second-feet.
1906 May 23: Discharge, 506 second-feet. July 11: Discharge, 323 second-feet.
North Fork of Feather River near Prattville, Cal. The follow measurements were made at Olsen's ranch, 8 miles northwes Prattville, Cal.:
1905 June 30: Discharge, 286 second-feet, August 4: Discharge, 188 second-feet. August 29: Discharge, 146 second-feet. October 3: Discharge, 128 second-feet.
1906 March 1: Discharge, 164 second-feet. May 22: Discharge, 805 second-feet. July 10: Discharge, 647 second-feet.
Prattville Branch of North Fork of Feather River at Prattville, Cc The following measurements were made 800 feet above its June with North Fork of Feather River:
1905 June 12: Discharge, 186 second-feet. July 7: Discharge, 196 second-feet. August 14: Discharge, 180 second-feet. September 2: Discharge, 179 second-feet.
1906 January 5: Discharge, 147 second-feet. June 29: Discharge, 303 second-feet. August 3: Discharge, 227 second-feet.

FEATHER RIVER DRAINAGE BAStN. 139
Red Clover Creek near (fenesee, Cat. This stream is a tributary of Indian Creek. A measurement was made August 21, 1906, 1J miles southeast of Flournoy's and above diversion of Flournoy's ditch:
Width, 10 feet; area, 11 square feet; discharge, 21 second feet.
Rock Creek near Prattville, Col. This stream is a tributary of Hamilton Branch of North Fork of Feather River. The following measurements were made at bridge on Prattville-Susaiiville road:
1905 June 24: Discharge, 12 second-feet. July 5: Discharge, 7.4 second-feet. August 8: Discharge, 5 second-feet. September 1: Discharge. 2.1 second-feet. October 2: Discharge, 1.5 second-feet. December 15: Discharge, 0.5 second-foot.
1906 June 1: Discharge, 85 second-feet. July 6: Discharge, 25 second-feet. August 7: Discharge, 25 second-feet.
South Fork of Feather River near Enterprise, Cal. 7Tie following measurements, which include the flow in the Enterprise ditch, were made a short distance above its junction with Feather River during 1905:
June 11: Discharge, 246 second-feet. July 25: Discharge, 64 second-feet. August 18: Discharge, 48 second-feet. September 17: Discharge, 34 second-feet.
Spanish Creek near Quincy, Cal. This stream is a tributary of Indian Creek. A measurement was made September 9, 1906, at the wagon bridge, 2^ miles northeast of Quincy, Cal.:
Width, 40 feet; area, 40 feet; discharge, 44 second-feet.
Squaw Queen Creek near Genesee, Cal. This stream is a tributary of Red Clover Creek. A measurement was made August 21, 1906, three-fourths mile southeast of Flournoy and 500 feet above its junction with Clover Creek:
Width, 6 feet; area, 3.6 square feet; discharge, 2.3 second-feet.
Warner Creek near Chester, Cal. This stream is a tributary of the North Fork of Feather River. The following measurements were made at bridge on Prattville-Red Bluff road:
1905 June 30: Discharge, 140 second-feet. August 5: Discharge, 81 second-feet. August 29: Discharge, 63 second-feet. OctoberS: Discharge, 61 second-feet.
1906 May 23. Discharge, 320 second-feet. July 10: Discharge, 268 second-feet. September 4: Discharge, 95 second-feet.
Ward Creek near Genesee, Cal. This stream is a tributary of Indian Creek. A measurement was made August 22, 1906, at Phelan's ranch house, H miles above its junction with Indian Creek:
Width, 8 feet; area, 3.2 square feet; discharge, 8.1 second-feet.

140 STJEFACE WATER SUPPLY, 1906.
Willow Greek near Chester, Cat. This stream is a tributary of N Fork of Feather River. The following measurements were mad the ford on the Prattville-Red Bluff road:
1905 June 29: Discharge, 4.1 second-feet. August 2: Discharge, 4.0 second-feet. October 4: Discharge, 2.5 second-feet.
1906 May 23: Discharge, 40 second-feet.
Wolf Creek near Greenville, Cal. This stream is a tributar Indian Creek, discharging through swamp in west arm of Indian ley. A measurement was made August 23, 1906, one-fourth southwest of Greenville, Cal., above its junction with North Can a stream which discharges from Round Valley Reservoir. A di sion of 3.4 second-feet for irrigation is made above point of meas ment.
Width, 3 feet; area, 1.2 square feet; discharge, 1.8 second-feet.
PRECIPITATION AND EVAPORATION DATA.
The following tables give the total precipitation and evapora in inches, by months at Prattville, Cal.:
Precipitation and evaporation at Prattville, Cal.PRECIPITATION.
Year.
1905. ..........1906...........
Jan. Feb.
6.45
Mar. ' Apr. May. June.
1.42
July.
0.00
Aug.
0.170.15
S^pt.
0.70C.53
Oct.
0.280.20
Nov.
2.773.91
Dec.
1.7414.68
EVAPORATION.
1905...........1906........... 1.30 0.95 1. 16 2.84 2.58 2.77
3.813.86
4.313.42
3.802 72
2.723.06
1.501.28
1.000.41
YUBA RIVER DRAINAGE BASIN.
DESCRIPTION OF BASIN.
Yuba River is a tributary of Feather River, wlich it enters at M> ville, 30 miles above the junction of Feather and Sacramento rr The entire drainage area of the Yuba is about 1,327 square mile which about 1,220 square miles are above the gaging station at Sm ville. Its extreme length is about 60 miles, and extreme widt miles. In the lower stretches of the river, at the location of the - ent gaging station and in the valley below, the channel has been to a considerable depth with debris from hydraulic mining.
The drainage basin is subdivided into 5 small basins, nan North Fork, with a drainage area of 491.6 square miles; Middle P with a drainage area of 218 square miles; South Fork, with a drai area of 360 square miles; Deer Creek,with a drainage of 89.6 sq miles, and Dry Creek, with a drainage area of 105.5 square miles.

YUBA RIVER DRAINAGE BASIN. 141
latter tributary discharges into the main river about 5 miles below the gaging station. The watershed rises gently in rounded and broken mountains, to the crest of the Sierra Nevada, which at the headwa ters of the Yuba has a mean elevation of about 8,200 feet, with peaks rising to a height of 9,100 feet. From Mount Lincoln a peak com mon to the watersheds of the Yuba, American, and Truckee rivers to a point about 2^ miles northeast of Mount Weber, the summit of the Sierre Nevada divides the watershed of Yuba Kiver from that of Truckee River, which discharges into Humboldt Basin. Farther north from Mount Weber there is a secondary crest which divides the water sheds of Yuba and Feather rivers, the watershed of the latter stream reaching farther east to a less elevated divide in which the passes are lower than those of the easterly crest.
The western and lower portions of the Yuba drainage basin are composed of slate and kindred rock, very much eroded and merging into the gravel and alluvial deposits of the Sacramento T <ralley. The upper portions of the basin are composed principally of lavas and granites, all depely eroded, particularly the lavas. A stratum of ser pentine traverses the watershed of the Yuba River in a direction gen erally parallel with the crest of the Sierra. North Fork rises in lavas which vary much in composition and hardness, but which generally have a deep soil covering, with timber and brush growth. Middle Fork rises in similar lavas and granite. The main and tributary streams fall rapidly, and their canyons head well up in the mountains. The sides of these canyons are covered with timber and brush, which, with the deep soil, retain the moisture and feed numerous perennial springs. In the case of North Fork this is particularly noticeable. The forests of its watersheds make a reliable and constant stream. The mean annual precipitation for the basins of North and Middle forks is about 54 inches. Warm rains on soft snow sometimes give high flood discharge, but snow remains on the higher peaks until mid summer. The headwaters of South Fork lie upon a broad granite surface into which the streams have not cut deeply until the main stream reaches a point 16 miles from the summit, where it drops rap idly into a deeply eroded canyon. This part of the basin has a pre cipitation annually of about 60 inches. The entire drainage area of the Yuba contains nearly 100 small glacial lakes.
YUBA RIVER NEAR SMARTSVILLE, CAL.
This station was established June 2, 1903. It is located at what is called "The Narrows," 1 mile from Smartsville, Cal., 18 miles from the Southern Pacific Railroad station at Wheatland, Cal., and 20 miles from Marysville, Cal. The conditions at this station and the bench marks are described in Water-Supply Paper No. 177, page 160, where are given also references to publications that contain data for previous years.

142 SURFACE WATER SUPPLY, 1906.
Discharge measurements of Yuba River near Smartsville, CaL, in 1906.
Date.
March 23.......
April 17........April 18........April 26........
July 10.........July 11.........July 24.........
August 30......
October 2...... October 25.....
Hydrographer.
J. R. McKeel... .................................do................... ........ . ....
.....do.........................................
.....do.........................................
.....do.........................................F. R. S. Buttemer. ..........................J. R. McKeel. .................................
.....do.........................................
.....do.........................................
.....do.........................................
.....do.........................................
.....do.........................................
.....do. ........................................
.....do.........................................
.....do.........................................
.....do.........................................R. S. Ilawlev .......................................do......"..........-.............................do..............................................do.........................................J. R. McKeel.......................................do..............................................do..............................................do..............................................do....--...-.--.-.-.-...........-.-.--..........do.........................................R. S. Hawley.. ................................ .....do......"...................................
Width.
Feet. 7379
ISOISO18718918 «260211210280SCO
242240
257257aeo173162ie<)1561561501EO150150150150147 146
Area of section.
Sq.ft. 147153
1,400984663575631
1,5701,0201,0201,8502,660
1,3401,3801,3201,6501,5801,8201,1801,010
965710679560505484459469487440 453
Gage height.
Feet. 1.701.806.305.705.405.325.508.006.856.909.80
12.20
7.20
6.657.70
8.156.072.472.23O ne
9.809.459.359.259.309 Oft
9.10 9.10
rchs
Se
Daily gage height, in feet, of Yuba River near Smartsville, CaL, for 1906.
Day.
x23. ..............4...............
6...............1.. .............8...............9...............
10...............
11...............12...............13............. .14............... 15...............
16...............17...............18...............19...............20. ..............
21...............22...............23...............24. ..............25...............
26...............27...............28...............29. ..............30. .............31...............
Jan.
1.81.71.71.71.7
1.71.71.71.61.8
1.84.79.78.5
11.0
11.09.7
17.013.Q8.9
8.07.47.06.76.3
6.16.0
a 5. 95.85.75.6
Feb.
5.55.55.55.45.4
5.45.35.35.35.6
5.55.45.35.48.3
6.76.16.48.57.0
8.47.47.77.77.8
7.48.5ao
Mar.
7.47.07.57.36.9
6.76.86.86.86.9
7.012.08.88.8 8.1
7.57.2
«6.96.76.6
7.19.6
10.012.211.6
12.49.58.68.09.4
14.0
Apr.
9.78.78.07.57.3
7.27.27.37.37.3
7.17.07.17.07.2
7.27.37.37.47.5
7.57.57.37.06.7
6.86.66.46.76.8
May.
7.17.57.98.08.1
8.08.08.08.28.1
8.47.67.0
a 7.1 7.3
6.36.26.16.26.3
6.26.15.95.56.6
8.88.79.07.76.76.3
June.
6.36.46.7
10.08.0
7.06.56.16.3
a(j 7
7.08.06.65.7 5.7
7.05.85.06.25.9
5.35.05.14.34.2
4.03.83.73.53.5
July.
3.53.84.03.73.5
3.23.02.8
2.5
2.12.42.32.2 1.8
1 71.61.61.41.2
1.11.0
0.90.8
.7
.5
.32
J*Ug.
10.09.90 Q
9.80,9 g
9.89.89.79.79.7
9 7a 9. 6
9 69.6 9 6
9.69.59.59.5
9.59.5Q ^
9.59.5
a 9. 49.49.4
" 949.49 4
Sept.
9.49.39.39.39.3
9.39.39 39.29.2
9.29.29.29.2 9.3
9.39.29.2
0999.2
9.29.2Q 9
9.29.2
9.29.29.29.29.1
Oct.
9.19.19.19.19 1
9.09.09.09.09.0
9.09.09.09.0 9.0
9.09.19.19.19 1
9.19.19 19.09.0
9.09.09.09.09.09.0
Nov.
9.09.19.1
12.7
10.09 79.59.59.4
9.49.49.49.4 9.4
9.69.59.49.39.3
9.39.39.39.39.3
9.39.39.39.29.3
a Estimated. NOTE, The datum of the gage was lowered 10 feet August 1,

BEAR RIVER DRAINAGE BASIN. 143
Daily discharge, in second-feet, of Yuba Rirer near StnartsiiUe, Cal.,for 1906.
Day.
1..........2..........3..........4..........5..........
6..........7..........8..........9..........
10..........
Tl. .........12..........13.......... 4..........
16..........1 7.........."8..........19..........::o..........21..........22. .........;:^;:4.;:5..........26..........<i72®,r^>30. .........31..........
Jan.
600
555555555
555
555
600
600
11,50018,900
18,90016,900
33,000
4, 7303,800
3,4003,2103,0402,8602,7002,540
Feb.
2,390o 3902' 390
,250
,250ion
,120
,540
10,200
11,100
10,7006, 810
7,8508 230
11,1009,000
Mar.
6,810
7,150
5,260
4 9904,990
oo 4Ao
4,730
16,400
29,40026,400
30,40015,90011,6009,000
15,40040,000
Apr.
i o rnn
11,7009 100
S OKrv
8 7nn
8,600
8 nnn
7 ^nn
8,100
8 1 nn
c cnn
9 900
8 6007,650
7,3507,800
May.
9 0001 n f^An
19 cnn
1 9 cAn
1 9 ^nn13 GOOi ^ onn
8 i;r\r\
q ^00m nnn
0 Q50
6 8007 °00
7 1 CA
6 rnnc 7^n
18, 700
20,10013,70010,0008,800
June.
8 QT&A
9 350in f^ftoon ft An
12,200
13 10018 00011,700
0 -f|A
8 snn
14,100
7,200
10, 300
8 4nn
8 1 nn0, 100
5,700
5,3005,0005,100
July.
5, 2006 nnn6, GOO
E QAA
4,8004 550
4, 3204,1203,9203, 130
o 9502' 7802,780
2,160
2 n^n
1, 700
1,3401,250
Aug.
1 0409*^0920
800
ftAA
ftnn
snn
wnn740
680680680680
680680
680
020
020620620
Sept.
620560^An560
e^fl
560rcA
500500
cr\n
500
500560
^nn
EAA
EAA
Kf|A
fyinCAA
cftn
500440
Oct.
440
QCAoori''SO
oori
380
380380OQfl
OQAqon
38044nAAf\
AAf\
440
380
9 en
380380380
Nov.
5 nnn
800
680
5^0520520K9fi
740680520
cftfi
CCA
560
560500560
Dec.
C£fl
KCA
560
can
1 8891,170
4,100
o §50
9 TAO
o goo
2,350
2,350
3,70011,300
2° 8008,0006,0004,3005,3005,300
NOTE. These discharges were obtained partly by rating tables and partly by the indirect method ''or shifting channels.
Monthly discharge of Yuba River near Smartsville, Cal.,for 1906. [Drainage area, 1,220 square miles.]
Month.
April ........................
July..............................
Discharge in second-feet.
Maximum.
48,000 11,100 40,600 18,100 20,100 25,600 6,600 1,040
620 440
5,000 22,800
48,000
Minimum.
515 2,120 4,480 6,450 5,750 5,000 1,170
620 440 380 380 560
380
Mean.
7,560 4,970
12,000 8,770
10,800 10,000 3,350
744 520 403 757
4,130
5,330
Total in acre-feet.
465,000 276,000 738,000 522,000 664, 000 595,000 206,000 45,700 30,900 24,800 45,000
254,000
3,870,000
Run-off.
Sec.-ft. per sq. mile.
6.20 4.07 9.84 7.19 8.85 8.20 2.75 .610 .426 .330 .620
3.39
4.37
Depth in inches.
7.15 4.24
11.34 8.02
10.20 9.15 3. IT .70 .48 .38 .69
3.91
59.43
NOTE. Values are rated as follows: February and March, excellent; June, November, and Decem ber, fair, on account of the lack of measurements: remainder of 1906, good.
BEAR RIVER DRAINAGE BASIN.
DESCRIPTION OF BASIN.
Bear River drains an area of 287 square miles between Yuba and American rivers. Its headwaters do not reach back to the crest of the range, so that it seldom receives precipitation in the form of lasting snow, It is torrential in character, having no forested 8teas except

144 STJKFACE WATER SUPPLY, 1906.
in its upper portion. The rainfall records kept by the Central Pa from Auburn to Emigrant Gap are indicative of the precipitatic the southern part of its basin. A 28-year record at Grass Valley ir northern portion of its watershed gives a mean of 49.41 inches.
BEAR RIVER ABOVE WHEATLAND, CAL.
This station was established on October 8, 1904. It is located a1 800 feet below McCourtney Crossing and 8 miles above Wheatl The conditions at this station and the bench marks are describe Water-Supply Paper No. 177, page 165, where are given also r ences to publications that contain data for previous years.
Discharge measurements of Bear River above Wheatland, Cal., in 1906.
Date.
March 10 ......
April 12.......
April 27.......April 27...... .May 19........July 12........
Hydrographer.
.....do.........................................
.....do.........................................
.....do.........................................W. C. Sawyer .......................................do............ ..................................do..............................................do..............................................do.........................................R. S. Hawlev.. ............................... ......do............ ..................................do..............................................do.........................................
Width.
Feet. 12315611813714413914014113053587525
Area of section.
Sq.ft. 117323292284232181186236100
57386120
Gage height.
Feet. 4.556.104.975.605.344.834.855.224.023.573.303.28
cr
8
Daily gage height, in feet, of Bear River above WTiec.tland, Cal., for 1906.
Day.
1...............o3...............4.... . .......5...............
6...............7...............8...............9. ............. .
11...............12...............13...............14...............15...............
16...............17...............18. ..............1920...............
21...............22...............23...............24...............25...............
26...............27...............28...............29...............30...............31...............
Jan.
go3.13.13.13.0
3.03.13.03.03.0
3.03 9
10.35
10.5
11.658.5
14.5512.259.5
6.56.05.75.45.2
5.04.94.84.74.74 fi
Feb.
4.64.64.54.54.5
4/44.44.44.54.6
4.74.54.54.46.4
5.45.14 96.95.9
7.76.7
6.56 9
6.16.557.0
Mar.
6.05.75.56.55.8
5.55.35.15.04.9
4.87.556.37.68.7
6.66.15.75.45.2
5.77.26.8
11.7
12.38.37.26.87.4
15.25
Apr.
8.77.36.86.46.2
6.05.85.65.45.5
5.75.45.2
5.04.94.94.84.8
4.84.74.754.85
4.84.9
4.74.7
May.
4.54.64.54.44.4
4.44.34.34.34.3
4.4
4.34.24.6
4.34.24.24.14.1
4.14.14.04.04.45
5.66.858.656.65.95.4
June.
5.25.05.06.05.4
5.75.25.04.8
4.64.74.5
4.4
4.94.54.44.34.3
4.24.24.24.24.1
4.14.14.14.04.0
July.
3.93.93.83.83.7
3.73.73.73.63.6
3.53.5
3.4
3.43.43.33.33.3
3.33.33.23.3
3.23.23.23.23.23.2
Aug.
3.23.23.13.13.1
3.1.3.13.13.1
3.13.13.03.03.0
3.0
3.03.03.0
3.03.0
3.0Q n
3.03.0
3.03.03.0
Sept.
3.03.03.03.03.0
3.03.0
3.03.0
3.03.03.03.13.1
3.13.13.13.13.1
3.03.0
3.1
3.13.13.13.13.1
Oct.
3.03.03.03.0
3.03.03.03.03.0
3.0o O
3.13.13.0
3.03.13.13.13.1
3.13.1
3.13.1
3.13.13.13.03.13.1
Nov.
3.13.1
4.453.9
3.63.53.43.33.3
3.33.33.33.33.3
3.43.33.33.3
3.33.3
3.3
3.23.23.33.33.3

AMEEICAF EIVER DEAHSTAGE BASIF. 145
Rating table for Bear River above Wheatland, Cal.,for 1904-1906.
Gageheight.
Feet.3.003.103.203.303.403.503.603.703.803.904.00
Dis charge.
Sec.-ft.2033496992
118146177210246285
Gage height.
Feet.4.104.204.304.404.504.604.704.804.905.005.10
Dis charge.
Sec.-ft.328375425475530585645710780855930
Gage height.
Feet.5.205.305.405.505.605.705.805.906.006.206.40
Dis charge.
Sec.-ft.1,0151,1051.2001,3001,4051,5151,6251,7401,8602,1052,365
Gage height.
Feet6.606.807.007.207.407.607.808.008.208.408.60
Dis charge.
Sec.-ft.2,6402,9353,2503, 5753,9104,2654,6355,0205,4105,8106,220
Gage heifht.
Feet.8.809.00
10.0011.0012.0013.0014.00
Dis charge.
Sec.-ft.6,6407,0609,160
11,36013,66015,96018,360
NOTE. This table is based on discharge measurements made during 1904-1906 and is well defined between gage heights 3.1 feet and 5.1 feet.
Monthly discharge of Bear River above Wheatland, Gal., for 1906.
[Drainage area, 263 square miles.]
Month.
July..............................
November
Discharge in second-feet.
Maximum.
19,700 4,450
21,400 6,430 6,d20 1,860
246 49 33 33
502 13,400
21,400
Minimum.
20 475 710
'645 285 285
49 20 20 20 33 69
20
Mean.
3,130 1,500 3,970 1,390
870 644 113 26.5 26.1 26.7 90.7
1,770
1,130
Total in acre-feet.
192, 000 83,300
244, 000 82,700 53,500 38,300 6,950 1,630 1,550 1,640 5,400
109,000
820,000
Run-off.
Sec.-ft. per sq. mile.
11.905.70
15.105.283.312.45
.430
.101
.099
.102
.3456.73
4.29
Depth in inches.
13.725.94
17.415.893.822.73
.50
.12
.11
.12
.387.76
58.50
NOTE. These values are fair.
AMERICAN RIVER DRAINAGE BASIN.
DESCRIPTION OF BASIN.
American River drains an area of about 2,000 square miles of tne western slope of the Sierra Nevada. This drainage basir lies between those of the Bear and Yuba rivers on the north and that of Con- sumnes River on the south. It has three main forks, heading in the summit of the range, which reaches an elevation of abo^it 9,000 feet. The country lying between these main forks is drained by numerous small tributaries. The formation in the higher and greater portions of this basin is of granite, with a considerable timber growth. The flow is rather torrential during the winter months, due to the large area of barren and sparsely timbered country in the lower portion of the watershed. The precipitation on the higher elevations is in the form of snow, which usually melts late in the spring. Rainfall records have been kept along the line of the Central Pacific Railroad, which follows the ridge to the north of North Fork.
8591 IRR 213 07 10

146 SURFACE WATER SUPPLY, 1906.
The mean annual rainfall at Auburn is 33.40 inches, that at Co 47.4 inches, and at Cisco and Emigrant Gap about 50 inches. Georgetown, between North and Middle forks, a 30-year record an average of 56.72 inches, and at Placerville, above South F another of about the same length shows 43.58 inches.
There are several small lakes in the upper reaches of this basin, capacity of a few having been increased by th°- construction of dams at their outlets. Their water is stored for mining purposes c ing the low-water flow and is used entirely within the drainage ba
AMERICAN RIVER NEAR FAIROAKS, CAL.
This station was established November 3, 190 d , at Fairoaks Brie near Fairoaks. The conditions at this station and the bench mr are described in Water-Supply Paper No. 177, page 176, where given also references to publications that contain data for previ years.
Discharge measurements of American River near Fairoaks, Cal., in 1906.
Date.
April 6 ........April 13 .......April 23 .......April 30 .......April 30 .......May 21 ........May 21 ........
July 7 .........July 16 ........July 27... .....
November 26 . .
Hydrographer.
.....do.........................................R. S. Hawley................. .................W. C. Sawyer. ......................................do..............................................do..............................................do.............................................do.........................................
.....do.........................................
.....do.........................................
.....do.........................................
.....do.........................................
.....do.........................................
.....do. ........................................
.....do.........................................
W. F. Martin.......................................do.........................................R. S. Hawley..................................
Width.
Feet. 3003523603763673523523543543703603693663543452482102a^206
Area of section.
Sg. ft. 1,4002,1802,4902,5802,9402,4502,3902,6402,6803,5103,0002,7702,6201,7301,260
854648620569
Gage height.
Feet. 3.665.957.307.268.547.247.157.807.90
10.509.008.357.905.404.002.681.751.641.45
D cha
Sec
1
111
1
1
Daily gage height, in feet, of American River near Fairoaks, Cal.,for 1906.
Day.
1...............2. ..............3...............4...............5...............
6............... 1. .............. 8...............9
10...............
13...............14...............15. ..............
Jan.
1.51.41.41.51.2
1.2 1.5 1.21.41.2
1.41 7^1
5.858.356.75
Feb.
3.653.55
3.63.65
3.753.7
3.84.1
3.85 ? 7
3.754.26.05
Mar.
6.86. 47.9
(13
5.95 5.95 5.956.16.15
6.459.259. 7
12.8511.35
Apr.
10.49.68.88.257.4
7.1 7.157.67.357.65
7.27.27.65
May.
7.68.458.459.2
10.4
9.85 10.3 10.259.69.75
10.1
8.78.08.05
June.
9.19.45
10.39.759.1
8.7 9.0 9.259.259.75
10.811.09.959.18.9
July.
7.458.358.258.08.15
7.4 7.25 7.056.96 2
6.05.855.85.95.65
Aug.
3.353.153.23.12.95
2.75 2.7 2.752.72.65
2.72.72.452.42.4
Sept.
1.81.751.81.71.8
1.65 1.6 1.61.61.5
1.51.51.51.51.6
Oct.
1.31.41.351.31.3
1.3 1.3 1.31.31.3
1.31.251.21.251.2
Nov.
1.351.41.551.953.4
2.75 2.25 1.91.751.6
1.61.551.61.61.6

AMERICAN RIVER DRAINAGE BASIN. y 147
Daily gage height, in feet, of American Hirer near Fairoaks, C'al., for 1906 Continued.
Day.
1617.............18.............1920.............
21.............22.............23............. 24. ............ 25.............
26....... ....27............. 28.............29............. 30.............31
Jan. '
. 9.3. 10.55. 15.45. 15.5 ,. 9.85 '
. 6.85J 6.25. 5.2 .1 5.05 .' 4.9
. 4.4
. 4.05
. 4.25
. 4.0 '
. 3.7
Feb.
6.05 6.0 5.3 8.35 6.6
9.35 8.35 7.0 6. 65 7.0
6. 5 6. 57.8
Mar.
8.85 8.3 6. 65 6.2 6.0
6.0 8.1 9.95
13.35 12. 65
12.00 10.45 9.157.85 8.45 9 95
Apr.
8.0 8.08.1 7.85
7.68.2 8.7 8.5 7.95
7.65 8.3 8.458.2 7.6
Rating table for American
Gage height.
Feet. 1.20 1.30 1.40 1.50 1.60 1.70 1.80 1.90 2.00 2.10 2.20
Dis charge.
Sec.-ft. 300 340 380 420 470 520 570 630 690 760 830
Gage Dis- height. charge.
Feet. Sec.-ft. 2. 30 910 2. 40 990 2.50 1,070 2.60 1,160 2.70 1,250 2.80 1,350 2.90 1,450 3.00 1,550 3. 10 1. 650 3.20 | 1,760 3.30 ! 1,870
May.
7.75 7.5 7.7 7.35 7.25
7. 6 7.4 7.15 7.1
9.75 9.7
11.75 11.25 8.85 8.6
June. " July.
9.8 9.85 9.458.25 8.8
9.7 10.25 10.25 9.4 8.35
8.1 7.1 6. 85 6.85 6.65
5.45 5.3 5.04.8 4.6
4.6 4.4 4.35 4.35 4. 4
4.35 4.15 3.95 3.P5 3.7 3.5
Aug.
2.25 2.2 2.15 2.12.1
2.12.15
2.0 2.0
1.85 1.9 1.7 1.7 1.7 1.75
Sept.
1.7 1.6 1.5 1.5 1.4
1.4 1.3 1.3 1.3 1.35
1.3 1.35 1.4 1.3 1.35
Oct. Nov. Dec.
1.2 1.7 1.25 1.8 1.2 1.7 1. 25 1. 6 1.3 1.6
1.3 1.6 1. 3 1. 6 1. 3 1. 6 1.3 1.6 1.3 1.6
1.3 1.6 1.3 1.5 1. 35 1. 5 1.4 1.5 1. 35 1. 5 1.4 .......
2. 85 2.65 2.55 2.5 2.45
2.4 2.8 3.65 3.55 5. 7
9.95 9.45 6.25 5.15 5.5 5.8
Hirer near Fairoaks, Cal., for 1906.
Gage Dis- height. charge.
Feet. Sec.-ft. 3.40 1,980 3.50 2,090 3. 60 2, 200 3.70 ! 2,310 3. 80 2, 420 3.90 : 2,540 4.00 , 2,660 4. 20 2, 920 4. 40 ; 3, 260 4.60 ' 3,6"0 4. 80 3, 980
Gage Dis- height. charge.
Feet. 5.00 5.20 5.40 5.60 5.80 6.00 6.20 6.40 6.60 6.80 7.00
Sec.-ft. 4,380 4,780 5,180 5,600 6,040 6,540 7,060 7,580 8,100 8,620 9,140
Gape height.
Feet. 8.00 9.00
10.00 11.00 12.00 13.00 14.00 15.00 16.00
Dis charge.
Sec.-ft. 12,100 15,380 18,980 22,900 27,100 31,300 35,500 39,700 43,900
NOTE. This table is based on 19 discharge measurements made during 1906, and is well defined between gage heights 1.4 feet and 10.5 feet.
Monthly discharge of American Hirer near Fairoaks, Cal., for 19U/J.
Month.
May.....................................................
July......................................................
"
Discharge in second-feet.
Maximum
41,800 16,600 32,800 20,500 26, 000 22,900 13,200 1,920
570 380
1,980 19,900
41,800
Minimum.
300 2,140 6,410 9,420 9,420 8,230 2,090
520 340 300 360 420
300
M»an.
7,010 5,830
13,900 a. 12, 100
15,000 15,900 6,180 1,010
433 338 567
3,900
6,8.50
Total in acre-feet.
431, COO 324,000 855, 000 720,000 922, 000 946, 000 380,000
62, 100 25, 800 20,800 33,700
240,000
4, 910, 000
<z Discharge for April 11 and 12 interpolated.
NOTE. These values are excellent.

148 SUEFACE WATER SUPPLY, 1£06.
SA^T JOAQUIN RIVER DRAINAGE BASIN.
DESCRIPTION OF BASIN.
San Joaquin River is divided into two distinct parts. The va portion forms the central drainage line of the San Joaquin Val and during the spring is navigable for 100 miles or more. Sta laus, Tuolumne, Merced, and Kings rivers are the largest stre^ in this portion of the drainage basin. The waters of Kings, Kawe Tule, and Kern rivers, which are located in the portion of the ! Joaquin Valley south and east of Fresno, although forming a j tion of the drainage of San Joaquin River, seldom reach this stre their entire flow, except in extreme flood, being diverted and u for irrigation at points where they emerge from the foothills. r valley is fertile and almost destitute of timber. The mountain portion of the stream drains the western slope of the Sierra Nev between Merced River on the north and Kings River on the soi the crest of its divide reaching an elevation of 13,000 feet in Mo Lyell and an elevation of 14,000 feet in Mount Goddard. Tr are numerous tributaries in this portion of the drainage basin, m* of which have their source in the high elevations. The formatio of granite, which in the upper reaches is bare and sharply marked glacial action. The middle reaches of the basin are well timbe- the timber diminishing on the lower foothills, which have a co^ ing of brush and grass. The precipitation takes the form of sr on the higher elevations. The fall of the river is rapid, with m favorable locations for power development. There are numer lakes in the upper reaches of the basin. A storage reservoir has b constructed on North Fork, which will tend to further regulate flow of the river.
MAIN SAN JOAQUIN RIVER.
SAN JOAQUIN RIVER AT HERNDON, CAL.
The gage rod at this station was established by the enginee' department of the Southern Pacific Railroad Company in 1£ The old trestle bridge was torn down by the railroad company dm 1899 and a new iron structure was erected in its place. The c ditions at this station and the bench marks are described in Wa Supply Paper No. 177, page 184, where are given also reference^ publications that contain data for previous years.

SAN JOAQUIN RIVER BASIN. 149
Daily gage height. in feet, of San Joaquin River at Hcrndon, (M., for 1906.
Day.
1.... ...........9
3..... .........4 ...........
6...............
8...............9...............
10...............
11. . ...........I913... . .........14... ........... 15...............
10............... 17. .........18............... 19...............20..............
2\.. .............99
2324 .........25...............
26...............27............ .i)Q
29. . ..... . . 30.... .......... 31...............
Jan.
2.652.652. 052.652.65
2.652.652.652.052.65
2.052.65
10.5 6.5
4.9 4.0 4.0
13.09.0
5.24.54.24.0
4.0
4.0 3.75 3.5 3.4
Feb.
3.253.253.13.13.1
3.13.13.13.13.0
3.03.03.03.25 3.4
3.4 3.65 4.2 4.24.1
4.0
4.24.254.25
4.2
Mar.
4.23.753.755.04.5
4.254.14.04.24.25
4.25
6.356.0
10.0
8.5~'.Q 6.06.0
6.0
9.008.58.4
7. 2 G.5 7.35 S. 25
Apr.
8.57.06.656.56.35
5.755.65
g.O6.5
7.356.656.656.4 6.65
6.65 0.05 7.0
8.2
8.08.4
10.08.357. 75
8.0 7.75 0. 75
May.
0.40. 757.58.358.5
9.49.65
10.09.75
11.0
12.3512.011. 2510.2 9.65
9.09. 25 9.5
10.410.5
10.0510.010. 3510.0
9. 35
q 75
11.6 10. 35 10.0
0 05
Juno.
8.48.258.58.758. 65
9.a58.59.0
10.2511.0
11.512.512.7511.75 11. 5
12.0 13.0 12.0 12. 3513.2
14.3513.6513.013.012. 65
11.211.0 10.35 10.0
July.
10.511. 2511.412.512.25
12.012.011.7511.6511.0
10.6511.010.6510.65 10.65
10.5 10.5 10.5 10.09.05
9.5
9.7510. 3510.0
9. 059.5 9.0 8.5
Aug.
8.27.657.27.07 0
7.06.656.06.60.4
0.250.250.50.56.4
6.2 6.2 6.1 6.16.0
6.06.0
5.5
5.0 4.65 4.5
Sept.
4.354.354.354.254.25
4.254.24.24.24.0
4.03.653. 653.6 3.5
3.5 3.5 3.4 3.43.35
3.353.353.353.353.2
3.23.23.2 3.2 3.2
Oct.
3.23.23.23.23.2
3.23.13.13.13.1
3.13.13.13.1 3.1
3.1 3.1 3.0 3.03.0
3.03.03.03.03.0
3.03.03.0 3.0 3.0 3.0
Nov.
3.03.03.03.03.0
3.03.03.03.03.0
3.03.03.03.0 3.0
3.0 3.0 3.0 3.03.0
3.03.03.03.03.0
3.03.03.02.85 2.6
Dec.
2.62.62.6
2.5
2.52.52.52.52.5
2.53.03.5 3.25
3. 25 3.1 3.0 3.03.0
3.03.03.03.03.0
3.5
3.65 3.75 3.75 3.75
NOTE. Gage heights have been reduced to feet and tenths from feet, and inches as furnished by the Southern Pacific Railroad Company.
MISCELLANEOUS MEASUREMENT IN SAN JOAQUIN RIVFR DRAINAGEBASIN.
The following measurement was made of San Joaquin Fiver Novem ber 21, 1906, from the bridge at Polasky, Cal.:
Width, 133 feet; area. 194 square feet; discharge, 333 second-feet.
KERN RIVER DRAINAGE BASIN.
DESCRIPTION OF BASIN.
Kern River drains 2,345 square miles of the western slope of the Sierra Nevada at its extreme southern limits. This drainage basin is the largest of any stream discharging into the San Joaquin Valley, having an area 600 square miles greater than that of Kings River. It has its source in the highest elevations of the Sierra Nevada, drain ing the western and southern slopes of Mount Whitney and numerous other high granite peaks grouped about it, which reach elevations of over 14,000 feet. Its general direction is south for aVout 65 miles, when it turns and flows in a southwesterly direction, discharging into the San Joaquin Valley east of Bakersfield, Cal. Extending, as it

150 SURFACE WATER SUPPLY, 1906.
does in its upper reaches, for some distance parallel with the Sie Nevada, it receives waters not only from the main crest on the ei but also from a somewhat lower divide on the west behind the bas of the Kaweah and Tule rivers. It has numerous tributaries, principal ones, which drain the higher elevations of the main ci of the Sierra Nevada, entering from the east. The topograprn extremely rough and broken in the upper reaches of this bat becoming less rugged in the middle portion in the vicinity of Ke ville, where there is quite an extensive valley with considerable cu vated land; below this point the stream enters a rough cany finally discharging into the flat country of the San Joaquin Vail The entire flow, except during extreme flood stages, is diverted t used for irrigation at points where streams emerge from the fr hills.
The formation is of granite, which, above the 10,000-foot contc is practically bare of timber growth. Between elevations of 3, and 10,000 feet there is a good depth of soil, with timber and bri covering; the lower reaches have a light covering of brush and gn
There are several lakes and marshes scattered throughout t basin, but they are less numerous than in the basins farther to north. Several power plants are located on this stream, none which, however, receive water from storage reservoirs, the diversi being made from the natural flow of the river and again returned the river channel. The precipitation is very light throughout 4 basin, with the possible exception of the high elevations surround Mount Whitney, where the snow remains through the sumi months.
KERN RIVER NEAR BAKERSFIELD, CAL.
This station, established in 1893 by Walter James, chief engin of the Kern County Land Company, is located at what is known "first point of measurement," 5 miles above Bakersfield and at mouth of the canyon of the river.
Regular meter measurements are taken, and an automatic g records daily fluctuations of the river heights. A. K. Warren, engineer in charge of this work for the Kern Connty Land Compa attends to the discharge measurements with accuracy and precis and furnishes the Geological Survey with the final results. Irr mation in regard to this station is contained in Water-Supply Paf Nos. 81, 85, 100, 134, and 177 of the United States Geological Surv

KEEN KIVEE DEAINAGE BASIN. 151
Daily discharge, in second-feet, of Kern River near Bakersfield, Gal., for 1906.
Day.
1........ .......2...............3...............4...............5...............
6...............7........-.-..-.8...............9...............10...............
11...............12...............13...............14......... .....15...............
16. ..............
18...............1920...............
21...............22.... .......... .23.. ...... .......24. ..............
26...............27...............28. ..............9030. ..............31...............
Jan.
242253230233241
253
260
269267272
1,6261,828
1,293
6871,3702,554
1,145931807746698
551548
Feb.
529513506509529
538560
646
589610568538574
684701661646
785739681665
710735773
Mar.
854806779795842
765
785
8961,0261,9961,9451,716
5,264
3,025
1,807
1,8541,9782,2843,417
3,9834,150
2,5272,818
Apr.
2,9802,6512,4242,2912.172
2,0512,0101,9702,1352,296
2,3022,2782,3362,4842,635
2,767
3,032
3,343
Si 9114,1354,2553, 853
3,692
2,973
May.
2,8462,7982,9863,3373,786
4,4344,6085,2786,0976,782
6,6246,1335,6875,6405,886
6,3486,8687, 339
7,4437.381
.7,0256,4926,184
7,6607,8327,420
6,1025,646
June.
5,4165,3535,3065,4955,964
6,1265,7885,9326,3116,797
7,2138,1908,8299,0799,072
9,1429,0048,8198,993
9,5059,5059,3119,1078,948
8,6688,1877,5297,1437,010
July.
7,3697,7658,2518,4318,246
8,1297,9737,7297,6077,257
7,1767,2117,0726,7056,628
6,7196,6036,254
5,870
5,4394,9975,6485,9205,595
5,347
5,2694,6594,3113,925
Aug.
3,5523,2823,2363,1472. 953
2,905 2,8802,8522,7692,627
2,5362,5482,4732,3772,276
2,2112,2152,2062,0972,215
2,1922,0711,8401,6621,540
1,4461.4051,4351,4671,4341,431
Sept.
1,5221,4381,3691,2971,255
1,2011,1671,1111,0641,039
1,030983938919916
891883883839807
809806788785781
777755
715704
Oct.
697705695677680
687622618634639
645647649631612
613592564554555
564560558564559
562568557553564565
Nov.
546570566554550
580555528539516
499502518520529
514462446476468
433450474462440
446478479487502
Dec.
518517542575545
506530552587676
675654677653601
589587584562556
552560556550562
592948914802732697
Monthly discharge of Kern River near Bakersfield, Col., for 1906.
[Drainage area, 2,345 square miles.]
Month.
July..............................
Discharge in second-feet.
Maximum.
2,554 785
5,527 4,255 7,832 9, 5058,431 3,552 1,522
705 580 948
9,505
Minimum.
230 506 755
1,970 2,798 5,306 3,925 1,405
704 553 433 506
230
Mean.
693 626
2,063 2,910 5,859 7,704 6,503 2, 299
973 609 503 618
2,613
Total in acre-feet.
42,600 34,800
127,000 173,000 360,000 458,000 400,000 141, 000 57,900 37,400 29,900 38,000
1,900,000
Run-off.
Sec. -ft. per sq. mile.
0.296 .267 .380
1.24 2.50 3.29 2.77
.980
.415
.260
.215 .264
1.11
Depth in inches.
0.34 .28
1.01 1.38 2.88 3.67 3.19 1.13 .46 .30 .24 .30
15.18
TULE RIVER DRAINAGE BASIN.
DESCRIPTION OP BASIN.
Tule River rises in the Sierra Nevada, and drains1 the country between Kaweah River on the north and Kern River on the south and east. Its drainage area is much less than that of Keweah River,

152 SURFACE WATEK SUPPLY, 1906.
although of the same general character. It has numerous small tri taries, few of which have their source at elevations above 8,000 f Its drainage basin does not extend back to the main divide, be cut off by Kern River, which reaches to the north and drains higher portion of Sierra Nevada east of Tule Fiver. There is g timber and brush covering on the higher and middle elevations, v grass and scattering timber on the lower elevations, where the soi extensively cultivated. Below the gaging station the water is diver by several canals and used for the irrigation of land in the vicinity Portersville, where it is especially adapted for the raising of cit fruits. During the flood period the water discharges through old channel, and either sinks in the sand or finds its way to the bed of Tulare Lake. The mean precipitation is probably not m than 20 inches, and falls principally in the form of rain.
TULE RIVER NEAR PORTERSVILLE, CAL.
This station was established April 8, 1901. It is located abor miles east of Portersville, near the McFarland ranch, 100 feet be wagon bridge and about 1 mile above the mouth of South Fork of T River. The conditions at this station and the bench marks described in Water-Supply Paper No. 177, page 189, where are gr also references to publications that contain data for previous years
Discharge measurements of Tule River near Portersville, Cal., in 1906.
Date.
May 24. ........
July 20.........July 26.........
Hydrographer. Width .
Feet. C. H. Lee ...................................... 76
R. S. Hawley......... ......................... 80C. H. Lee.................-.................... 1 159.....do.........................................! 88..... do............ ............................. ! 84
.....do......................................... 73C. H. Lee................... ................... 69R. S Hawlev... ............................... 59.....do......................................... 58.....do......................................... 58
Area of section.
Sq. ft.
211
287251278132112464747
Gage height.
Feet. 3.024.42
3.62
4.654.10
2.659 301.401.401.44
Di cha'
Sec
i
Daily gage height, in feet, of Tule River near Porterstille, Cal., for 1906.
Day.
1.. .............
3...............4...............
6...............
8...............9..-.-....-.....10...............
Jan.
2 1
2.01.91.9
1.91.871.851.831.8
Feb.
2.02.02.02.02.0
2.02.02.22.152.1
Mar.
2.42.42.43.6
3.13.02.92.82.7
Mar.
2.42.42.43.63.2
3.1
Apr.
4.8
May. June.
3.64. 6 3. 64. 0 3. 7
4.64.64.4
3. 8 3. 8 4. 23.8 4. 0 , 4. 1
4.4 3. 9 4.03.0 4.0 3.9 4.02. 9 3. 0 4. 12.82.7
4.13. 6 4. 1 4. 23. 8 4. 4 4.3
July.
3.73.83.73.6
Aug.
2,052,01.951.95
3. 5 1. 9
3.553.5
-1.91.85
Sept.
1.51.51.51.451.45
1.451.45
3. 2 1. 85 1. 453. 2 1. 8 1. 43.15 1.8 1.4
Oct.
1.31.31.31.31.3
1.31.31.31.31.3
Nov.
1.41.41.41.41.4
1.41.41.41.41.4

TULE EIVEE DRAINAGE BASIN,
Daily gage height, in feet, of Tule River near Portersmlle, Cal.
153
for 1906 Continued.
Day.
12...............
14...............15...............
17...............18...............1Q
20...............
21...............
23. ..............2425...............
26. ..............27...............28............... 2930. ..............31...............
Jan.
1 82.0
7.353.85
3.02.87.04.1
3.3 2 9o 72.52.4
2.39 9
2.15
2.03
Feb.
2.0
2.03.1
2.8
2.69 ^2.5
2. 7 2. 652.62.52.45
2. 42. 42. 4
Mar.
2.76.6
4.28.35
5.0A Z
4.2
4.25.46.0
5.24.5 4.34.35.4
Apr.
3.63.63.63.6
3.63.63.6
3.7
3.S 4.04.254.03.7
3.44.63 S3.7
May.
4.54.254.04.0
4.14.1
4.0
3.9 3.83.73. 653.6
6.46.556.5
5.04.7
June.
4.44.54.44.34.35
4.354.34 QE;
4.35
4.34.44.34.24.0
3.953.93.7 3.73.7
July.
3.0
2.85
2.7
2.6
2.452.42.35
2.32.252.25
2.1
Aug.
1.75
1.71.65
1.55
1.55
1.5 1.5
1.5
Sept.
1.41. 41.41. 41.4
1.41.41.35
1.35
1.41.45
1.41.41.35 1 Q51.3
Oct.
1.31.3
1.31.3
1.31.31.31.3
1.3 1.3
1.351.35
1.351.351.351 3^
1.35
Nov
1. 41. 41. 41. 41.4
1.41. 41.41.45
1.45 1.451.451.451.45
1.451.451.451 4^1.45
Dec.
2.6
2.01.81.5
1.651.651.651.651.65
1.65 1.651.651.651.65
2.32.12.0
1.91.9
Rating table for Tide River near Portersville, Cal.,for 1906.
Gageheight.
Feet.1.301.401.501.601.701.801.902.002.10
Discharge.
Sec.-ft.374758708398
115132
Gage Dis-height, charge.
Feet.2.202.302.402.502.602.702.802.90
150 3.00
Scc.-ft.170190210235260285315345380
Gage Dis-height. charge.
Feet.3.103.203.303.403.503.603.703.803.90
Sec.-ft.420460500
Gageheight.
Feet.4.004.204.40
540 4. 60580 4. 80630 5. 00680 5. 20
Discharge.
Sec.-ft.840960
1,0901,2301,3701,5101,660
730 5.40 1,820780 , 5.60 1,980
Gage '' Dis-height. | charge.
Feet.5.806.006.206.406.606.807.008.009.00
Sec.-ft.2,1402,3002,4602,6402,8203,0003,1804,0804,980
NOTE. This table is based on discharge measurements made during 1904-1906, end is well defined between gage heights 2.2 feet and 6.7 feet.
Monthly discharge of Tule River near Portersville, Cal.,for 1906.
[Drainage area, 437 square miles.]
Month.
June .....July............... .
Discharge in second-feet.
Maximum.
3,500 420
4,5*0 1,370 2,780 1,230
730 141
58 42 52
260
4,530
Minimum.
98 132 210 540 630 680 150 58 37 37 47 52
37
Mean.
500 200
1,370 772
1,080 972 362 84.3 47.4 38.5 48.8 97.1
464
Total in acre-feet.
30,700 11,100 84,200 45,900 66, 400 57,800 22, 300 5,180 2,820 2,370 2,900 5,970
338,000
Run-off.
Sec.-ft. per sc. mile.
1.14 .458
3.14 1.77 2.47 2.22 .828 .193 .108 .088 .112 .222
1.06
Depth in inches.
1.31 .48
3.62 1.98 2^85 2.48 .95 .22 .12 .10 .12 .26
14.49
NOTE. Values are rated as follows: January, February, and July, good; March to June, excellent; August to December, fair.

154 SURFACE WATER SUPPLY, 1906.
MISCELLANEOUS MEASUREMENTS IN THE TULE 1UVER DRAINAGE BA
The following miscellaneous measurements were made on Sc Fork of Tule River at a point one-half mile above the junctio- South Fork with main Tule River:
May 26: Width, 40 feet; area, 100 square feet; discharge, 044 second-feet. July 26: Width, 25 feet; area. 35 square feet; discharge, 64 second-feet.
KAWEAH RIVER DRAINAGE PASIN.
DESCRIPTION OF BASIN.
Kaweah River drains the western slope of the Sierra Nev between the basins of Kings River on the north and Kern and r rivers on the south. This is an important stream, but its waters is only about one-third that of Kings River and is much less elevf and snow covered than those of the Kings and Kern rivers. It a number of tributaries which have their sources in numerous h and meadows on the higher elevations. The formation is of gra and similar in every way to that in the Kings River basin, greater part of the area of 619 square miles above the gaging sta is well covered with brush and timber. In this basin is situated Sequoia National Park, where the largest grove of big trees (8eqr gigantea) of the Sierra Nevada is found. Two power plants on stream owned by the Mount Whitney Power Companj^, divert w from Middle and East forks. By building low dams at the or of some of the larger lakes, in the upper reaches of the basin, company has constructed several small reservoirs, in which the w held back for use during the low-water flow of the stream, and i great benefit to irrigators in the valley during the late summer mon About 6 miles below the gaging station the river leaves the foot1 and flows across San Joaquin Valley in a general southwest direction to the old bed of Tulare Lake. After it leaves the foot1 many canals divert water for the purpose of irrigating land in Tu County, which is especially adapted to the raising of fruits.
The mean annual precipitation in the baein above the ga£ station is from 20 to 40 inches, which falls in the form of snow c probably one-half the area.
KAWEAH RIVER BELOW THREE RIVERS, CAL.
This station was established April 29, 1903. It is located £ point three-fourths of a mile below the confluence of the No Middle, and South forks, 10 miles from the Southern Pacific Railr station at Lemon Cove, Tulare County, Cal., and one-fourth i west of the wagon road from Exeter to Three Rivers. The condit^

KAWEAH RIVEE DRAINAGE BASIN. 155
i,t this station and the bench marks are described in Water-Supply Taper No. 177, page 192, where are given also references to publica-
: ons that contain data for previous years.
Discharge measurements of Kaweah River below Three Rivers, Cal., in 1906.
Date.
V'-M-ch 29.......
V'?,y 28. ........VI ay 31 .........
rune 20. ........
rune 21.........rune 29. ........ruly 19. ........ruly 28.........
November 14. . .
r
Rr
R
r,
Ilydrographer.
H. Lee.......................................do..........................................do.........................................
TI. Lee........................................do..........................................do.........................................S. Hawley . . .................................do.........................................
..do.....-......--.-......-.-.-...--...-.-...
..do..........................................do.....-......---.........-.-.---.-.--.....H. Lee...................... ................
.do.........................................
Width.
Feet. 156174183180200182186200198202185179170
142
Area of section.
Sq. ft. 491653888814
1,050837896
1,0501,0101,080
896793676
293
Gage height.
Feet. 6.007.358.357.809.208.008.409. 108.959.258.257.657.104 974.72
Dis charge.
Sec.-ft. 644
2,0903,7802,6905,2803,1803,6405,6805,2£05,9303,4702,4801,700
14898
Daily gage height, infect, of Kaweah Hirer below Three Rivers. CaL.for 1906.
Day.
] ...............
<5. ..............
-«i)
r...............15.. .............
17............... I". .............. 19...............20. ..............2'9923...............24...............25...............
213...............27 7'1
2!)...............30. ..............3'...............
Jan.
4.554 54.6
4.0
4.64.6
4.6
4.6
8.1
e nc
5.7 6.3
6.7
6.15
5.6
5.5c c
5.45.45.3
Fell.
5.3C 0
5.3
5.3
5.4
5.4
5.4
5.35.46.3
6.05.8 5.7 5.7
6.25
5.7
Mar.
5.85= 7^
5.856.455.95
5.955.956.06.06.05
6.059 37 97.05
10.3
10.18.75 7.85 7.357.15
7.25
7.05
8.68 9
7.957.47.658.35
Apr.
7.87.67.4
7.05
7.16.956 97.07.35
7.16.957.07.057.05
7.157.15 7.15
7 4^
7.6
7 4^
7.15
7.157.0
May.
0.95
7.2
7.6
7.8S 90 0 =
8.35
8.25g fl
7.75
7 98.15 8.3a *}
8 0a i7 7^
7.68 nc
8 e
8.28.1
.Tune.
8.05
8.158.18.25
8.07.958.38.658.85
9.1
9 19 19.1
9 OK
9.1 9.1
q 4
9.59 0C
9 35Q ^e;9.15
8.98.558.48.45a 65
July.
8.89 19.19.059.0
9.08.88.88.68.55
8.58.58.48.48.35
8.38.2 7.957.87.7
7.67 7*1
7 R^i
7.7
7.4
6 96.8
Aug.
6.656.8
6.46.5
6.456.456.4
6.3
6.3
6.16.1
6.16.0 6.0
5 Q
5.75
5.6
5.555.55.55.5
5.6
Sept.
5.5
5.4
5.35
5.35.255.35.35.3
5.1
5.15
5.25.1 5.05 5.05.0
5.04 955.0
4 Q^4 9A Q
4 g4 9
Oct.
4.94.94.94.94.9
4.854.84.84.84.75
4.754.754.754.74.7
4.7 4.7 4.7
4.74.7
4.74.7
4.74.74.74 654.65
Nov.
4.74.74.74.755.05
4.854.84.84.754.75
4.7
4.74.74.7
4.74.7 4.74.74.7
4.74.74.75A vc;4 7%
4 ftd 7^
4.754.8
Dec.
4.8
4.85.04.9
4.94.94.95.35.1
5.255.15.1
K fl
5.0 5.0 4 95
4 955.05.0
5.0
6.55.75
5.45.35.45

156 SUEFACE WATER SUPPLY, 1906.
Rating table for Kaiceah River beloir Three Rivers, CaL. for 1906.
Gage height.
Feet.4.504.604.704.804.905.005.105.205.30
Dis charge.
Sec.-ft.to
Gage height.
Feet.5.40
91 5.50109130154180210240274
5.605.705.805.906.000.106.20
Dis charge.
Gage height.
Sec.-ft. Feet.
Dis charge.
Gag^ height.
Sec.-ft. Feet.312 (i. 30 840350 6. 40 930395445500500
6.50 1,0201 6.60 1,120
6.70 1,2206.80 1.340
625 ' fi. 90
7.2C7.3C7. 4C7.5C7. 6C7.7C
Dis- |' Gage charge, height.
Sec.-ft.1,8301,9602,100
Feit.8.208. 408.60
2, 240 ' 8. 802,400 I 1 9.002, 560 ' 9. 20
1,460 7.8C 2,720690 7.00 1,580 1, 7. 9C 2,880760 7.10 1,700
9.409.60
8.0C , 3,060 | 9.80
Dis- charg
Sec.-f3.42C3.80C4, 18C4,59C5,04C5,52C6,00(6,48f6,96C
NOTE. This table is based upon 15 discharge measurements made during 1906 and is we' below gage height 9.2 feet. Above gage height 9 feet the rating curve is *i tangent, the rHfferei 240 per tenth.
Monthly discharge of Kaweah River belmi' Three Rivers, CaL.for 1906.
[Drainage area, 520 square miles.]
Month.
April....... .............. .....
July..............................
The year
Maximum.
5,760840
8,1602,7206,8406,2405,2801,340
350154195
1,020
8,160
Minimum.
75-274472
1 4601J5202,9701,340
350154100109109
75
Mean.
784418
1,9103,2104,6703,430
69:99R
120119245
1,520
acre-feet.
48,20023,200
150,000114,000197,000278.000211,000
42, 50013, 4007,3807.080
1,110,000
Sec. -ft. per sq. mile.
1.51.804
4.693.676.178.986.601.33.435.231.229.471
2.93
NOTE. These values are excellent.
KINGS RIVER DRAINAGE BASIN.
DESCRIPTION OF BASIN.
Kings River rises on the western slope of the Sierra Nevad drains the country located between San Joaquin River on the and Kaweah and Kern rivers on the south. The Sierra Nevf the head of this basin reaches elevations of over 14,000 feet anc prises the most rugged portion of the range; the sharp and p tons peaks produce the grandest scenery to be found in the I States. The main tributaries of this stream flow through grea yons with high precipitous walls cut in the granite. The Kings Canyon on South Fork and Tehipite Valley on Middle Fork riv famed Yosemite Valley for grandeur of scenery. There are n ous tributaries, many of which have their sources in perpetual banks on the higher elevations. A large number of small lakes <, higher elevations are fed by small streams from perpetual snow or glaciers, and in them many of the tributaries have their s

U.
S.
GE
OL
OG
ICA
L S
UR
VE
Y
A.
CA
BLE
S
TA
TIO
N,
KIN
GS
R
IVE
R,
NE
AR
R
ED
M
OU
NT
AIN
, C
AL
IFO
RN
IA.
WA
TE
R-S
UP
PL
Y
PA
PE
R
NO
. 213
PL
. Ill
. D
ISC
HA
RG
E
ME
AS
UR
EM
EN
T
BY
W
AD
ING
.


KINGS EIVEE DKAINAGE BASIN. 157
.Tie formation is of granite, which above an elevation of 1C,000 feet is are, with scanty vegetation, being carved by the action of glaciers; telow the 10,000-foot contour is a heavy covering of timber and under- irush. Extensive groves of big trees are scattered throughout this lasin. On the lower elevations along the foothills the soil covering is ight with a grass growth used for pasturage. Fully 80 per cent of the rainage area is now included in the boundaries of the Sierra Forest leserve, which is patrolled for the prevention of fires and illegal herd- ng. Below the gaging station, which is located at the point where the iver leaves the foothills, canals divert the water for use in the valley ands of Fresno, Kings, and Tulare counties, where the climate and ioil are especially adapted to the raising of grapes, fruits, etc., and he soil is under a high state of cultivation. During the period of flood 'ischarge some water passes these canals and finds its way across "rings River delta in the natural channel to the old bed of Tulare jake, which is now but an intermittent lake due largely to the diver- ion of water for irrigation purposes from the streams which drain nto it. The drainage area above the Red Mountain gaging station is ,742 square miles. The mean annual precipitation for this area
varies from about 30 to 60 inches, which over a greater portion of the asin falls in the form of snow. The greater discharge of this stream
.s in the spring months when the snow is melting. (See PI. Ill, A.}
KINGS RIVER XEAR SANGER, CAL.
This station was established September 3, 1895. It is located 15 miles east of Sanger, Cal., near the mouth of the canyon, and is above ill diversions. The conditions at this station and the bench marks Ere described in Water-Supply Paper No. 177, page 196, where are dven also references to publications that contain data for previous years.
Discharge measurements of Kings River near Sanger, Cal., in 1906.
Date.
March 30. . . . . .May 12........May 22........May 27. .......
July 18........July 27........
C -tober 18.....
Hydrographer.
C. H. Lee............ ...............................do..............................................do.........................................R. S. Hawley . . ................................C. H. Lee. . ^. .......................................do... ......................................
.-...do.........................................C. H. Lee......................................R. S. Hawlev. ......................................do....-...-.---...-.........-.....-....-.-......do.............................. ..........
Width.
Feet. 164289320320320312358322SI-172150149
Area of section.
Sq.ft. 564
1,2002,0602,1902,0401,8002,8802,2802,240
496398375
Gage height.
Feet. 5.208.20
10.8011.1510.709.90
13. 1011.4011.205.184.754.63
Dis charge.
Sec.-fl. 966
4,38010, 50012,60010, 4008,200
21, 60013, 20011,800
768472398

158 SURFACE WATER SUPPLY, 1906.
Daily gage height, in feet, of Kings River near Sanger, Cal.,for 1906.
Day. ; Jan.
1. .............. 4.252. .............. 3.93............... 3.94............... 4.05............... 4.05
6............... 4.17. .............. 4. 18............... .......9............... 4.0
10. .............. 4. 0
11............... 4.012............... 4.0513............... 7.314............... 11.415............... 7.0
16............... 6.2 17...............' 5.8518............... 8.519............... 13.820............... 8.1
1 21............... 6.8522............... 6.423............... 6.124. .............. 5. 75 25. .............. 5. 7
26............... 5.6527............... 5.628............... 5.529.............. _ 5.330............... 5.231............... 5.15
Feb.
5.15.1
5.1
5.15.2
5.1
6. 75
6.25 5.855. 655.65
6.26.055.9r 7C
5.85.86.0
Mar.
5.85
5.86.56.5
6.26.26.3
6.4
0.45Q 7
10 98.4
10.7
13.0
9.158.257 90
8.008.05
9.35
10.459 508.708.25
9. 40
Apr.
9 358.5
7.97.7
7.55
7.47.6Q 1
7.857.98.1Q 1
8.4ft 4
8.5
q i
9 49 45
9.1
8.55
9.158.58.1
May.
8.058.3
9.39 8
9.85
10.711.0
10 910.2510.6
10.7in c
11.211.4
11.411.2
10.55
12.0
1° 211.6
9.95
June.
10.09 QC
10.95
10.25
12.512.8512.8
12.7
12.9 1 1 n13.0
14 0
13.41 1 A
12.8Y> \11.611.712.3
July.
I9 85
111
12.712.7Y> Q
12.8
12 9
12.6
11.5
11 4
11.2
11.4
11.2
10.55
9.9
Aug.
9 89 89 89 89 1
9 9
9.29.28.8
8 98.4Q A
8 9
8.25
8.28 A
7 97.65
7.67.256 96.7 t\ ^
6.5
6.456.45
Sept.
6 45
6.3
6.1
5.855 95 Q
5.85
5.65
5.5
5.45C A
5.3
5.15
5.15
5.155.15
5.1
5.055.05
Oct.
5.055.05
5.04 95
4 94 0
4.85
4.84.8
4.-5 4 "54. -5A -'C
4."
4.7
4.65
4.654.654.64.6
Nc
444
4
4
4.
4
4.
4
444
NOTE. These gage heights were taken from an automatic river stage register, except J 30, when the instrument was out of use, and the readings are from the staff gage. The m gage height is determined from the register sheets by the use of a planometer.
Rating table for Kings River near Singer, Cal.
JANUARY 1 TO JUNE 30, 190>.a
Gage height.
Feet.3.904.004.104.204.304.404.504.604.704.804.90
Dis charge.
Sec.-ft.205240280325370420470520570625680
Gagp height.
Feet.5.005.105.205.305.405.505.605.705.805.906.00
Dis charge.
Stc.-ft.740805870940
1,0101,0851,1601,2351,3101,3901,470
Gage height .
Feet.6.10
Dis charge.
Sec.-ft.1,550
6.20 1,6406.30 1,7306.406.506.606.706.80
1,8201,9202,0202,1202,230
6.90 2,3407.00 2.460
Gage height.
Feet.7.407.607.808.008.208.408.608.809.009.20
7.20 2,705 9.40
Dis charge.
Sec.-ft.2,9653,2403,5353,8504,1904,5704,9805,4105,8606,3306,840
Gage height.
Feet.9.609.80
10.0011.0012.0013.0014.00
I»is- chargt
Sec.-f7,3607,9008,470
11,70015,90021,04026,600
JULY 1 TO DECEMBER 31.19C6.&
4.504.604.704.80
330 '385445510
4.905.005.105.20
575645720795
5.305.405.505.60
870950
1,030
5.705.805.90
1,110
1,1901,2801,370
1 6.00i 6.10
1,4601,550
a This table is based on discharge measurements made during 1895-1906 and is well defined. i> This table is based on 3 discharge measurements made during 1906 and is well defined. At
height 6.1 feet it is the same as the previous table.

MERCED RIVER DRAINAGE BASIN.
Monthly discharge of Kings Hirer near Sanger. Cal., for 190fi.
[Drainage area, 1,740 square miles.]
159
Discharge in second-feet. Run-off.
Month. Maximum.
anuary .......... ..... .......
\pril. .................. .......ray. .............................
25,500 2,150
21,000 7,760
16,800 26,600 22,400 7,900 2,020
682 610
2,230
26, 600
Minimum.
1, 2, 3, 8, 8, 1,
205 792 220 960 930 320 180 870 682 385 330 330
205
Mean.
2, 1, 5, 4,
10, 17, 16,
4, 1,
5,
360 150 240 720 700 100 300 300 120 516 397 700
280
acre-feet.
144,000 63, 900
322, 000 281,000 658, 000
1.020,000 1,000,000
264, 000oe.foo31,700 23, fiOO 43.000
3, 920, 000
Sec. -ft .per sq. mile.
1.30 0-661
i. 71 6. 15 9.83 9.37 2.47 0.644 0.297 0.228 0.402
Depth in inches.
1.57 .69
3.47 3.02 7.09
11.00 10.80 2.85
.72
.34
.25
.46
3. 09 42. 26
NOTE. Values are rated as excellent; discharges for September to December are based on 3-easurements which indicate a greater change in conditions of flow than had taken place in ten years-eviously, but they are believed to be accurate.
MERCED RIVER DRAINAGE BASIN.
DESCRIPTION OF BASIN.
Merced River drains that portion of the western slope of the Sierra Uevada located between Tuolumne River on the north and San Toaquin River on the south. Its drainage area is much les^ than that :f Tuolumne River. It has numerous tributaries, sever?,! of which = re of considerable size.
The topography of the country in this basin is similar to that of 7'iiolumne River, being rough and broken in the upper reaches. In this basin is situated the famous Yosemite Valley, with its precipitous v ralls and domes, and great waterfalls, which occur on the irain stream end its tributaries, which discharge into the valley over precipitous cliffs rising 2,000 to 3,000 feet above the floor of the valley. The for mation is of granite, which on the upper reaches of the b<\sin above "! rosemite Valley is bare, rising in precipitous peaks and domes, and r smoothly marked by glacial action. The middle reaches of the basin are well timbered. The Mariposa grove of big trees is situated H the basin of the South Fork. The timber growth extends well c own on the lower elevations to the foothills, where the covering is cf brush and grass, used extensively for pasturage. Numerous lakes 8 re scattered over the upper portion of the basin. The mean annual precipitation varies from 25 inches in the foothills to 60 inches on t" .e higher elevations, where it falls in the form of snow, which melts i'i the spring months, except on the extreme higher mountain peaks, vhere it often remains during the entire year. After leaving the foothills at Merced Falls, where the gaging station is located, canals c'ivert the water for irrigation on lands along the river bottom and in San Joaquin Valley. The surplus water during flood discharge enters ^:an Joaquin River.

160 SURFACE WATER SUPPLY, 1906.
MERCED RIVER ABOVE MERCED FALLS, CAL.
The measurement of Merced River was undertaken in resp( numerous requests from mining and irrigation interests, the m mer flow being less than the combined capacity of the irrigati power canals taking water in the vicinity of Snelling. The i was established April 6, 1901. It is located 1 mile above I Falls. The conditions at this station and the bench mar described in Water-Supply Paper No. 177, page 203, where are also references to publications that contain data for previous
Discharge measurements of Merced River above Merced Falls. Cal., in 190'
Date.
April 26........
May 27.........May 28.........May 28.........May 28. ........May 28.. .......
June 30.........July 12 .........
July 20.........July 21 .........
November ^0
Hydrographer.
C.H. Lee.... ........ .............................do..............................................do.....--.----....--.-.....---.................do..............................................do.........................................R. S. Hawlev- -------- -.----.----.----.----.-.-C. H. Lee ...'..........-.......................
.....do...................................... ...
.....do.........................................
.....do.........................................
.....do.........................................
.....do.........................................
.....do.........................................
.....do.........................................
.....do.........................................
.....do.........................................
.....do.........................................
.....do.........................................
.....do.........................................
.....do.........................................
.....do.........................................
.....do....... .................................
.....do.........................................
V'idth.
Feet. 143146321317305268287301353350348347285318325306289303
247180180180168142130
Area ofsection
Sq. ft.380
1,900
1,360760
1,2702, 3202,2702,1602, 1601,0301,6401,6701,2401,1401,210
8758465435225274^8292224
Gage height.
Feet.
9.5014.801 A Xfi
13.2011.42
13.1516.4016.2016.0015.9012.4214.50
13.4813.56
12.1511.8510.3810.3010.249 858.90
Daily gage height, in feet, of Merced River above Merced Falls, Cal.. for 19
Day.
1.. .............2...............3...............
6.... ...........
910...............
11...... .......1213...............14...............15...... ........
16...............17....... .......18. ..............19...............20...............
Jan.
8.18.18.058.08.0
8.05 8.058.08.058.15
8.058. 15
10.5513.45
10.310.813.85
11.55
Feb.
9.09.09.09.09.0
9.0 9.09 09.059.1
9.259.19.09.05
9.99.59.4
9.65
Mar.
10.3510.1510.0511.310.7
10.5 10.2
10.110.1
10.1513.2512.811.7
13.5512.211.511.110.85
Apr.
13.0512.1511.711.4511.25
11.0 11.0
10.9511.25
11.4511.1511.0511.1511.15
11.311.3511.311 4511.6
May.
11.3511.5511.7512.1512.45
12.75 13.013.15
13.5
13.8513.3512.7512.7512.8
12.712.612.9513.313.3
June.
12.412.4512.6512.6513.15
"12.5512.25
13.113.35
13.9514.414.6514.014.05
14.414.714.15
14.8
July.
14.014.214.3514.3514.3
14. 15 14.0514.0513.913.5
13.5513.613.413.313. 05
12.812.6512.4JO 9
11.85
Aug.
10.5510.510.4510.3510.25
10.15 10.15
10.1510.15
10.310.159 959.99.8
9.759.759.659.89.85
Sept.
9.19.19.09.08.95
8.9 8.9
8.98.8
8.88.758.88.75
8.7
8.68.68.5
Oct.
8.358.358.4
8.4 8.358.4
8.4
8.48.38.38.3
8.3
8.35
8.3
Nc
888
8
8. 8
88
8
888
a88
8

MEKCED RIVER DRAINAGE BASIN. 161
i>ally gage height, in feet, of Merced River above Merced Falls, Cal., for 1906 C'ont'd.
Day.
,23...............4...............5. ..............
6 ..............7...............8...............9...............nl.. .............
Jan.
10. 5510. 059.859.659.5
9.59.49.259.29.19.0
Feb.
11.1511.210.710.4510.8
10. 45
10.7
Mar.
10.8511. 1.511.114.5515. 85
14.112. 912.011.5511.614.1
Apr.
11.8512.012.712.0ll.fi
11.411.4512.1511.711.5
May.
13.212.912.512.312. 25
13. 7513.416.013.612.812.5
June.
15.014.914. 4514.914.9
14.013. 4512.8513.013. 45
July.
11. S511. f 511. 7511.711.7
11.611.511. 2511.010.810.7
Aug.
9.759. 559.459.39.2
9.29.19.19.19.19.1
Sept.
8. 58.58.58.58.5
8. 558.558.58.58.5
Oct.
X.38.38.38.38.3
8.38.38.38.38.058.3
Nov.
8.358. 38.38.38.3
8.38.38.38.38.3
Dec.
8.6S. 558.78.h8.65
11.511.4511.310.359.75
10.35
Rating tables for Merced River above Merced Falls, Cal.
JANUARY 1, 1905, TO JULY 31, 1906.0
Gag" Dis- Gageheight, charge. height.
Feel. Ser.-ft. Feet.8.00 908. 10 115
9.009.10
8. 20 140 9. 208. 30 170 9. 308.408.508.608.708.808.90
200 9. 40235 9. 502~5 9. 60315 9. 70360 ! 9. 80410 9. 90
Discharge.
Sec.-ft.465520580645715790870955
1,0451,140
Gageheight.
Feet.10.0010.1010.2010.3010.4010.5010. 6010.7010.80]0.90
Discharge.
Sec.-ft.1,2401,3451 , 4551 , 5701,6901,8201,9552, 0952,2402, 390
Gageheight.
Feet.11.0011.2011.4011.0011.8012.0012. 2012.4012. 6012.80
Dis- Gagecharge. f height.
Sec.-ft.2,5452,8703,2153,5703, 9 to4,3404,7555,2005,6656,140
Feet.13.0013.20
Discharge.
Scc.-ft.6,6307,130
13. 40 7, 63013. 60 ' 8, 15013. 80 8, ('.7014.00 9,20015. 0016 0017.00
12, 05015,30018,800
AUGUST 1 TO DECEMBER 3, 1906.6
8.008.108.208.308.408.508.608.70
55 8.80 | 28070 ,8.9090115140170205240
9.009.109.209.309.409.50
320370425480540610680
9. 60 7509. 70 8209. 80 8909. 90 97010.00 1,06010.1010.2010. 30
1,1601,2601,380
10.4010. 5010.6010.7010.8010.9011.0011.20
1,5101,6501,8001,9602,1202,2802,4402,780
1 11.40 3,14011.60 », 52011.80 3.93012.00 4.340
a This table is based on discharge measurements made during 1905-6 and is well defined.i> This table is based on 7 discharge measurements made during August to November, 1906, and is
well defined above gage height 8.4 feet. Above gage height 12 feet, the table is the same as the previous one.
Monthly discharge of Merced River above Merced Falls, Cal., for 190K.
[Drainage area, 1,090 square miles.]
Month.
April.............................
~ulv. .............................
1 ^ovemberDecember
Discharge in second-feet.
Maximum.
18, 400 2,870
17, 800 6,760
15,300 12,000 10,200 1.720
425 155 240
3. 020
18,400
Minimum .
90 465
1,290 2, 320 3, 130 4,860 _>, 100
425 170 62
115 115
62
Mean.
1,840 1,060 4, 660 3, 500 (i, 530 8,410 6,260
948 254 122 135 735
2,870
Total in acre-feet.
113,000 58,900
287,000 208, 000 402. 000 500,000 385. 000 58,300 15,100 7,500 8,030
45, 200
2,090,000
Run-off.
1 Sec.-ft. per Depth in sq. mile. | inches.
1.69 .972
4.28 3.21 5.99 7.72 5.74 .870 .233 .112 .124
, .674
j 2.631
1.95 1.01 4.93 3.58 6.91 8.61 6.62 1.00
.26
.13
.14
.78
35.92
NOTE. These values are excellent.
8591 IBR 213 07 13

162 SURFACE WATER SUPPLY, 1906.
MERCED RIVER IX YOSEMITE VALLEY, CALIFORNIA.
This station was established July 11, 1904,. It is located a wagon bridge, near the Sentinel Hotel. The conditions at this tion and the bench marks are described in Water-Supply Pape' 177, page 201, where are given also references to publications contain data for previous years.
Discharge measurements of Merced River in Yosemite Valley, California, in 19
Date. Hydrographer. Width. Area of section.
May 24........ Wr,
BW
Feet. 95
Sq.ft.668286
Gage height.
Feet. 6.80 3.30
Daily gage height, in feet, of Merced Rifer in Yosemite Valley, California, fo
Day.
1....................................9
3....................................4....................................5....................................
6....................................
9....................................10....................................
11....................................12....................................13....................................14....................................15. ..................................
16....................................17....................................18....................................19....................................20....................................
21....................................22....................................23....................................24....................................25....................................
26. ...................................
28....................................29....................................30....................................31....................................
May.
7.006.75
6.86.36.1
5.7
June.
6.06.16.756.87.4
G. 456.5
7.88.0
9.559.59 69 29.1
q o9 8Q 8
10.09 9Q R9.8
8.47.88.08.4
July. Aug.
9. 4 6. 2
9.8 ' 6.09. 5 5. 8
9. 5 5. 6
9. 1 5. 6
9 A r A
77 ^ ^
7.8 5.2
77 497.8 , 4.87.8 | 4.5
7. 7 4. 4
7. 4 4. 4
6.7 1 4.4
j
Sept.
4.34.34.24.2
4.1
4.04.0
4.03 9Q Q
3 93 9
3.83.73.7q f\
3.5
3.63.6
3.5Q r
Oct.
3.53.53.63.63.5
3.53.63.53.53.5
3.43.4Q r
3.43.4
3.43.33.43.33.3
3.33.«3.33.33.3
3.33.33.33.33.23.2
Nov.
3.33.33.33.4
3. 33.33.33.33.3
3.33.33.33.33.3
3.3 '3.3 ,3.33.33.3
3.33.33.33.33.3
3.23.23.23.23.2
YOSEMITE CREEK IX YOSEMITE VALLEY, CALIFORXIA.
This station was established July 9, 1904. It is located a wagon bridge, about one-half mile from Yosemite, Cal. The c tions at this station and the bench marks are described in Water- ply Paper No. 177, page 205, where are given also references to j cations that contain data for previous years.
No measurements were made at this station during 1906. November 12, with a gage height of 5 feet, th°re was no flow a section.

MERCED RIVER DRAINAGE BASIN. 163
Daily gage height, infect, of Yosemite Creek, in Yoseinitc Valley, Cal., for 1906.
Pav. May. June. July. Aug. Sept. Oct. i Nov. ' Dec.
I....................
ti. . . .......7...................8.... ...............g
10....................
14...................1.1. . ... .........
Hi...................17................. ..18...................
20
21.................. >o23...................
25
°72829...................30...................31...................
................ ........ .4 t5 c
................ ........ .0 t
................ ........ .1 f
................ ........ .0 (9 r
.1 t....... .9 £
S.9 >........................ 9.8
9.4 ! . . 8.X >
.... .... ... S.7
. . 11.1.")...................... 9.3
. . .. 9.19.S9.7
9.99.9
.. . 7.5 9.8
70 9.X
. . ... fi.4 ".1. . ... "9.0 -.4
..... ... . ... 6.0 7.7..... ......... 6.1 ........
.2 0.8 o.2
.5 5.7 5.2
.4 5.6 5.1
.4 5.6 o.l
.5 o.o 5.1
.1 5.4 5.0
.9 5.5 5.04.0 5.4 5.0l.l .5.3 o.O4.0 5.4 5.0-.4 5.4 5.0
.2 5.3 5.0
.1 5.3 5.0
.1 5.3 5.0
.8 5.3 5.0
.8 5.3 5.0
.7 5.3 5.0
.6 5.2 5.0
.(> 5.2 5.0
.7 5.1 5.0
.2 5.1 5.0
.9 5.1 5.0
.7 5.1 5.0
.0 5.1 ........
5.0 5.0 5.05.0 5.0 5.05.0 5.0 5.05.0 5.2 5.05.0 5.1 5.0
5.0 5.1 5.05.0 ' 5.1 5.05.0 5.0 5.05.0 5.0 5.05.0 5.0 , 5.0
5.0 5.0 5.05.0 5.0 ........5.0 , 5.0 ........5.0 5.0 ........5.0 5.0 ........
5.0 , 5.0 ........5.0 5.0 ........5.0 5.0 .........5.0 5.0 ........5.0 5.0 ........
5.0 5.0 ........ ..0 5.0 ........5.0 5.0 ........5.0 5.0 ........5.0 5.0 ........
5.0 5.0 ........5.0 5.0 ........5.0 5.0 ........5.0 .5.0 ........4.9 5.0 ........4.9 ................
" Backwater from sno\v.
NOTE. There was pruetieally TJO How after September 1.
TENAYA CREEK IX YOSEMITE VALLEY, CALIFORNIA.
This station was established July 11. 1904. It is located by the wagon bridge, about 2 miles from Yosemite, Cal. The conditions at this station and the bench marks are described in Water-Supply Paper Xo. 177, page 207, where are given also references to publications that contain data for previous years.
The following measurement was made June 11, 1906.:Width, 44 feel: area. 176 square feet: gage height. 720 feel; discharge, 891 second-
feet.
Daily y age height, in feet, of Tenaya Creek in Yosemite Valley, Cal.. for 1UU6.
Pay. May.
3...... ................... ... ........ ....4. ......... ............... . ....... .......
li
8.........................9. .... .... .. ... .10.........................
11............................ . ... . . . .12.........................13.......... ............. . .14.............................. ..... .. .. ..15.................................... .........
.1 line.
6.0
6.36.76.8
0 96 97.0
7.4
July. Aug.
7.1 4.0
7.2 4.4
7.2 4.47.1 4.3
7.1 4.2
O.o 1 4.1
Sept.
3.5
3.43.33.2
3.23.13.03.03.0
o g3.03.03.1
Oct.
3.03.03.03.0 i q
2.92.9o g2.9
> Q i g2.93.03.0
Nov.
o n
3.03.0S *)
3.2
3.13.13.0
3.0
3.0
3.0
Dec.
3.03.03.03.0
3.03.03.03.03.0
3.0

164 SURFACE WATER SUPPLY, 1906.
Daily gage height, in feet, of Tenaya Creek in Yosemite Valley, Cal., for 1906 (Y-*
Day. i May. June. July.
17.................................... ........ 7.8 6.2IS... ................................. ........ 7.3 6.1
24....................................I........ 7.4 5.425.................................... 6.2 7.5 5.5
26.................................... 6.1 6.1 5.727....................... ............ 5.9 6.0 5.7
x) -"> 5 6 6 T 0
31.................................... 5.5 ........ 4.7
Aug. Sept.
4.0 3.0 4.0 3.0 3.9 3.0 3.8 3.0 3.9 3.0
3 Q Q A
3.8 3.0 3.8 3.0 3.7 3.0 3.6 3.0
3.6 3.0 3.5 3.0 3.5 3.0 3.4 3.0 3.4 3.0 3.4 ........
Oct. j
2.9 2.9 3.0 2.9 2.9
2.9 2.9 3.0 2.9 2.9
2.9 3.0 2.9 2.9 3.0
Nov.
3.0 3.0 3.0 3.0 3.0
3.0 3.0 3.0 3.0 3.0
3.0 3.0 3.0 3.0 3.0
I
TUOLUMNE RIVER DRAINAGE BASIN.
DESCRIPTION OF BASIN.
Tuolumne River rises on the western slope of the Sierra Nevada j drains the country located between Stanislaus River on the north f Merced River on the south. It has numerous tributaries, severa which produce a heavy discharge. The country throughout t basin is rough and rugged, especially along the main river, which c through solid granite, with high precipitous cliffs on either si Along this stream is found some of the grandest scenery of the Sie Nevada. This stream drains the northern portion "of the Yoseir National Park, where is located the Grand Canyon of the Tuohm and the Hetch Hetchy Valley, declared by man}1- to exceed the far Yosemite Valley in grandeur and beauty. The formation is of gran which on the higher elevations is bare and glaciated, often ris thousands of feet in vertical cliffs and domes. Along the mid reaches of this basin there is good soil covering, with a heavy tim growth of pine, fir, cedar, and other kindred trees. On the lo^ reaches the covering is a heavy growth of brush, which diminishes the foothills where the stream enters the San Joaquin Valley. T portion of the basin has a light soil covering, with grass growth, wh is used for .pasturage. There are several glacial lakes throughout upper reaches of this basin, man}' of the larger of which offer exc tional opportunities for the construction of storage reservoirs. Th are also many reservoir sites on the main river. The stream he a heavy fall, and the opportunities for power development are ' merous. Several diversions are made above the gaging stati which is located at Lagrange, where the stream breaks from the fo hills. The precipitation on the upper half of this basin falls in form of snow, a greater portion of which disappears in the spr. months, but on the higher elevations much remains until Late in summer. The mean annual rainfall varies from about 30 inches the lower foothills to about 60 inches on the higher elevations.

SA1ST JOAQUIN RTVER BASIN. 165
TUOLUMNE RIVER AT LA GRANGE, CAL.
This station was established August 29, 1895. It is located at the wagon hridge, in the town of La Grange. It is below the high dam, where the diversions are made by the Turlock and Modesto canals, and also below the head of the canal of the La Grange Ditch and Hydraulic Mining Company, which diverts water from the left bank of the river above the dam. The conditions at this station and the bench marks are described in Water-Supply Paper No. 177, page 209, where are given also references to publications that contain data for previous years.
Date.
March 29. ......April 25.......
May 28........
June 21.. ......
Julv 11..........1 uly 21 . ....July 31. ........
August 20......
llydrographer. Width.
Feet. C. II. Lee.. .......... ........ ............... 314It. S. Hawlev .................................. 342
C. I! . Lee ...................................... 348W. (\ Sawyer................ .............. .. 330.....do......................................... 370.....do-.-.-..--....... -...........--...-.-..-- 348.....do......... -...-......-.--.-....--..--...- 380.....do-....-....-..--...--..---.--...--..---... 384..... do... ...................................... 342
. ... .do .-.......----..----.....-..--.-..---.--.. 360
.. .do... ... . . . . . . ........... 340
.....do................ ....... ............... 331
.....do..-.......-...--.......-.......-...--..-- 320
.....do..-.. ...... .... ..-...--..-....--......-I 320\V. V. Martin........ -........-........--..--..' 318.....do.......-.......---..-....-..-.-...-...--. 298
Area of section.
Sq. ft. 1,3002,0602,0002,5502,1402,9702,5002,8103,0502, 300
2,6102,2301,790
1.4401,300
983
(lage Dis-height. ' charge
Feet.5.807.717.52
Sfc.-ft.1,8700,2205,710
8.80 11,000S. IS 7, 760
10.45 ! 15,9009.11
10.1010.548.02
10.799.008.22a so0.205.78o. 434.20
11,10014,80017,0009,750
18, 30011,8008,5704,1502,7001.8901.380
197
Daily gage height, injwt. oj Tuoluinnt Him-at La (Iranye. ('al.,Jo/- l!)()(i.
Day.
1. ........ ..... >3... 4. ..............
C)
10...............
11... ... ....... 12. ..... ....... 13. ..............
15.. ..... ......
ll>... . ... . ...
IS.... ....... -.Ill . .20
21...............
°324...............25...............
20...............27...............2829 30. ..............31...............
Jan.
4.24. 14.1) 4.04.0
3.3 3.4 0.45
0. 75
0. 0
0. 70.35. 9
5.45.25 5 °5.0
4.9
Feb.
4. 85 4.94.84.84. .S
4. 854. 95
5.0 4.85
0. 35
(i. 0
7.20.850.46.25
6.250.06.55
Mar.
0.0 5.90. 1 0.3G. 2
0.2
0.4
0. 55 9.7 7.97.5
11.4
9. 1
0.750.357.8
12.4511.3
10.557.97 97. 05
10.2
Apr.
S. 15 8. 1.85 .3.05
.05
.45
. 0
.45
.3
.35
.45
.0
8.08.09.08. 45
"3"35
-.4
May.
7. 1 7.3
8. 4
9. 7
9 09.8
10.15 9.258.8
8.8
8.4
8.75
9. 45
9.08.78.258.08.0
9.69.5
9. 1
8.2
June.
8.3
S. 55 9. 19. 35
8. 558.1
8.99.5
10.2 10.9 11.09.99.0
10. 05 10.8
9. 010.210. 45
10.510.4510.310.1510. 4
9.99.0 8.358.6 9.2
July.
9. 8 10.410. 05 10. 010.3
10.0510.19 859. 1
9.2 9.3 9. 059.59.1
8.8 8. 78. 358.38.1
8.38.058.28.28.5
8.07.9
7.2 6.86.0
Aug.
0.4 O 250.3 0. 15. 95
5.9
5.955. 75
.5.9 5.9
5. 4 5.355.35.3T 4
5.45.75. 65.355.2
3.63.5 3.453.45 3.453.45
Sept.
3. 45 3.453.45 3. 453. 45
3.453.453.453.43.0
3.0 3.0 3.03.03.0
3.0 3.03.03 03.0
3.03.03.053.053.05
3.053.05
3.05 3.05
.......
Oct.
3.45 3.453.453. 453. 45
3.45
3.83. 85
3.85 3.9 3.9
3.9
4.0 3.93.93.93.9
4.24.23.84.14.15
4.14.1 4.14.1 4.14.1
Nov.
4. 1 4. 141 414.8
4. 04.55
4.44.4
4.35 4.35 4354. 64.8
4.3 4354.35435435
4.34.24.25434.2
42415 4153.3 4.15
lieu.
4.2 4.24.2 434.35
44433.94. 65
7.8 7.2 5.55. 054.9
48 48
4 75475
47547548495.35
7.47.3 6.86.1
6.45

166 SURFACE WATER SUPPLY, 1906.
Rating table for Tuolumnf Hirer at La Grange, C'aL.fnr ]90ti.
Gage Dis-height. | charge.
Feet. Sec.-ft.3.00 03.10 I
Gageheight.
Feet.4.004.10
3.120 5 l| 4.203. SO 10 4.303.40 , 20 ' 4.40
Discharge .
Sec.-ft.115145If-'O220270
3.50 30 4.50 3:«l3.1,0 ' 4(1 4. GO 4003.70 | 55 4.70 4M)3.80 ' 70 ' 4.S-0 5703.00 W) 4.TO (.70
Gage Dis- Gageheight, charge. height.
Feet. Sec.-ft. Feet.5.005.105.205. 30
Dis- Gagecharge, height.
Sec.-ft. Feet.780 li.OO 2,2(,0900
1,0201,11,0
5.40 1,3005.50 1,440
b. 20 , 2,GcO(.40 3, OHOi>. 60 3,530(.SO 4,000".00 4,500
5.00 1,5(0 ".20 5,0205. 705. SO5. 90
1,7:0 ".40 5,5701,910 ".1502,OSO ".SO
8.008.208.408.608.809.00
10.0011.00
ti,140(i, 750
Discharge.
Sec.-lt.7, 3508,0308, 7009,390
10,09010,8101 4, CIO18,610
NOTE. This table is based on 18 discharge measurements made (hiring 19'16 and earlier low measurements, and is well denned.
Monthly discharge oj Tuolumnf Hirer at La Grange. Cal.,for ]90(l.
[Drainage area, 1,500 square miles.]
Dischai
Month. Maximum.
March ............................ 24, 400
May .............................. 16, 800June .............................. 19, 000July........--.-......--.-..--.... 18,200
September. ....................... 831October. ......................... 307
December 6 750
The vear................... 24,400
ge in second-feet.
Minimum. Mean.
55 1,110 2, 320 4,730 5, 510 8,640 4, 530
770 28S
70 10 90
2,860 2,180 7,180 6,500
11,100 13,900 11,600
2 220 '470 216 243
1,470
10 4,990
Total in acre-feet.
176,000 121,000 441,000 387,000 682.000 827,000 713,000 136,000 28,000 13,300 14,500 90, 400
3,630,000
Run-
Sec. -ft per sq. mile.
1.91 1.45 4.79 4.33 7. 40 9.27 7.73 1.48 .313 . 144 . 162 . 980
3. 33
off.
Dep inc"
NOTE. These discharges include those of Modesto and Turlock canals. Values are excellent, e: those for Modesto canal for April, September, and October, which are classed as good, on accou the lack of measurements of the canal at low stages.
MODESTO CANAL AT LA GRANGE, CAT,.
The Modesto canal is the property of the Modesto irrigation distr The water is diverted from the right side of Ttioltimne River at La Grange dam. This canal was designed to carry 660 second-feet to irrigate land in the vicinity of Modesto, Stanislaus County, The principal part of the construction work was done on this cf prior to 1892, but on account of litigation the canal was not comple until April, 1903.
Information in regard to this station is contained in Water-Sur Papers Nos. 100, 134, and 177 of the United States Geological Sun
During 1906 gagings were made about 500 feet below the intak- the La Grange dam. The canal at this point has a concrete sect, the width being 20.2 feet at the bottom and the walls having a ba of about 1 to 5 outward. The floor of the canal is practically a p. surface, but the left side is 0.26 foot lower thai, the right side, wl the highest velocity occurs. Measurements were made from the up

TUOLUMXE RIVER DRAINAGE BASIN. 167
side of a plank footbridge. The gage is an iron bar 1^ by \ inches, graduated into feet and tenths and placed in a concrete well on the left side of the canal about 400 feet above the gaging station. The well is connected to the canal by means of a small pipe from the bottom at right angles to the canal wall.
Discharge measurements of Modestf> canal at La Grange, C 1at., in 1906.
Date. Ifydrographcr.
June s.......... .... .do..............June S.......... .... .do..............June 2M.............. do..............July 2..... .... ..... do..............July 11......... .....do..............July 19..............do..............August 0....... Sawyer and Martin.September .">.... W. F. Martin.......
Width.
Feet.
21212121
Area cf section.
Gage Dis- height charge.
Sq.ft. i Feet. Sec. -ft.59 1 2.8043 2.11395856
22 7021 6921 70212121
1.91?.792.702.602.602.60
68 ; 2.5266 2. 4646 I 1.70
1
395302257393412387380383376362250
Daily gage heit/Jit, in feet, of Morjfsto canal at La Grange, Cal., for 1906.
liny. Mar. Apr. May.
1. . . ..... ... .. . ..... .. ...... ..... . 2.42 2.53.................................. ................. 2.64.................................... ................ 2.5:>....... ....... ....... ......... ................. 2. 05(>...... ............. ....... ...... ..... 2.87.......................... ......................... 2.8S.... . ....... .................. .... 2.S9.................................... ........ 1.4 2.8
13.............................. ..... 1.5 2.25 2.814.................................... .65 2.3 2.8
IS.................................... 1.x 2.3 2.8
20.................................... ........ 2.4 2.8
21 . ... 2.5 2.822.................... .. .. .. ..... ... .. . .. 2.823.................................... ............. .., 1.524 ........... ... . ....
20 ................ ..... ... . . . .27............. ...... . . .. .. .. ... .. ..... ..........
29.................................... ........ 2.45 ........30.................................... ........ 2.5 ........31 ... . .......... . ..... . ..... ... .........
June. July.
0.2 2.0.85 2.6
1.1 2.01.5 2.61.9 2.55
2.2 2.62. 0 2. 552. 7 2. 62. 85 2. 55o 75 9 55
2. fi 2. C
2. 5 2. 0
2.5 2.52.6 2.52. r> 2. 45
2.G 2.52. 6 2. 52. 6 2. 52. 6 2. 52. 6 2. 5
2.55 2.452. 55 2. 5
2. 6 2.50 05 9 5
Aug.
2.52.45
2.45
9 451 B-^
........
0.6.5
1.92.12.2
1 9
Sept.
2.25
1.6
1.6
1.55
1 3")
1 451 451.41.251.35
1.3
1.05
1 05
.95
1.01.0
9.85
Oct.
O,-
c
.9
1.05
1 A
().-)
NOTE. No gage height record was kept April 22 to 28. Discharges have been interpolated. The canal was dry on other days on which the gage was not read.

168 SURFACE WATER SUPPLY, 1906.
ing table for Modeslo canal at La Grange, Vol., jo? 1906.
Gage height.
Feet. 0. 500. 000.700.800.901.00
Dis charge.
Set:. -ft. 90
100110120131143
G.ige Dis- height. charge.
Ft ft. Sec.-ft. 1. 10 1561. 20 1091. 30 i 1821. 40 1 1901. 50 2101. 00 224
Gage height.
Feet. 1.701.801.902.002. 102.20
Dis charge.
Sec.-ft. , 238253208283298 ,313
Gage , Dis- height. ' charge.
Feet, i Sec.-ft. 2. 30 ' 3282. 40 i 3442.50 j 3602. 00 3772. 70 3942. SO 411
Gage height.
Feet. 2.903.00
Dis charge.
Sec.-ft. 428445
NOTE . This table is based on 11 discharge measurements made durirg 1900, and is well defined be gage heights 1.7 feet and 2.s feet. Discharges have been included with those of Tuolumne River, p The total discharge of the canal for 190(1 was 105,000 acre-feet.
TURLOCK CANAL AT LA GRANGE, CAL.
The Turlock canal, the property of the Turlock irrigation dist takes water from the left bank of Tuolumne Piver at the La Gr dam. This canal was designed to carry 1,500 second-feet an irrigate a largo area of fertile land in the vicinity of Turlock and C Stanislaus County, Cal.
During 1898 water was first turned into the canal in small qu' ties and used for puddling the banks. A record of the gage he has been kept since July, 1899. The conditions at this station described in Water-Supply Paper No. 177, page 214, where are g also references to publications that contain data for previous y
Discharge measure1)runts of Turlock canal at La Grange, Cal., in 1906.
Date. Hydrographer. Width. Area of section.
Gage height.
May 10......... C. II. Lee...........May 24......... \\'. C. Sawyer......May 29.............. do....'..........May 29......... .....do.. ............May 29......... .... do..............May 29......... ....do... ...........May 29......... .....do..............May 29......... .... .do...........Mav 30.............. do.......... ...May 30.............. do..............June 7...... ... ....do..............July 2.......... ...do..............July 19......... .....do..............July 21......... .....do..............August 0....... Sawyer and Martin.August 20...... AY. F. Martm.......September 5.... ..... do..............
Feet. Sq.ft. 20 1 11020202020202020202020202020202020
113264058587492105118LOS115982112012087
Daily gntje hiight. hi fed. of Turlock canal at La Grange, Cal.. for 1906.
Day. Jan. Fel
1.... .............. ........ ',.'.
3................... ........ 1.
8........... ....... 2.05 5.9................... 2.05 5.
10...... .... ....... 2.05 4.t
Mar.
r, 3 053.252.92.42.0
2.02.02.0
5 ........>5 ........
Apr. ' May. June. July.
........' '4.5 5.0 0.052.0 4.1 5.0 0.052.0 4.4 5.0 0.05
2.0 5.35 5.0 , 0.05
2.0 5.35 5.5 0.05
2.0 5.35 5.05 ' 6.052.0 5.35 5.75 j 0.05
........ 5.0 5.75 0.05
1 Aug. i Sept.
0.05 5.056.05 5.25G.C5 4.1
6.05 4.4
6.0 4.3
0.05 4.2
6.05 3.75 .

STANISLAUS RIVER DRAINAGE BASIN. 169
Daily gage height, in feet, of Turlock canal at La Grange, ('al. , for 1906 Continued.
Day. Jan. Feb. Mar. Apr.
13. .. .... ..... .. 2.7 3.1 ... .. 2.614................... 2.0 4.55 ........ 2.5
20................... 2.7 3.7 ........ 2.5
21.......... ........ 2.7 3.7.". 0.75 2.6
23 . .. 2.8 4.0 1.25 2.6
27. .. ..... 3.7 3.5 .... . 3.628. ...... ..... ..... 3.0 3.5 ........ 3.6 29. . . 3.9 ... .. ... ... 3.630....... ........ 5.1 ................ 4.031................... 5.1 '........ .................
May.
5.6 5.6
5.65.C
5.8
5.7
5.6
Juno.
- u
5.85.8
6.06.0
6.06.0
6.06.06.06.0-
0.05
6.05
July. Ang.
6.05 6.05
6.05 6.05
5.08 6.0
6.05 6.05
6.05 0.0
6. C5 5.04
6.C5 5.15
Sept. . Ool .
3.8 ........3.4 ........3 5
3.4 ........3.4 ........3.0 ........3.05 ........o 35
2.85 ........2.75 ! . .......
2.7 ........
2.7".
2.7 .........
2.55 ........
NOTE. The canal was dry oil days when the gage was not read.
Rating table for Turlock canal at La Grange, Cal.,for 19'>6.
Gage height.
Feit.0.500. bO0.700.800.801.001.101.201.301.40
IMS- charge.
Scc.-ft.46
10 .14192531374451
Gage height.
Feet.1.501.601.701.801.902.002.102.202.302.40
Dis charge.
Sec.-ft.5867768594
104114124134145
Gage height.
Feet.2.502.602.702.802.903.003.103.203.303.40
Dis charge.
Sec.-ft.156167178189201213225237249261
Gage height.
Feet.3.503.603.703.803.904.004.204.404.604.80
Dis charge.
Sec.-ft.274287300313326339365392420448
Gage height.
Feet.5.005.205X05.605.806.00
Dis charge.
Sec.-ft.478508538568598628
NOTE. This table is based on 17 discharge measurements made during 1906 and n well defined above
tage heights 1 foot. Discharges have been included with those for Tuolumne River, p . The total ischarge of the canal for 1906 was 202,000 acre-feet
STANISLAUS RIVER DRAINAGE BASIN.
DESCRIPTION OF BASIN.
Stanislaus River drains a portion of the western slope of the Sierra Nevada and heads well back on the crest, at elevations of from 10,000 to 12,000 feet. It drains the country between the basins of Mokel- umne River 011 the north and Tuolumne River on the south, and flows in a general southwesterly direction, entering San Joaquin River 23 miles above Stockton. In the upper reaches of the basin it has many tributaries, which have their source in numerous small glacial lakes. The topography is rough and broken, with high moun tain peaks. The formation is of granite, which is bare and destitute of timber growth above an elevation of 8,000 feet, except where small glacial lakes and moraines occur. In the middle reaches of the basin there is good soil covering and a heavy growth of timber. In this basin is situated the Calaveras grove of big trees (Sequoia gigan- fea), for which the Sierra Nevada is famous. This is the most north-

170 SURFACE WATER SUPPLY, 1906.
erly of the groves of these trees which extend as far south as Kern River basin. The mean annual rainfall for the basin is aboi inches. The precipitation falls chiefly in the form of snow on higher elevations, remaining well into the summer months. Mi operations have been carried on extensively in this basin, and n canals have been taken out of the river, all of which discharge the river again. The canal of the Stanislaus Water Company dn water 3 miles above Knights Ferry and is used to irrigate between Knights Ferry and Stockton. A gaging station is ir tained on this canal to determine its discharge.
STANISLAUS RIVER AT KXIGIITS FERRY, CAL.
A station was first established on this river on May 3, 1895, at railroad bridge one-half mile north of Oakdale. On July 30, 18? cable was placed 1,000 feet below the railroad bridge. This sta was used until February 16, 1901.
The station at Knights Ferry was established May 19, 1903. . located 200 feet from the post-office at Knights Ferry. The co tions at this station and the bench marks are described in W Supply Paper No. 177, page 217, where are given also reference publications that contain data for previous years.
Discharge measurements of Stanislaus Hirer at Knig^lt^ Ferry, CaL, in 1906.
Date.
March 29 .......April 24........April 25........
May 3 ...... .
May 10....
May 15. ........ May 22 .........
June 2..
June 20... .July 10.........July 14. ........July 17.........July 2,J... ......July 25.........
July 30.. .......
October 19 .....
1
Hydrographer. "\\ idth.
Feet. C. H. Lee........................ .. ......... 184R. S. Hawlev. . ................................ 221.....do................. ..... ........ 230
G. A. Ostrora. ....... . . .' 213.... .do ......................................... 268.....do.................... ....... . ......... 297.... .do ............. ........................... 323.....do......... . . .... .329. . . . .do ......................................... 295Ostroin and Lee ...............................! 295 G. A. Ostrom ................................. 274W. C. Sawyer. ..... ....... 297
.....do................ ............ ........... 304
.....do.. ........... ... ... ........ 345
.... .do ......................................... 347
.....do.............. . ... ....... . ........ 34SW.(\ Sawyer............. .................. 32^G. A. Ostrom.. ......... ...... .......... 29'
G. A. Ostroin... ... ..... .................... 24?W. C. Sawyer. .......... ..................... 241G. A. Ostroin................................. 245
. ... .do ......................................... 212
.....do......................................... 191
.....do......................................... 193
. ... .do ......................................... 185
. ... .do ......................................... 169
.....do......................................... 160
.....do......................................... 153
.....do......................................... 140
.....do......................................... 13'\V. F. Martin. ................................. 123G. A. Ostrom. ................................ 123.....do......................................... 12'.....do......................................... 118
.do......................................... 114.....do......................................... 113
Area of section.
S(j. ft. 793989
1,0301,040
qgO1 2801,6301,8701,9001,6601,670 1,380 1,5601,2401,7802,2002,4202,5701,6401,860
1,2601,1801,2901,020
849890762594
463388327299294254238227291256
Gage height.
Feet. 9.20
10.3710. 6010. 43
11.5212.5213. 3513. 5612.5812.60 11.72 12.3011. 2312.8413. 9514.5514.7112.5513.4012.0810.9810.7811.2210.009.309.688.708.047.037.166.686.346.136.085.865.755.645.585.82
rchs
Se

STANISLATT S RIVER DRAINAGE BASIN. 171
Daily (/age height, in feet, of Stanislaus River at Knights Ferry, CaL.fnr 1906.
Day. ' Jan.
\. .............. 6.42. .............. (5. 33........... ... 0.34. ........... 0.3
0. .......... 0.3 7. ........... 0.3 V ............. ti. 25
10.. ............ 0.311............ .. 0.3 12... .. 7.913... .. ........ 11.35
1.5. ............. 9.110. S 8 17.. .. . 9. i)18. .............. 13. 25 19............... 14.1 20.. ......... . 9.921....... . . s. 922............... S. 423............... 8.05 24. .............. 7. 925. .............. 7. 75
20............... 7.05 27............... 7.5528............... 7.529. .............. 7. 5 30. .............. 7. 45 31............... 7.3
Feb.
7.27.257.3 7.257.35 7.35 7.3
7.4
7.35 7.58.8
8.3 8.07. 95 8.95
9 99.859.39.259.48.95
9.0
Mar.
8.08.48. 459.38.88. 05 8.0 8. 55
8. 7 8.8
10.5
13.2
10. 0 9.99.35 9.05 9.0
9 r>
9.7510.2 14.114 314. 6
13.0 11.510.7510.4 11.1 13. 55
Apr.
11.510.810.39.95 9.759 7 9. 7 9.8
11.010.410.3 9.9
10.0
10.310.0 10.5510.75 10.8
11.011.85 10.910.410.2
10.510.1 10.0
May.
10.2510.811.411.8 12.3512.95 12.7 12.85
12.9
13.35
11. 05
12.3
11.3 11.211.8 12.1 12.111.9
11.0 10.910.811.9 11.712.0511. 1 10.75 10.0
June.
10.811.111.412. 3 12.511.4 11. 05 11.3 12.0512. 85
13.5 14.113. 85 12.812.813.4 13. 1512.4 13.0 12.9
12.812.45 12.1512.5512. 1
10. S 11.2
July.
12.012.212.412.3 12.1511.75 11.0 11.0 11.210.010.5 10. 0511.1 10.810.4
10.0 9.959.55 9.3 9.39.259.39.5 9.459.4
9.2 9.08.78.4 8.15 7.95
Aug.
7.87.757.057.55 7.457. 4 7. 4 7.35 7.37.25
7 17.0 7.00.80.75 0.70. 65 0.7 0.8
0.00. 55 0.450. 35
0. 3
0.250.2 0.2 0.3
Sept.
0.30.250.256.15 0.150. 1 0.1 0.1
0.15 0.15
0.0
0.00.00.05.95 5.9
5.85.85.8 5.85.85
5.9
5.85.8 5. 75
Oct.
5.85.85.85.8 5.8
5.8 5.85 5.75 5.755.755.8 5.755.75 5.755.755.9 5.75.7 5.7 5.7
5.755.7
5.75
5.75
C T
5. 7 5. 75.7
Nov.
5.7
5.85 0.45
0. 15 5.9 5.95.855. 85 5.85
5.9
5.05. 0 5. 05. 7 5. 05 5.0
5.7
5.7
5.85.8
5.85.8 5.8
Dec.
5.85.85.75.8 5.8
5.85.8
^(>.05
13.1 9. 957.05 0.850. 550. 55 0. 30.2 0.2 0.15
6.10.25 0.357.05
9.3
8.457 75 7. 45 8.3
Rating table for Stanislaus River at Knights Ferry, Gal., for 1006.
Gage ' Dis-height. charge.
Feet. Hec.-ft.5. 00 055. 70 955. 80 1305. 90 1700. 00 2200. 10 2700. 20 3200. 30 3800. 40 4400. 50 5000. 00 570
Gage , Dis- ' Gage1 height.
Ftet.
charge, height.
Sec. -ft. Pert.0. 70 040 7.800. 80 710 7. 900.90 7907.007.107.20
8.00870 8. 10950 8. 20
1,030 8.307.30 1,1107. 40 ' 1, 1907.50 1,2707.60 1,360
8.408.508.008.70
7.70 1,450 8.80
Discharge.
Gage Dis-height. charge.
Sec. -ft. Feet. Sec.-ft.1,540 8.90 2,8001,0401,7401,8501,9002,070
9.009.209.409.00
Gagehe'ght.
Feet.11.00
2,930 11.20
Discharge.
Sec.-ft.0,1400,540
3,200 ' 11.40 0,9703,480 11.00 7,4103,760
9.80 4,0602,190 10.00 4,3802,3102,4302,5502,070
10.2010.4010.0010.80
4,7105,050
11.8012.0013.0014.0015.00
7,8808,390
11,11014,02017.180
5,4005,700
NOTE. -This tal is based on 40 discharge measurements made during 1900 and is well defined
Monthly (Uxrharuf of Stanislaus Rh-cr at fCmqhts Ferry. CaL, for 19i>H.[Drainage area, 935 square miles.]
Month.
Mav.... ..... . .........
July .......... . . .........
Discharge in second-feet
Maximum.
14, 4004,290
14.900 8, 110
12.200 14,400
1.600 490 251 551
11. 400
14.900
Minimum.
380 1,060 2,200 3,920 4,920 5. 590 1,790
415 207 162 87
141
87
Mean.
2,470 2,070 5, 330 5. 330 8.090 9.340 5,210
910 309 193 181
1,270
3.390
Total in acre-feet.
152, 000 115,000 328, 000 317.000 497,000 550. 000 320, 000
56. 000 18, 400 11,900 10. 800 78, 100
Run-off.
£°c.-ft. per sq. mile.
2.64 2. 21 5. 70 5.70 8.65 9.99 5.57
.973
.330
.200
.194 1.36
2, 460, 000 3. 63
Depth in inches.
3.04 2.30 6.57 6.36 9.97
11.15 6.42 1.12
.37
l!57
49. 33
NOTE. The discharge of Stanislaus Water Company's canal and Schell ditcr is included above. The discharge of Schell ditch has been assumed as 7 second-feet. Values are excellent, except January to April, which are rated as fair, because measurements made during that period give a discharge some what less than the rating.

StJKFACE WATER SUPPLY, 1906.
STANISLAUS WATER COMPANY S CANAL AT FNIGHTS FERRY, C
This station was established June 11, 1904. It is located belov point where Schell ditch diverts its water, about 1 mile below Stanislaus Milling- and Power Company's power house and 200 below the place where it passes under the Schell-ditch flume, water diverted by this ditch is used for irrigation in the vicinit Oakdale ; Cal.
Dischargi' measurements of Sta7iislaus Water Company's canal at Knights Ferry,
in 1906.
Dato.
July 10.........
Hydrographer.
C. H. Lee......................................
.....do.........................................
.....do.........................................
Wid^h.
Feet. 9q9q
Area of section.
Sec.-ft. 25.026.326.629.0
Gage height.
Feet. 3.353.483.603.77
cb
S
Daily gage height, in feet, of Stanislaus Water Company's canal at Knights Ferry,for 1906.
Day.
1...............
3... ..........
6...............
9...............10...............
12............... 13...............
15........ .......
In.. ...........17...............18............... 19............... 20...............
21...............'">2
23...............
28............... ..29. .. .......30............... .. 31...............
Fan. Feb. Mar.
2. 3 2. 91.9 2.C5 .......2. 15 2. 7 .......2.25 2.75 .......2.25 2.75 .......
2.4 2.8 2.4 2.75 .......2.15 2.8 3.12. 3 3. 1 3. 35 2.25 3.05 3.55
2. 2 3.0 3. 2 2.35 2.5 3.0 2.45 2.2 2.85 2.65 2.6 2.72.6 3.0 2.45
2. 6 3. 05 2. 45 2.75 3.1 2.2 2. 1 3. 15 2. 2 2.5 2.75 2.6 2.2 2.S 3.0
2. 15 2. 9 2. 8 1.5 2.8 3.0 1.35 2.75 3.0 .....' 2.8 2.1..... 2.45 .......
2^65V---^" '.'.'.'.'.'.'.
Apr. May.
1. 65 1.5 2.0 2.45 2.15
3. i2.1
2.05 2.65 2 72^83 0
3.3 3.4 3.5 3. 55 3. 6
3. 55 3. 65 3.35
;-3.5
3.5 3.5 3.5 3.3 3.4
3.4 3.2 3.5 3.7 3.6
3.33.5 3.6 3.53.55
3. 35 3.6 3.3 3.6 3.65
3. (5 3. -5 3. -5 3. "5 3. -
3. 6
3.13 3 3.33.3 3. 5
o r
June.
3.6 3.7 3.8 3. 7 3.7
3. 85 3.ti 3.8 3.8 3.9
3.8 3.6 3.65 3.7 3.7
3.75 3. 55 3.6 3.6 3.6
3.6 3. 55 3.6 3.25 3.6
3.7
3.6 3.25
July.
3.753.8 3.7 3.853.8
3. 75 3.8 3.8 3.8 3.5
3.8 2.7 3. 75 3.8 3.2
2. 85 3.2 2.95 3.5 3.0
3. 552.8 3.6 3.7 3.7
3.7 3.7 3.2 3.K5 3. 45 3.3
j
Aug.
2. 55 3.3 3.25
2! 95
3.4 3.45 3.45 3.4 3.4
3.4 3.3 3.2 3.1 3.15
3.3 3.3 3.1 3.2 3.5
3.5 3.4 3.4 3.4 3.15
3.4 3.3 3.25 3.2 3.2 3.4
Sept.
3.4 3. 15 3.25 3.2 3.2
3.1 3.2 3.1 3.2 3.05
3.0 2. 95 2. 95 2.9 3.1
3.1 2.85 3. 1 3.1 3.15
3.2 3.2 3.15
3'. 05
3.0 3.15 3.2 3.05 3.2
Oct.
3.1 3.0 3.1 3.05 3.0
2.95 3.0 2.9 3.0 3.0
3.05 3.0 3.0 3.15 3.05
3.0 3.05 2.9 2.952.8
2.8 2.85 2.9 2.9 2.9
2.95 2.9 2.9 2.85 2.95 3.0
Nov.
2.95 2.95 2.95 3.0 3.0 '
2.9 2.85 2. 7 2.9 2.95
2.95 2.5 2.5 2. 22 l!<T
2.12 2. 05 1.4 1.45 1.7
1.1 1.15 1.151.65 1.65
2.25 2.3 2.3 2. 35 2.15
NOTE. Canal was dry on days when gage was not read.

MOKELUMNE BIVEB DRAINAGE BASIN. 173
Hating table for Stanislaus Water Company's canal at Kniyhts Ferry Jor 1906.
Gage height.
Feet. 0.70
Dis charge.
Sfc.-ft. 0
0. 80 0. 70.90 1.51.001. 10
2.54.0
1.20 5.51.30 7
Gage height.
Feet. 1.40l.M1.601.701.801.802.00
Dis charge.
Sec.-ft. 9
111315172023
Gage height.
Feet. 2.102.202.302.402. .302. CO2.70
Dis charge.
Sec. -ft. 27313539444954
Gage height.
Feet. 2. SO2.903.00
Dis charge.
Sec.-ft. 606774
3.10 813. 20 883.303.40
95103
| Gage I Dis- height.: charge.
Feet. > Sec.-ft. 3.50 1 1113.60 1193. 70 i 1273.80 1353.60 1434.00 i 151
NOTE. This table is based on 13 discharge measurements made during 1905-6 and is well defined- Discharges have been included in those for Stanislaus River, p. 170. The total discharge of the canal in 1906 was 50,300 acre-feet.
MOKELUMNE RIVER DRAINAGE BASIN.x
DESCRIPTION OF BASIN.
Mokelumne River drains an area of 657 square miles of the western slope of the Sierra Nevada. It has numerous tributaries, North, South, and Middle forks being the most important. This stream heads well back in the main crest of the Sierra Nevada at an eleva tion of 8,000 feet.
The formation is of granite, with good soil covering and heavy tim ber growth on the middle and higher elevations. On the lower elevations the slopes are less rugged and the soil covering is of brush and scattering oak timber, with large areas of cultivated land and pasture. There are numerous small glacial lakes and moraines in the upper reaches of this basin. The precipitation varies from 25 inches on the lower to 50 inches on the higher elevations, where it falls in the form of snow, which melts in the early spring. The greatest discharge usually occurs in April, May, and Jun°. There is some artificial storage in this basin, but not enough to have much effect on the discharge.
Several diversions are made for mining and power purposes within the drainage basin, and this water is returned to the river above the gaging station, which is located at Clements, a few miles above Lodi. Cal.
MOKELUMNE RIVER NEAR CLEMENTS, CAL.
This station was established October 28, 1904. It is located at the highway bridge, 1 mile north of Clements. The conditions at this station and the bench marks are described in Water-Supply Paper No. 177, page 223, where are given also references to publications that contain data for previous years.

174 SURFACE WATER SUPPLY, 1906.
Discharge measurements of Mokehimne Hirer near Clements, Cal., in 1906.
Date.
March 19.......
April 20........
May 9..........
May 22.........May 23.........
July 7..........July 17.........
July 28.........
Ilydrographer.
.....do..... ................... ....... . .....
do
.....do.........................................
. . .do.. ........ ........... ...... .....
.....do.........................................
.....do.........................................
.....do..........................................do...................... ...... .....
.....do.........................................
.....do.........................................
.....do...... ....................................do... .................... ....... .....
.....do..........................................do........... .......... ..... ... .....
.....do. ........................................
.....do.........................................
.....do.... . .......................... .......
.....do..... ........... ............. .........
.....do..........................................do..... ...................................
.....do..................................... ...
Width.
Feet. 122248251247
248250248251249252248203
25125ti249249250248258236204131
57
Area of section.
Sq. ft. 212584
1,3100109132
1,2601,4001,0001,7101,8701,2201,0902,470
1, 9702,3301, 3901,3201,0101,0801.000
002392188]41113107
Gage height.
Frit.
0. 509. 15(i. 48
9.40
8.4011.5512.1810.029.50
14.3514 °912.2013. 689. 809.60
10.758. (198.40C, 525.654.524.05 A. 77
Daily yaye hetyht, inftd, <>J Mnkeluwne Hirer near ClimentK, Cal.,fnr 1H06.
Hay.
9
5...............
0. ..............7
9...............10...............
11...............12...............13...............14...............
10...............17...............18...............19...............20...............
21...............''223...............24. ..............25...............
26.l> 728...............29......... .....30...............31. ..............
Jan.
3.1
3 i ^3.15
3. 153. 153 13.13.1
3. 153.35.67.95
6.67. 75
11.45
7.9
7.05.75. 35.154.9
4.854 74.64.554.54.45
Feb.
A Z
4.45
4.45
4.54.5A A\
4.54.65
4.74. 554.54.0
5. 755.15
6.756.2
7.457.36.56.20.1
0.06.256.45
Mar.
5.850.455.75
5. 75. 75
5. 956.05
6.058.48.17.5
11.5
8.157.40.86.456.25
6.657.28.1
11. 5512.05
11.8510.459.158.58.7
13. 45
Apr.
11.29 958.758.37.95
7.97.757 67.758.3
8.58.07.87.98.3
8.68.68.758.959.45
9.910.310.39.158. 55
8.18.258.58.058.0
May.
o 4~
9 0510.5
11.0
12.4512.512.112.412.1
12 211.1510.210.410.9
9.559.15
10.15
10.9
10.4510.359.49. 159.15
10.510.510.7510.29.359.25
June.
9.910. 4512.212.15
10.459.6
11.613.8
14.314. 413.812.211.7
13.312.911.9512.5512.6
12.4512.712.211.7512.25
11.5510.910.110.4510.5
July.
10.95
12. 15
12.4
12.211. 3511 4511.1510.7
10.410.0510.0510.1
9.48.9
7.9
7.857.07.57.06.65
6. 456.256.255.655.455.3
-Vug.
i 155.05.25.14.95
4.75.15
4.84.6
4.95.04.554.44.4
4.153.93.93 93.95
3.853.853.953.954.2
4.03.83.853.83. 953.85
Sept.
3.83 93.83.753.75
3.854.00 Q
4.054.2
4.4
3.93.954.0
3.954.053.853.853.9
3.9
3.93.853.95
3.94.04.03.93.85
Oct.
q o
3.93.85
3.95
4.03.85
4.03.95
3. 853.953.93.853.9
3.953.953.953.93.9
3.753.753.953.93.95
4.03.854.053.83.954.05
4.0 3.9f 3.9f4. 15. If
4.54. 4 4. If 4.1 4.1
3. 7,c 3 83.83.94.1
4.2 4.0 4.2 4.2 4.2
4.24.2 4.2 3. 8f 3. 8f
3.0 3.9f 3.9f 4.1 3.9

KLAMATH RIVER DRAINAGE BASIN.
Rating table for Mokeiumne River near Clements, Cal.,for 1906.
175
Oaseheight.
Feet.3.003. 103.203.303.403.503.603.703. SO3.904.00
Discharge.
Sec. -ft.5000708090
105120140160190220
Gageheight.
Feet.4.104.204.304.404.504.604.704.804.905.005.10
Discharge.
Sec.-ft.250280315350390430470510550590630
Gageheight.
Feet.5.205.30
.40
.50
.60
.70
.80
.90
.00i. 206.40
Dis- ' Gage ! Discharge, height, charge.
Sec.-ft. Feet. Sec.-ft.680 6.60 1,450730 6.80 1,570780 7.00 1,690S30 7.20 1,830880 7.40 1,970930 ! 7.60 | 2,110980 7.80 I 2,250
1,030 8.00 ' 2,3901,090 8.20 2,5301,210 8.40 ' 2,6901.330 j 8.60 1 2,850
Gageheight.
Feet.8. f-o9. CO
10. CO11. CO12. CO13. CO14. CO
Discharge.
Sec.-ft.3,0103, 1804, 1255,1756,2257,2758,325
NOTE. This table is based on 27 discharge measurements made during 1906, and is vrell defined between gage heights 3.7 feet and 14.3 feet.
Monthly discharge of Mokehimne Rii'(r near Clements, Cal.,for 190(1.
[Drainage area, 642 square miles.]
Discharge in second-feet.
Month.
j Run-off. Total in
Maximum. Minimum. Mean. feet. ! Sec.-ft.gr Depth in
Julv......... .....................
The vear. ...................
6,960 55 2, 000 350 7,750 880 5,380 1 2.1106, 750 2, 730 8,740 3.580 7, 480 730
(ISO 160 350 i 150 235 ' 140 655 120
4.900 150
8, 740 55
990 808
2,520 2,940 4,700 6, 020 3,540
356 202 190 248 876
1.950
61,200 44,900 155,000 175,000 289,000 35,8, 000 218,000 21,900 12,000 11,700 14,800 53,900
1.420.000
1. 55 1.26 ' 3.92 4.57 7.32 !). 38 5. 51 .554 .315 .296 .386
1. 30
3.04
1 14
8 10
ti
1
79 31 52 10 44 46 35 64 35 34 43 57
41. 30
NOTE. These values are excellent, except January to March, which are rated as good because the measurements made during that period give a discharge somewhat in excess of the rating.
NORTHERN PACIFIC OCEAN DRAINAGE.
KLAMATII RIVER DRAIXAGE BASING
DESCRIPTION OF BASIX.
Klamath River drains a large area in California and Oregon, lying between the basins of Sacramento River on the south, Deschutes and Rogue rivers 011 the north, and the minor streams of the Great Basin on the east. Its headwaters lie at elevations of from 7,000 to 9,000 feet. The region contains many flat valleys in which the soil is favor able to irrigation. Many of the streams flow through marshes, which are susceptible of drainage and cultivation. The water surface in the basin is large, comprising three large lakes and many smaller ones.
Link River rises in Upper Klamath Lake and flows through a large swamp area, feeding Lower Klamath Lake by overflow at high water and receiving water from the lake at low stages. Belcw Keno it is

176 SURFACE WATER SUPPLY, I90ti.
known as Klamath River, and flows southwestward through Siski; Humboldt. and Del Norte counties, in California emptying into Pacific.
Important power possibilities exist on the stream, notabh Klamath Falls and at the rapids below Keno. Upper Klamath I is fed by Williamson River, and several smaller streams. SA River flows into Sprague River, a tributary of Williamson River
Tule Lake lies just east of Lower Klamath Lake and has no sur outlet, but may have underground ones. Evaporation record; Keno indicate an annual loss of about 38 inches, while the rail and inflow amount to about 60 inches over the lake surface, formation of the country is of a volcanic nature, showing many fiss where the rock is exposed, and this, together with the fact that m springs exist in the country to the southwest, tend to confirm existence of such passages.
Lost River rises in Clear LaKe and forms the principal suppl Tule Lake. Miller Creek enters Lost River from the east.
LINK RIVER AT KLAMATH FALLS, OREG. a
This station was established May 15, 1904. It is located at county bridge at Klamath Falls, Oreg., H miles below the outle Klamath Lake. The conditions at this station and the bench m are described in Water Supply Paper No. 177, page 226, where given also references to publications that contain data for prev years.
Discharge measurements of Link River at Klamath Falls, Oreg., in 1906.
Date.
May 11.........June 20. ........June 22. ........July 9..........
August 22......
I lydrogr apher .
L. F . Hendricks ....................................do.........................................
.....do.........................................
.....do.........................................
.....do.........................................
Width.
Feet. 2PS2PO2PO285
269279
Area of section.
Sq.ft. 1.9001,6501.6501,5301,4201,1901,310
Gage height.
Feet.
4.654.654.253.803.003.48
ch
Se
Daily gage he,ight, in feet, of Link River at Klamath Falls, Oreg., for 1906.
Day.
1.23...............4. ..............5...............
6...............7...............8...............9...............
10...............
Jan.
3.453.43.53.5
3.453.453.45
3.6
Feb.
3.65
3.653.653.65
3.60 (\
ae3.63.6
Mar.
3.93.85O <-r
3.7
a -'C
3.75
Apr.
4.254.24. °
4.3
4. 44.5
May.
5.0
5.04.955.0
5.04. 9^4.955.05.05
June.
4.854. 94.9A QC
4.8
4.854. 84.95
Julv.
4. 44.35
4.4
4.3
4.3
4. °
Aug.
3.53.5
3.453.45
3.4
3.3
3.3
Sept.
2.92.85
2.92 9
2.85
2.9562.9
2.8
Oct.
2.852.92.82.82.85
62.8562.85
2.852.852.85
Nov.
3.03.33.4
62.952.95
2.952.953.03.05a 05
a This station was known as Klamath River at Klamath "Falls, Oreg., in report for 1904. 6 Estimated.

KLAMATH RIVER DRAINAGE BASIN. 177
Daily gage height, in feet, of Link River ut Klamath Falls, Oreg.. for 1'J'HJ Continued.
Day. Jan.
1 J ........ .... 3. 512......... .... 3.5
14....... ....... 3.015............... 3.55
17. .............. 3.8
20............... 3.8
L'l ......... ..... 3. S522............... 3. - |J3 3 ~524.......... .... 3. ~5 25......... ..... 3.7
20...............' 3. -27............... 3. "28.............. J 3. "29 . ' 3. "
Feb.
3.0 3. H 3.6 3.6 3. 05
3. 65
3. 65 3. 053. ' 3. ~ 3. "5 3. - 3. '
3. So 3.7 3.6
-------
Mar. Apr.
3. 7 1 4. 5 3. 85 4. 5 3. 9 4. 55 3. 9 4, 6 3. 95 4. Go
3. 9 4. 8 3. 95 4. 8 3.9 4,8 3. 95 4. 85
4.0 4.9 3.95 ! 4.95 4. 15 5. 0 3. 95 4. 95 4, 05 4. 95
4. 0 i 4. 95 4. 0 ' 5. Go 4. 05 5. 1 4. 1 5. 0 4, 2 4. 95 4 9,
May. June.
f 5. 05 5. (I 4. 9 4. 9 4. 9 4. 75 5. 1 4. 7 5. 0 4. 8
4. 9 4. 754. 9 4. 7 5. 15 4. 65 4. 95 4. 6 4. 9 4, 05
4. 85 4, 55 4. 8 4. 6 4, 85 4. 6 4. 9 4. 0 5. 1 4. 55
5. 0 i 4. 55 4. 95 4. 5 5. 0 4. 5 4. 9 4. 454. 9 4. 45 4 Q
July.
4.15 4.15 4. 15 4.05 4.05
4.05 4.05 4.00 3. 95 3. 95
3.95 3.85 3.8 3. 75 3. 75
3.7 3.05 3. 7 3.6 3. 55
Aug.
3. 3 3.2 3.15 3.2 3. 15
3. 15 3.15 3.1 3.1 3. 05
3. 1 3.0 2.95 3.0 3.0
3.05 3.0 2.9 3.0 2.9
Sept .
2.8 2. 85 2.8 2.82.8
2. S5 2. S5 2.85 2.85
2.85 2.8 2.8 2.9 2.9
2.85 2.85 2.85 2.85 2. S5
Oct.
2.85 2. 8 2.8 2 9 2. So
S 85 2. 85 2. 85 2.9
2.9 2.9 2.9 2.9 2.9
2. 9 2.95 2.95 2. 95 2.9o n
Nov.
3.05 3.1 3. 15 3.1 3.2
3.2 3.25 3.2 3.2 3.2
3. 25 3. 15 3.25 3.3
a 3. 3
3.3 3.30 O
3! 3 3.3
Dec.
3.4 3.4 3.4 3.4 3.5
3. 45 3.5 3. 45 3. 4 3.5
3.5 3.6
a 3. 5 3.5
"3.5
3.6 3.6 3.6 3.6 3.6 3.6
1 Estimated.
Rating table for Link River at Klamath Falls, Orcg., for 1904-190(1.
Gage Dis- h ight. charge.
Feet. 2.80 2.90 3.00 3.10 3.20
Sec.-jt. 1,150 1,2.0 1,30.') 1,390 1.485
Gage height.
Feet.3.303.403.503. CO3.70
Dis charge.
Sec.-ft.
Gage Dis- height. , charge.
Feet. ' Sec.-ft.1,585 3. SO 2,1751,090 3.90 2,3101,800 4.00 2,4501,920 4.10 , 2,5GO2,045 4.20 2,740
Gage height.
Fert.4.304.404.504.604.70
Dis charge.
Sec.-ft.2,9003,OCO3, 2£03,4003,580
Gage Dis- heig^it. charge.
Feet.4.804. CO5.005.10.- ,. 20
Sec.-ft.3, 7703,9CO4,1504,3404,5:0
NOTE. This table is based on discharge measurements made during 1904-1900 ard is fairly well do- fined.
Monthly discharge, of Link River at Klamath Falls, Oreg.,for 190H.
Month.
April........ ................................ .........Mav. ....................................................
Julv........... ................................ ...... .
October ....................................... .....November. ............................ ...
The vear... .. .. . . . .................
Discharge in second-feet.
Maximum.
2,240 2,240 2,740 4,340 4,440 4,150
1,800 1,260 1.300 1.090 1,920
4,440
Minimum.
1,690 1,920 2,040 2,740 3,770 3, 149 1,860 1.220 1,150 1,150 1,260 1,540
Mea
11
3 4 3
1 1 1 1, 1
1.150 2
n.
950 990 320 520 080 6204ro470 190 200 460 740
250
Total in acre-feet.
120,000 111,000 143.000 209,000 251.000 215,000 153,000 90. 400 70, 800 73,800 86,900
107,000
1,630,000
NOTE. These values are good.
UPPER KLAMATH LAKE NEAR KLAMATH FALLS, OREG.
This station was established in January, 1906, for recording the \vater level in Upper Klamath Lake. It is located at the southeast end of the lake and above the upper riffle at the head of Link River.
8591 IBB 213 07 12

178 SURFACE WATEE SUPPLY, 1P06.
The gage is a vertical timber, graduated to feet and tenths fastened to posts driven in the lake bed a short distance from shore of the lake.
On February 16, 1906, a Friez's automatic water-stage regi; was installed and the mean daily gage height record has been c- puted from its register sheets.
Daily gage height, in feet, of Upper Klamath Lake at Klamfith Falls, Oreg.,for 19(
Day.
1.... ...........2...............345. ..............
6...............7...............8...............9...............
10...............
11...............12...............13...............14....15...............
16...............17...............18...............19.. ............20. ..............
21...............22....... . .23...............24...............25...............
26...............27...............28..... .........29...............30...............31...............
Jan.
5.02
438
5.29
Feb.
5.21
5.02
5.205.205.215.215.20
5.225.235.255. 26
5.355.405.35
.......
Mar.
5.30 5.25
5.355.40
5 405.405.405.405.51
5.505.505.505.40
5.205.205.005.52
5.505.60
5.555.506.45
Apr.
6.156.106.206. 40
6.406.306.406.506.30
6.506.506.506. 506.30
6.506.606. SO6. 70
6.706.907.007.006.80
May.
7.00 C. 806 806.806.70
6.506.506.406.30
6.606. 606.406.206. 40
6.406.306.306.406.50
6. 406.306.306. 105.90
6.206.206.506.506.40
June.
6.30
6.106.206.30
6.206. 206. 106.205.90
5. 706. 206.206.106.00
C. 206.106.206.206.20
6.10
6. 106.00
6.056.005.955.905.80
July.
5.70 5.75c 7A
5.70
5.655.605.655.605.55
5.505. 405.455.405.45
5.355.355.305. 255.20
5.305.205.205. 15
5.155.105.105.005.10
Aug.
4.95 4.904 904.854.90
4 904.904.904. SO4.75
4.704.804.704.754.70
4.754.704.754.704.70
4.70
4.554.504.45
4.55
4,554.504.504.50
Sept.
4.50
4 ^n4504.50
4.354.504.604.65
4.554.404.604 654.50
4.554.50
4.55
4.504.354.504.554.55
4.554.554.504.504.55
Oct.
4.50 4.654 fi^
4.604.55
A r.f\
4.504.504.504.50
4.504.554.504.554. 45
4.504.654.704.80475
4.654.604.554554.60
4554.60460465470475
Nov.
4.70 4 30
4.504.60
4 604704804.804.80
4.854.754.904.854.80
5.005. 305.155. 955.85
5.00
5.205.055. 15
5. 155.105.055.005.00
KLAMATH RIVER AT KENO, OREG.
This station was established August 13, 1904. It is located c fourth mile below the county bridge at Keno, Oreg. The condit at this station and the bench marks are described in Water Suf Paper No. 177, page 229, where are given also references to publ tions that contain data for previous years.
Discharge measurements of Klamath River at Keno, Oreg, m 19U6.
Date.! Hydrographer.
. .....do.........................................
. . ...do.........................................
. .....do......-.--........-.-.-----...--.-....-..
Width.
Feet. 456430420405
Area of section.
Sq. ft. 4,1103,8403,6303,300
Gage height.
Feet. 13.713.412.912.05
rchi
Se

KLAMATH RIVER DRAINAGE BASIN. 179
Daily gage height, infect, of Klaniath Rn'rr al Keno, Oreg..for 1906.
Day. Jan. Feb.
1............... 12.5 12.8L>.... --.-..---.. 12.5 12. SX.. ............. 12. T. 12.81............... 12.5 12.8:................ 12.5 12.8
fi............... 12.5 12.87............... 12.5 12.8S .............. 12.5 12.79 .............. 12.5 12.7n............... 12.5 12.7
11 ............ 12.4 12.712 .............. 12.5 12.7IH .............. 12.6 12.714. .............. 12.7 12.7i:»... ............ 12.6 12.7
Hi.... ........... 12.7 12.717............... 12.7 12.7IS............... 12.7 12.719............... 12.8 12.720. ...-- ; ---.---. 12.8 12.7
21.......----.... 12.8 12.722.....-...--.... 12.8 12.823............... 12. S 12. S24............... 12. S , 12.825............... 12.8 12. S
26............... 12. S 12. S27............... 12.8 12.828................ 12.8 12.829............... 12.8 .......30............... 12.8 .......31 _......_.......' 12.8 .......
Mar. Apr.
12.812.912.912.812.8
12.812.8
May.
13.1 13.fi13.1 13.613.113.113.1
13.613.713.7
13.2 13.713.2 13.7
12.8 13.2 13.712.8 13.2 13.712.S 13.2 13.7
12.8 13.3 13.712. S12.812.812.9
12.912.912.912.912.9
13.3 13.713.3 13.713.3 13.713.3 13.7
13.4 13.713.4 13.713 4 13 713. 513.5
13.713.7
12.9 13.5 13.712.9 13.5 13.712.9 13.5 ' 13.712.9 13.5 i 13.713.0 13.5 13.7
13.0 13.5 13.713,0 13.613.0 13.613.0 13.613.0 13. f,13 0
13.713.713.713.713.7
June.
13.713.713.713.713.7
13.713.713. 713.713.7
13.713.f.13.613. 613.6
13.013.613.613.613.5
1.3. 513.513.513.513.5
13.513.513.413.413.4
July.
13.413.413.113.313.3
13.313.313. 313. 313.2
13.213.213.213.213.2
13.213.113.113.113. I
13.113.012.912.912.8
12.812.812.812.712.712.7
Aug.
12.6
Sept.
iyin12.6 12.112.6 12.112.6 12.112.6 12.1
12.6 12.112.5 12.112.5 12.112.512.5
12.512.512.512.412.4
12.412.312.312.312.3
12.3
12.112.1
12.112.012.012.012.0
12.012.012.012.012.0
12.012.2 12.012.2 12.012.2 12.012.2 12.0
12.2 12.012.212.212.212.2 __.
12:012.012.012.0
12.1 .......
Got.
12.012.012.012.012.0
12.012.012.012.012.0
12.012.012.012.012.0
12.012.012.012.012.1
12.112.112.112.112.1
12.112.112.112.112.110 9
Nov.
12.212.212.212.212.2
12.212.212.212.212.2
12.212! 312.312.312.3
12.312.312.312.412.4
12.412.412.412.412.4
12.412.412.412.412.4
Dee.
12.412.412.512.512.5
12.512.512.512.512.5
12.512.512. 512.512.5
12.512.612.612.612.6
12.612.712.612.612.6
12.612.612.612.612.712.7
Rating tablef(r Khnnath Hirer al J\cno. Oreg..Jr>r 1!>04-1<>(>(J.
(rage height.
Feet.12.0012.1012.2012.30
Dis charge .
Sec. -ft.1,2401,3501,4601,580
Gage Dis- height. charge.
Feet. Sec. -ft.12.40 1,70012.50 1,83012. CO 1,96012.70 2,100
Gage height.
Feet.
Dis- Gage charge . height.
Scc.-ft. Feet.12.80 2,25012.90 2,40013.00 2,560
13.2013.3013. 40
13.10 2,730 13.50
Dis charge.
Sec.-ft.2,9103, 1003,3003,510
Gag height.
Feet.13. CO13.70
Dis charge.
Sec.-ft.3, 7303.960
NOTE. This t'lble is based on discharge measurements made during 1904-1906 anr1 is well defined.
Monthly (hscharf/e of K'huna/h Riier at Krnn, ()m/..Jor 1[XH>.
Month.
July .....................................................
Discha
Maximum.
2,250 2,250 2, 560 3,730 3,960
- 3, 960 3,300 1,960 1,350 1,460 1,700 2,100
3, 960
ge in second-feet.
Minimum. Mean.
1,700 2, 100 2, 250 2, 730 3,730 3,300 2,100 1,350 1,240 1,240 1,460 1,700
1,240
2, 050 2,180 2,380 3.220 3,940 3, 710 2, 750 1,680 1,280 1,290 1,580 1,900
Total in acre-feet.
126, 000 121,000 146,000 192, 000 242, 000 221,000 169,000 103, 000
76, 200 79, 300 94, 000
117,000
2,33(1 1,690,000
NOTE. These values are, excellent.

180 SURFACE WATEK SUPPLY, 1W6.
SYCAN KIVER NEAR SILVERLAKE, OREG.
This station was established May 2, 1905, and discontinued Oc ber 12, 1905. It is located about 30 miles south of Silverlake, Or in sec. 19, T. 32 S., R. 14 E. The conditions at this station i the bench marks are described in Water-Supply Paper No. 1 page 232.
Discharge measurement* of Si/can Kiirr near Sih'erlak'', Om/., in 1V05-6.
Date.
1935.
April 10. .....
1900.AT u \* U
Ilydrograjiher. , Width.
Feet.
. .....do......................................... 30
..... .do ......................................... 50
. II. W. King................................... L9
. .....do......................................... 12
. ....'.do......................................... 59
Area of Gage section. height.
Sq. fl. Ffft. 27.6 2.4J46.5 3.0592.6 3.4543.9 2.32
14.9 1.707.1 1.12
238 6.20
Dieha
Sec
Daily discharge, in second-feet, of S yean River near Silrerlake, Oreg.,for 1905.
J)ay. Ma\
4........... 138- 1 3D
S........... 1839 164
12... ..... 151 13... ... .. 164 14...... 145
10... ...... 158
. June. July. Aug. i Sept. Oct.
87 33 87 33 87 30
130 30 142 28 142 28 155 28 140 24 140 24
85 20 76 20 68 20 76 19 94 19 76 19 60 19
10 6 i 8 10 6 ' 5 089 7 S ' 5 1 9 9 J 9 S 1 9 14 0 9 11 0 11 12 0 12 9 099 0 9 12 0 10 9 1 10 9 1 10 8 1 10 12
Day. Ma
17........... 1718........... 10
20........... 1721........... 11OO -jo
24........... 12
26..... ..... 1497 1Q
2 1............ 132.(...... .... 1131....... ... 10
v. June. July.
7 57 17 4 50 17 0 58 12 2 51 14 2 45 15 2 34 15 4 39 15 2 39 15 2 39 11 6 42 10 2 39 10 4 39 10 8 37 10 7 37 10 7 ...... 10
Aug. Sept.
1 10
2 12 3 10 3 10 4 10 4 10 5 10 2 10 2 10 3 14 3 11 5 8 5 8 6 .......
NOTK. - Theso discharges were obtained liy thr indirect method for shifting channels.
Monthly uischuj-<n of fi yean Iticcr near fiilrcrlake, Oreg., for J 9
Month.
July................ .....................................
Maximum.
192 155 33 1014 24
Minimum. Mean.
97 34 10
0 6 5
Total acre-f
14675.0 18.9 2.87 9.67
13.4
K
NOTE. These values are fair.

KLAMATH RIVER DRAINAGE BASIN. 181
LOST RIVER NEAR CLEAR LAKE, CAL.
This station was established September 1, 1904. It is located about 2 miles downstream from Jessie D. Carr's Clear Lake dam, a short distance below the dam site for Clear Lake reservoir, about 20 miles from Tule Lake post-office, Cal. The conditions at this station and the bench marks are described in Water-Supply Paper No. 177, page 233, where are given also references to publications that contain data for previous years.
Discharge measurements of Lost Hirer near Clear Lake, fa/., in 190H.
Date.
March 8..... . .
April 3 ........April 6. .......
July 15 ........
Hydrographer.
.....do.................................
.....do.................................
.....do.................................
.....do.................................
.....do...........* ....................-.-..do....-..-.--..-........-.....-.-.......do......................................do...................................... do... -.--...-.--......-.......--.- .
.....do.................................
.....do.................................
.....do.................................
.....do.................................
Width.
Pert......... 102........ 102........ 125........ 127........ 135........ 126........ 148........ 150........ 150........ 148........ 135........ 125........ 65.-......' 10........ 18
Area of section.
Sq. ft.
93141203238204407421449376
16860101 0
Gage, height.
Feet.
6.^56.607. IS7.357. IS8.809.009.108.507.506.905. 805.205. 20
Dis charge.
Sec.-ft.
157235452534460
1,3301,4801,6101,270
6263655813.910.2
Daily gage height, infect, of Lost River near Clear Lake, Cal., for 1906.
Day. Jt
1............... 52. 53............... 54............... 5^,.. ............. 5
6. .............. .57 ............... 58............... 59............... 5
10............... 5
11............... 512............... 513............ . 514............... 5i.">... ........... r>16............... .5
18............... 519............... 520............... ' 5
21............... 522.. 523........ ..... 524. .............. 525.............. 5
20............... 5
28............... 529............... 530............... 531............... 5
n. Feb. Mar.
2 5. 5 6. 452 5.5 fi. 152 5.5 6. 22 5.5 6.152 5. 5 6. 2
2 5.5.6. 552 5.5 f 7.12 5. 5 7. 252 5. 5 7. 22 5. 5 7. 4
3 5. 5 7. 8
3 5. 5 7. 754 5. 5 7. 754 5. 75 7. 7,5
5 5.85 7.7555 5. 8 7. 7555 ' .1.8 , 7.8555 11. 0 8. 055 6. 7 8. 1
.55 , li.8 8.2,55 6. St) 8. 355 6. 55 S. 45 : 6.25 8.55 6.0 8.7
5 6.9 8.85 6.6 8.85 ....... 8.755 ....... 8.85 ....... 9.3
Apr.
9.39.19.09.09.05
9.19.259.39.49.4
9.39.39.29.08.75
8..')8.48.28.0
7.77.657.55
7.4
7.257.27.17.07.0
.......
May.
6.956.856.86.756.5
6.456.46. 356.36. 25
6.256.26.26.26.2
6.26.26.26.16.1
6. 0,56. 056.056.06.0
6.06.26.46.56.66.6
June.
6. 456.36.36.36.3
6.46.66.556.456.2
6.2
6.16.05.9
5. 855.85
5. 75.0
5.55. 55.4
5.3
5.455.355.355.35
July.
5.255.25.25.15.05
5.05.05.05.05.0
5.3
5.2.5.25.2
5. 25.25.25.155.15
5.155.15.15.15.1
515.15.15.15.15.1
Aug.
5.15.15.15.15.1
5.15.15.15.15.1
5.15.15.10.15.1
5.15.15.15.1
5.15.15.15.15.1
515.15.15.15.15.1
Sept.
5.15.15.15. 15. 1
5.1.5.1.5.15.15.1
5.1
5.25. 2,5.2
5.25.25.25.25.2
5.25.25.25.25.2
5.25.25.25.25.2
Oct.
5 ">5.25.25. 25.2
5.25. 25.25.25. 2
5. 25 °5 25.2.'). 2
5. 2 j °r. o
5.2.5.2
5.25.25.25.25.2
5.25.25.25.25.2
Nov.
5.25.25. 2.5.35.3
5.35.35.35.35.3
5.35.35.35.35.3
5.35.3K. o
5.35.3
5.35.35.35.35.3
5.35.35.35.35.3
Dec.
5.35.35.35.35.3
,5.35.35.35.35. 35
5.45.455.45r r.5:55 .55.65.65.75.7
5.85.85.86.156.8
7 °7.357.3'
7.157.07.0

182 SURFACE WATER SUPPLY, 1906.
Rating table for Lost Ricer near Clear Lake, Cal.,for 1906.
Gage height.
Feft. 5.005.105.205.305.405.505.605.70
Dis charge.
Sec.-ft. 58
121723304052
Gage height.
Feet. .80.90.00.10.20.£0
G.406.50
Dis charge.
Sec.-ft. 008198
118140164191220
Gage height.
Feet. fi.CO6. 706.800.907.007.107.207.30
Dis- '
charge.
Sec.-ft. 252286320356392432'474518
Gage height.
Feet. 7.407.507.607.707.807.908.008.20
Dis charge.
Sec. -ft. 5626086547027558108659SO
Gage height.
Feet. 8.408.608. SO9.009.209.40
Dis charge.
Sec.-ft. 1, 100 1,2501, 3601,5001 6401,785
jNOTE. This table is based on 15 discharge measurements made during 1906 and is well defined het'
gage heights 5.2 feet and 9.1 feet.
Monthly discharge of Lost River near Clear Lake, Cal.,for 1906.
July.....................................................
The year ................................ ... .....
Maximum.
35
1,7101,780
374252
178
1212
540
1.780
Minimum.
1230
1293929817
588
121217
5
Mean.
23.6106797
1,15017799 °9.48.0
10.412.0
127
211
Totaacre-*
je1
1?
NOTE. Values are rated as follows: March to May, excellent; August to November, fair; rema' of 1906, good.
LOST RIVER NEAR MERRILL, OREG.
This station-was established July 26, 1904. It is located ab 1^ miles downstream from the Stukel Bridge, 4 miles northwest Merrill, Oreg. The conditions at this station and the bench ma are described in Water-Supply Paper No. 177, page 236, where given also references to publications that contain data for previyears.
Discharge measurements of Lost River near Merrill, Oreg., in 1906.
Date.
March ''9
April 20. .......
April 26. .......April 30. .......
Se.ntember 10...
Hydrographer. Widtt
Feet . C. T. Parley....................... ........... 91.....do.......................................... 130R. Hubbard...................... ........... 14f.....do......................................... 140. ...do... ............. . ........ 14C.....do... ......... . . ...... 145.....do... .................... .... ............ 145.....do............................. .. ........ 144.....do......................................... 142.....do. ............. . . . ........ 142.... .do ......................................... 14?.....do......................................... 14?.....do......................................... 152.....do... ...................................... 152C. T. Darlev. ............ ..................... 14?.....do.....'.................................... 145..... do ......................................... 136.... .do ......................................... 138.....do......................................... 13C
C. T. Darley................................... 112.....do......................................... 112L. F. Hendricks ............................... 11C.... .do ........................................ 105.....do..... ..... . ... . .................... 90.....do......................................... 92.....do. ......................................... 87
Area of section.
Sq.ft. 16S908
1,1201,1401,1501,1101,1101,0901.030
9701,2601,2701,3501,3501,3001,100
98482473556341440637924118414083
Gage height.
Feet. 4.30
10.7512.0812.2212.1712. 0012.0211.6211.3411.0413. 0513.1813. 6513.6613.0211. 9211.239.809.268.326.606.505.904.804.103.983. 50
D cha
S(

KLAMATH RIVEE DRAINAGE BASIN. 183
Daily gage height, in feet, of Lost River near Merrill, Oreg.,for 1906.
Day. Jan.
3............... 3.34. .............. 3.35............... 3.3
7............... 3.38 0 0
9. .............. 3. 310............... 3.3
12............... 3.313-........--.... 3.314.. ............. 3.315. .............. 3. 3
16. .............. 3. 3
18............... 3.3
20............... 3.3
22. .............. 3. 3
24............... 3.3
or. ^ i27. .............. 3. 3 ?Q q 0
29............... 3.3
31............... 3.3
Feb.
q Q
3 q
a 3. 3a3.3
03 43.43 43.43.4
3.43.43.453.45
3.6
5 °
4.3
Mar.
5.2
4.64.35
4.24.14.14.655.8
6.7
5.55.9
c 9
4 94.5
r. r
12.111.511.0511.5
Apr.
1° 9
12.711.510.6
11.0
12.413.0
1 Q C
i q fit;
11.2
10.19.959 99.25
6.6
6 °55.85
May.
5.65 3
5.04.85
4.6
4.54. 45
4 35
4 -3
4.2
A i e:
4.24.254 1 C
4.05
4.1
4.14.0
4 1
4.054.1A 1 C
4.25
June.
4.34.3
4.2A Q
4.34.3
4.4
4 14.2
4.03.9q QC:
3 DC
q QCq oq QC
q o
O Q
3.8q o
3.7o 7
July.
3 73 73 73.73.7
3.73.7
3.653.6
3.6
? 7
3.6
3.6
3.63.6
'3.6
3.6
3.55
3.55
3.55
Aug.
0 CC
0 CC
3.553.55
3.50 C
o r
3.5
0 K
3.553.553.55
q c
3.553.55
3.55
3.55
0 C
3.55
3.55
3.5
3.5
Sept.
3.53 K
3.53.53.5
3.53.50 C
3.53.5
3.53.53.53.53.5
o r.
3.53.53.53 C
3 C
3.5
Q C
3.5Q C
3.5
Oct.
3 C
3.53.5
3.53.5Q C
3.53.5
3.53.53.53.53.5
3.53.53.53.53.5
3.53.53.53.5
3.5
3.53.53.5
Nov.
3.4
3.43.4
3.43.43.43.43.4
3.4q A
3 A
3.43.4
3 43.43.43.43.4
3 A
3.40 A
3.40 A
3.4
3.43.4
Dec.
3.43.43.43.4
3.43.4O A
3.43.4
1 43.453.453.453.45
3.453.453.453.453.45
3.453.453.453.45Q C3.5
3.53.654.855.65.24.8
a Estimated.
Rating tables for Lost River near Merrill, Oreg.
JANUARY 1 TO MAY 17, 1906.a
Gage height.
Dis charge. ,
Feet. Sec.-ft.3.30 1023.40 1253 50 150
Gage height.
Feet.4.504.1.04.70
Dis charge.
Sec.-ft.467502537
Gage height.
Feet.5.705. SO5.90
s! 60 170 ' 4.SO 572 6.003.70 203 4.90 ' 607 6.103.80 232 5.00 642 6.203. 90 262 5. 10 677 6. 304.004.104.204.304.40
294 5. 20 712328302397432
5. 30 7475. 40 7825. 50 8175. 00 852
6.406.506.606.70
Dis charge.
Sec.-ft.887922
Gage height.
Feet.G.SOO.GO
957 1 7. 00992 7. 20
1,0271,0621,0971,1321,1671,2021,237
7.407.607.808.008.208.408.60
Dis charge.
Sec.-ft.1,2721,3071,342 '1,4141,4881,562l,t>361,7101,7841,8581,932
Gage } eight.
Feet.8.&09.009.209.409.609.80
10.0011.0012.0013.0014.00
Dis charge.
Sec.-ft.2,0062,0802,1602,2402,3202,4002,4802,9303,4404.0004; 630
MAY 18 TO DECEMBER 31, 1906.6
3.403.50
66 1 3.90 18587 4.00 215
3.60 108 ,! 4.10 i 2463.70 i 131 I 1 4.20 ' 2783.80 157 4.30 310
4.404.50
342375
4.60 4094.70 , 443
4.905.005.105.20
II 511 |l 5.30545 .5.40580 '5.50615 ,! 5.60
650685720755
4. 80 477
n This table is based on discharge measurements made during 1904-1906 and is well defined. t> This table is based on 3 discharge measurements made during 1906 and is well defined between
heights 3.5 feet and 4.1 feet.

184 SURFACE WATER SUPPLY, 1906.
Monthly discharge of Lost River near Merrill, Oreg.,for 1906.
Discharge in second-feet. Month l Total
Maximum. Minimum. Mean. acre-fp
January. . ............................................... 102 102February. . .............................................. 747 102March ..'................................................. 3, 500 ' 328April... ............. .................................. 4,380 940May. .................................................... 852 215June ..................................................... 375 131July . . ................................................... 131 98August.. ................................................ 98 87
October. ........ ....................................... 87 87November....... ...................................... 66 66
102 6 259 14
1,260 77 2, 540 151
386 23 240 14 113 6 93.7 5 87.0 5 87.0 5 66.0 3
130 7
447 186
NOTE. These- values are excellent except for May, which is good.
TULE LAKE NEAR MERRILL, OREG.
This station was established May 17, 1904, for recording the wa level in Tule Lake. It is located on Tule Lake at the mouth of L< River about 3 miles east of Merrill, Oreg., 25 miles south from K math Falls, and near the Oregon-California line. The conditions this station and the bench marks are described in Water-Supj Paper No. 177, page 238.
Daily gage height, in feet, of Tule Lake near Merrill, Oreg., for 1906.
Day.
1. . ...........9
9... ...........10...............11...............13...............
16............. .18...............19...............
21 ...............22...............O**
24.. .......25............. .28...............30...............31...............
Jan.
6.7
Feb.
.......
.......
Mar.
(i. 95
7 1
7.37.3
..:::..
Apr.
7.75
8.4
8.85
9.0
9.1
May.
9. i
9.05
9 0
3 une.
9.0
9.0
9.0
8.9
8.85
July.
8.85
8.8
8.7
8.45
8.4
A 115.
8.4
8.2
8.05
7.85
7.8
7.8
Sept. Oct.
7.75 ' 7.4
7 7
....... 7.3
7.ti
... .. 7.2
7.5 .......
7.4 .............. 7. 15
Nov.
7.15
7.1.5
7.15
7.0
MILLER CREEK NEAR LORELLA, OREG.
This station was established August 10, 1904. It is located at t Horsefly dam site, 10 miles northeast of Lorellr,, Oreg. The con tions at this station and the bench marks are described in Water-Si ply Paper No. 177, page 239, where are given also references to put cations that contain data for previous years.

KLAMATH RIVER DRAINAGE BASIN. 185
Discharge measurements of Miller Creek near Lorclla, Oreg., by L. F. Hendncks, in 1906.
Date.
April 4....... ..
Daily
Da>.
1. ........ ...... >3 ....4. .... . ...
8. ....... .......9................
12..... . ........13................14................15. .... . ......
10 ..... . ........17................18 ................19 ................20 ..... . . ......
22 ................23 ..... ..........24 ................9.-,
27 ................28................29................30................31................
Width Areaof Ga8e main. section .height, cl
Fett. Sq.ft. Feet. S 140 225 8. 05 140 , 243 8.65 140 271 8. 80 140 340 - 9.50 150 431 10. 10 140 188 8.25 140 284 9.00
SSe. Dat6 ' >
ec.-ft.883 j 884 t
1,040 f 1,440 1 1,940 x
629 J 1,110
J
ulvl4. ..... ... ...
Mth Area of Gago latrl - section, height.
\et. Sq.ft. 140 298 ICO 517 150 389 125 127 130 129
i i
Feet.9.28
10. Co 9.72 7.55 7.62 5.80
Dis charge.
Sec.-ft. 1,240 2,55(1 1,690
308 309
0
" Measured by C. T. Darley.
gage height, in feel, of Miller Creek near Lorella. Orcy.,f<;r 1906.
Jan.
. .. 0.2. .... 0.2
........ 6.2. .... 0.2
0.2....... . 0.3-... ....... 0.3........... 6.4........... 0.4
........... 0.3
........... 0.3
........... 0.3
..... ... . 0.3
........... 0.3
........... 0.3
......... . 0.3
...........'' 0.3
......... 0.3
......... . 0.3
........... 0.3
........... 0.3
........... 6.3
........... 0. 3
........... 0.3
........... 0.3
........... 0.30.3
Feb.
0.3 0.30.3 0.3 0.3
0.36.3 0.3 0.3 0.3
h.3 b.3 0.3 0.3 0.3
0.3 0.3 0.3 0.3 0.3
0.3 0.3 0.3 0.2 0.4
0.0 0.70.8
......... 0.3 !.......0.3 ...
Mar.
.0
.1
.1
.05
_ o
. 7
.8
.0
.5
.3
.1
i .9! ( .7
:18.38.8 9.7
9.08.0 8.f5 8. £5 9.79.6
Apr. May.
i 8.1 7.0 i S.I 7.0S.4 0.9 8.15 0.8 9.2 0.7
9.9 0.7 9.9 0.0
10.5 0.0
8.8 0.5 8.8 0.0 8.7 0.7 8.7 6.7
8.9 i 6.7 8.5 0.7 8.1 0.0 7.9 0.0 7.8 6.5
7.7 0.5
7^5 o!s 7.4 0.5 7.5 0. 4 '
7.4 0.5 7.3 6.S 7.4 7.1 , 7.4 7.5 7.2 7.5
........ 7.4 ..
uno. July.
7.2 0.15 7.0 0.15 0.9 0.1 0.9 0.1
7.2 0.0 7.2 0.0 7.1 ........7.0 ........
0. 9 ......
Nov.
O.S '0.8 .......0.7 ... ...0.0 ... ...
0.5
0.4 ........0.3 ........
0.3 ........6.2 ........ 0.2 ........ 6.1 ........0.1 .......
0.1 ........
6.15 ........6.15 ........
6.1 0.1 0.1
0.1 0.1 6.1 6.1 0.1
0.1 6.1 6.1 6.1 6.1
Dec.
6.1 6.1 6.1 6.1 0.2
0.2 0.35 0.4 0.3 0.3
0.3 6.2 6.2 6.2 6.2
6.2 6.2 6.2 6.2 0.25
6.3 6.3 6.4 6.6 7.65
8.35 7.95 7.4 7.4 6.8 6.6
NOTE. The creek was dry July 7 to November 17.
bating table for Miller Creek near Lorella, Oreg., for 1906.
Gageheight.
Feet.6.006. 106.206.306.406.506.006.70
Discharge.
Sec. -ft.0
Gage Dis-height. ' charge.
Feet, i Sec.-ft.6.80 ! 52
1.5 6. SO 674 7.00 SO8 7.10 !OS
13 7. 20 1302029
7. £0 1687. 40 205
39 7.50 ' 245
Gageheight.
Feet.7. CO7.707.807.fOs.Of8.108.208.30
Discharge.
1 Gage | Dis- height, charge.
Sec.-ft. . Feet.290 ' 8. 40337 , 8. 50387437490545600655
' 8.00i 8.70! 8. SOI 8.60j 9.001 9.20
Sec.-ft.715775835900965
1,0351,1101,260
Gsgeheight.
Feet.9.409.609.80
10.0010.2010.40
Discharge.
Sec.-ft.1,4151,5751,7451,9152,0852,265
NOTE. This table is based on discharge measurements made during 1904-1906 ard is well defined.

186 SURFACE WATER SUPPLY, 1906.
Monthly discharge of Miller Creel' near Lorella, Oreg.,for 1906.
Disoha Month.
j Maximum.
March..'... .... .. . ...... . 1,660April.............................................. . . . 2,3EOMay . . ................................................... 245June....... ......... ..................... ., 168July ..................................................... 2. 8
October. .. ^ ............................................ 0November. ...... . .. . . ........ . 1.5
The year.................... ..................... 2,360
rge in seconc
Minimum.
4 4
39 136 13 1.5 0 0 0 0 0 1.5
-feet.
Mean.
n'.o445 779 56.7 47.3 0.3 0 0 0 0.6
68.1
0 118
Total acre-fe
27 46
3
4
K-
NOTE. Values are rated as follows: March to May and December, excellent: January, Febru and June, good: July and November, fair.
MISCELLANEOUS MEASUREMENTS IN KLAMATH RIVER DRAINAGE BAS
Cherry Creek (North Fork) near Crystal, Oreg. This stream is tril tary to Upper Klamath Lake from the west. A measurement v made September 1, 1906, near the crossing on the road from F Klamath to Pelican Bay:
Width, 9.5 feet; area, 5.8 square feet; discharge, 9.4 second-feet.
Cottonwood Creek near Brownell, Col. Cottonwood Creek is tril tary to Lower Klamath Lake from the south. The following me urements were made during 1906 at Brownell's "F' ; ranch:
February 13: Width, 22 feet; area, 25 square feet; discharge, 14 second-feet. September 26: Width, 25 feet; area, 32 square feet; discharge, 12.2 second-feet.
Crooked Creek near Klamath Agency, Oreg. This stream is a tril tary of Wood River. A measurement was made August 31, 19 at the bridge li miles from Klamath Agency on the road to F Klamath: .
Width, 31 feet; area, 94 square feet; discharge, 59 second-feet.
Doris Creel- near Doris, Cal. Doris Creek is tributary to Lov Klamath Lake from the southwest. The following measureme' were made during 1906 at Doris ranch:
March 22: Width, 5.4 feet; area, 7.4 square feet; discharge, 11.0 second-feel. February 14: Width, 5.5 feet; area, 5.1 square feet; discharge, 8 second-feet. September 26: Width, 13 feet; area, 13.7 square feet; discharge, 8.4 second-feet
1-i'ort Creel: near Fort Klamath, Oreg. This stream is a tributary Wood River. A measurement was made August 31, 1906, at l bridge 2 miles southeast from Fort Klamath on the road betwe Klamath Agency and Fort Klamath:
Width, 42 feet; area, 104 square feet; discharge, 115 second-feet.

KLAMATH RIVER DRAINAGE BASIN. 187
Rock Creek near Odessa, Oreg. This stream is tributary to Upper Klamath Lake from the west. A measurement was made September 3, 1906, at road crossing 7 miles below Odessa on the road from Odessa to Klamath Falls:
Width, 14 feet; area, 9.8 square feet; discharge, 12.8 second-fee4,.
Sevenmile Creek near fort Klamath., Oreg. This creek is tributary to Upper Klamath Lake. A measurement was made September 1, 1906, at the bridge on the road between Fort Klamath and Pelican Bay:
Width, 29 feet; area, 99 square feel; discharge, 83 second-feet.
Spring Creek near Klamath Agency, Oreg. This stream is a small tributary of Crooked Creek. A measurement was made August 31, 1906, at the bridge 1 mile from Klamath Agency on the road to Fort Klamath:
Width, 22 feet; area, 42 square feet; discharge, 27 second-feet.
Willow Creel: near Brownell, Col. Willow Creek is tributary to Lower Klamath Lake from the south. The following measurements were made during 1906 near the bridge on the Merrill and Brownell road:
February 13: Width, 18 feet; area, 13 square feet; discharge, 1? second-feet. March 24: Width, 20.5 feet; area, 15.5 square feet; discharge, 17.2 second-feet. September 26: Width, 35 feet; area, 26 square feet; discharge, 13 second-feet.
Wood River near Fort Klamath, Oreg. Wood River is tributary to Upper Klamath Lake from the north. The following measurements were made August 30, 1906, at the bridge at Fort Klamath, Oreg.:
Width, 54 feet; area, 175 square feet; discharge, 257 second-feet.
At the bridge on the county road 4 miles below Fort Klamath, Oreg. :
Width, 55 feet; area, 313 square feet; discharge, 462 second-feet.
Williamson River near Klamath Agency, Oreg. This- stream is tribu tary to Upper Klamath Lake from the north. A measurement was made August 29 at the bridge on the county road between Klamath Falls and Fort Klamath, Oreg.:
Width, 162 feet; area, 1,348 square feet; discharge. 880 second-feet.

188 SURFACE WATER SUPPLY, 1906.
PRECIPITATION AND EVAPORATION DATA.
The following table gives the total precipitation and evaporatic in inches, by months, and also the annual totals, for 1906:
Precipitation and evaporation in Klamath River basin.
PRECIPITATION.
Keno, Oreg. Clear Lake, Oreg. Horse-fly, near
Jan.
6.94 4.00
9.47
Feb.
1.40 2.07
4.00
Mar.
2.94 3.62
6.65
Apr. May.
0.67 ' 2.33 .09 2.7
.52 1 1.88
June.
1.18 1.05
1.45
July.
1.26 .60
.00
Aug.
0.14 .00
.00
Sept.
0.66 .76
.6V
Oct.
0.89 .41
Nov.
1.90 2.05
Dec.
2.79 3.70
Annu
23. 21.
EVAPORATION.
Keno, Oreg...... (a) (a) 3.03 4.58 4.04 5,87 4.09 63.27 (a) (a)
a Wind and ice destroys record. 6 October 1 to 27, inclusive.

FLUCTUATIONS IN GROUND-WATER LEVELS IN THE VALLEY OF SOUTHERN CALIFORNIA.
By W. C. MENDENHALL.
In the summer of 1903 the United States Geological Survey under took a systematic study of the occurrence, distribution, and proper use of the ground waters in the valley of southern California. During the preceding decade the underground waters of this part of Cali fornia had been extensively drawn on as a source of supply for irriga tion and for municipal use. Many independent enterprises were established which depended .entirely on them, while older systems dependent in the beginning on gravity waters had found it necessary to augment their supply by utilizing subsurface waters. As a result of all this development greater in the citrus regions, where the large values of the products raised by irrigation made it possible to pay high prices for water; somewhat less in the lower lands, suitable only for the cultivation of alfalfa or other farm products, which yield less profits than those from the horticultural lands marked effects were produced on ground-water levels and on the yield of wells. It became evident, therefore, that any thorough study of conditions controlling the proper use of ground waters should involve the consideration of definite evidence as to their fluctuations and as to the relation of the fluctuations to development on the one hand and to the supply derived from annual rainfall on the other. During the decade of dry years which preceded 1903 it was evident that artesian areas had decreased, that the flow of individual wells had lessened, and that ground-water levels had been generally lowered; but definite observa tions as to the amount of these shrinkages for comparison with rain fall records were lacking except for a few wells. The Riverside Trust Company, the present owners of the Gage canal system and of the wells from which its water supplies are drawn, bad maintained since 1892 a series of systematic measurements of variations of water level in the Williams well on the Victoria tract, and Mr. J. B. Neff,
186

190 GROUND WATER IN SOUTHERN CALIFORNIA.
of Anaheim, had maintained a similar series of measurements sine 1898. Here and there throughout the valley of southern Californi scattered data were found bearing on the problem, but only in thes two localities had systematic and continuous observations been made
Because the ground waters of southern California occur not in on great basin but in a series of more or less completely separated sub terranean reservoirs, the supply in each being dependent upon th relation between local development and local tributary rainfal general conclusions that were applicable everywhere could not safel; be based on the records furnished by the Williams and Xeff wellt It was therefore decided, in the autumn of 1904, to begin an inde pendent series of measurements in wells so selected that they won1, be evenly distributed over the various basins which together mak up the lowland areas of southern California and would thus give a~ adequate basis for conclusions as to conditions in e^.ch of these basins For this purpose a number of wells were selected in localities dis tributecl from Santa Monica to San Bernardino and San Jacintc The attempt was made to select wells in each of the important loca ground-water districts which would adequately represent the variou conditions that exist in each of these districts. Wells have beeT selected which are close to the larger river beds and therefore flue tuate rapidly through a wide range with flood-water and low-wate periods, and other wells have been selected which are remote fror these local sources of supply and which on this account exhibit com paratively minor variations. Some of these observation wells ar situated in the vicinity of groups of large pumping plants; other are at points which are comparatively remote fnm these centers o great development, while still others were so selected as to form series, like that in the El Monte basin, extending back from a strear channel, the line of most effective recharge, thereby enabling th student of ground-water supplies to trace the percolation wave ar observe its diminishing intensity and amplitude as it advances fror its point of origin. It is believed, therefore, that practically all con ditions are well represented in the measurements which have bee" obtained.
At the time of the beginning of these measurements southern Cali fornia was near the end of a long period of low rainfall, during whicl ground-water levels had materially declined. Smce the beginniir of measurements, however, there have been two winters in which th rainfall reached from 20 to 30 per cent above the average, and th present winter that of 1906-7 it seems, will maintain this higl average. Under these conditions, since ground waters are dependen as absolutely if not as obviously on rainfall as are surface waters there should be a marked and general rise of the ground-water plan

GROUND WATER IK SOUTHERN CALIFORNIA.
if withdrawals are not in excess of the average annual restoration. Under conservative use of these waters the ground-water levels will decline during the dry periods but will recover correspondingly during the wet years. Continuous declines during seasons of excessive precipitation mean overuse.
A few of the results of these measurements have been discussed in Water-Supply Paper No. 218, which treats of ground-water condi tions in the foothill belt only; but in order that all the observations made may be available for engineers and others who are interested in ground-water problems in southern California, they p.re more fully presented in the tables that follow.
A simple black and white index map (PI. IV), 011 which the location of each record well is shown, accompanies the tables. On this map the wells are numbered, and corresponding numbers are given each record.
In order to facilitate still further the identification of the wells the name of the owner of nearly everyone of them is tgiven, as well as the approximate position of each in relation to a iiear-by town.
Tables showing variations of water level in wells in southern California.
1. R. Kidson, f mile NE. of Slau- son.
Date of measurement.
1905.
Feb. 0..................
Apr. 10.................
July 10.................Aug. 8.................Sept. 11. ...............
Dec. 14.............. ...
1900. Jan 22..................
May 2..................June 21................July 27 .................Sept. 17................
Ft. in. 44 1 44 6 44 4 44 1 44 4 44 9 45 3 45 11 46 2 45 10
40 10 47 7i 44 11 47 10 40 2 40 Gi 46 8
2. Chinese gardeners, J mile SW. of Slauson.
Date of measurement. w^
1904. Ft
Oct. 3. ............ ... 22Nov. 4................ 22Dec. 6_. .............. 22
1905.
Feb. 6................ 21
Apr. 10........... ..., 20
June 10... ........ . . 24July 10. ............... 23
Sept. 11............... 24Nov. 3................ 23Dec. 14............... 23
190(1.
July 27 ............... 24
hto
in.
4Jo 2
10 9U5
fi 0 07 0
2
(\
1
G^ 13"
SJ
3. Eliza Comelly, 1| miles N. 'of Sunnyside.
Date of measurement.
1905.
Feb. ti. ...............Mar 14Apr. 10 ...............May3................
July 10...............Nov. 3................Dec. 14.. .............
1900.
May 2 ................
Sept. 17...............Dec. 14...............
Depth to water.
ft. in. 22 5 22 6 21 11 21 6 21 5 22 7J 23 6 23 10 23 i
22 (1 22 U 23 9* 24 4| 23 7

192 GROUND WATEE IN SOUTHERN CALIFORNIA.
Tables showing variations of water Icrcl in irclls in southern California Continue
4. Mr. Till, 2$ miles S. of Slauson.
Date o£ measurement.
1904.
Oct. 3..................
1905.
Feb. 6..................Mar. 14................Apr. 10.................
July 10.................Aug. 8.................
Nov. 3... ..............
1906.
Mar. 19................Mav 2............*... .June 21. ................July 27.................
Depth towater.
¥i. in. 29 10 32 1J 31 11
29 7 29 6 29 1 28 7 28 8 29 4 29 5 30 1 30 6 30 (i 30 6
30 5 30 7J 30 9 30 731 0 32 8 31 44
5. J. P. Brockley, \ mile N. of Howard Summit.
Date, of measurement, ^t^0
1904. Ft. in.
Nov. 4................ 83 9Dec. 6................ 83 9
1905. Jan 3 83 8
6. F. H. Carrell, 1J- miles S of Gardena.
Date of measurement.
1904.
1905.
Mnr_ 14Feb. 6. ............... 83 8 ' Apr. 12. ..............Mar. 14............... 83 5 Mav 3. ...............Apr. 10.... ........... 83 5 June 9. ...............Mav 3................ 83 4 July 10. ..............June 9................ 83 8 Aug. 8. ...............July 10. .... ...... 84 2 Sent. 11. ....Aug. 8................ 84 7J
Nov. 3................ 1 85 1
1900. Jan. 22................ 84 4JMar. 19...-.......-..- 84 6JMay 2................ 83 4June 21 ............... 85 24July27..... ........... 85 1Sept. 17............... 85 9Dec. 14............... 87 2
7. A. B. Caldwell, ; mile S. of 8. II. J. Harris. \ mile N. of Moneta. Moneta.
Date of measurement.
1904.
Oct. 3..................Nov. 4.................
1905.
Mar. 14. ................Apr. 10. ..... ... .
July 10.................A iinr O
Sept. 11... ... ..... ...Nov. 3..... ...... .....Dec. 14.................
IflOti.
Mar. 19................May 2 ..................
July '27.. ...............Sept. 17................Dec. 14. ................
Depth towater.
Ft. in. 41 11 32 6 38 11 25 7
26 541 9 23 10
42 10 32 2 33 0 32 6 33 0 28 4 24 11
24 6 23 8 27 11 32 3 32 6J 30 84 25 0"
Date of measurement, ^j^/0
1904. Ft. in. Sept. 1................ 39 3Oct. 3................. 37 9Nov. 4................ 35 0
1905.
Mar. 14............... 25 81Apr. 10............... 32 8
June 9 35 2
Nov. 3. ...............
1906.
Mar. 19...............May 2 ................June 21 ...............July 27....... ........Sept. 17...............
Dep'waj
Ft.2
2 2 222 2 2 2 2 2
2
2 2 3 2 2
9. Stanley Bates, J mile N of Moneta.
Pate of measurement. ®P
1904.
1605.
Mar. 14...............
Aug. 8................Sent. 11. ....
July 10............... 33 9 Nov. 3. ...............Aug. 8 . 33 7 Dec. 14Sept. 11.............. 34 5Dec. 14... ............ 26 7
1906.
Mar. 19............... 23 7May 2................ 28 0June 21 ............... 28 6
Sept. 17............... 34 0Dec. 14............... 26 2
1906. Jan. 22................Mar. 19. ..............
Ft. 3
3 3 3 3 3 3 3 3
3 3
3 3 3
33

U.
S.
GE
OLO
GIC
AL S
UR
VE
Y
Pre
sent
Ap
pro
xim
ate
R
ecor
d W
ells
A
rtes
ian
Are
as
Origin
al
25
0 S
q. M
iles
Art
esia
n A
reas
375
Sc|.
Mile
s ^X
^S
SS
^W
r
-'S
CA
LE
D
2 4
6 8
10 M
ILE
S
V^X
l-^S
si^
k ' '/I
' (
,'
MA
P
OF
V
ALLE
Y
OF
S
OU
TH
ER
N
CA
LIF
OR
NIA
, S
HO
WIN
G
LO
CA
TIO
N
OF
W
ELLS
S
EL
EC
TE
D
TO
S
HO
W
GR
OU
ND
-WA
TE
R
CO
ND
ITIO
NS
.


GROUND WATER IN SOUTHERN CALIFORNIA. 193
Tables showing variations of water level in wells in southern California Continued.
10. Post and Lockhart, 2 miles 11. William Bayley, Chester W. of Howard Summit. place, Los Angeles.
Date of measurement.
1904.
1905. Jan. 3..................Feb. 6.......... .. . .Mar. 14................Apr. 10. ................May 3..................July 10. ................Aug. 8. ................Sept. 11.. ..............Dec. 14.................
1906.
Mar. 19................May 2..................June 21 ................July 27............... .Sept. 17................Dec. 14.............. ..
Dwfter!° : Date of measurement. !*££*>i
Ft. in. 35 74,
36 9 1 38 6 ! 27 4 35 8 35 9 38 0 40 3 47 4 39 3
36 0 ' 34 3 33 4t .38 2" 37 10 37 10J 37 1J
1904.
1905.
Feb 10
Apr. 10...............
July 11 ...............Yuff 9Sept. 12...............Nov. 4................Dec. 15...............
1906. Jan. 23................Mar. 20...............
Sept. 18...............Dec. 15...............
Ft. in. 69 0
69 21 69 5 19 9 69 8 69 8 69 8 69 10 70 0 70 14 70 4 70 51
70 64. 70 4 70 6J70 7 70 7 70 9 71 0
12. Tony Fright, W. Jefferson street, Los Angeles.
Date of measurement.
190 ».
1905.
Mar. 18...............Apr. 10.............. .
July 11...............Aug. 9................
Nov. 4................Dec. 15...............
190ix
Mar. 20...............
June 22 ...............
Dec. 15...............
Depth to water.
Ft. in.48 6
48 8 48 10 48 84. 48 4 48 1 48 6 48 104 49 l| 49 % 49 6 49 81
49 8 49 4 49 4 49 61 49 10 50 1 50 0
13. Mrs. Showers, \V. Jefferson St., Los Angeles.
Date of measurement.
1904. Oct. 3..................
Dee. 9..................
1905.
Feb. 10.................
Apr. 12.................
Aug. 9 .................Sept. 12................
1906.
July 28.................
Depth to water.
Ft. in. 33 8 33 9 33 6
33 6 33 0 32 24 32 1 32 9 33 0 33 9 34 4 34 7 34 9 34 3
34 1 33 3 33 6 33 11 33 6 33 11 34 7J 35 3 34 9
14. Artesian Land and Water Co., J mile N. of Cienega sta tion.
i
Date of measurement, ^j^*0
1905. Ft. in. Feb. 10 ............... 611Mar. 17............... 5 84.Apr. 13 ............... 5 10May 6................ 6 1
July 11............... 7 9Aug. 9................ 8 4 ;Sept. 12............... 8 9Dec. 15. .............. 8 1
1906.
Mar. 20............... 7 10May3................ 7 3J
Julv 28............... 9 0Sept. 18..........'..... 9 6
15. Los Arfeles County, Ivy station.
Date of measurement.
190*. Dec. 9 ................
1905.
Mar. 18...............Apr. 13.. .............
July 11...............Aug. 9 ................Sept. 12...............
Dec. 15...............
1906. Jan. 23.. .............Mar. 20. ..............
July 28 ...............Sept. 18. ..............Dec. 15 ...............
Depth to water.
Ft. in. 13 11
13 0 12 1 12 0 12 3 12 7 13 0 13 41 13 3 13 3J
13 1 12 5 12 2 9 81
12 10 13 3 13 34
8591 IRR 213 07- -13

194 GROUND WATER IN SOUTHERN CALIFORNIA.
Tables showing variations of water level in wells in southern California Continued
16. M. P. Kane, Palms. 17. F. P. Bojorquez, Palms. 18 ' Joso "16 N ' °f *
Date of measurement.
1904. Sept. 1 .................Oct. 12. ................Nov. 7 .................Dec. 9..................
1905.Jan. 6..................Mar. 18................Apr. 13.................July 11.................Aug. 9 .................Sept. 12................Dec. 15.................
1906.
Mar. 20................
July 28. ................Sept. 18................Dec. 15.................
Depth to water.
Ft. in. 50 849 649 650 2
49 949 449 449 849 1149 749 5*
49 649 2*49 5"49 5}49 1049 11
Date of measurement.
1904.
Nov. 7................
1905.Jan. 6 ................Mar. 18... ............Apr. 13...............
July 11. ..............
Sept. 12...............
Dec. 15...............
Mar. 20...............
July 28 ...............Sept. 18. ..............Dec. 15. ..............
Depth to water.
Ft. in.42 2442 445 5
42 9i43 343 4J43 643 643 843 1144 143 G45 7
44 544 2
46 744 CJ44 644 8
Date of Measurement.
1904. Doc. 2 ................
TQflK
Feb. 10 ... ........Mar. 18...... ........Af r. 13 ..... ......Juie 10. ..... . ......
A nir QSept. 12. ..............
Dec. 15. ..............
1900.Me v 3.... ............
Ju'v28...............Dec. 15. ..............
Depth wate-
Ft. i
19. J. H. Whitworth, 2 miles S Sherman.
Date of measurement. ^V
1904. Dec. 9..................
1905.
Feb. 10.... .............Mar. 18................Apr. 13.................
June 10 ................July 11.................Aug. 9.................Nov. 4. ................Dec. 15.................
1906.
Mar. 20. ...............
June 22. . . ............. July 28.................Sept. 18................Dec. 15.................
Ft. 10
10 988 8 9 9 8 9 9
8 8 7 9 9
10 8
of
ito
in. 9
6 99
04 208 7A 4"
98 8i 5*
?7
20. ITammel and Decker, 1 mile 21. William Niles, } mile S. of Sherman. of Sherman.
Date of measurement.
1904. Dec. 9 ................
1905.
Feb. 10 ...............
Apr. 13...............May 6 ................June 10 ............... July 11. ..............\ up* Q
Sept. 12...............
1900.
Mar. 20...............May 3 ................
July °8Sept. 18. ..............
Dwatert(> Date of measurement.
Ft. in. 13 6
13 6 12 11J 11 9 11 6 11 7 11 10 12 1 12 4 12 10 13 0 12 10
12 41 12 l| 11 9* 12 1"
12 7J 12 10i 12 6
1904. Oct. 14................Nov. 7................Dec. 9.......
1905.
Feb. 10...............
Apr. 13...............Mry 6.................
Ju'y 11...-.-.--.-.....Arg.9. ...............
Dec. 15................
1900.
Ju'y 28................
DPC. 15................
Depth wate-
Ft. 9 9 9
6
6 67 8 8 97
7
8 8 97

GROUND WATER IN SOUTHERN CALIFORNIA. 195
Tables showing variations of water level in wells in southern California Continued.
22. Los Angeles County, 1 mile E. of Sherman.
Date of measurement.
1904.
1905.
Feb. 10.................
\ llpr Q
Nov. 4 .................
1900. Jan. 23.................
July 28.................Sept. 18 ................
oo *, TJ n t- TJ ^ i 24. L. V. Ilarkness, U mile SK. 23. Mr. Hurlbut, Pasadena. of Pasadena;.
ter Date of measurement.
Ft. in. 84 31
S4 5t 84 6 84 6 84 4 84 3 84 6 84 C 84 10 85 2 86 0 86 9
84 6 86 3 86 5 86 8i 87 5J 87 8t 88 1*
25. Titus ranch, Sunny Slope station.
Date of measurement.
1904.
1905.
Sept. 13................
Dec. 18.................
1906. Jan. 24.................Mar. 22................
July 31.................Sept. 20................Dec. 17.................
Depth to water.
Ft. in. 13 6
10 4J8 7 8 6
8 1 11 6 16 1 19 2 16 2 12 10 10 7
10 9 10 0
8 6 8 4 8 4
18 3 16 9J 14 2|
1904.
1905.
Feb. 9. ...............Apr. 12...............May 10 ...............
July 12...............
Sept. 13...............Nov. 7................
190C. Mar. 22. ..............May 5 ................
July 31...............Sept. 20- ..............Dec. 17. ..............
Dw?tert0 1 Date of « ltjasurenu'nt.
Ft. in. 73 3 73 10 73 11 74 6
74 0 74 4 73 8 73 5 73 5 74 0 74 5 75 0 75 0 75 9
74 6 74 9 74 6 75 3J76 1J77 1
2(i. John McClain estate, 1 mile S. of San Gabriel.
Date of measurement. ^ater °
1904. Dec. 10................
1905.
Feb. 9................
Apr. 12 ...............
July 12...............
1906. Mar. 22...............
Sept. 20...............
Ft. in.72 11
72 10 73 0 72 10 72 7 73 4 73 3 74 1 73 0
72 8i 72 7i 72 8 72 3| 72 1 71 4
190*. Sept. 2................Oct. 5....... .........Nov. 8. ...............Dec. 10.....--......-.
19C5. Feb. 9 ................Mar. 17. ..............Apr. 12...............May 10...-....-----..June 13........---....July 12...............Aug. 10.. ....-.-.-..-.Sept. 13......-....--..
Dec. 18. ..............
19CO. Jan. 24. ..............Mar. 22 ...............May 5. ...............
July 31. ..............1 Sept. 20. ......--.--...
Depth to water.
Ft. in. 122 4 122 2J. 122 7 122 6-J
122 2 122 2 122 2 122 1 122 4 123 3 123 5 124 0 124 1 123 7
123 3J 123 2| 122 11 122 8 123 GJ 123 10 123 li
27. F. E. VT ilson, 2 miles S. of Sin Gabriel.
Date of measurement.
19C4. Dec. 10....- -.....--..
1905.
Feb. 7..... . ..........Mar. 17...............
July 12...............Aug. 10...............Sept. IS...............
Dec. 18...............
19C«. Jan. 24...............Mar. 22. ..............
Dec. 17...............
Depth to water.
Ft. in. 23 5i
23 6 23 3 22 82 21 0 21 4 22 6 22 3 22 8 22 11
22 3 23 0 22 8 21 8 21 4 21 11

196 GEOUND WATEE SOTJTHEEN CALIPOENIA.
Tables showing variations of water level in wells in southern California Continue'
28. G. B. Renfro, f mile SW. of Savannah.
29. J. A. L^milo W. of El '| ^ M Ritter> E , Monte _
Date of measurement. vvater ° Date °f measurement.
1904.
1905.
Apr. 12.................
July 12.................
Sept. 13................
1906.
Ft. in. 19 0
20 1J20 0 19 318 4 17 8 18 7 18 11 19 2
20 3
19 10 18 11 18 1 18 4 18 8 18 8
1904.
190.5.
Mar. 17...............Apr. 12.... ...........July 12...............
1906.
Mar. 22...............
July 31...... .........
Dec. 17. ..............
Depth to water.
Ft. in.16 2
16 1* 16 3" 13 8 13 2 13 1 13 5i14 4 14 1 13 9
13 8?, 12 6"
11 8 11 5 11 10* 12 2t 11 9"
Date of measurement. ' '^^.
1904.
Dec. 10 ...............
1905.
Feb. 9................
' Apr. 12...............
Tnlv 1'?
D:c. 18...............
1906.
Mar. 22...............May 5................
July 31 ...............
D'o. 17...... ........
Ft. 22 22
22 21 20 18 16 16 17 16 17 18 18
18 17 14 12 12 14 14
31. Mrs. McClure, \ mile S. of El Monte.
Date of measurement. ^teV01
1905.
Feb. 9. .................
July 12.................
Novr. 7.................
1906.
Mar. 22................
Tune 25July 31......... ........
Dec. 17.................
Ft. in. 16 6 15 10 14 2 12 5 13 9 14 8 13 6 13 6
13 1 12 1010 ti 10 0 10 4|12 i 10 7"
32. T. D. Andrews, li mile SE. of El Monto.
Date of measurement.
1904.
1905.
Apr. 12... ............
Aug. 10...............Sept. 13. ..............Nov. 7................
190' .
Mar. 22... ............
July 31 ..............Sept. 20...............DPC. 17...............
Depth to water.
Ft. in.21 5.V
20 8 17 10 15 10 14 8 13 8 13 9 15 9 16 10 17 3 17 0
17 4 15 4 12 8 11 9 12 2 13 5J 13 8
33. Jackson Frees, 2 miles £ El Monte.
Date of measurement.
1905. Feb. 9-.---....-.----.Mar. 17... ............Apr. 12...............
July 12... .... .......Aug. 10 ....... ....... Sept. 13...............
DH<. 18...............
1906. Jan. 24...............Mar. 22...............May 5 ................June 25... ...........July 31........ .......Sept. 20....... ...... D>3C. 17...............
Dept1 wat£
Ft. 27 23 20 20 18 19 21 22 23 22
19 22 18 18 17 18 19

GROUND WATER IN SOUTHERN CALIFORNIA. 197
Tables showing variations of water level in wells in southern California Continued.
34. E. Gurado 3 miles W. of Whittier.
Date of measurement.
1904.
Nov. 8.................Dec. 7..................
1905.
Feb 7Mar. 15................
Aug. 11................Sept. 14................Nov. 6.... .............Dec. 16.................
1906.
June 23................July 30. ................
Dec. 18.................
Depth to water.
Ft. in. 14 2 13 4 12 1
11 6
10 310 51 10 7.1 11 8
12 (i 13 0 11 10 11 3
11 11 10 3i 9 6J
11 3 9 8* 10 0"
9 9t
35. Mrs. Mary Pheland, 2 miles S\V. of Whittier. '
Date of measurement.
1904.Nov 9
1905.
Feb. 7................
Aug. 11...............
Dec. 16... ............
1906.
July 30...............
Depth to water.
Ft. in.15 3
14 Hi 14 2J 13 4 13 213 4 13 84 14 5"
15 0 15 814 5 13 10
12 3 14 9 17 10 12 6J
3fi. H. C. F aid win, * mile BE. of Whittier.
Date of measurement.
1904. Sept. 8................Oct. 4 ................Nov. 8................Dec. 7................
1905.
Feb. 7.. ..............
Apr. 11...............
July 14...............Aug. 11...............
Nov. 6................Dec. 16...............
1S06.
May 4.. ..............June 23...............
Dec. 18...............
Depth to water.
Ft. in. 129 2 128 4J 128 5 128 7J
128 6 128 7 128 8 128 4 128 3 128 4J 128 8 128 10 128 11 129 0 128 10
128 8 128 8 127 5J 128 6 128 6 128 64 128 6"
37. C. A. Landreth, 1 mile S. of Whittier.
3S. J. W. Sharp, Santa Springs.
39. John H. Borden, 1J miles N. of Norwalk.
Date of measurement.
1904.
Oct. 4..................Nov. 9.................Dec. 7..................
1905.
Feb, 7..................Mar. 15................Apr. 11.................
Jnlv 14.................
Sept. 14................Nov. 6.......... .Dec. 16.................
1906.
Mar. 10.. ..............May 4..................June 23................July 30.................Sept. 19................ Dec. 18.................
Depth to water.
Ft. iu.
33 7i33 5
32 ti31 1031 S31 732 433 233 433 132 10
31 831 6*31 5|33 432 G 32 1
Date of measurement.
1904.
OU. 4................
Do,-. 7................
1905.
Ffli. 7................Mar. 15.. .............Apr. 11...............Mnvr,. ...............June 12...............July 14...............Aug. 11...............Sept. 14...............Nov. 0................D<v. H>.. .............
1906.
Mar. 10...............
June 23...............
Sept. 19..............
Depth to water.
Ft. in.
26 9?;
07 7
26 225 7
Or 1 1
26 026 817 o27 427 326 1
24 6
94 9
26 9
Date of measurement.
H'04.
Dec. 7..............'..
Feb. 7................Mar. 15...............
Aug. 11...............Sept. 14...............
190t>
1 June 23...............
Dec. 18...............
Depth to water.
Ft. in.7 108 5
7 11
5 10J
7 28 08 88 7
6 8
5 6J7 Q 16 9*

198 GROUND WATER IN SOUTHERN CALIFORNIA.
Tables showing variations of water level in ivells in southern California Continued.
40. Norwalk Builders' Associa- , 41. J. B. Nefl, li miles S. of tion, Norwalk. i Anahefm.
Date of measurement.
1904.
Oct. 4..................Nov. 9.................Dec. 7..................
1905.
Feb. 7. .................
July 14.................Aug. 11.... ............Sept. 14................Nov. 6.................Dec. 16.................
1906. Jan. 25.................Mar. 10........... ....
June 23. ...............July 30............ ....Dec. 18............ ....
Depth to water.
Ft. in. 19 5 15 8 16 4 17 4
15 3J14 H 13 4i 13 7"
14 6 15 10 16 11 17 9 15 4 14 7
13 8 1C 11 16 3 15 6| 15 4J 15 0
Date of measurement.
1904.
Oct. 1................Oct. 31...............Dec. 1................
1905.
Feb. 1................Mar. 1........ .....Mar. 31...............May 18.......July 1.... ............July 31 ...............Aug. 31 ...............
Nov. 1.......Dec. 1................
1900. Jan. 6.......... .....Mar. 3................Mar. 31....... . ... .
Mav 19......... .....July 1.. ..............July 30......... .....Sept. 2.......... .....Sept. 27...............Nov. 1 ......... .....Nov. 30...............
Depth towater.
Ft. in. 50 10 50 8 50 8 50 9
51 0 50 11 50 7 49 10 49 7 51 4 51 7 52 7 52 4 51 10 51 5
51 4 51 2 50 10 49 5 49 2 49 7 50 6 51 1 50 9 50 2 49 5
42. Vineland distrLt school, Vineland.
Date of measurement.
1904.
1905. Jar. 12................Feb. 21...............Mar. 10...............Ap-. 15...............Mav 17...............
Jul" 21.. .............
Sept. 20.............Nov. 12...............Dec. 21.............. .
1906. Jar, 27.............
May8................
Au-j. 1................Sept. 25...............Dec. 11.............
Depthwater
Ft. i' 104
104 102 ] 98 93 ] 90 90 ] 91 92 93 95 96
97 95 83 81 82 ' 85 - 88 -
43. G. F. Chamberlain, 2 miles [ SW. of Covina. 1 44. H. Ileinze, Puente. 45. William Rowland, finite'
of Rowland.
Date of measurement.
1904. Oct. 8..................Nov. 17.......... ....Dec. 14.... ..... ....
1905. Jan. 12.................Feb. 20.Mar. 11........... ....Apr. 15.................May 17.................July 21.... .............Aug. 10................Sept. 21........... ..Nov. 12................Dec. 21 .................
1906.
May 9..................June 27................Sept. 25................Dec. 11.......... .......
Depth to w.-ter.
Ft. in. 119 0119 6120 9
120 11120 9120 1118 1117 9112 6111 6
112 11
109 6105 3J104 4i108 1
Date of measurement.
1904. Oct. 8................Nov. 17...............Dec. 14...............
1905. Feb. 21 ........ . . .Mar. 11...............
June 22........ ......
Aug. 16....... ......Sept. 20. ..............
1906.Mar. 15...............
June 27...............Sept. 25...............
Depth to water.
Ft. in. 30 029 1030 0
29 228 4
28 6
27 1128 3°8 4-1-2
25 623 7i26 4J
Date of measurement.
1904. Ocrt. 8................Nov. 17...............De?. 14...............
1905.
Feb. 21...............
Sept. 20...............
De?. 21...............
1906.
Aug.2. ...............
Dec. 11...............
Depth water
Ft. i' 272625
23
24
26
23
232227252723

GROUND WATER IN SOUTHERN CALIFORNIA. 199
Tables showing variations of water in wells in southern California Continued.
46. B. Yortaa, li miles E. of Rowland.
Date of measurement.
1904. Oct. S..................Nov. 17................Dec. 14.................
1905.
Feb. 20.................Mar. 11................
July 21.................May 20.................Nov. 12...... ....Dec. 21 .................
1900. Jan. 27.................
Depth to water.
Ft. in. 35 6 35 10* 33 5
30 8 29 9 30 10 31 0 32 11 33 2 33 11 33 0 31 5
31 7 28 2*31 0 30 8 31 11
47. F. Bowers, Lemon.
Date of measurement.
1904. Oct. S................Nov. 16...............
1905.
Feb. 20...............Mar. 11...............Apr. 15...............June 22. ..............July 21 ...............Aug. 16...............Sept. 20...............
1906.
May 9................June 27...............
Sept. 25... ...........
Depth towater.
Ft. in. 27 10 25 4OS <U
24 4 23 10 23 6 20 JH 23 5"
24 0 25 10 25 i 23 4"
22 0
21 6 21 4 21 10 24 S\ 25 8"
25 4^
48. S. E. Hicks, J mile W. of Spadra.
Date of m3asurement.
1904.
Nov. 17...............
1905. Jan. 12...............Feb. 21.......... ....Mar. 11...............
July 21...............
Nov. 12...............Dec. 21 ................
1306. Mar. 15... .............
Aug.2........ ........Sept. 25...............Dec. 11...............
Depth to water.
Ft. in. 33 8 32 9 32 9
32 0 31 8?, 31 51 32 7"
34 2 35 2 36 6 36 2 35 7
35 5 34 8 34 8 38 U 40 2"
39 3
49. Sidney Deacon, 2 miles W. of 50. Win. Ferry, 1} miles SW. of |, 51. Azusa Irrigating Co., SanSan Dimas.
Date of measurement, ^ter*0
1904. Ft. in. Oct. 7.................. 121 3Nov. 16............... 124 0Dec. 13................. 124 0
1905. Jan. 11................. 123 6Feb. 20................. 123 5Mar. 10................. 127 0Apr. 14................ 125 0May 17................. 124 8June 22................ 125 UJuly?!. ................ 125 5"
Sept. 21................ 125 7Nov. 11..... ......... 126 0
1906. Jan. 27............ .... 124 6Mar. 15................. 124 3May8.................. 125 2June 27................. 124 6
San Dimas.
Date of measurement.
1904.
Nov. 16...............Dec. 13................
1905. Jan. 11................Feb 21Mar. 10...... .........
July 23................Aug. 16...............Sept 'INov. 11 ...............Dec. 20................
1906.
May 8.................
Aug.2................Sept. 24...............
Depth to water.
Ft. in. 199 8199 10199 10J
199 9i
199 8}9QQ 4200 4J
200 7200 7201 0201 0
201 3201 3201 2201 5|201 9201 7|
Dimas Wash.
Date of measurement.
1904. Oct. 7.................
Dec. 13................
1905.
Mar. 11...............
May 17................
A i-inr 1 f\
Sept. 21...............Nov. 11...............Dec. 20.. ..............
May8.................
Dec. 10................
Depth to water.
Ft. in. 97 297 898 11
99 198 497 495 694 394 195 496 497 498 699 0
97 1097 2*93 291 1J92 498 7J
100 11

200 GROUND WATER IN SOUTHERN CALIFORNIA.
Tables showing variations of water in wells in southern California Continued.
52. Emil Firth, San Dimas Wash.
Date of measurement.
1904.
Oct. 7. .................Nov. 16................Dec. 13.................
1905.
Feb. 20.................
May 17 .................
July 23 .................Aug. 16.................
Nov. 11................Dec. 20.................
1906. Jan. 27. ................Mar. 15.................May8..................
Depth to water.
Ft. in. 110 6J 111 7 113 2 113 11
114 8| 113 11 113 7 106 10 104 9 104 4 105 6 105 10 106 7| 108 1£ 108 1
107 6J 108 2 87 10 92 11 97 4i 96 11
55. Ontario Water Co., 1 mile N. of Claremont.
Date of measurement.
1904. Nov. 16................Dec. 13.................
1905. Jan. 11.................Feb. 20... ..............
July 20.................
1906.
May8..................
Dee. 10.................
Depth to water.
Ft. in. 62 1 61 10
62 2 62 1 61 10J 59 4 59 1J 57 5 57 0 59 7 58 6 58 4* 57 3"
56 9£K'3 OL
54 4 53 3i 54 1 53 3i 56 10
53. Charles Alley, 1 mile NW. of Lordsburg.
Date of measurement.
1904. Oct. 7.................
Dec. 13................
1905.
Mar. 10...............
July 20................
Sept. 21...............Nov. 11 ...............
1906.
May 8 ................
Aug. 1. ...............Sept. 24...............
Depth to ! water.
Ft. in. 145 4 146 10 146 10
146 9 147 5J 147 6| 147 7 146 8 153 8 150 } 150 11 152 7 152 0
151 5i 149 2i 149 6" 149 \ 153 1* 154 4| 154 7
56. R. Bieley, Claremont.
Date of measurement.
1904. Oct. 8.................Nov. 16 ...............
1905.
Feb. 20...............Mar. 10...............
May 17................
July 20................Aug. 16...............
1906. Jan. 27................
MayS.................
Depth to water.
Ft. in. 97 4 97 6 98 1J
97 0 92 5 91 2 89 9 88 10 92 0 97 4 98 7 99 9 93 8
97 9.i 84 10"
82 4 81 2 76 3 65 5 49 9
54. Mr. Massey, f mile NF Lordsburg.
Date of measurement.: ^
1904. Oct. 7.................
Dec. 13................
1905.
Mar. 11...............
May 17................
July 20................
Sept. 21.. .............Nov. 11...............
1906. Jan. 27................
May 8. ................
F
ll IP
IP 19 19 20 IP 19 20 19 23 20 20
20 20 IP IP IP IP If
57. San Antonio Water O mile SW. of Claremont
Date of measurement.
1904. Oct. 6.................Nov. 16...............
1905.
Feb. 20.......--.-....Mar. 10.....---..-....
May 17................June 22...............July 20................
Nov. 11...............Dec. 20................
1906.
Mar. 14...............
Dec. 10................
Depwa
F15 IF 15
IF IF IF 14 14 14 IF IF IF IF U
1-1 1-JIf
K

GROUND WATER IN SOUTHERN CALIFORNIA. 201
Tables showing variations of ivater in wells in southern California Continued.
58. Dr. A. R. Reed, 11 miles NE. of Pomona.
Date of measurement. ! ^ater*0
1904. Ft. in.
Oct.6. ................. 75 41Nov. 16................ 74 6Dec. 13................. 74 3
1905. Jan. 11................. 68 101Feb. 20. ................ 66 l"Mar. 10................. 65 11Apr. 14................. 63 11May 17................. 62 11
July 20................. 70 10Aug. 16................. 71 11
Nov. 11................ 70 4^Dec. 20................. 67 0
1906. Jan. 26................. 64 9Mar. 14................. 62 10May8.................. 62 5
Aug. 1. ................. 67 0Sept. 24................ 67 JDec. 10................. 64 3t
59. B. Linastruth, Pomona.
Date of measurement.
1904. Dec 14
1905. Jan. 12................Feb. 21 ...............Apr. 15...............May 17................
July 21. ...............
Nov. 12...............
1906.
Sept. 25...............Dec. 11................
Depth to water.
Ft. in. 90 6J
90 9 91 1 91 591 6J 92 0 92 10*93 6 93 4 93 6
92 6 93 6 95 6 96 0 95 2
60. J. J. White, Pomona.
Date of measurement.
190-t. Oct.6.................
"non i *?
1905. Jan. 11................
Apr. 14...............May 17. ...............
T!PP o A
1906.
Mar. 14...............May8.................
Sept. 24...............
Depth to water.
Ft. in. 58 94. 60 3 60 6i
60 10 61 IJ 61 4J 60 8 60 11 61 1 61 6 61 10 62 4 62 5
62 3i 63 1 63 14 63 5"
64 4J 64 11
61. Mrs. Tieg, H miles SE. of 62. R. Riemers, 2* miles SE. of Pomona. li Pomona.
63. C. P. Brown, 21 miles SE. of Pomona.
Date of measurement.
1904.
Oct. 6..................Nov. 16................Dec. 13.................
1905.
Feb. 20.................
Sept. 20................Nov. 11................Dec 90
1906.
Mav 8.... ..............Aug.l. ................Sept 94
Depth to water.
Ft. in. 89 088 1088 10£88 10
88 1089 0on n
88 1190 I 190 5 J90 8*90 590 0
89 6
89 792 292 2
Date of measurement.
1904.
Oct. f.................
Dec. 13...............
1905. Jan. 11...............Feb. 20...............Apr. 14...............May 17...............June 22...............July 20...............
Sept. 20...............Nov. 11...............
1906.
Mar. 14...............May8................June 26...............
TloP 1 A
1
Depth to water.
Ft. in. 34 636 64,34 1034 10
34 9*34 7432 10"32 733 635 43,5 035 635 S35 74.
36 SI-35 8"33 2434 44.35 5
Ofi 01
Date of measurement.
190-1.
Oct. 6................Nov. 16...............Dec. 13...............
1905. Jan. 11...............Feb. 20...............Mar. 10...............Apr. 14...............Mav 17...............
July 20...............Aug. 16...............Sept. 20...............Nov. 11...............
1906.Jan. 26...............Mar. 14...............
Sept. 24...............Dec. 10...-...--......
Depth to water.
Ft. in. 8 96 6J3 103 3
2 52 09 11 52 07 5
12 1012. 211 10J4 71
4 1
4 3J3 104 4t
13 10
13 64 10

20 2 GROUND WATER IN SOUTHERN CALIFORNIA.
Tables showing variations of'water in wells in southern California Continued.
64. Mr. Haley. \ mile W. of San Bernardino.
Date of measurement.
1904. Julys..................
Sept. 1. ................
Nov. 1....... ..........Dec. 1 . . ... ...........
1905.
Feb. 1 ..................
Depth towater.
Ft. 36.6 38.18 37. 23
38.9 39.83
33.0 30.559Q 7S
May 1 .................. 30. 1
July 1Oct. 1. .................Nov. 1.................Dec 1
1906.
Feb. 1 ..................Mar 1Apr. 1..................May 1 ..................
Julyl..................
37.6 39.0 40.5
33.7
33.7 33.0 32.0 31.38 36. 57 35.7 38.430.4
65. C. W. Rogers, 1 mile E. of Colton.
Date of measurement, "^yater*0
1904. Julyl................
1905.
Feb. 1................
Apr. 1................Mav 1 ................
July 1
Ft.15.718.0519.70 20. 96 20.17 21.82
17.48 12.45 1
5.4 j 5.6 ' 6.4 9.3
66 Riverside Water Co., 2 m E. of Colton.
Date of measurement.
1904.
Oct. 3................Nov. 1 ................Dec. 1 ................
1905.
Feb. 1 ................Mar. 1 ................
May 1................
Julvl.. ..............Are. 1 ...
Aug. 1.... ............ 12.75 Setit. 1... .............Sept. 1..... ...........' 15.9 .. Oct. 1.... ............Oct. 1............ . 18. 45 i Nov. I................
1906.
Feb. 1................Mar. 1................
Oct 9°
18.28
14.34 19 5138.355.406.00
17.2
Dec. 1................
1906.
Feb. 1................Mar. 1................Apr. 1................Mey 1................
July 1 ................Oct. 22...............
Yield miner inche
3
5 4
5 Capp Capp Capp
5
3 4 4
Capp
Capp Capp Capp Capp Capp Capp Capp
4
67. Riverside Water Co. , Third and Waterman sts., San Bernardino. :
Date of measurement.
1904.
Oct. 3..................Nov. 1 .................
1905.
Feb. X..................Af Q T" 1
Apr. 1..................
Jul<7 1......... .........
Sept. 1. ................
Nov. 1... ..............Dec 1
1906. Jan. 1..................Feb. 1..... .............Mar 1
July 1...... ............ Get ^
68. N. B. Hinkley estate, I mile W. of Bryn Mawr.
Yield in miner's | Date of measurement, inches, j
121.5
112 5
1904. July 1................Aug. 4. ..... . .Sent. 1................
116.0 Oct. 3................116. 3
117.0 Capped. Capped. Capped. Capped.
117.0 118.4 116.7 111.6 115.1
Capped.
Capped. Capped. Capped. Capped. Capped. Capped.
149.5 104.9
1
Nov. 1................Dec. 1 ................
1905. Jan. 1 ................ leb. 1................Mar. 1................Apr. 1................
June 1 ...............July 1 ................Aug. 1................ Sept. 1................Oct. 1................Nov. 1.... ............Dec 1
1906. Jan. 1 ................Feb. 1................Mar. 1................Apr. 1................
J une 1 ................ Julyl................
Depth to water.
Ft. 85.9 82.7 84.5 80.0 80.6 80.8
81.0 80. 8 80.7 79.078.5 78.0 78.4 78.7 79.2 79.35 81.0 79.5
79.4 78.5 77.89 77.27 74.66 74.4 74.2
69. Riverside County, 2J mi S. of Alessand'ro.
Date of measurement.
1904. Oct. 18...............Nov. 18..... .Dec. 15...............
1905. Jan. 13 ............ . .Feb. 22....... .......Mar. 24...............Apr. 19............... May 19...............July 22...............Aug. ]8...............Sept. 22. ..............Nov. 9. ...............
1906. May 11...............June 29.... ...........Aug. 3. ...............
Depth\vate-
Ft. 52 51 51
51 50 49 49 49 50 50 50 ' 51
51 52 52 52

GROUND WATER IN SOUTHERN CALIFORNIA. 203
Tables showing variations of water in -wells in southern California Continued.
70. 4 miles NE. of Perris. 71. C. Lossman, 2J miles N. of
Date of measurement. Water °
1904. I Ft.
1905. Jan. 14................. 32Feb. 22................. 31Sept. 22................ 28Nov. 9................. 297~)OP OQ ')Q
Dec. 20................. 30
in.
0li
0 4
437 1
11 L
Date of measurement.
1904.
1905. Jan. 13.. .............Feb. 22... ........Mar. 26.. .............Apr. 19...............May 19. ..............
July 22. ........ ....Aug. 19. .. ...........Sept. 22............... ..
Depth to water.
Ft. in. 63 3.1
63 4 1, 63 0"
i2 0 62 3.\ 52 0"
i2 0y> o
62 262 ?:
Nov. 9..... ........... 62 5Dec. 23 62 .",
Aug. 3................
Dec 20
62 4 62 562 563 263 4 (13 41
72. Crawford Carter
Date, of measurement.
1904. Oct. IS.........
Dec. 15 ...............
1905. Jan. 13.. ............Feb. 22......... .Mar. 26. ....
June -0. ....July 23...............Sept. 22........
Dec. 22. ......
190H. Jan. 29.. ......... ...
June 28......... .
Dec. '20. .......
, Perris.
Depth to water.
Ft. in. 33 4 33 3 33 4
32 6 31 9-i 30 10 30 7 30 2* 30 l"
30 4 30 6 30 11 31 4J
31 8 31 8 31 2J 31 9 32 4\ 32 3"
73. Mrs. L. R. llarford, E. of Perris.
Date of measurement.
1901.
1902.
1903. Feb. 28.................
1904. Jan. 31............... .Feb. 28....... .........Mar. 3.................
July 3..................Sept. 15................
1905.
Dec. 22.................
1906.
May 12.................
3J, miles
Depth to water.
Ft. in. 28 11
40 241 7 42 9
38 7 37 6 38 2 43 4
43 4 41 11J 41 9 40 11 42 10 44 10
44 9 43 0
42 3 42 2 40 24 38 8£ 41 7 42 5J 43 6J
74. E. E. Waters, Ethanac. 7o " ^f^^y1
Date of measurement, ^ter
1904. Ft. in. Jan °9 44 2
Water Co., 11 of Ethanac.
Date of measurement. °Pthto
1904. Oct. IS .
Feb. 27 -41 4 l Nov. 18.....
Mar. 27............... 43 4Slav 27............... 41 7iJuly 2.... .......... 46 0
1905. Feb. 20... ....... 44 8
Sept. 1.... ........... 47 6Oct. 1................ 47 10Nov. 6.... .......... 48 2Dec. 22 ... 44 8
1906. Jan. 29............... 42 10Feb. 4................ 42 4
May 12............... 41 2
Aug. 4................ 45 0Sept. 27............... 47 6i
Dec. 15.. ....
1905. Jan. 13... ...Feb. 22..... .
June 20. . ....July 23......Aug. 19-.-...Sept. 23. ....Nov. 10......Dec. 22. . .
1906. Jan. 29......Mar. 16......May 12......June 28. . . .. .
Sept. 27......
Ft. in. ......... 29 10......... 30 4......... 30 7
in v......... 26 10J......... 25 10......... 28 0......... 28 9......... 29 5......... 29 8......... 30 3......... 29 8
......... 29 7J
......... 28 8*
......... 27 9
......... 27 9
......... 28 7
......... 30 1
......... 30 2

204 GROUND WATER IN SOUTHERN CALIFORNIA.
Talks showing -variations of ivater in wells in southern California Continuec
76. Doctor Reese, 2J miles S. of ' 77. William Newport, 4£ miles ' 78. William Newport, M Perris. S. of Perris. Valley.
Date of measure nent. Depth to
1904. Ft. in. Oct. 18...--.......-.-.. 21 10Nov. 18................ 19 0Dec. 15................. 18 9J
1905. Jan. 13---...---.....-. . 18 5Feb 22 10 9
Date of measurement. "^Vater
1904. Ft. in.
Nov. 18............... 3710 .... _.. ..
Date of measurement.
1904.
Nov. 18Dec. 15... ............ 38 3 DPP.. is
1905. 1905. Jan 1 3
Feb. 22 .. . 38 0 Feb. y>Mar. 26 . . ... 9 74 Mar. 96 37 i Mar 9HMay 19......-....-..-.- 11 11
July 23.. ............... 13 3Aug 19 13 4
Apr. 18............... 36 7 Apr. 18..... .
Jnlv 23 37 9 Jnlv 73Sept. 23................ 15 0 Aug. 19. .............. 38 2
Dec. 22... . ........... 15 10J Nov. 10.. 39 5
1906.
Mar 16 15 7
Dec. 22 39 4
Vug 19
Dec. 22
190(1. 1900. Jan. 29 . 38 6 Jan. 29
May 12......... ........ 15 2 Mar. 16. .............. 38 54. Mar. 10..... . ..June 28................ 15 5 ' May 12. .............. 37 4| May 12. , .Sept. 27 16 2£ June 28 3fi 3 Jilnp 98
79. H. H. Lindenberger, 4 miles SW. of Winchester.
Date of measurement. Water
1905. Ft. in. Feb 22 23 4
Aug. 4...... ......... 37 0 Aug. 4.Sept. 27............... 38 0 Sept. 27. ..Dec. 21...... ........ 38 5J Dec. 21
De
80. M.M.Patterson, Winchester. ' « "^1^. o^^SS
Date of measurement. vv^ter ° Date of measurement.
. 1904. Ft. in. Oct. 18...... . 24 3
Mar 25. 22 5 Nov. 18 23 F,
May 19 ................. 19 0July 23.. ............... 19 0Sept 23 18 7
1905. Ja.n. 13 22 31
Nov. 10.... ........... 18 0 Feb. 2">._. ...... 21 f>"Dec. 22................. 18 3 1,
Jan. 29. ................ 18 0Mar. 10................ 18 3May 12.................. 16 9June 28..... ........... 16 9Sept. 27................ 10 HiDec. 21. .. . ........... 10 10
July '3 19 7Vug 19 19 SSept. 23. ............ . 19 10 . ....................
1905. Mar. 25... .... . ... .
1 July 23...............
Sept. 23......... .....
1900. Jan. 30
Nov. 9 20 1 Mar 1fiDec. 22........ ..... 20 4
1900.
May 12...............
Sent '^7May 12 .. 20 0 Dec. 9iAug 4 19 II 1Sept. 27....... ...... 20 fDec. 21............... 20 24
DeV

GROUND WATER IN SOUTHERN CALIFORNIA. 205
Tables showing variations of water in wells in southern California Continued.
82. J. E. Garrigan, 1 mile \V. of Hemet.
Date of measurement. D terto
1904. Ft. in. Dec. 15............... . 33 3
1905. Jan. 14................. 33 5Feb. 23. ................ 33 3Mar. 25................ 33 liApr. 18 33 1
83. Mrs. RubyHewitt, imileE. of Bowers.
Date of measurement. D *e1J.to
1904. Ft. in. Oct. 19 11 5
84. J. Carmichael, Bowers.
Date of measurement.
: 1904 Oct. 1Q
Nov. 19"... 11 9 ; Nov. 19 .Dec. 16............... 12 2
1905. Jan. 14............... 12 4Feb. 23........ . ... . 10 1
May 18 33 0 Mar. 26 fl aJune 20.............. . 33 2July 23............... 33 1Aug. 19................ 34 0Sept. 23... ........... 33 0Nov. 10................ 33 0
1906.
May 12................. 32 10*June 29................ 32 6Aug. 4. ................ 32 9Sept. 27. ................ 32 74.Dec. 20................. 32 6|
Apr. 19............... 2 1Mav 19.. ............. (a)June 20............... (a)July 22 07
1905
Feb. 22...............
Apr. 18...... .........
Julv 93Aug. 18... .. ... 18 Aiisr. 18. . ... ... .Sept. 22............... 3 2Nov. 10............... 4 74
1906. Jan. 30............... 6 5Mar. 17...........:... 5 6Mav II..-......--...- 1 ( 6 )
Nov. 10...............
1906. Jan. 30...............Mar. 17.....'..........May 11...............Aug. 3. ...............
Depth to water.
Ft. in. 7 7J 7 10* 8 0
8 1 6 8 4 3 2 4
Flowing. Flowing. Flowing.
3 9 2 6 2 9 3 1
2 9 2 8
Flowing. Flowing. Flowing. Flowing.
85. K. D. Harger, Lakeview.
Date of measurement. D e,.tO
1004. Ft. in. Nov 19 30 1
Date of measurement, ^fter*0 Date of meas'irement.
1905. Ft. in. Mfl.v 19. . 28 11
Dec. 16.... ... . 2910 June 21 .. .... .. 2810
1905. Feb 22 29 5
Aug 18 29 1
1906.
May 11...............
A lie-. 3 . . . . . .Sent. 22. .. .. 20 3 Spnt. 2fi. . ... ......
Mar. 26 1 29 24 Nov. 9 29 5 DMJ. 20 . ... ......
Depth to water.
Ft. in. 29 6 29 2 29 2 29 34. 29 54, 29 8
a Flowing good stream. b Flowing 5 miner's inches. Flowing 7 miner's inches.


INDEX.
A. Page.
Acknowledgments and cooperation........ 22Acre-foot, definition of..................... 10Alessandro, Cal., wells near, fluctuation in.. 202 American River near
Fairoaks, Cal.:description....................... . 146discharge........... . . ........ 14Cdischarge, monthly................. 147gage heights...................... 146-147rating table......................... 147
American River basin:description .......................... 145-146
Anaheim. Cal., wells near, fluctuation in... 19S Arrowhead Springs, Cal.
East Twin Creek near:description.............. ........ . 85discharge........................... 85
Waterman Canyon (West Twin Creek)near:
description......................... 85discharge........................... 85
Arroyo Seco near- Pasadena, Cal.:
description......................... S9discharge........................... 89
Soledad, Cal.:description......................... 98discharge........................... 98discharge, monthly................. 100gage heights........................ 99rating table......................... 99
Lone Pine, Cal.:description......................... 59discharge............ .............. 59discharge, monthly................. 59
Azusa, Cal.San Gabriel River and canals near:
description......................... 86-87discharge........................... 87discharge, daily..................... 88discharge, monthly................. 88gage heights........................ 87
B.
Bailey Creek near Prattville, Cal.:
description......................... 135discharge........................... 135
Baird Station, Cal.Sacramento River at:
description ....................... 103
Page. Bakersfield, Cal.
Kern River near:description......................... 150discharge........................... 151discharge, monthly................. 151
Bear River above and near- Wheatland, Cal.:
description......................... 144discharge........................... 144discharge, monthly................. 145gage heights........................ 144rating table......................... 145
Bear River basin:description........................... 143-144
Bpckwith, Cal.Feather River, Middle Fo'k, near:
discharge........................... 138Grizzly Creek near:
description....................... 121-122discharge........................... 122discharge, monthly................. 123gage heights........................ 122rating table......................... 123
Bernardo River basin:description............................. 71
Berry Creek near- Berry Creek post-office, Cal.:
description......................... 135discharge........................... 135
Bidwell bar- Feather River near:
discharge........................... 136Bieber, Cal.
Pit River near:description......................... 104discharge........................... 104discharge, monthly................. 105gage heights........................ 105rating table......................... 105
Big Bend, Cal.North Fork of Feather River near:
description....................... 133-134discharge........................... 134gage heights. .........'............ 134-135
Big Meadow,. Cal.Hamilton Branch of North Fork of
Feather River at: discharge........................... 137
Big Pine, Cal.Big Pine Creek near:
description......................... 44discharge........................... 44
207

208 INDEX.
Big Springs near Page. Prattvilie, Cal.:
description......................... 135discharge........................... 135
Birch Creek near Tinemaha, Cal.:
description......................... 44discharge........................... 44gage heights........................ 44
Bishop, Cal.Bishop Creek near:
description......................... 42discharge................. v ......... 42discharge, monthly................. 43gage heights........................ 43rating table......................... 43
Black Rock Springs near- Independence, Cal.:
description......................... 59discharge........................... 59
Bowers, Cal., wells near, fluctuation in..... 205Brownell, Cal.
Cottonwood Creek near:description..... ^................... 186discharge........................... 186
Willow Creek near:description......................... 187discharge........................... 187
Bryn Mawr, Cal., wells near, fluctuation in. 202 Butt Creek at and near
Butte Valley, Cal.:description......................... 132discharge........................... 132 gage heights...................... 132-133
Prattvilie, Cal.:description......................... 136discharge........................... 136
Butte Valley, Cal. Butt Creek at:
description......................... 132discharge........................... 132gage heights...................... 132-133
C.
Cable Canyon Creek near- Glen Helen, Cal.:
description......................... 84discharge........................... 84
Cable station, figures showing ............. 17,156Cache Creek at and near-
Lower Lake, Cal.:description......................... 110discharge........................... 110discharge, monthly................. Illgage heights........................ 110rating table......................... Ill
Yolo,CaL:description......................... Illdischarge........................... 112discharge, monthly................. 113gage heights........................ 112rating tabl*......................... 113
Oacfa* Oreek btata:
Cajon Creek near P Keenbrook, Csl.:
description.........................discharge ...........................
Calabasas, Cal.Malibu Creek rear:
description.........................discharge...........................discharge, monthly.................gage heights........................
Triunfo Creek near:description.........................discharge...........................discharge, monthly.................
California, rainfall in.......................California, Gulf of, filling up of.............Cherry Creek, North Fork, near-
Crystal, Oreg.:description.........................discharge...........................
Chino Creek near Rincon, Cal.:
description.........................discharge...........................
Chester, Cal.Warner Creek near:
description.........................discharge...........................
Willow Creek near:description.........................discharge...........................
Chester Branch. Ste Feather River, ChesterBranch.
Cienega. Cal., wells near, fluctuation in.....Claremont, Cal., wells near, fluctuation in.. Clear Creek near:
Prattvilie, Cal.:descriptior.........................discharge...........................
Clear Lake, Cal. Lost River nee.r:
description.........................discharge...........................discharge, monthly.................gage heights........................rating tab'e.........................
Clements, Cal.Mokelumne River near:
descriptior.........................discharge...........................discharge, monthly.................gage heights........................rating tabfe.........................
Colorado River, silt deposited by...........Colorado River at and near
Hardyville, Ariz.:descriptior.........................discharge...........................discharge, daily.....................discharge, monthly.................gage heights........................
Haading No. 3 of Imperial Canal:descriptior.........................discharge...........................gage height........................

ITSTDEX. 209
Colorado River at and near Continued. Yuma, Ariz.:
description......................... 26discharge........................... 26-27discharge, daily..................... 28discharge, monthly................. 29gage heights........................ 27-28
Colton, Cal., wells near, fluctuation in...... 202Computation, methods of.................. 19-22Cooperation and acknowledgments......... 22Cottomvood Creek (of Klamath River) near
Brownell, Cal.:description......................... 186discharge........................... 186
Cottonwood Creek (of Owens River) near Lone Pine, Cal.:
description......................... 59discharge........................... 59
Olancha, Cal.:description.............. .......... 57-58discharge........................... 58discharge, monthly.. .. ........... .58gage heights........................ 58
Cottonwood Creek (of San Diego Bay) near Jamul, Cal.:
description......... ............... H2-63discharge........................... 64discharge, monthly................. r>4
Covina, Cal., wells near, fluctuation in ...... 198Crescent Mills, Cal.
Indian Creek near:description ........................ 123-124discharge............................ 124discharge, monthly.................. 125gage heights......................... 124rating table.......................... 125
Crooked Creek near Klamath Agency, Oreg.:
description .......................... 186discharge............................ 186
Crystal, Oreg.North Fork of Cherry Creek near:
description.......................... 186discharge............................ 186
Current meters, classes of................... 16methods of using........................ 16-17plate showing........................... 16
Current-meter station, view of.............. 16Curves (area, discharge, and velocity), figure
showing......................... 17
D.
Definitions of terms used.................... 9-10Descanso, Cal.
Sweetvater River near:description........... .. .. ....... 66-67discharge............ . ......... 67discharge, monthly. . .. ........... 68gage heights....... . ... .... ..... 67-68
Devil Canyon near Irvington, Cal.:
description ...... . .. . ............ 85discharge.............. .. .......... 85
Discharge,measurement and computation of 19-22
Division Creek near- Independence, Cal.:
description........ ................. 48discharge............ ............... 49discharge, monthly.... . ........... 49gage heights......... . ............. 49
Doris Creek near Doris, Cal.:
description .......................... 186discharge............................ 186
Dotta Spring near Prattville, Cal.:
discharge............................ 136Drainage basins, list of. ................... 8-9
East Twin Creek near- Arrowhead Springs, Cal.:
description.......................... 85discharge............................ 85
Eightmile Creek near- Independence, Cal.:
description.......... . ... ... ..... 50discharge............ ..... ......... 50discharge,monthly.......'. ......... 50
El Monte, Cal., wells near, fluctuation in .... 196Enterprise, Cal.
South Fork of Feathor River near:discharge............................ 139
Equivalents, table of........................ 12-13Escondido, Cal.
Santa Y sabel Creek near:description.......................... 71-72discharge............................ 72discharge, monthly.................. 73gage heights......................... 73
Ethanac, Cal., wells near, fluctuation in..... 203
F.
Farmers canal, near Yuma, Ariz.:
description.......................... 29discharge............................ 29
Feather River at and near Bidwell Bar:
discharge............................ 136Oroville, Cal.:
description.......................... 120discharge............................ 120discharge, monthly.................. 121gage heights......................... 120rating table......................... 121
Feather River basin:description........................ 118-119
Feather River, Chester Branch of NorthFork, near
Prattville, Cal.:discharge............................ 136
Feather River, Hamilton Branch of NorthFork, at and near
Big Meadow, Cal.:discharge............................ 137
8591 IRR 213 07- -14

210 IKDEX.
Page. Feather River, Hamilton Branch of North
Fork, at and near Continued. Prattville, Cal.:
description.... ............... ..... 130discharge.......................... 130,137gageheights..................... ... 131
Feather River, Middle Fork, near Beckwith, Cal.:
discharge............................ 138Feather River, North Fork-
near Big Bend, Cal.:description........................ 133-134discharge............................ 134gage heights....................... 134-135
above Prattville, Cal.:description.......................... 128discharge............................ 129gage heights....................... 129-130
below Prattville, Cal.:description....................... 125-120discharge............................ 12(idischarge, monthly.................. 128gage heights......................... 127rating table.......................... 128
near Prattville, Cal.:discharge............................ 138
near Tyler, Cal.:discharge............................ 138
near Warner Creek mouth:discharge............................ 138
Feather River, Prattville Branch of NorthFork, at
Prattville, Cal.:discharge............................ 138
Feather River, South Fork, near Enterprise, Cal.:
discharge............................ 139Fish Springs near
Tinemaha, Cal.:description.......................... 00discharge............................ 60
Floats, use of, in measuring discharge....... 15-16Flournoy ditch near
Genesee, Cal.:description....... .................. 136discharge............................ 136
Fluctuations in wells, data on............ lsii-205Fort Creek near-
Fort Klamath, Oreg.:description......................... 186discharge........................... 186
Fort Klamath, Oreg. Fort Creek near:
description......................... 186discharge........................... 186
Sevenmile Creek near:description......................... 187discharge........................... 187
Wood River near:description......................... 187discharge........................... 187
Fruto, Cal.Stony Creek basin:
description......................... 108discharge........................... 108discharge, monthly................. 109
Fruto, Cal. Cout'uued.Stony Creek bisin Continued,
gage heights................rating table.................
Gaging stations, equipment of.......... .location of, pla.te showing..............
Gardenia, Cal., we'ls near, fluctuation in... Genesee, Cal.
Flournoy ditcl near:descriptior.........................discharge...........................
Hosselkus ditch near:descriptior.........................discharge...........................
Indian Creek near:discharge...........................
Little Grizzly Creek near:description.........................discharge...........................
Red Clover Creek near:description.........................discharge...........................
Squaw Queen Creek near:description.........................discharge...........................
Ward Creek near:description....................... .discharge...........................
Georges Creek near Independence, Cal.:
description...... ...... . .. fdischarge........................... fdischarge, monthly.................
Glen Helen, Cal.Cable Canyon Creek near:
description........................discharge...........................
Goodale Creek near Tibbets, Cal.:
description.......... ..........discharge............ ..............discharge, monthly.................gage heights........................
(ireat Basin drainage:general features........................
Greenville, Cal.Wolf Creek nea.r:
description.........................discharge...........................
Gregory, Cal.McCloud River near:
description.........................discharge...........................discharge, monthly.................gage heights........................rating tabli.........................
Sacramento River at:description.........................
Grizzly Creek near Beckwith, Cal.:
description....................... 121discharge...........................discharge, monthly.................

INDEX. 211
Page.Grizzly Creek near Continued.
Bpckwith, Cal. Continued.gage heights ............... . 122rating table.... .................. . 123
Ground water, fluctuations in .. .... IN9-205Ouenoc, Cal.
Puta Creek near:description. ....... . . ......... 114discharge. .......... . .......... . 114discharge, monthly ... ............ 1 15gage heights .............. ....... 1 1 4-115rating table. . ....................... 115
Gulf of California, filling up of .............. 30-31
ir.Hamilton Branch. See Feather River.
Hamilton Branch.Hardy ville, Ariz.
Colorado River at:description ......................... 'Sidischarge ........................... 23discharge, daily ..................... 25discharge, monthly. ................ 2r,gage heights ........................ 24
Hemet, Cal., wells near, fluctuation in. .. . 204 205Hosselkus ditch near
Genesee, Cal. :description . . .137discharge.... . 137
Hot Springs Valley.Hot Springs Valley Creek at
description ..... 137discharge.. 137
King Creek at:description. 137discharge. ........ . .... 137
Howard Summit, Cal., wells near, fluctuation in.... ......... . . ....... 192. 193
Hydrographic surveys, organization andscope of . . . s
1.
Ice-covered streams, methods of measuringflow of...... ..... ... .... Id
Imperial canal, flood on . . . ....... 3jIndependence, Cal.
Black Rock Springs near.description ......................... 59discharge ........................... 50
Division Creek near:description ......................... 4<sdischarge ........................... 49discharge, monthly ................. 49gage heights ........................ 49
Eightmile Creek near:description ......................... 50discharge ................. . . ...... 50discharge, monthlv ................. 50
Georges Creek near:description .............. ... . . . 55, (iOdischarge ................ .... . . . 55, 00discharge, monthly. ....... ....... 55
Independence Creek near:description. .......... .... . .... 52,tiOdischa rge ............ ..... . . . 52, f>0discharge, monthly ........ . . 53gage heights. ...... .... . . ..... 53
I'ilKP.
Independence, Cal. f ontiinn'd.Moflett Creek near:
description. ..... .... 54discharge..... . .... . . 54discharge, monthh ' 54
Oak Creek near:description ....... .... .'.1discharge ................... . . . 51discharge, monthl\ ............ .. . 52gage heights. ............... . . . 51
North Fork of Oak Creel, nea::description. .................. . . iOdischarge . ...... .............. i 0
Shepherds Creek near:description. ........ . ......... ... .,:>, Udischarge . ......................... 53, t/1discharge, monthlv ................. 54
South Fork of Oak Creek near:description. ........................ (.0discharge .......................... H)
Thebaut Creek near:description. ............ . ........ (Hdischarge. .......................... 01
Indian Creek nearCrescent Mills, Cal..
description ..... 1 23-124discharge. .... 12 1discharge, month 1> 125gage heights. .. 124rating table. . 125
Uenesee, Cal.:discharge .. . 137
mouth:discharge. .... . . 13V
Irvington, Cal.Devil Canyon near
description. ... . S5discharge ...... . >>5
Ivy, Cal., wells near, fluctuatii'ii in 193, JH4
i .Jamul, Cal.
Cottonwood Creek near.description. ...... . . 02, (13discharge. ........... . . 04discharge, monthlv. ..... r>4
Fine Valley Creek nea r:description. ...... .. ... h4-i>5discharge ............. ...... . . 05discharge, monthly. ... ....... . . 0(igage heights ...... ... ............. (>">
K.
Kaweah River below Three Rivers, Cal.:
description. ................. .... .54-155discharge ......................... 155discharge, month! .................. 15<igage heights. .... ... . ........ 155rating table. ....... . .... ...... 1 5ti
Kaweah River basin:description. ......... .................. 154
Keenbrook, Cal.Cajon Creek near-
description. ...... ............. .. Mdischarge.... ....... ........... s-l

212 INDEX.
Page. Keno, Oreg.
Klamath River at:description......................... 178discharge........................... 178discharge, monthly................. 179gage heights........................ 179rating table......................... ' 179
precipitation........................... 188evaporation............................ 188
Kern River near Bakersfteld, Cal.:
description......................... 150discharge........................... 151discharge, monthly................. 151
' Kern River basin:description........................... 149-loO
King Creek at Hot Springs Valley, Cal.:
description......................... L37discharge........................... 137
Kings River:cable station on, view of.... ...... ... I/it;near Sanger, Cal.:
description.............. .......... 157discharge.................... ....... 157discharge, monthly................. 159gage heights............ ........... 158rating tables........................ 158
Kings River basin:description........................... 156-157
Klamath Agency, Oreg.Crooked Creek near:
description......................... 186discharge........................... 186
Spring Creek near:description................. ....... 187discharge........................... 187
\Villiamson River near:description ......................... 187discharge........................... 187
Klamath Falls, Oreg.Link River at:
description ............. . ........ 176discharge........................... 176discharge, monthly................. 177gage heights...................... 176-177rating table................ ....... 177
Upper Klamath Lake near:description................ ...... 177-178gage heights........................ 17s
Klamath River at Keno, Oreg.
description......................... 178discharge........................... 178discharge, monthly................. 179gage heights........................ 179rating table......................... 179
Klamath River basin:description........................... .17.V17G
Knights Ferry, Cal.Stanislaus River at:
description......................... 170discharge........................... 170discharge, monthly................. 171gage heights........................ 171rating table......................... 171
1 Knights Ferry, Cal. Continued.Stanislaus Water Company's ditch at:
description........................discharge..........................gage heights.......................rating tab'e........................
Lagrange, Cal.Modesto canal at:
description....................... 161discharge...........................gage heights........................rating talle.........................
Tuolumne River at:descriptor....... ...............discharge.......... . ..............discharge, monthly.................gage heights....... .............rating table......................
Turlock canal at:descriptior.....................discharge..........................gage heights...................... 16^rating table.........................
Lakeside, Cal.San Diego Riv?r near:
description......................... Pdischarge...........................discharge, monthly.................gage heights........................
Lakeview, Cal., wells near, fluctuation in... Lemon, Cal., wells near, fluctuation in......Link River at
Klamath Falls Oreg.:description.........................discharge...........................discharge, monthly.................gage heights....................... 176rating taLli............. .... ......
Little Grizzly Creek near- Genesee, Cal. :
description........... ...... ......discharge.............. ..........
Lompoc, Cal.:Santa Vnez River near
discharge................ . .......Lone Pine, Cal.
Ash Creek near:description........................discharge...........................discharge, monthly......... .......
Cottonwood Creek near:description.........................discharge ......................^...
Lone Pine Creek near:description...................... 5.~>-.~>fdischarge........................... ofdischarge, monthly.................gage heights........................
Tuttle Creel;: near:description......................... 5discharge...........................discharge, nonthly.................gage heights........................
Lordsburg, Cal., wells near, fluctuation in,.

INDEX. 213
fage.Lorella, Oreg.
Miller Creek near:description......................... 184discharge...................... .. . 1S5discharge, monthly............ . .. 186gage heights....... ....... . 185rating table.............. ... . . 1S5
Los Angeles, Cal., wells near, fluctuation in.. 193Los Angeles River, at--
Los Angeles, Cal.:description............. ....... .. 89discharge........... .......... 89
Los Angeles River basin:description........ ... .... SS-89diversions........ 00
Lost River near- Clear Lake, Cal.:
description........ . . 181discharge.......... . ... 181discharge, monthly.. 182 gage heights...... . . 181rating table....... . . 182
Merrill, Oreg.:description........ . ..... .. 182discharge............. ... . 182discharge, monthly... ... .. 181gage heights.................. .. . 183rating tables...................... 1X3
Lower Lake, Cal. Cache Creek at:
description......................... 110discharge.......... ......... .... . 110discharge, monthly................. Illgage heights........................ 110rating table......................... Ill
Ludy canal near Yuma, Ariz.:
description......................... 29discharge.......................... 29
Lytle Creek near Rial to, Cal.:
description......................... 85discharge........................ .. 85
M.McCioud River near
Gregory, Cal.:description........... ............. 106discharge........................... 100discharge, monthly....... ......... 1U7gage heights................. ...... 106rating table......................... 107
Malibu Creek near Calabasas, Cal.:
description......................... 91discharge........................... 91discharge, monthly................. 92gage heights........................ 01
Malibu Creek basin:description............................. 90
Matilija Creek near Matilija, Cal.:
description......................... 93discharge........................... 03
Matilija Creek, North Fork, near Matilija, Cal.:
description......................... 93discharge...................... ... 93
Mendenh.au, W. C., 011 fluctuation ofground water................. 189-205
Menifee Valley, Cal., wells near, fluctuationin.......................... .... 204
Mentone, Cal.Santa Ana River near:
description........... ............ 79discharge........................... Mldischarge, daily...--..---.-..-.... . NIdischarge, monthly................. sigage heights........................ M
Merced Falls, Cal.Merced River above:
description......................... 1611discharge................. ......... Killdischarge, monthly................. 162gage heights...................... 160-161rating tables............ .. .... 162
Merced River in Yosemite Valley, California:
description......................... 162discharge........................... 162gage heights........................ 162
Merced River basin:description............................. 159
Merrill, Oreg.Lost River near:
description......................... 182discharge........................... 182discharge, monthly................. 184gage heights........................ 183rating tables........................ 183
Tule Lake near:description......................... 184gage heights........................ 184
Miller Creek near Lorella, Oreg,:
description......................... 184discharge........................... 185discharge, monthly................. 186gage heights........................ 185rating table......................... 185
Miner's inch, definition of.................. 10Modesto canal at
Lagrange. Cal.:description................... ... 166-167discharge..............'........-.... 167gage heights........................ 167rating table.............;........... 168
MoSett Creek near Independence, Cal.:
description......................... 54discharge........................... 54discharge, monthly................. 54
Mohave River at Victorville, Cal.:
description......................... 61discharge........................... 62
Mohave River basin:description............................. 61
Mokelumne River near- Clements, Cal.:
description......................... 173discharge........................... 174discharge, monthly................ 175gage heights........................ 174rating table......................... 175

2H INDEX.
Mokelumne Uivor basin: I'age. description........................... . 173
Moneta, Cal., wells near, fluctuation in... 191? Multiple-point method of measuring dis
charge, description of. ... . 11-L2
Nefl, J. B., well measurement s I >y..........New Liverpool Salt Co., gage heights kept
by...................... .......Nordhofl, Cal.
Sail Antonio Creek near.description .........................discharge ........_................-.
North Arm Creek near Taylorsville, Cal.:
description.........................discharge........... ...............
Norwalk, Ca!., wells near, fluctuation in ...
()ak Creek near Independence, Cal.:
description......................... ">ldischarge................. ......... .11discharge, monthly..... ...... .52gage heights............ . ,">l
Oak Creek, North Fork, near Independence, Cal.:
description.............. .......... tilldischarge............. ............. til)
o.'ik Creek, .South Fork, near Independence, Cal. 1.
description......................... (illdischarge........................... (id
Odessa, Oreg,Rock Creek near:
description......................... 1STdischarge........................... ]S7
c.lancha, Cal.Cottonwood Creek near:
description......................... .57-.58discharge........................... .58discharge, monthly................. 08gage heights................. . .... .58
Oroville. Cal.Feather River at:
description..................... .. 120discharge.............. ..... ..... 120discharge, monthly........ . ...... I2Lgage heights........ ............... V20rating table..................... ... 121
Owens River near Citrus, Cal.:
description......................... 37discharge................... ..... 38
Ronnd Valley, Cal.:description................... ..... 3.5discharge..................... .... 3f>discharge, monthly............. :<7gage heights..... ..... . ........ . 3drating table........ ......... ...... 3i>
Tinemaha, Cal.:description......................... ,'J7discharge........................... 38
Owens River near Continued. Pa Tinemaha, Cal. Continued.
discharge, monthly................gage heights........ ...............rating tablt....... .................
Owens River basin:description............................. 3J
Pala, Cal.San Luis Rey River near:
description.........................discharge...... ....................discharge, rionthly.................gage heights............ ...........
I'alms, Cal., wells j-ear. fluctuation in ......Pasadena, Cal.
Vrroyo fcjeco, Cal..description.................... ...discharge........... ...............
wells near, fluctuation in...............I'erris, Cal., wells near, fluctuation in .... 203,Pine Creek near-
Round Valley, Cal.:description......................... 4(discharge...........................discharge, monthly........... .....gage heights........................rating table.........................
Pine Valley Creek rear .Tamul, Cal.:
description....... .......... ..... (idischarge...........................discharge, monthly ...... ..... ....gage heights........................
Pit River at and near Bieber, Cal.:
description.........................discharge...........................discharge, monthly.................gage heights........................rating table.........................
Pit River basin:description........................... 103-
Pomona, Cal., wells near, fluctuation in ....Portersvdle, Cal.
Tule River near:description.........................discharge..........................discharge, rionthly.................gage heights...................... 152-rating table.........................
Prattville, Cal.Bailey Creek near:
description........................discharge...........................
Big Springs near:description.........................discharge...........................
Butt Creek near:description.........................discharge...........................
Chester Branch of North Fork ofFeather Rivernear:
discharge...........................

INDEX. 215
Prattville, Cal. Continued. l j age.Clear Creek near:
description......................... 136discharge.;.........._.............. 13fi
Dotta Spring near:discharge.......................... 13(5evaporation at...................... 140
Hamilton Branch of North Fork ofFeather River near:
description......................... 130discharge......................... 130,137gage heights........................ 131
North Fork of Feather River above: - description......................... 128
discharge........................... 129gage heights...................... 129-130
North Fork of Feather River below:description....................... 125-120discharge........................... 126discharge, monthly................. 128gage heights........................ 127rating table .... ................... 128
North Fork of Feather River near:discharge........................... 138
Prattville Branch of North Fork ofFeather River at:
discharge....................... ... 138Rock Creek near:
description......................... 139discharge.......... ................ 139
Price current meter, view of.............. 10Puente, Cal., wolls near, fluctuation in ... HIK Puta Creek at and near- -
Guenoc, Cal.:description......................... 114discharge....................... .. litdischarge, monthly................. 11")gage heights...................... I H-11 .">rating table......................... 11 ">
Winters, Cal.:description......'................... 116discharge........................... 110discharge, daily..................... 117discharge, monthly............... . 116gage heights........................ 117
Puta Creek basin:description........................... 113-114
Q. Quincy, Cal.
Spanish Creek near:description......................... 139discharge........................... 139
R.
Rating tables, construction of.............. 19-21Red Bluff, Cal.
Sacramento River near:description......................... 101discharge........................... 101discharge, monthly................. 102gage heights........................ 102rating table......................... 102
Red Clover Creek near Genesee, Cal.:
description......................... 139discharge........................... 139
Red Mountain, cable station near, view of . 156
Rialto, Cal. l'.v<>.Lytle Creek near:
description......................... 85discharge........................... S.">
Rincon, Cal.Chino Creek near:
description......................... 85discharge........................... 85
Santa Ana River near:description......................... 85discharge........................... 85
Riverside Trust Co., well measurements by. 189 Rock Creek near
Odessa, Oreg.:description......................... 187discharge.......................... 187
Prattville, Cal.:description......................... 139discharge........................... 139
Round Valley, Cal.:description......................... 39discharge........................... 39discharge, monthly................. 40gage heights........................ 39-40rating table......................... 40
Round Valley, Cal.Pine Creek near:
description......................... 40-41discharge........................... 41discharge, monthly................. 42gage heights........................ 41rating tables........................ 42
Owens River near:description......................... H.r>discharge........................... 36discharge, monthly................. 37gage heights........................ 30rating table......................... 36
Kock Creek near:description......................... 39discharge........................... 39discharge, monthly... ............. 40gage heights........................ 39-40rating table......................... 40
Rowland, Cal., wells near, fluctuation in.. 198,199 Run-off, computation of.................... 19-22
definition of............................ 10
S.
Sacramento River at and near Gregory (Baird Station), Cal.:
description......................... 103Red Bluff, Cal.:
description......................... 101discharge........................... 101discharge, monthly................. 102gage heights........................ 102rating table........... ............. 102
Sacramento River basin:description........................... 100-101
Salinas River basin:description............................. 97-9.S
Salton Sea, description of................... 30-33evaporation from....................... 31floods in................................ 31-32gage heights in......................... 33-34

216 INDEX.
San Antonio Creek near Page. Nordhoff, Cal.:
description......................... 93discharge........................... 93
San Bernardino, Cal., wells near, fluctua tion in.......................... 202
San Diego Bay basin:description............................. 62
San Diego River near Lakeside, Cal.:
description......................... 63-63discharge........................... 70discharge, monthly...............:. 71gage heights........................ 70
San Dimas, Cal., wells near, fluctuation in.. 199 San Dimas Wash, Cal., wells near, fluctua
tion in........................ 199,200San Francisco Bay drainage:
genera] features........................ 100San Gabriel, Cal., wells near, fluctuation in. 195 San Gabriel River and canals near
Azusa, Cal.:description............ ...... . . .«6-87discharge........................... 87discharge, daily..................... 88discharge, monthly................. 88gage heights............ ......... . 87
San Gabriel River basin:description............................. 85-86
San Joaquin River at Herndon, Cal.:
description......................... 148gage heights........................ 149
Polasky, Cal.:discharge........................... 149
San Joaquin River basin:description.............................. 148
San Luis Rey River near Pala, Cal.:
description.......................... 74discharge.................. ........ 75discharge, monthly................. 76gage heights........................ 75
San Luis Rey River basin:description.............................. 73-74
Sanger, Cal.Kings River near:
description.............. . .. 157discharge.................... .... 157discharge, monthly........... .. 159gage heights.......... . .... .. 158rating tables................. . ... 158
Santa Ana River near Mentone, Cal.:
description.......................... 79discharge............................ 80discharge, daily..................... 81discharge, monthly................. 81gage heights........................ 80
Rincon, Cal.:description.......................... 85discharge........................... 85
Santa Ana River basin:description.............................. 78-79 ,see page measurements................. 81-84 |
Santa Barbara, Cal. Pi Santa Ynez River near:
description..........................discharge...........................discharge, monthly.................gage heights........................rating tabl =>.........................
Santa Fe Springs, Cal., wells near, fluctua tion in..........................
Santa Margarita River basin:description..............................
Santa Maria, Cal.Santa Maria R'ver near:
description.........................discharge...........................
Santa Maria River basin:description.............................. 9
Santa Yncz River near Lompoc, Cal.:
discharge...........................Santa Barbara, Cal.:
description..........................discharge...........................discharge, monthly.................gage heights........................rating table.........................
Santa Ynez River basin:description............................. 9;
Santa Ysabel Creel- near Escondido, Cal :
description.......................... 7discharge...........................discharge, monthly.................gage heights........................
Savannah, Cal., we'ls near, fluctuation in... Sevenmile Creek near
Fort Klamath, Oreg.:description..........................discharge...........................
Shepherds Creek near Independence, Cal.:
description.......................... 5rdischarge........................... o"discharge, monthly.................
Sherman, Cal., wells near, fluctuation in.. 194, Silverlake, Oreg.
Sycan River near:description..........................discharge...........................discharge, daily.....................discharge, monthly.................
Single-point method of measuring dis charge, description of...........
Slope method of treasuring discharge, de scription of..................... 13
Slauson, Cal., wells near, fluctuation in... 191, Smartville, Cal.
Yuba River near:description..........................discharge...........................discharge, dqily.....................discharge', monthly.................gage heights ........................
Soledad, Cal.Arroyo Seco near:
description..........................discharge...........................

INDEX. 217
Soledad, Cal. Continued. Page. Arroyo Seco near-Continued.
discharge, monthly................. 100gage heights........................ 99rating table......................... 99
Southern Pacific Ocean drainage:general features......................... C2
Spadra, Cal., wells near, fluctuation in..... 199Spanish Creek near
Quincy, Cal.:description......................... 139discharge........................... 139
Spring Creek near Klamath Agency, Oreg.:
description......................... 187.discharge........................'... 187
Squaw Qupen Creek near Genesce, Cal.:
description......................... 139discharge........................ .. 139
Stanislaus River at Knights Ferry, Cal.:
description......................... 170 ;discharge........................... 170 [discharge, monthly................. 171 Igage heights........................ 171rating table......................... 171 [
Stanislaus River basin:description........................... 169-170
Stanislaus Water Company's ditch at Knights Ferry, Cal.:
description......................... 172discharge........................... 172,gage heights........................ 172rating table......................... 173
Stony Creek near- Little Stony Creek:
discharge........................... 109 iFruto, Cal.: J
description.......................... 108discharge........................... 108discharge, monthly................. 109 ,gage heights..................... .. 108 lrating table.........-..-..-.-.--.... 109
Stony Creek basin:description................. ........... 107
Stream flow, measurement and computa tion of.......................... 13-22
papers on, list of....................... 9 [Surface water supply, papers on, list of.... 8-9 1Sunny Slope, Cal., wells near, fluctuation in. 195 Sunnyside, Cal., wells near, fluctuations in. 191 Sweetwater River near
Descanso, Cal.:description......................... tiG-67discharge........................... ti7discharge, monthly................. G8gage heights........................ 07-68
Sycan River near Silverlake, Oreg.:
description......................... 180discharge............................ 180discharge, daily..................... 180discharge, monthly................. 180
T. ' Page. Tables, explanation of...................... 10-12Taboose Creek near
Tibbetts, Cal.:description...................... 45-40,01discharge........................... 46,61discharge, monthly................. 46gage heights........................ 46
Taylorsville, Cal.North Ann Creek near:
description......................... 138discharge........................... 138
Temecula Creek near Temecula, Cal.:
description......................... 76-77discharge........................... 77gage heights....................... 78
Tenaya Creek in Yosemite Valley, California:
description......................... 163discharge........................... 163gage heights.......... ........... 162-163
Thebaut Creek near- Independence, Cal.:
description......................... 61discharge........................... 61
Three Rivers, Cal.Kaweah River below:
description....................... 154-155discharge........................... 155discharge, monthly................. 156gage heights........................ 155rating table......................... 156
Tibbetts, Cal.Goodale Creek near:
description......................... 47discharge........................... 47discharge, monthly................. 48gage heights........................ 47
Taboose Creek near:description...................... 45-46,61discharge........................... 46,61discharge, monthly................. 46gage heights........................ 46
Tinemaha, Cal.Birch Creek near:
description......................... 44discharge........................... 44gage heights......... .............. 44
Fish Springs near:description......................... 60discharge................ .......... W)
Owens River near:description............ ............ 37discharge........................... 38discharge, monthly................. 39gage heights....... ................ 38rating table....................... 38
Tinemaha Creek near:description......................... 45discharge........................... 45gage heights........................ 45
Triunfo Creek near Calabasas, Cal.:
descript ion......................... 92discharge.................... ...... 92discharge, monthly................. 92

218 INDEX.
Tule Lake near Page. Merrill, Oreg.:
description....................... 184gage heights...................... 184
Tule River near Portersville, Cal.:
description......................... 152discharge........................... 152discharge, monthly................. 153gage heights.............. .... .. 152-153rating table........................ 153
Tule River hasin:description........................... ISl-lffi
Tule River, South Fork, near- Ttile River:
discharge........................... 154Tuolumne River at
Lagrange, Cal.:description....... ................. 105discharge..................... ..... 165discharge, monthly........... .. .. 160gage heights.................. . ... 165rating table.................. ..... 160
Tuolumne River basin:description............................. 104
Turlock canal at Lagrange, Cal.:
description......................... 108discharge............ I.............. 108gage heights..................... 108-169rating table... ................. 1fi9
Tuttle Creek near Lone Pine, Cal.:
description......................... 50-57discharge........................... 57discharge, monthly................. 57gage heights............ ........... 57
Tyler, Cal.North Fork of Feather River near:
discharge........................... 138
Upper Klamath Lake near Klamath Falls, Oreg.:
description....................... 177-178gage heights........................ 178
Velocity methods of measuring discharge,description of................... 15-19
Ventura River basin:description............................. 93
Vertical-integration method of measuringdischarge, description of........ 18
Victorville, Cal.Mohave River at:
description......................... 01discharge........................... 02
Vineland, Cal, wells near, fluctuation in..... 198
Wading, measurement by, view of...... 156Ward Creek near
Genesee, Cal.:description......................... 139discharge .......................... 139
Warner Creek near T?r Chester, Cal.:
description.........................discharge...........................
Water supply, surface, papers on, list of....Wells, location of, map showing............Waterman Canyon Creek near-
Arrowhead Springs, Cal.:description.........................discharge...........................
Weir method of measuring discharge, de scription of..................... 1
West Twin Creek near Arrowhead Springs, Cal.:
description.........................discharge...........................
Wheatland, Cal.Bear River abcve:
description.........................discharge...........................discharge, monthly.................gage heights........................rating table.........................
Whittier, Cal., well-* near, fluctuation in....Williamson River near
Klamath Agency, Oreg.:.description..........................discharge...........................
Willow Creek at ard near Brownell, Cal.:
description..........................discharge...........................
Willow Creek near Chester, Cal.:
description... ......................\discharge...........................
Winchester, Cal., wells near, fluctuation in.. Winters, Cal.:
Puta Creek at:description. ........................discharge...........................discharge, daily.....................discharge, monthly.................gage heights........................
Wolf Creek near- Greenville, Cal.:
description..........................discharge...........................
Wood River near- Fort Klamath, Oreg.:
description.........................discharge...........................
Yolo, Cal.Cache Creek near:
description. ........discharge...........discharge, monthly.gage heights........rating tabl3.........
Yosemite Valley, Cal. Merced River ii:
description.........discharge..........gage heights........

INDEX. 219
Yosemitc Valley, Cal.- Continued. l':ip'. Tonayn Creek in:
description.......... ...... ....... 163dischargo........................ .. 103gage heights..................... 1(13-164
Yosemite Creek in:description.......................... 102discharge........................... 162gage heights........................ 163
Yuba River, near Smartsville, Cal.:
description.......................... 141discharge........................... 142discharge, daily..................... 143discharge, monthly................. 143gage heights........................ 142
Yuba River basin:description..................... ...... 140-141
Yunia, Ariz.Colorado River at:
description..........................discharge...........................discharge, daily.... ......... ......discharge, monthly.................gage heights........................
Colorado Valley Pumping and Irriga tion Company's canal at:
description.......... ..............Fanners canal near:
description..........................discharge...........................
Ludy canal near:description..........................discharge...........................
Page.
2(5-272829
27-28


CLASSIFICATION OF THE PUBLICATIONS OF THE UNITED STATES GEOLOGICALSURVEY.
[Water-Supply Paper No. 213.]
The publications of the United States Geological Survey consist of (1) Annual Reports; (2) Monographs; (3) Professional Papers; (4) Bulletins; (5) Mineral Resources; (6) Water-Supply and Irrigation Papers; (7) Topographic Atlas of United States, folios and separate sheets thereof; (8) Geologic Atlas of United States, folios thereof. The classes numbered 2, 7, and 8 are sold at cost of publication; the others are distributed free. A circular giving complete lists can be had on application.
Most of the above publications can be obtained or consulted in the following ways:1. A limited number are delivered to the Director of the Survey, from whom they
can be obtained, free of charge (except classes 2, 7, and 8), on application.2. A certain number are delivered to Senators and Representatives in Congress for
distribution.3. Other copies are deposited with the Superintendent of Documents, Washington,
D. C., from whom they can be had at practically cost. *4. Copies of all Government publications are furnished to the principal public
libraries in the large cities throughout the United States, where they can be consulted by those interested.
The Professional Papers, Bulletins, and Water-Supply Papers treat of a variety of subjects, and the total number issued is large. They have therefore been classified into the following series: A, Economic geology; B, Descriptive geo'ogy; C, System atic geology and paleontology; D, Petrography and mineralogy; E, Chemistry and physics; F, Geography; G, Miscellaneous; H, Forestry; I, Irrigation; J, Water stor age; K, Pumping water; L, Quality of water; M, General hydrog^aphic investiga tions; ]£, Water power; O, Underground waters; P, Hydrographic progress reports; Q, Fuels; R, Structural materials.
Series P. The hyclrographic progress reports contain the results of stream measurements. A report is issued for every calendar year, containing the results of data collected during that year. These reports were first published as a part of the Director's annual report or as a bulletin; they are now published as water-supply and irrigation papers. The following is a list, by years, of the publications containing the progress reports oi stream measurements (*means out of stock). A detailed index of these reports (1888-1903) is published as Water-Supply Paper No. 119.
1888. Tenth Annual Report, Part II*.1889. Eleventh Annual Report, Part II*1890. Twelfth Annual Report, Part II*.1891. Thirteenth Annual Report, Part III*.1892. Fourteenth Annual Report, Part II*.1893. Bulletin No. 131*.1894. Bulletin No. 131*; Sixteenth Annual Report, Part II*.1895. Bulletin No. 140*.1896. Water-Supply Paper No. 11*; Eighteenth Annual Report, Part IV*.1897. Water-Supply Papers Nos. 15* and 16*, Nineteenth nnual Report, Par*, IV*.1898. Water-Supply Papers Noa. 27* and 28*. Twentieth Annual Report, Part IV*.1899. Water-Supply Papers Nos. 35*, 36*, 37*, 38*, and 39*, Twenty-first Annral Report, Part IV*.1900. Water-Supply Papers Nos. 47, 48, 49, 50, 51, and 52; Twenty-second Annual Report, Part IV.1901. East of Mississippi River. Water-Supply Papers Nos. 65* and 75*.
West of Mississippi River, Water-Supply Papers Nos. 66 and 75*.

II SEKIES LIST.
I'M-'. East of Mississippi River, Water-Supply Papers Nos. 82 and 83. West of Mississippi River, Water-Supply Papers Nos. 84 and ?5.
1903. East of Mississippi River, Water-Supply Papers Nos. 97 and 98 West of Mississippi River, Water-Supply Papers Nos. 99 and 100.
1904. East of Mississippi River, Water-Supply Papers Nos. 124, 125, 126, 127, 128, and 129. West of Mississippi River, Water-Supply Papers Nos. 130, 131, 132, 133, 134, and 135.
1905. East of Mississippi River, Water-Supply Papers Nos. 165*, 166*, 167, 168*, 169, 170, and 17 West of Mississippi River, Water-Supply Papers Nos. 171,172*, 173*, 174,175*, 170,177, am
1906. East of Mississippi River, Water-Supply Papers Nos. 201, 202 203, 204, 205, 206, and 207. West of Mississippi River. Water-Supply Papers Nos. 207, 208 209, 210, 211. 212, 213, and
Correspondence should he addressed toTHE DIRECTOR,
UNITED STATES GEOLOGICAL SURVEY,WASHINGTON, IX
OCTOBER, 1907.
o


WA
TE
R-S
UP
PL
Y P
AP
ER
NO
. 213
PL.
|
MA
P
OF
U
NIT
ED
S
TA
TE
S
OF
P
RIN
CIP
AL
R
IVE
R
ST
AT
ION
S