
The Surface Water Supply Index: Formulation and · PDF fileThe Surface Water Supply Index:...
31
The Surface Water Supply Index: Formulation and Issues David C. Garen, Ph.D. United States Department of Agriculture Natural Resources Conservation Service National Water and Climate Center Portland, Oregon, USA Remote presentation for World Meteorological Organization workshop on hydrological drought indices Geneva, Switzerland September 2011 1
-
Upload
nguyenkien -
Category
Documents
-
view
220 -
download
1
Transcript of The Surface Water Supply Index: Formulation and · PDF fileThe Surface Water Supply Index:...

The Surface Water Supply Index:Formulation and Issues
David C. Garen, Ph.D.
United States Department of AgricultureNatural Resources Conservation Service
National Water and Climate CenterPortland, Oregon, USA
Remote presentation forWorld Meteorological Organization workshop on hydrological drought indices
Geneva, SwitzerlandSeptember 2011 1

Snow Survey andWater Supply Forecasting Program
• Data collection• Water supply forecasts• Climate services
2

SNOTEL Network
Currently over 800 sitesin 13 western states
http://www.wcc.nrcs.usda.gov/snow
3

Water Supply Forecasting
• Seasonal streamflowvolume
• Published January through June
• Cooperative effort with National Weather Service
• Over 700 forecast points in western US
4

Purpose of SWSI• Original purpose: "... be an indicator of basinwide water
availability..., be predictive, and permit comparison of water supply conditions between basins..." (Shafer and Dezman, 1982)
• Used where Palmer Drought Index does not adequately reflect conditions in snow-dominated regions
• Used where primary source of agricultural water supply for irrigation is surface water
• Used as monitoring and triggering index for state drought plans (e.g., Colorado: http://cwcb.state.co.us/water-management/drought/Pages/StateDroughtPlanning.aspx)
5

History of SWSI
• Originally developed in early 1980s in Colorado (Shafer and Dezman, 1982)
• Original formulation, with variations, also adopted in Montana and Oregon
• Procedure reviewed by NRCS in cooperation with Colorado Climate Center in early 1990s
• Revised formulation based on streamflow volume forecasts published by Garen (1993)
• New formulation, with variations, adopted in Idaho, New Mexico, Montana, Colorado
6

Original Formulation
• Based on probability distributions of monthly time series of individual component indices
• Rescaled weighted sum of non-exceedance probabilities (in percent) from individual components
• Ranges from -4.2 to +4.2 (to have similar values as the Palmer index)
• Weights determined subjectively or from normalizing procedure but not optimized to predict a certain variable
1250−+++
= resvstrmprecsnow dPcPbPaPSWSI
7
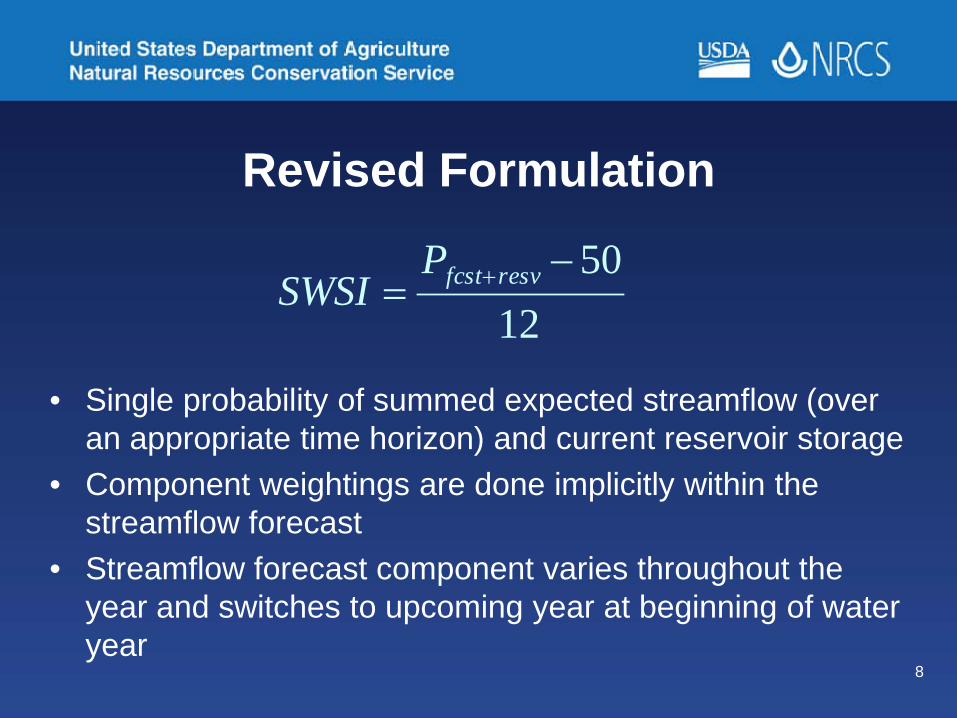
Revised Formulation
• Single probability of summed expected streamflow (over an appropriate time horizon) and current reservoir storage
• Component weightings are done implicitly within the streamflow forecast
• Streamflow forecast component varies throughout the year and switches to upcoming year at beginning of water year
1250−
= +resvfcstPSWSI
8

Display of SWSI
NRCS state offices display the SWSI in different ways -- as tables, graphs, maps -- for example:Montana:http://nris.mt.gov/NRCS/swsi/Monthly.aspIdaho:http://www.id.nrcs.usda.gov/snow/watersupply/swsi-main.htmlOregon:http://www.or.nrcs.usda.gov/snow/watersupply/swsi.html
9
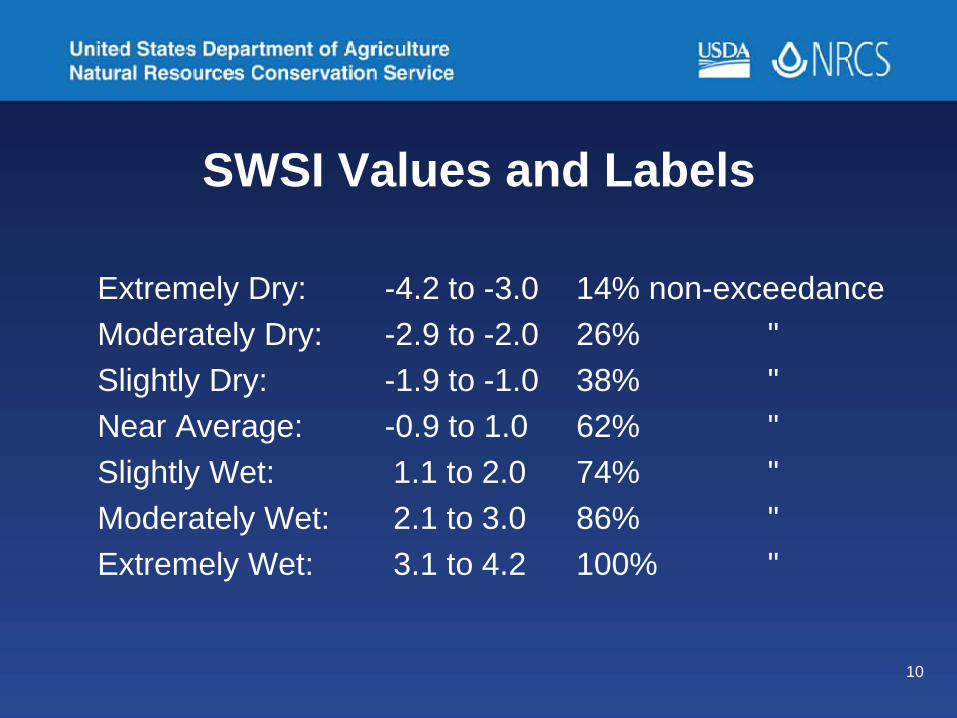
SWSI Values and Labels
Extremely Dry: -4.2 to -3.0 14% non-exceedanceModerately Dry: -2.9 to -2.0 26% "Slightly Dry: -1.9 to -1.0 38% "Near Average: -0.9 to 1.0 62% "Slightly Wet: 1.1 to 2.0 74% "Moderately Wet: 2.1 to 3.0 86% "Extremely Wet: 3.1 to 4.2 100% "
10

Tabular Display of SWSI -- MontanaMontana April 2011 SWSI Values:
Marias River above Tiber Reservoir 1.2Tobacco River 2.4Kootenai River below Libby Dam 2.6Fisher River 2.1Yaak River 1.3North Fork Flathead River 2.5etc.
11

Tabular Display of SWSI -- Idaho
12

Map Display of SWSI -- Montana
April 2007
April 2011
13

Map Display of SWSI -- Oregon
14

Graph of SWSI Input Data -- Idaho
15

SWSI Issues
• Criterion variable• Statistical formulation• "Forecast" vs. "current conditions"• Seasonal or year-around• Numerical behavior• Reservoir storage• Individual components vs.
combined variable
16

Criterion Variable DefinitionsJanuary Apr-Sep fcst + Res Apr-Sep fcst + ResFebruary Apr-Sep fcst + Res Apr-Sep fcst + ResMarch Apr-Sep fcst + Res Apr-Sep fcst + ResApril Apr-Sep fcst + Res Apr-Sep fcst + ResMay May-Sep fcst + Res May-Sep fcst + ResJune Jun-Sep fcst + Res Jun-Sep fcst + ResJuly Jul-Sep fcst + Res ResAugust Aug-Sep fcst + Res ResSeptember Sep fcst + Res ResOctober Apr-Sep fcst + Res ResNovember Apr-Sep fcst + Res ResDecember Apr-Sep fcst + Res Res 17

Criterion Variable Issues
• Do we need an explicit definition of "surface water supply"? That is, do we know what we mean by this term?
• Do the changes in the criterion variable as the year progresses make sense?
• Is it necessary that the same criterion variable be used throughout the region or country?
18

Original Formulation Issues
• Weights determined subjectively or from normalizing procedure but not optimized to predict a certain variable
• Probability properties not maintained• No explicit criterion variable• Discontinuity when snow enters and leaves
1250−+++
= resvstrmprecsnow dPcPbPaPSWSI
19

Revised Formulation Issues
• Dependent on streamflow forecasts• Requires unofficial forecasts or redefinition of criterion
variable during non-forecast season (July-December) to compute year-around
• Discontinuities when criterion variable changes, such as summer and at beginning of water year
1250−
= +resvfcstPSWSI
20

"Forecast" vs. "Current Conditions"
• What does "current conditions" mean with respect to surface water supply?
• Snowpack has an inherent lag therefore is implicitly predictive
• Three of the four components are typical predictor variables for streamflow forecasts
• Does previous month's or current streamflow mean anything?
• Diagnostic components vs. prognostic forecast
21

Seasonal vs. Year-Around
• What does "surface water supply" mean at each time of the year? This determines the criterion variable.
• Should we make unofficial forecasts during the summer and fall, or should we redefine the criterion variable?
22

Numerical Behavior Issues• Statistical properties -- distribution of index in general
and seasonally• Forecast-based SWSI will not reach extreme values if
streamflow forecast is highly uncertain• Discontinuities: original SWSI when snow enters and
leaves; revised SWSI at new water year and during summer months
• Setting of trigger levels -- should be based on frequency of occurrence
• Large changes in SWSI can result from small volume changes for low-variance distributions 23

Numerical Behavior Issues (cont.)• Expression as rescaled non-exceedance probability,
number of standard deviations, or non-exceedance probability itself (i.e., is frequency information inherent or obscured in index value?)
• Should SWSI formula denominator be 10 instead of 12 so that the range is -5 to +5, and the frequency of the value is transparent? (e.g., -3.0 → 20% non-exceedance probability)
• Should SPI be rescaled to do the same?• People think linearly, even if index is nonlinear
24

Reservoir Storage Issues• Large vs. small• Newer reservoirs with short period of record• Changing management over the years• Can we even apply a probability-based index to
reservoirs?• Reservoir purpose -- some are not for "water supply"
(e.g., flood control)
25

Mathematical Alternatives• Specific criterion variable vs. vaguer wet/dry index• Multivariate probability distribution• Principal components analysis• Combined variable vs. separate components
26

Separate Component Indices
Feb 1974 Apr 1977 Jan 1988
Snowpack 2.9 -3.2 -3.9
Precipitation 2.7 -4.0 -3.6
Ant. streamflow 2.8 -3.5 -3.9
Reservoir 1.4 0.0 -3.7
Fcst. streamflow 3.6 -3.5 -3.1
SWSI 3.7 -3.4 -3.4 27

General Index Issues• Combining very different and noncommensurate
variables is highly problematic• Need a clearly defined quantity to be indexed (e.g., SPI)• Numerical behavior and statistical properties of index
need to be clear and well-understood• Meaning of index needs to be clear• Needs to be a well-conceived rationale for connecting
specific values of index to decisions and responses (e.g., taking into account frequencies of occurrence, etc.)
28

Final Remarks• Many questions, many issues, many discussions over
the years -- some things have been clarified, and some things are still unclear and unresolved, or at least no general consensus has been reached
• Sometimes there is a mismatch between (naïve?) expectations and technical realities of an index's behavior
• How much understanding should we expect of people for them to use a drought index appropriately?
29

References
Garen, D. C. (1993). Revised surface water supply index for western United States. Journal of Water Resources Planning and Management, 119(4):437-454.
Shafer, B. A. and L. E. Dezman (1982). Development of a surface water supply index (SWSI) to assess the severity of drought conditions in snowpack runoff areas. Proceedings of the Western Snow Conference, 164-175.
30

Conclusion
Questions?Comments?
31


