THE SUPPLY CHAIN OF COCONUT PRODUCTS IN THE...
40
THE SUPPLY CHAIN OF COCONUT PRODUCTS IN THE PHILIPPINES IN SUPPORT OF GLOBAL SUSTAINABILITY OF THE COCONUT INDUSTRY 46 th APCC COCOTECH Meeting Colombo, Sri Lanka July 7-11, 2014
Transcript of THE SUPPLY CHAIN OF COCONUT PRODUCTS IN THE...

THE SUPPLY CHAIN OF
COCONUT PRODUCTS
IN THE PHILIPPINES
IN SUPPORT OF GLOBAL
SUSTAINABILITY OF THE
COCONUT INDUSTRY
46th APCC COCOTECH Meeting
Colombo, Sri Lanka
July 7-11, 2014

OUTLINE
The Philippine coconut industry in a nutshell
The Philippine Coconut Supply Chain
- Coconut Husk
- Coconut Shell
- Coconut Water
- Coconut Meat
Outlook
Closing Statement

PH COCO EXPORT EARNINGS (In Million US$)
Commodity 2009 2010 2011 2012 2013
Coconut Oil 588 1,257 1,408 992 974
Desiccated Coconut 146 153 287 200 181
Copra Meal 48 78 59 115 144
Oleochemicals 13 17 35 17 13
Copra Nil Nil Nil Nil Nil
TOTAL MAJOR 794 1,506 1,790 1,325 1,313
Coco Shell products 37 51 47 96 102
Non-traditional 53 72 121 124 104
GRAND TOTAL 884 1,627 1,957 1,544 1,518
Source of basic data: Philippine Coconut Authority

TOP TEN AGRICULTURAL EXPORTS January to December 2013P
(Quantity in ‘000 MT, FOB Value in Million US$)
ITEM QUANTITY FOB VALUE
1. Coconut oil (Crude and refined) 962 951
2. Banana, Fresh 2,877 912
3. Tuna 50 665
4. Pineapples and Pineapple products 699 417
5. Centrifugal Sugar 297 250
6. Tobacco Manufactured 7 240
7. Copra Oil Cake 409 240
8. Seaweeds and Carageenan 23 230
9. Desiccated Coconut 33 181
10. Shrimps and Prawns 16 140
TOTAL 5,373 4,225
Source: National Statistics Office

PHILIPPINE COCONUT SITUATION
HECTARAGE
In ‘000 Hectares
BEARING TREES
Population (In Million)
NUT HARVEST
In Million Nuts
2011 2012 %
Share 2011 2012
%
Share 2011 2012
%
Share
LUZON 1,134 1,142 32.0 100 106 30.8 3,617 3,717 23.4
S. Tagalog & Bicol 1,084 1,092 30.6 94 100 29.1 3,305 3,403 21.4
Rest of Luzon 50 50 1.4 5 5 1.4 312 314 2.0
VISAYAS 667 669 18.7 69 69 20.0 2,668 2,700 17.0
MINDANAO 1,761 1,763 49.3 172 170 49.4 8,959 9,444 59.5
PHILIPPINES 3,562 3,574 100.0 340 344 100.0 15,245 15,862 100.0
Source of basic data: Bureau of Agricultural Statistics

PHILIPPINE COCONUT PRODUCTION
0 500 1,000 1,500 2,000 2,500 3,000
2009
2010
2011
2012
2013
2014f
Year
In '000 MT
f Forecast Sources of basic data: Philippine Coconut Authority
Industry reports to UCAP Research

PH PROCESSING CAPACITY
Source of basic data: Philippine Coconut Authority
No. of
Mills/Plants Annual Capacity
Oilmilling 69 4.826 Million MT Copra
Refining 43 1.642 Million MT RB/RBD Oil
Desiccated Coconut 11 198,479 MT DCN product
Activated Carbon 11 101,075 MT
Oleochemicals 13 645,360 MT output of various
chemicals
Coco Biodiesel 9 422,600 MT output

MARKETING CHANNELS OF COCONUT PRODUCTS
Nuts1/
Gathered
15.862 B
Number of
Trees1/
344 M*
Hectarage
3.574 M
Value of
Production
88.8 B
Copra
Husked Nuts
Coco Shell
Husk
Water
GROWERS PROCESSORS MARKETS
Oil Millers
Coco Chemicals /
Biodiesel
Desiccated Coconut
VCO / Coco Milk
Coco Shell Charcoal /
Coco Shell Powder /
Activated Carbon
Coir
Processors
Foreign
Market
62.45%
Domestic
Market
37.55%
UNITED STATES
Coconut Oil Grated Coconut Meat
Desiccated Coconut Bukayo
Coconut Coir Coconut Vinegar
Coconut Shell Charcoal Makapuno
Activated Carbon Frozen Coco Meat
Oleochemicals Coconut Flour
Coconut Water Coco Handicrafts
Virgin Coconut Oil
EUROPE
Copra Oleochemicals
Coconut Oil Coconut Water
Desiccated Coconut Hydrogenated CNO
Coconut Coir Virgin Coconut Oil
Coconut Shell Charcoal Coco Handicrafts
KOREA
Copra Coconut Coir
Desiccated Coconut Coco Shell Powder
Copra Meal Coconut Flour
Activated Carbon
CHINA
Coconut Oil Oleochemicals
Coconut Shell Charcoal Acid Oil
Desiccated Coconut Fresh Coconut
Glycerin Coco Handicrafts
JAPAN
Coconut Oil Glycerin
Coco Chemicals Coco Milk Powder
Coco Shell Charcoal Liquid Coco Milk
Activated Carbon Nata de Coco
OTHERS
Copra Alkanolamide
Coconut Oil Grated Coco Meat
Copra Meal Nata de Coco
Desiccated Coconut Coconut Chips
Coconut Coir Coconut Flour
Coconut Shell Charcoal Coconut Water
Fresh Coconut Shampoo
Activated Carbon Oleochemicals
Sources of basic data: Bureau of Agricultural Statistics
Philippine Coconut Authority
PRIMARY PRODUCTS
DOMESTIC CONSUMPTION
Processed Oil
Edible and Inedible
Copra Meal
Desiccated Coconut
Coconut Coir
Coco Shell Charcoal
Fresh Coconut
Foodnuts
Home-made Oil
Oleochemicals
1/ Figures as of 2012
* Bearing trees only
M Million
B Billion

I. HUSK SECTION
FARMERS PROCESSORS MARKETERS CONSUMERS
Domestic
Export
China
Korea
Taiwan
Singapore
Japan
USA
United Kingdom
Baled Coir
Peat
Net
Twine
Pads/Liners
Doormats
Whole nuts Husk

EXPORT OF COIR AND COIR PRODUCTS (Average 2009-2013)
Source of basic data: Philippine Coconut Authority
Products Volume
(MT)
Value
(USD Million
FOB)
Unit Price
(USD/MT FOB)
Baled coir 9,282 2.837 305.65
Coir twine 1,016 1.754 1,728.08
Pads/liners 16 0.021 1,312.15
Coir net 19 0.044 2,315.79
Coco peat 2,445 0.572 233.95
Doormats 850* 0.002 2.35
TOTAL 12,777** 5.228
* Square meters
** Excludes doormats
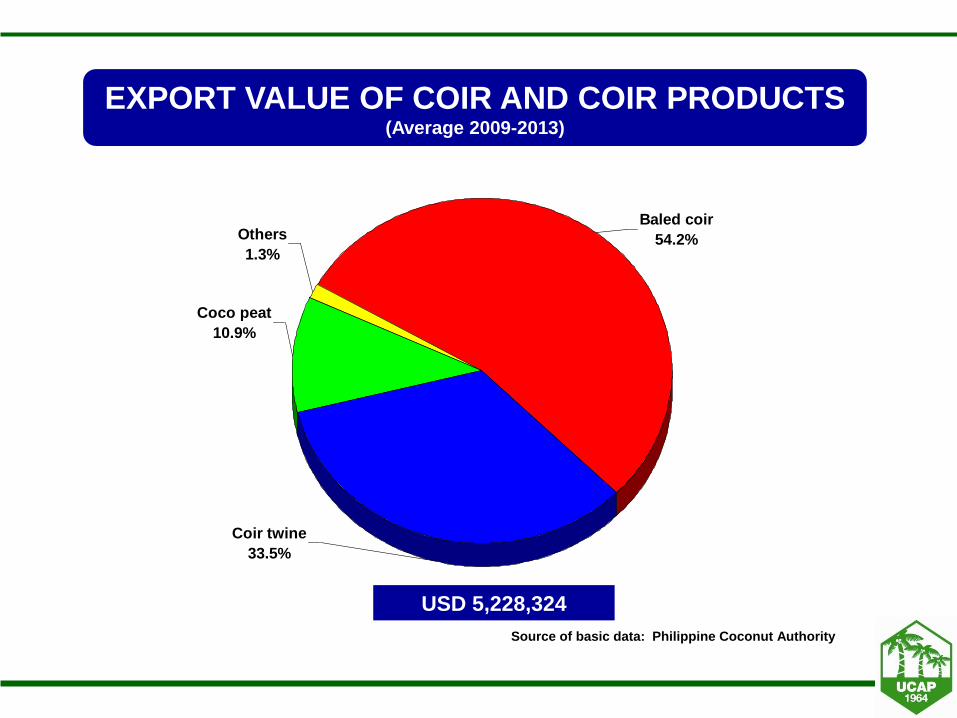
EXPORT VALUE OF COIR AND COIR PRODUCTS (Average 2009-2013)
Source of basic data: Philippine Coconut Authority
Coco peat
10.9%
Others
1.3%
Baled coir
54.2%
Coir twine
33.5%
USD 5,228,324

II. COCO SHELL SECTION
FARMERS PROCESSORS MARKETERS CONSUMERS
Domestic
Export
Japan
China
Germany
USA
Whole nuts Shell
Shell powder
Charcoal
Activated carbon
Handicrafts
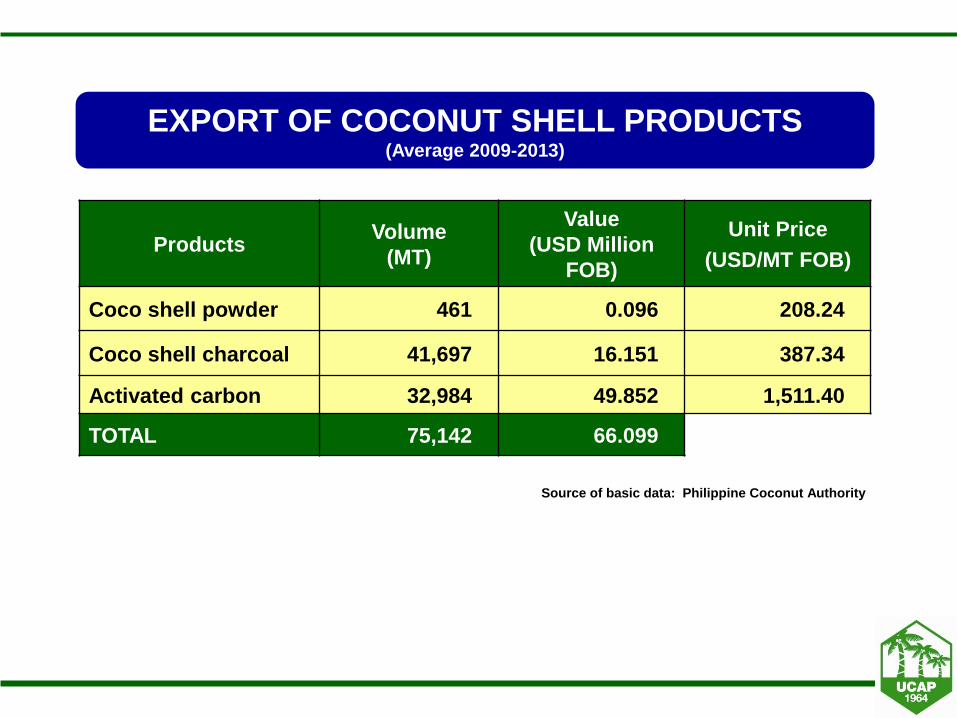
EXPORT OF COCONUT SHELL PRODUCTS (Average 2009-2013)
Source of basic data: Philippine Coconut Authority
Products Volume
(MT)
Value
(USD Million
FOB)
Unit Price
(USD/MT FOB)
Coco shell powder 461 0.096 208.24
Coco shell charcoal 41,697 16.151 387.34
Activated carbon 32,984 49.852 1,511.40
TOTAL 75,142 66.099

MAJOR DESTINATIONS OF COCO SHELL
CHARCOAL EXPORTS (Average 2009-2013)
Source of basic data: Philippine Coconut Authority
Destinations Volume
(MT)
Value
(USD Million
FOB)
Unit Price
(USD/MT FOB)
Japan 18,092 9.288 513.37
China 10,958 3.025 276.05
Korea 4,273 1.209 282.94
Others 8,374 2.629 313.95
TOTAL 41,697 16.151 387.34
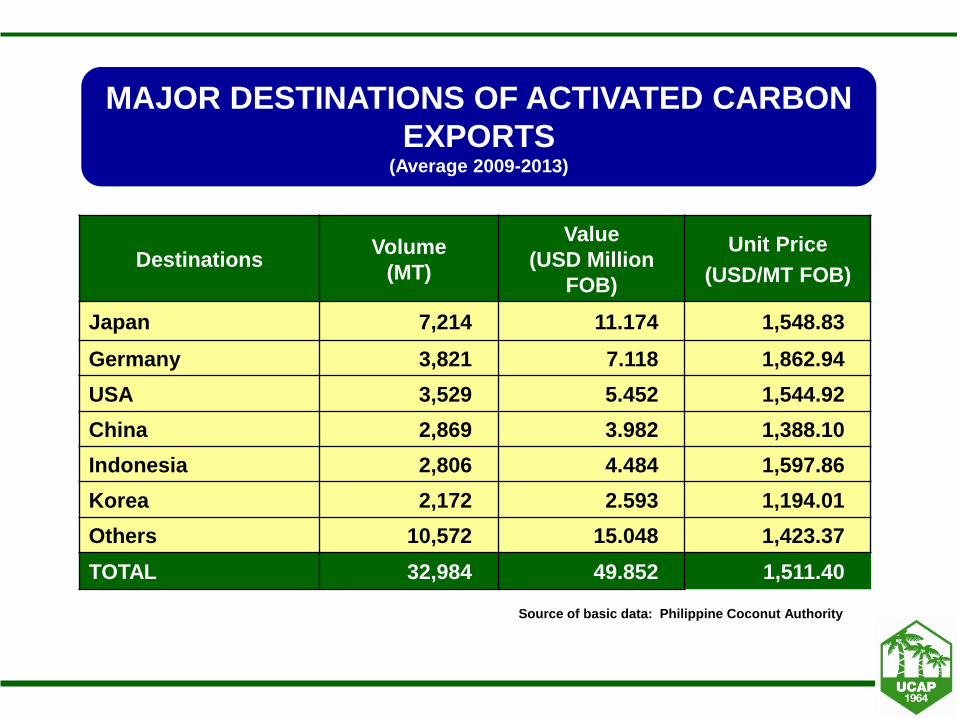
MAJOR DESTINATIONS OF ACTIVATED CARBON
EXPORTS (Average 2009-2013)
Source of basic data: Philippine Coconut Authority
Destinations Volume
(MT)
Value
(USD Million
FOB)
Unit Price
(USD/MT FOB)
Japan 7,214 11.174 1,548.83
Germany 3,821 7.118 1,862.94
USA 3,529 5.452 1,544.92
China 2,869 3.982 1,388.10
Indonesia 2,806 4.484 1,597.86
Korea 2,172 2.593 1,194.01
Others 10,572 15.048 1,423.37
TOTAL 32,984 49.852 1,511.40

EXPORT VALUE OF COCONUT SHELL
PRODUCTS (Average 2009-2013)
Source of basic data: Philippine Coconut Authority
Coco shell
charcoal
24.4%
Coco shell
powder
0.1%
Activated
carbon
75.4%
USD 66,099,057

III. COCONUT WATER SECTION
FARMERS PROCESSORS MARKETERS CONSUMERS
Domestic
Export
USA
Australia
Netherlands
Canada
Whole nuts Green nuts
Mature nuts
Coconut water
drink

MAJOR DESTINATIONS OF COCONUT WATER
EXPORTS (Average 2009-2013)
Source of basic data: Philippine Coconut Authority
Destinations Volume
(Million Liters)
Value
(USD Million
FOB)
Unit Price
(USD/MT FOB)
USA 6.768 6.357 929.27
Australia 0.505 0.532 1,053.47
Netherlands 0.428 0.429 1,002.34
Canada 0.218 0.169 775.23
Others 1.608 1.901 1,182.21
TOTAL 9.527 9.388 985.41

MAJOR DESTINATIONS OF COCONUT WATER
EXPORTS (Average 2009-2013)
Source of basic data: Philippine Coconut Authority
Others
16.9%
Australia
5.3%
USA
71.0%
Canada
2.3%
Netherlands
4.5%
9,527,357 Liters

IV-A. FRESH MEAT
FARMERS PROCESSORS MARKETERS CONSUMERS
Domestic
Export
Europe
USA
Australia
Japan
Korea
Whole nuts Husk nuts
Desiccated coconut
Virgin coconut oil
Coconut milk powder
Liquid coconut milk
Coconut flour
Nata de coco

EXPORT OF FRESH MEAT PRODUCTS (Average 2009-2013)
Source of basic data: Philippine Coconut Authority
Products Volume
(MT)
Value
(USD Million
FOB)
Unit Price
(USD/MT FOB)
Desiccated coconut 109,890 193.215 1,758.25
Fresh coconut 3,563 1.516 425.61
Nata de coco 5,376 5.410 1,004.78
Coconut milk powder 1,490 5.208 3,496.36
Liquid coconut milk 1,936 3.409 1,761.18
Coconut flour 921 1.683 1,828.43
Virgin coconut oil 4,503 17.816 3,956.37
Other food products 1,227 2.171 1,769.85
TOTAL 128,905 230.420
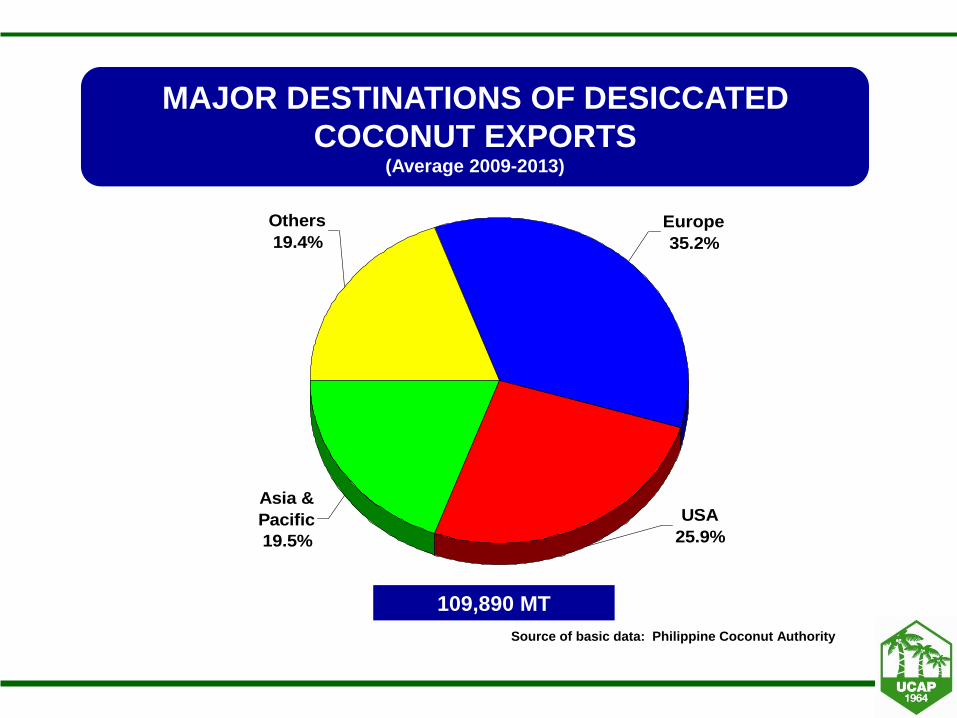
MAJOR DESTINATIONS OF DESICCATED
COCONUT EXPORTS (Average 2009-2013)
Source of basic data: Philippine Coconut Authority
USA
25.9%
Europe
35.2%
Others
19.4%
Asia &
Pacific
19.5%
109,890 MT

MAJOR DESTINATIONS OF FRESH COCONUT
EXPORTS (Average 2009-2013)
Source of basic data: Philippine Coconut Authority
Others
5.7%
China
94.3%
3,563 MT

MAJOR DESTINATIONS OF NATA DE COCO
EXPORTS (Average 2009-2013)
Source of basic data: Philippine Coconut Authority
Others
7.0%
USA
9.8%
Japan
78.8%
Canada
2.0%
Europe
2.3%
5,376 MT

MAJOR DESTINATIONS OF COCONUT MILK
POWDER EXPORTS (Average 2009-2013)
Source of basic data: Philippine Coconut Authority
Asia &
Pacific
49.3%
Europe
30.1%
Others
20.7%
1,490 MT

MAJOR DESTINATIONS OF LIQUID COCONUT
MILK EXPORTS (Average 2009-2013)
Source of basic data: Philippine Coconut Authority
Asia &
Pacific
33.6%
USA
27.2%
Others
17.3%
Europe
21.9%
1,936 MT

MAJOR DESTINATIONS OF COCONUT FLOUR
EXPORTS (Average 2009-2013)
Source of basic data: Philippine Coconut Authority
USA
21.9%
Middle East
14.7%
Others
19.5%
Asia &
Pacific
43.9%
921 MT

MAJOR DESTINATIONS OF VIRGIN COCONUT
OIL EXPORTS (Average 2009-2013)
Source of basic data: Philippine Coconut Authority
Canada
25.5%
USA
45.5%
Others
13.3%
Europe
15.7%
4,503 MT

IV. COCONUT MEAT SECTION
MARKETERS CONSUMERS
Husked nuts Copra
PROCESSOR
1 FARMERS
Coconut oil
PROCESSOR
2
RB / RBD
PROCESSOR
3
Oleochemicals /
Biodiesel
PROCESSOR
4
Copra
Coconut oil
Copra meal
RB/RBD oil
Oleochemicals
Biodiesel
Domestic
Export
Korea
Europe
Malaysia
Japan
China
USA

EXPORT OF COPRA DERIVED PRODUCTS (Average 2009-2013)
Source of basic data: Philippine Coconut Authority
Products Volume
(MT)
Value
(USD Million
FOB)
Unit Price
(USD/MT FOB)
Copra 278 0.286 1,028.84
Coconut oil 987,857 1,043.940 1,056.77
Copra meal 567,300 88.751 156.44
Oleochemicals 56,072 44.658 796.45
Acid oil 3,087 1.843 597.18
Various soaps,
shampoo 5,803 3.048 2,669.80
TOTAL 1,620,398 1,194.973

MAJOR DESTINATIONS OF COPRA EXPORTS (Average 2009-2013)
Source of basic data: Philippine Coconut Authority
Others
17.4%
Korea
82.6%
278 MT

MAJOR DESTINATIONS OF COCONUT OIL
EXPORTS (Average 2009-2013)
Source of basic data: Philippine Coconut Authority
USA
39.8%
Europe
43.6%
Others
0.9%
Asia &
Pacific
15.6%
987,857 MT
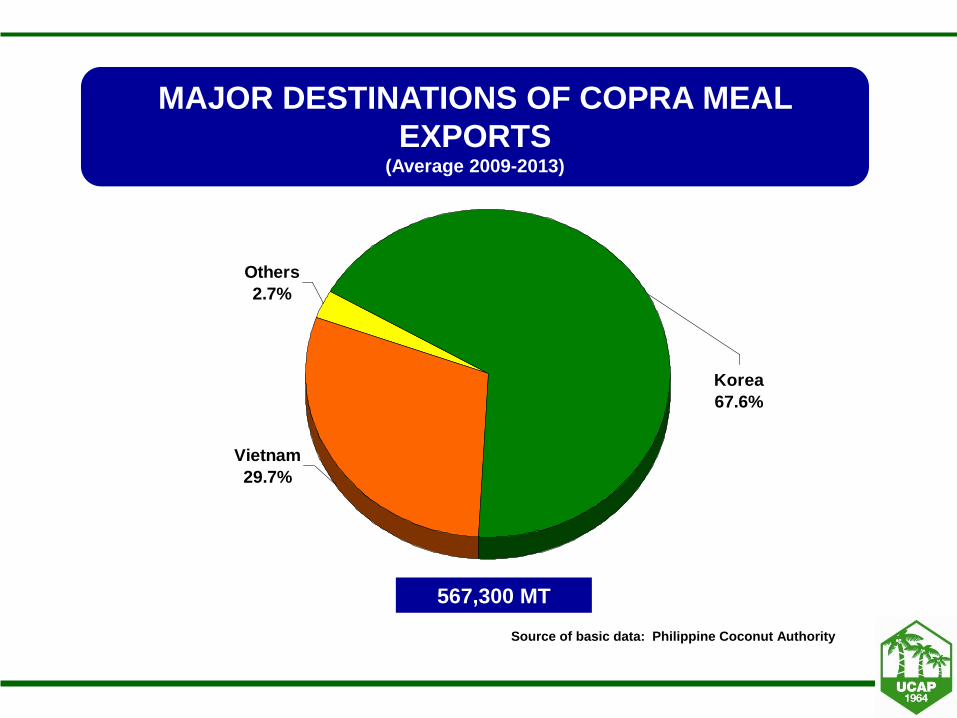
MAJOR DESTINATIONS OF COPRA MEAL
EXPORTS (Average 2009-2013)
Source of basic data: Philippine Coconut Authority
Vietnam
29.7%
Korea
67.6%
Others
2.7%
567,300 MT

MAJOR DESTINATIONS OF OLEOCHEMICALS
EXPORTS (Average 2009-2013)
Source of basic data: Philippine Coconut Authority
Europe
9.0%
USA
3.3%
Others
7.1%
Asia &
Pacific
80.7%
56,072 MT

MAJOR DESTINATIONS OF ACID OIL EXPORTS (Average 2009-2013)
Source of basic data: Philippine Coconut Authority
Pakistan
11.1%
China
85.4%
Others
3.5%
3,087 MT

MAJOR DESTINATIONS OF VARIOUS SOAPS
AND SHAMPOO EXPORTS (Average 2009-2013)
Source of basic data: Philippine Coconut Authority
Middle East
11.2%
Asia &
Pacific
81.7%
Others
3.9%
USA
3.2%
5,803 MT

OUTLOOK
Low coconut production in 2014; may bounce back
with better planting materials
Utilization of other parts of coconut taking off
- Coconut water
- Coir products
New products gaining market attention
- Virgin coconut oil
- Coco sugar
- Coco flour
- Coco biodiesel

OUTLOOK
Everything said points to demand
Sustaining demand means
- Improving yields, more harvest
- Enhance nutrition, withstand diseases, pests
- Appropriate farm practices
- Better value for products, higher farm income
CLOSING STATEMENT
Some people may admonish others to
leave coconut farming for some reasons
like the vagaries of the weather affecting
output as well as low prices at times. But
one thing is certain, our people will always
look up to coconut as a source of
livelihood because it is by far the only crop
which has never run out of market.
SALAMAT
PO
YVONNE T. V. AGUSTIN
Executive Director
United Coconut Associations of the Philippines, Inc.
www.ucap.org.ph