THE STUDY OF CONSUMER’S ATTITUDES AND...
164
THE STUDY OF CONSUMER’S ATTITUDES AND BEHAVIORS TOWARDS CARBONATE SOFT DRINKS
Transcript of THE STUDY OF CONSUMER’S ATTITUDES AND...
THE STUDY OF CONSUMER’S ATTITUDES AND BEHAVIORS TOWARDS
CARBONATE SOFT DRINKS

THE STUDY OF CONSUMER’S ATTITUDES AND BEHAVIORS TOWARDS
CARBONATE SOFT DRINKS
Arunee Nakmongkol
An Independent Study Presented to
The Graduate School of Bangkok University
In Partial Fulfillment
of the Requirements for the Degree
Master of Business Administration
2009

© 2009
Arunee Nakmongkol
All right Reserved


iv
Nakmongkol,Arunee. Master of Business Administration, June, 2009, Graduate School,
Bangkok University
The study of consumer’s attitudes and behaviors towards carbonate soft drinks (148 PP.)
Advisor of Independent Study: Dr. Paul TJ James
ABSTRACT
Thai Carbonate Soft drinks market
In Thailand, the carbonate soft drink is a huge part of the total drink market,
representing 43% of the total share of throat in the soft drink category, for a total value
of THB 109 billion.
The growth of the sector is low, estimated to 3% by the Euromonitor, in a
market dominated by only 2 key players representing between themselves 84% of
market share, namely Thai Pure Drinks Ltd (coca-cola) with 45% market share and Sern
Suk (Pepsi) with 39% market share as of 2007.
Challenges of carbonate soft drink market: new trends - products
Growing concerns over obesity, diabetes and overall evolution in health
awareness have lead to a very strong development of the health and wellness trend
amongst developed countries’ consumers. This trend is now reaching Thailand and
means a new look at the nutritional benefits of drinks, such as green tea, and a
questioning in the sugar contents of soft drinks.

v
Challenges of carbonate soft drink market: new trends – distribution
Another evolution of the Thai market over the last 5 years that has a profound
impact on the drink market overall, and the carbonate soft drink in particular, is the
revolution of the distribution, as seen by the disappearance of traditional distribution
and the new dominance of supermarkets and local convenience stores. Such an
example of this change is the massive growth of 7-Eleven, with its plans to open 500
new stores every year for the next coming years. Currently controlling over 3,500
outlets nationwide, strategically to maximize its reach of the population, and therefore
enhance consumptions opportunities, 7- Eleven is fast emerging as a key distribution
partner that is more and more able to shape manufacturers offer to fit its customers
needs.
The consequences of this situation for the soft drinks markets players are that
growth can only be gained on the competitors via new products launches and / or by
strategic control of distribution channels to reach the consumers.
As a result, the underlying key issue is that consumer behavior insight in terms
of taste and shopping patterns are vital elements of the strategy of the drink market
players.
Underlying Theory of drinking behavior
The literature review has explored the different elements that compose customer
behavior. These elements will provide a better understanding of what is meant by
customer behavior. Combined with Maslow’s hierarchy of needs, 6 key drivers for
understanding customers’ behavior and needs when analyzing their drinking habits have
been identified.
vi
The combinations of Health, Thirst, Affordability, Convenience, Imagine and
Status and Sociability will the factors that will trigger the motivation and the purchasing
process.
Gathering the research Data
The research instrument used to collect primary data for this study is a questionnaire.
The questionnaire is designed in English and translated to Thai language, the research
questions are designed according to conceptual framework for answering the main
objectives of the study.
Research Results
The Thai consumers appears to be a young male, aged 15 to 30 years old, with an
average drink consumption frequency of 2 to 3 times per week. His favorite drink is
Coke classic. He is a consumer that is highly susceptible to trying new products; he is
overall brand conscious, health conscious and price sensitive.
Going beyond this first picture, the analysis shows that there are some clear
distinction in attitudes and expectation between genders, ages and finally urban and
countryside customers.
Female consumers show the strongest interest in carbonate fruit juices, and show the
highest level of interest in low sugar drinks.
Urban consumers show the highest level of interest in lower sugar drinks, they are
less price conscious and more likely to spontaneous, unplanned purchases. They are
individual drinkers who look for refreshment.
Countryside consumers show less interest in low sugar soft drinks. Their purchases
are usually planned, and drinks are purchased for family consumption, most likely with

vii
meals. They are brand conscious and more price conscious than their urban counter
parts.
The Thai consumer is not yet as sophisticated as the global drinker presented by the
study. There is a clear division between the urban, more health conscious and more
image driven consumers and the countryside consumer, who is more brands and price
sensitive.
From the data gathered in the study, 2 trends have been identified amongst the Thai
consumers suggesting interesting opportunities for new products development. Theses
trends are carbonates fruit juices consumption and healthier lifestyle aspiration.
The carbonate soft drinks manufacturers have overall strategic opportunities in
order to keep their market share and retain customers. They start with specific branding
and communication to a longer term approach of new products development specifically
targeted at different segment of their consumers in order to answer their specific needs.
viii
ACKNOWLEDGEMENT
Special thanks to Dr.Paul TJ James, my advisor for his valuable guidance. This
independent study could not be accomplished without his support.
Also, my dear friends both at university and at work, thank you for your
encouragement and this could help me carry out this study.
Big thanks to my family .I never feel alone with your love and care. You are my
role model and my inspiration.

ix
TABLE OF CONTENTS
Page
ABSTRACT iv
ACKNOWLEDGEMENT viii
LIST OF TABLES ix
LIST OF FIGURES xii
CHAPTER 1: RESEARCH PROPOSAL 1
1.1 Background 1
1.2 Statement of problem 4
1.3 Intension and reason for study 5
1.4 Objectives of the research 5
1.5 Major research question and sub-questions 6
1.6 Research assumptions 6
1.7 Scope of the research 6
1.8 Benefit of the research 7
1.9 Limitations 7
Conclusion 8
CHAPTER 2: LITARATURE REVIEW 10
2.1 Definition and important of consumer behavior 11
2.2 Model of consumer behavior 12
2.3 Factors influences consumer behavior 14
2.4 Key Psychological Process 20
2.5 Buying decision process 28
Conclusion 31

x
TABLE OF CONTENTS (CONTINUED)
Page
CHAPTER 3: RESEARCH METHODOLOGY 33
3.1 Review research methodology 33
3.1.1 Model of research process 34
3.1.2 Determine research design 35
3.1.3 Data collection method 38
3.1.4 Data collection form 42
3.1.5 Design sample and collect data 44
3.1.6 Analyze and interpret the data 48
3.1.7 Prepare research report 50
3.2 Statement of research methods used 51
Conclusion 60
CHAPTER 4: DATA PRESENTATION 63
4.1 The results of customer’s demographic data 64
4.2 The results of consumer’s behavior toward carbonate soft drinks 68
4.3 The results of consumer’s attitude towards carbonate soft drinks 91
Conclusion 105
CHAPTER 5: DATA ANALYSIS 106
5.1 The analysis of customer’s demographic data 107
5.2 The analysis of consumer’s behavior toward carbonate soft drinks 109
5.3 The analysis of consumer’s attitude towards carbonate soft drinks 118
Conclusion 123

xi
TABLE OF CONTENTS (CONTINUED)
Page
CHAPTER 6: RECOMMENDATIONS AND CONCLUSION 125
6.1 Recommendation to carbonate soft drinks companies 127
6.2 Recommendation to 7-Eleven 131
Conclusion 133
BIBLIOGRAPHY 135
APPENDIX 137
Appendix A: English Research Questionnaire 138
Appendix B : Thai Research Questionnaire 143
Appendix C: Carbonate Soft Drinks at 7-Eleven 147
BIODATA 148
ix
LIST OF TABLES
Page
3.1 The three different types of questionnaire 43
3.2 Number of Population by location 53
3.3 Number of Sample size by location 54
3.4 Validity instrument by Cronbach 55
3.5 Statistic used of this research study 59
4.1 Number and Percentage of Respondents by Location 64
4.2 Number and Percentage of respondents by Gender 64
4.3 Number and Percentage of respondents by Gender by Location 65
4.4 Number and Percentage of respondents by Age 65
4.5 Number and Percentage of respondents by Age by Location 66
4.6 Carbonate soft drink brands ever drunk by Location 68
4.7 Carbonate soft drink brands drinking experience by Gender 70
4.8 Carbonate soft drink brands drinking experience by Age 71
4.9 Brands Drinks Most Often 72
4.10 Brands Drinks Most Often by Location 73
4.11 Brands Drinks Most Often by Gender 74
4.12 Brands Drinks Most Often by Age 75
4.13 Brands will buy next 76
4.14 Brands will buy next separate by Location 77
4.15 Brands will buy next separate by Gender 78
4.16 Brands will buy next separate by Age 79

x
LIST OF TABLES
Page
4.17 Purchase frequency separate by Location 80
4.18 Purchase frequency separate by Gender 81
4.19 Purchase frequency separate by Age 82
4.20 Time Purchase separate by Location 83
4.21 Number of people in group when shopping for carbonates soft drinks 84
Separate by Location
4.22 Planed or Unplanned purchase separate by Location 85
4.23 Planed or Unplanned purchase separate by Gender 86
4.24 Planed or Unplanned purchase separate by Age 86
4.25 Item purchase with Carbonate soft drinks separate by Location 87
4.26 Item purchase with Carbonate soft drinks separate by Gender 88
4.27 Pack size separate by Location 88
4.28 Pack size separate by Gender 89
4.29 Pack size separate by Age 89
4.30 Purchase factors considering for shopping carbonate soft drinks 91
4.31 Purchase factors considering for shopping carbonate soft drinks 92
Separate by location
4.32 Purchase factors considering for shopping carbonate soft drinks 93
Separate by Gender
4.33 Purchase factors considering for shopping carbonate soft drinks 93
Separate by Age

xi
LIST OF TABLES (CONTINUED)
Page
4.34 Consumer’s degree of agreement or disagreement towards 94
Carbonate soft drink answering the needs factors of drinking.
4.35 Consumer’s degree of agreement or disagreement towards 95
Carbonate soft drink answering the needs factors of drinking by Location
4.36 Consumer’s degree of agreement or disagreement towards 97
Carbonate soft drink answering the needs factors of drinking by Gender
4.37 Consumer’s degree of agreement or disagreement towards 98
Carbonate soft drink answering the needs factors of drinking by Age
4.38 Brands satisfaction level 99
4.39 Brands satisfaction level by Location 101
4.40 Brands satisfaction level by Gender 103
4.41 Brands satisfaction level by Age 104

xii
LIST OF FIGURES
Page
2.1 Model of consumer behavior 12
2.2 Changing Drinking Culture 15
2.3 Maslow’s hierarchy of needs. 20
2.4 Drinking and Maslow’s Hierarchy of Needs 21
2.5 Consumer Needs and Drinking Drivers 22
2.6 Five-Stage Model of the Consumer Buying Process 28
3.1 Stages in Research Process 34
3.2 Six-Step Procedures for Drawing a Sample 44
1
CHAPTER 1
INTRODUCTION
Background
Euromonitor International defines carbonates as all non-alcoholic drinks into
which carbon dioxide gas has been dissolved and therefore the drink is carbonated.
Carbonates are an aggregation of cola carbonates and non-cola carbonates, whether
regular or low calorie. Euromonitor International included both sweetened and/or
carbonates containing contain artificial sweeteners.
In 2007 volume sales of carbonate soft drinks in Thailand market was 2,276.9
million liters, a growth of 3%, while value sales was THB 109,551.2 million. Within
soft drinks category, carbonate soft drink has gained the highest share of throat in
both volume with 43% and value share and 57%. (Euromonitor International, Internet
2009)
7-Eleven
7-Elven is a big selling arm of carbonate soft drinks.7-Eleven is leading in
convenience store with 3,400 outlets nationwide. Primarily located on strategic
corners within central shopping and business districts and gas station (PTT).The 24-
hour a day outlets have gained popularity among children, teenagers and the working
population.7-Elven is very aggressive for the stores expansion ,there are 500 new
branches opening a years in average.
7-Eleven provided a wide range of carbonate soft drinks products with various
pack size in 16 brands. Includes Coke, Coke Zero, Coke Light, Sprite, Fanta Orange,

2
Fanta Salaberry, Fanta Strawberry, Pepsi, Pepsi Twist, Pepsi Max, Pepsi Green,
Mirinda Orange, Mirinda Lemonade, Calpico Soda and A&W rootbeer.
Local Key players of Soft Drinks Market
Thai Pure Drinks Ltd (Coca-Cola) is the sector's leading player follow by
Serm Suk (Pepsi) However, it must be said that Pepsi is actually the leading cola
carbonates brand as Thai consumers prefer its taste to that of Coca-Cola. Moreover,
aggressive and continuous marketing from Pepsi has supported the positive
performance of its products. Low-calorie cola carbonates registered the strongest
growth in off-trade volume terms in 2007. Thai consumers tend to be more
accustomed to the cola flavor rather than other carbonates flavors. These factors
supported the strong performance of low-calorie cola carbonates as the products
offering the preferred flavor as well as being healthier
As a result, low-calorie carbonates are gaining share of overall carbonates
sales. Pepsi Max from Serm Suk was introduced into the local marketplace, followed
by Coca-Cola Light from Thai Pure Drinks Ltd. Due to the growing health awareness
trend; these were followed by the launch of Coca-Cola Zero, offering consumers the
traditional Coke taste but with 0% sugar.
Finally, there is a newcomer from Peru entering the sector, namely AJE (Thai)
Co Ltd, a subsidiary of Peruvian beverage manufacturer AjeGroup. The company
introduced the AJE Big Cola brand, a cola carbonate positioned in the economy
segment in a large sized pack. (Euromonitor International, Internet 2009)
3
Health trends
The new generation of young men and women aged between 20–29 is the key
target group for carbonates. Different packaging types are available for different
consumption occasions. For example, carbonates in glass bottles are chiefly offered in
pubs/bars and restaurants etc. while various types and sizes of bottles and metal cans
are primarily available in off-trade outlets (convenience stores, supermarket
/hypermarket) for consumers to drink anywhere.
The health awareness trend has been growing in Thailand and has
subsequently been impacting the soft drinks segment, including carbonates. In the
meanwhile, Low-calorie and sugar-free carbonates are gaining in popularity, as shown
by the launch of Coca-Cola Zero from Thai Pure Drinks Ltd in 2007. The 'Think
Health' concept has led product innovation towards the low-calorie category, which is
being well received by consumers. Prior to the launch of Coca-Cola Zero, there were
already a few products in the marketplace with a health angle, such as Pepsi Max and
Coca-Cola Light. However, the launch of Coca-Cola Zero marked a new level in the
push towards healthier carbonates.
Even though carbonates offer refreshment, consumers tend to pay more
attention to their health and increasingly are staying away from unhealthy foods and
drinks like carbonates, which contain a high percentage of sugar.
Most carbonates available in Thailand are priced as standard products.
However low-calorie cola and specialty regular cola carbonates are priced slightly
higher. Private label carbonates are not particularly popular among Thai consumers.
However, private label saw a slight increase in volume. With the continuous

4
expansion of supermarket /hypermarket outlets, private label carbonates are now more
accessible.
Drinking is another way of being accepted as a grown-up in Thai society when
it comes to business meetings, celebration parties or private meetings. Many drink
beer with colleagues or friends after work. However, since the Thai government
imposed high taxes on alcoholic beverages and launched its 'Don't Drive Drunk'
campaign, Thais tend to think more before drinking, especially drivers.
Many Thais are addicted to coffee and tea, as seen by the number of cafés
widely spreading in Bangkok, its expanding other big cities. When traveling, Thais
people enjoy buying refrigerated soft drinks as well as hot and cold drinks from
vending machines in the convenience stores of almost all gas stations nationwide.
(Euromonitor International, Internet 2009)
Statement of problem
Health and wellness trend is booming both in Global and Thailand markets.
As Thai consumers are becoming more and more educated, they are showing more
concerns about their health. This can be judged from the abundance of fitness outlets
and availability of healthy products (food and drinks) in both traditional trade and
modern trade channels. Carbonate soft drink is one of best selling beverage item in
Thailand but tend to be cannibalized by bottled water and other low sugar soft drinks.
Carbonates soft drinks companies have launched low calories and low sugar product
lines in line with the healthy trend and also to cover sales loses from their standard
formula. But expanding product line in low sugar format may be not enough since
100% fruit juice and products made from fresh and natural ingredient have been

5
strongly welcomed by the consumers, as proved by aggressive growth reported by
Euromonitor. Unlike fresh juice and Tea, there no nutrition benefits to be found in
Carbonate soft drinks.
Thais consumers have so many drinks choices as seen by the wide ranges of
beverage offering in ready to drink format, found in convenience store, gas-station,
supermarket and other shopping places. Furthermore, modern and local coffee shops
are spreading widely, especially in Bangkok. Theses coffee shops are developing on
the health trend the Thai consumers are looking for. This means carbonates will need
to fight very hard in order to keep their share of throats.
Despite the pressure of the healthy trend and competitors challenges, there still
have good news for carbonate soft drinks companies. The outlets of supermarket and
convenience stores are expanding aggressively; especially 7-Eleven.There are
approximately 500 new stores opening every year. With long hours of operation with
24 hours, its mean an opportunity for carbonate soft drinks to be sold out also.
Intention and Reason for Study
The problems and opportunities discussed above have interested the researcher
to study this topic. Successful organizations will require extensive information on
consumer behavior.
Research Objectives
The objectives of this research study are identified as follows.
1. To study consumer’s behavior towards carbonate soft drinks at 7-Eleven
2. To study consumer’s attitude towards carbonate soft drinks.

6
Major Research Questions: Sub-question development
Major research question
1. What are the factors and the implication of consumer behavior towards
carbonate soft drinks at 7-Eleven?
Sub research questions
2. What factor has most influential on the purchase decision when shopping for a
carbonate soft drinks?
3. What is the consumer’s attitude towards carbonate soft drinks answering the
need factors of drinking?
4. What are satisfaction levels of consumers towards carbonate soft drinks brands?
Research Assumptions
1. This research can explain whether the demographic factors such as age and sex
and locations would affect consumer’s attitudes and behaviors towards
carbonate soft drinks.
2. The statistical method and techniques for collecting the data is were valid only
for this research study.
3. The data which will be collected and analyzed is appropriate and valid for this
research design.
Scope of the Research
This research study is investigating the customers on their attitude toward
carbonate soft drinks and their behavior regarding this product category at 7-Eleven.

7
Benefit of the Research
There are 3 groups getting benefit by this research study.
Firstly, Carbonate soft drinks companies will have more understanding about
consumer behavior who visits and buy food/drinks at 7-Eleven.The consumer insight
will help for future develop marketing mix of it product in 7-Eleven.
Secondly 7-Eleven will benefit by being able to present the customer’s
relevant products mix provided by carbonate soft drinks companies, and therefore
improve their category management.
Lastly, the researcher will receive benefit, as this research study is enhancing
her skills on how such research is conducted.
Limitation of the Research
Due to the time constraint and the limitation in the number of people who
conduct the field sampling, this research study is limiting field sampling to three
locations only, despite the fact that 7-Eleven have more than 3,000 branches
nationwide.
Conclusion
In Thailand, the carbonate soft drink is a huge part of the total drink market,
representing 43% of the total share of throat in the soft drink category, for a total
value of THB 109 billion. The growth of the sector is low, estimated to 3% by the
Euromonitor, in a market dominated by only 2 key players representing between
themselves 84% of market share, namely Thai Pure Drinks Ltd (coca-cola) with 45%
market share and Serm Suk (Pepsi) with 39% market share as of 2007.

8
Recently, new developments have emerged in the Thai market, affecting both
key areas of consumers’ expectations and distribution.
The growing concerns over obesity, diabetes and overall evolution in health
awareness have lead to a very strong development of the health and wellness trend
amongst developed countries’ consumers. This trend is now reaching Thailand and
means a new look at the nutritional benefits of drinks, such as green tea, and a
questioning in the sugar contents of soft drinks. Pepsi answered first this trend by
launching Pepsi Max, followed in 2008 by Coke with Coke Zero. However,
consumers disaffection for carbonate soft drinks would lead to a growing demand on
other category and a decline in share of throat that would need to either be accepted,
or compensated by the launch of other products in more healthy categories.
Another evolution of the Thai market over the last 5 years that has a profound
impact on the drink market overall, and the carbonate soft drink in particular, is the
revolution of the distribution, as seen by the disappearance of traditional distribution
and the new dominance of supermarkets and local convenience stores. Such an
example of this change is the massive growth of 7-Eleven, with its plans to open 500
new stores every year for the next coming years. Currently controlling over 3,500
outlets nationwide, strategically to maximize its reach of the population, and therefore
enhance consumptions opportunities, 7- Eleven is fast emerging as a key distribution
partner that is more and more able to shape manufacturers offer to fit its customers
needs.
The consequences of this situation for the soft drinks markets players are that
growth can only be gained on the competitors via new products launches and / or by
strategic control of distribution channels to reach the consumers.

9
As a result, the underlying key issue is that consumer behavior insight in terms
of taste and shopping patterns are vital elements of the strategy of the drink market
players.
By focusing on selected stores in both Bangkok and upcountry, by gathering
insight from carbonate soft drinks consumers, this study aims at bringing a new
insight to the Thai soft drink market by finding what is consumer’s behavior toward
carbonate soft drinks at 7-Eleven and their attitudes toward carbonate soft drinks.

10
CHAPTER 2
LITERATURE REVIEW
This chapter reviews concept and consumer behavior theory for major
construct of the study; consist of 5 sections as followings.
2.1 Definition and important of consumer behavior
2.2 Model of consumer behavior
2.3 Factors influences consumer behavior
2.4 Key Psychological Process
2.4.1 Motivation
2.4.2 Perception
2.4.3 Learning
2.4.4 Memory
2.5 Buying decision process
Conclusion
11
2.1 Definition and important
Consumer behavior is defined as the behavior that consumer display in
seeking, purchasing, using, evaluating and disposing of product and service that they
expect will satisfy their personal needs. The study of consumer behavior is the study
of how individual make decisions to spend their money, time and effort on products
and service. (Leon. David, Elizabeth, Aron, Judith and Leslie, 2001)
People engage in activities for many proposes other than consumption but
when acting as a consumer individuals have just one goal in mind-to obtain goods and
services that meet their needs and wants. All consumers face varying problems
associated with acquiring products to sustain life and provide for some comforts.
Because solutions to these problems are vital to the existence of most people and the
economic well being of all, they are usually not taken lightly. The consumer must
specific types of decisions in order to obtain necessary products or services. The
process is complex, as decision must be made about what, why, when, where and how
often to buy an item. (Leon. David, Elizabeth, Aron, Judith and Leslie, 2001)
Besides, consumer preferences were constantly changing and becoming highly
diversified. Even in industrial markets, where needs for goods and services were
homogeneous than in consumer market, buyer were exhibiting diversified preferences
and less predictable purchase behavior (Jonathan, 1995)
These lead to why understand consumer behavior is very important to all the
firms both profit and non profit organization.

12
2.2 Model of consumer behavior
This model of consumer behavior is important for the purpose of this study
because it defines what are the key elements needed to understand consumer
purchasing behavior.
There are a variety of differences types of model existing in the consumer
behavior literature. Models give a simplified version of relationship between factors
that influence behavior. The purpose of consumer behavior models is to provide
description, explanation and prediction of the Purchase (Jonathan, 1995).
Figure 2.1 is the model of consumer behavior that this study uses to capture
the general structure and process of consumer behavior.
Figure 2.1 Model of consumer behavior
Figure 2.1 Model of consumer behavior
Source: Marketing Management (Kotler and Keller, 2006)
Figures 2.1 identify 6 different and consecutives elements to define the buying
process

13
. The first element is called Marketing Stimuli, and regroups influencing stimuli
such as Products & Services, Price, Distribution, and Communication. In other terms,
theses define the offer available to the consumer.
The 2nd element is called “other stimuli” and regroups elements such as
Economic, Technological, Political and Culture. Theses are what defines the society
and would be studied in marketing thought a PESTLE analysis. It could say that the
2nd element is simply speaking the society in which the consumer is living.
Theses 2 combined elements will characterize the consumer. They will define
both the consumer psychology and the consumer characteristics.
The consumer psychology is composed by the consumer motivation,
perception, his or her learning and memory. On the other hand, the consumer
characteristics will be composed by the consumer cultural, social and personal
elements.
Combined together, Stimuli and Consumer will define how the buying process
is made, the choice evaluated, the alternative considered, and ultimately how the
purchase decision method is reached, in terms of dealer, payment method, timing.
The purchasing decision is the result of a process that is characterized by a set
of key elements that are themselves set in the mind of the consumer by the society in
which the consumer lives.(Kotler and Keller, 2006)

14
2.3 Factors influencing consumer behavior
Consumer behavior is influenced by three factors including cultural, social and
personal factors. (Kotler and Keller, 2006, p.193)
2.3.1 Culture Factors
Culture is the fundamental determinant of a person’s wants and behavior for
example; growing child acquires a set of values, perceptions, preferences, and
behavior through his or her family and other key institutions. Each culture consists of
smaller subcultures that provide more specific identification and socialization for their
members. Subcultures include nationalities, religions, racial groups and geographic
regions. (Kotler and Keller, 2006, p.164)
To support this research study “Changing in drinking culture” studied by
Euromonitor International is used as a reference to gain understanding of how culture
factors influence behavior, in particular drinking habit.
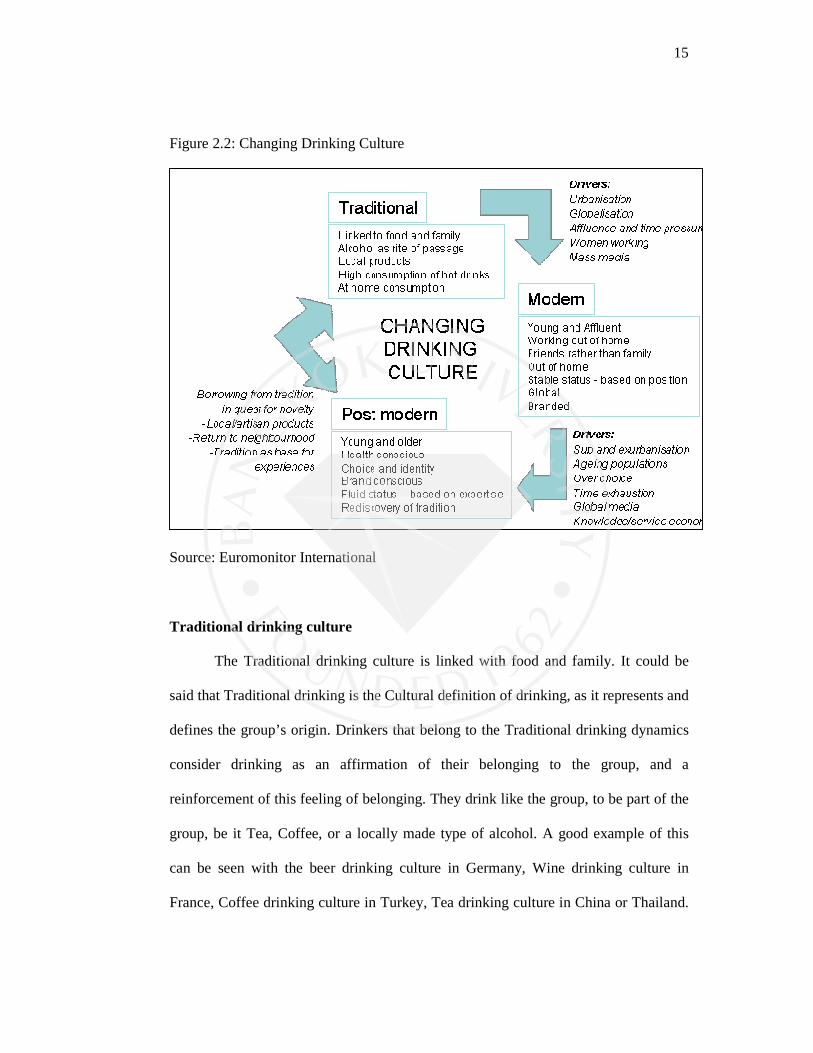
Euromonitor’s studies identify 3 dynamics of drinking habit that are presented
in Figure 2.1, Traditional drinking, Modern drinking and Post Modern drinking. This
study presented a particular look into the cultural element in drinking.
15
Figure 2.2: Changing Drinking Culture
Source: Euromonitor International
Traditional drinking culture
The Traditional drinking culture is linked with food and family. It could be
said that Traditional drinking is the Cultural definition of drinking, as it represents and
defines the group’s origin. Drinkers that belong to the Traditional drinking dynamics
consider drinking as an affirmation of their belonging to the group, and a
reinforcement of this feeling of belonging. They drink like the group, to be part of the
group, be it Tea, Coffee, or a locally made type of alcohol. A good example of this
can be seen with the beer drinking culture in Germany, Wine drinking culture in
France, Coffee drinking culture in Turkey, Tea drinking culture in China or Thailand.
16
As this is the foundation of all drinking culture, it is widely recognizable by all
members of this culture.
However, the Traditional Drinking model is being replaced by Modern
Drinking model across societies and cultures across the world.
Modern Drinking culture
The Modern Drinking model is most representative of modern, urban society
and culture. Unlike the Traditional Modal, that integrates the individual to the group,
the modern drinking model is centered on the individual, to define it within the group.
The modern drinking model is characterized by the notion of “lack of time” and
“status” obtained from choosing the “right” drink. As the result, the individual defines
himself or herself by the shared drinking habits, from where people drink, when they
drink and what they drink. It is interesting to note that while the drinking of “the
drink” is an important defining element of the drinker, the location where this
drinking takes place is as important as the drink chosen to define the drinker’s
personality and lifestyle.
“Post modern” drinking culture
The modern drinking model is pushed to its ultimate incarnation through what
Euromonitor is calling the emergence of the “post modern” drinking culture. The post
modern drinker is an expert, a connoisseur. He or she is not only considering the
mainstream, standardize mass brands available on a mass consumption market. He is
turning back “to the root” and looking for artisan brands, exclusive drinks. Having
been born within the “traditional model that defines their culture, having grown up
with the “modern model” they have evolved beyond it. Expert knowledge will
separate them from the mass. This type of mindset is described by David Brooks in

17
“BoBo in Paradise” where he writes about the rise of the Bohemian Bourgeoisie
(BoBo) who wants the excitement of life but with the security of it.
Finally, the model presented by Euromonitor is describing the evolution from
the modern to the post-modern as where value can be added and where future
business opportunities may lie. What is interest to this research study is that
Euromonitor explains the dynamics as a reflection of both changes within society and
the response of the drinks industry to those changes. As the result of this, it is
important to understand the underlying Thai drinking culture and market to identify
the current overall model that is best able to describe Thailand drinking culture.
(Euromonitor International, 2008)
2.3.2 Social Factors
A consumer behavior is influenced by such social factors as reference groups,
family, and social roles and statuses.
Reference group is a person’s reference group consists of the entire groups
that have a direct or indirect influence on individual attitudes or behavior. (Kilter and
Keller, 2006, p.167) There are 2 types of group. Groups having a direct influence on a
person are family, friends’ neighbors and co-workers, these peoples called a primary
group. Another group that peoples also belong to but tend to be more formal and
require less continuous interaction is secondary groups such as religious, professional
and trade-union groups. (Hawkins, Best and Coney, 1998, p.215)
Family is the most important consumer buying organization in society and
family members are the most influential primary reference group. (Kotler and Keller,
2006, p.167)

18
Roles and statuses mean that a person may be participating in many groups
that will define his role and status within group. A role consists of the activities a
person is expected to perform while role also carries status. People may choose
products that reflect and communicate their role and actual desired status in society.
(Kotler and Keller, 2006, p170)
2.3.3 Personal factor
A buyer’s decisions are also influenced by personal characteristics. These
include the buyer age and stage in the life cycle, occupation and economic
circumstance, personality and self concept and lifestyle and values. Some of these
characteristic have a very direct impact on consumer behavior. (Kotler and Keller
2006, p.170)
People buy different goods and services over a life time. Taste in food, clothes,
furniture and recreation is often age related.
Occupation also influence consumption patterns, for example a blue-collar
worker will buy work clothes, work shoes, and lunchboxes while a company president
will buy dress suits, air travel and country club memberships. Product choice is
greatly affected by economic circumstances, spend able income, saving and assets,
borrowing power and attitudes towards spending and saving. If economic indicators
point to a recession, people may change behavior from buying a luxury brand to more
value for money brand instead. (Kotler and Keller, 2009, p172)
Personality and self-concept also key influence on buying behavior.
Personality means a set of distinguishing human psychological traits that lead to
relatively consistent and enduring response to environmental stimuli (product &
19
service, price, distribution and communication). Personality is a useful variable in
analyzing consumer brand choices since brand also have personality. (Kotler and
Keller, 2009, p.172). Several successful studies demonstrate empirically the
relationship between personality and consumer behavior, for example found
significant positive correlations of scores on measures of extroversion, emotionalism,
tough -mindedness and impulsiveness with alcoholic beverage consumption (Foxall
and Goldsmith,1994,p127)
A last personal factor is lifestyle and values. People from same subculture,
social class and occupation may lead quite difference lifestyle. A lifestyle is a
person’s pattern of living in the world as expressed in the activities, interests and
opinions. Lifestyle is shaped by whether consumers are money constrained or time
constrained. Consumer decision is also influenced by core values that people desires
over the long term. (Kotler and Keller, 2006, p.173-174)

20
2.4. Key Psychological Processes
There are four main psychological process affect consumer behavior include
motivation, perception, learning and memory.
2.4.1 Motivation
One of the best known theories of human motivation is Maslow’s Hierarchy of
needs. According to Maslow’s theory; there are five basic levels of human needs,
which rank the needs in order of important from low-level needs to higher level.
People will try to satisfy their most important needs first. When a person succeeds in
satisfying an important need, he or she will then try to satisfy the next most important
need so on. (Leon. David, Elizabeth, Aron, Judith and Leslie, 2001, p.105) Figure 2.3
presents Maslow’s hierarchy of needs.
Figure 2.3 Maslow’s hierarchy of needs.
Source: Marketing Management (Kotler and Keller, 2006)
Physiological needs (food ,water, air, shelter, sex)
Safety and security needs(protection, order, stability)
Social needs( affection, friendship, belonging)
Ego needs (prestige, status, self-respect)
Self-actualization (self-fulfillment)

21
Euromonitor International presents how many of the drivers and drinking
habits fit with Maslow’s Hierarchy of needs in the following description.
Figures 2.4 Drinking and Maslow’s Hierarchy of Needs
Source: Euromonitor International
The basic needs have to be met for higher levels to become important. This is
not a one-way process. Survival needs have to be met; if water supplies were to be
compromised even affluent self-actualizes would return to survival behavior very
quickly.

22
Figure 2.5 Consumer Needs and Drinking Drivers
Source: Euromonitor International
Figure 2.3 presented the factors driving consumer drinking habit. There are six
factors that include: Thirst, Affordability, Convenience, Image and Status, Sociability
and Health. Theses will be the basis of this study to look at the factors that influence
the consumption of carbonate soft drinks for the Thai consumer.
As the factors presented by Euromonitor are what drive the consumer, it is
important to have closer look at these drivers.
The first of these 6 drivers is Thirst. Thirst is the most basic and most
fundamental driver liked with liquid consumption. It can be basically reduced to
Thirst = water consumption. From the perspective of Maslow’s Hierarchy of needs,

23
Thirst would be at the lowest stage of the pyramid, the “survival” stage. As a human
needs an average of 2 liters of water a day, a lack of access to water means death
within a short period of time.
However, there are different levels of answering the Thirst driver, closely
linked with the level of development. In developing countries, access to clean water is
a problem. In developed countries, people have access to clean and safe tap water.
Paradoxically, these people are also the people consuming the highest level of mineral,
bottled water.
Going beyond simple water, Euromonitor points out the fact that in developed
Western countries, even mineral water is no longer enough to interest customers and
producers are moving toward flavored waters, which are in line with new trends in
health and wellness. This new market for flavored water represents 3.7 million liters
per year, with Western Europe representing 30% of the total consumption with 1.3
million liters vs. 212 million liters of normal water. On the other hand of the spectrum,
normal water consumption represents 1,8 million liters worldwide, with 1.1 million
liters being consumed in the Asia Pacific region.
As the Euromonitor presents, Thirst is the most basic drinking driver.
However, as consumers gain more affluence and live in developed markets, the needs
evolve accordingly to be come more sophisticated. As a result, Affordability becomes
a key driving factor once the Thirst basic need has been satisfied.
Affordability is the underlying factor that determines what people drinks.
Euromonitor study pin points the fact that consumers are highly sensitive about their
image and status. As a result, while they may drinks expensive brands in public, in
24
private, they counter balance this spending by switching to basic commodity in
private.
As a conclusion, it is clear that Thirst is the most important factor driving the
consumer needs. Once combined to Affordability it will determine what the consumer
can buy. This will determine the basic market seize the consumer has access to. This
could be considered as the median line of consumer purchase. What the consumer will
purchase at this level is purely determined by his spending powers, on his private
capacity.
Combined with the next factors of Convenience, Image and Status, Sociability
and Health, the Euromonitor study goes beyond the private consumption patterns and
look at the Social aspect of consumption. From Maslow’s hierarchy of needs
perspective, this presents the belonging, the esteem and self actualization stage.
Convenience driver factor is presented by the Euromonitor study as a
consequence of the evolution of traditional culture where time isn’t a precious
commodity, toward cultural model where time is a vital and limited resource. Social
evolutions such as women working and long commuting time between place of work
and place of living are driving this evolution.
As a result, consumption is more and more delocalized, and to some extends
“on the go”. Euromonitor describe this as the “in between” or “third place culture.”
From a consumption driver, this means that drinks sold must be portable, and are
meant for single use.
The Social driver in the drink culture can be seen, based on the Euromonitor
study, as a particular result of the Global Village model applied to the drinking
consumption behavior. Consumers will identify with a community or group and adopt

25
its usages, including drinks. Alternatively, because a consumer has already a set of
usages and consumption habits, he will join a community that display similar patterns.
This socialization is driven by the need of the consumer to achieve self
actualization. This is the last step of Maslow’s pyramid of needs, driven by Image and
Status. Euromonitor describe the image and status driver of beverage consumption as
being closely linked with the alcohol consumption of young adults. Furthermore, this
driver is described as a fashion statement as well a quest to improve the social image
of the consumer. Euromonitor describe theses consumers as people seeking exclusive
and rare drinks in order to achieve “connoisseur” status. This will translate in a
multiplication of niche brands driven by marketing strategies and a culture of choice.
The limitation of this, The Euromonitor pinpoint is overwhelming choice leads to
confusion and the consumer will seek to return back to the basic, to something he
knows. This is what Barry Schwartz describes in “The Paradox of Choice”.
The final key driver identified by the Euromonitor study is the Health factor.
The health factor has been translated in the drink culture by the “light” factor that
appeared in many carbonated soft drinks offers. This trend is linked with the rising
obesity in western / developed countries, which has been closely associated and blame,
with or without justification, with high sugar level in carbonated soft drinks.
As a result, consumers are turning towards natural drinks such as Soya milk,
natural fruit juices, tea and coffee. These natural drinks are being rediscovered by
customers and adapted to meet the needs of the modern consumers. For example,
more and more green teas are now available in PET bottle in “ready to drink” format,
following a trend started in Japan.
Combined together these 6 factors described by the Euromonitor study are the

26
key to understand the drivers of the customer behavior. By studying the answer of the
customers to questions linked with theses drivers, it is possible to identify the type of
behavior the consumer is manifesting, and therefore understand the best way to target
him or her.
2.4.2 Perception
A motivated person is ready to act. How the motivated person actually acts is
influence by his or her view or perception of the situation. Perception is the process
by which an individual selects, organizes and interprets information inputs it creates
as meaningful picture of the world. In marketing, perceptions are more important than
the reality, as it perceptions will affect consumer’s actual behavior.
People can emerge with difference perception of the same object because of
three perceptual processes includes selective attention, selective distortion and
selective retention. (Kotler and Keller, 2006, p.175-176)
2.4.3 Learning
Learning involves changes in an individual’s behavior arising from experience.
Most human behavior is learned. Learning is produced through the interplay of drives,
stimuli, cues, responses and reinforcement. The demand of the product can be build
by associating it with strong drives, using motivating cues and providing positive
reinforcement. (Kotler and Keller, 2006 p.177)
2.4.4 Memory
All the information and experiences individuals encounter as they go through
life can end up in their long term memory. Memory is divided into 2 types include
short-term memory and long term memory. Long term memory structure involve
27
some kind of associative model formulation, for example ,the associative network
memory model views LTM as consisting of a set of nodes and links. Any type of
information can be stored in memory network. A spreading activation process from
node to node determines the extent of retrieval and what information can actually be
recalled in any given situation. It is very important to ensure that the consumer have
the right types of product and service experiences such that the right brand knowledge
structures are created and maintained in memory.(Kotler and Keller,2006,p.178)

28
2.5 Buying Decision Process
The basic psychological processes play an important role in understanding
how consumers actually make their buying decisions. The model in Figure 2.6
provides a frame of reference.
Figure 2.6 Five-Stage Model of the Consumer Buying Process
Source: Marketing Management (Kotler and Keller, 2006)

29
Problem recognition
The process of marking a consumer decision begins with the problem
recognition. Problem recognition occurs when a consumer notices that the current
stage of affairs is not the deal or desired stage (Peter and Olson, 1994, p.159). Among
consumers, there seem to be two different problem-recognition situations. Some
consumers face actual state decision, where they perceive a problem with a product
that fails to perform satisfactorily, for example a watch that no longer keeps accurate
time. In contrast, other consumer faces desired state decisions, where the desire for
something new may trigger the decision process. (Leon. David, Elizabeth, Aron,
Judith and Leslie, 2001 p.523)
Information search
Once customers recognize a need, consumers obtain the information about
goods and service that might satisfy this need. Consumer might recollection of past
experience that might be provided the consumer with adequate information to make
present choice. If the consumer can not retrieve enough information from memory, he
or she may have to engage in a search of the outside environment for useful
information on which to base a choice. For unimportant or cheap purchase this may
not be necessary but for more important or expensive purchase it may take time and
effort to find out what the options are. The source might be the media, friends,
relations or other significant people. (Bareham, 1995, p.6)
Evaluation of alternatives
Consumers tend to use two types of information which are a list of brands and
store from which they plan to make their selection and the criteria they will use to
evaluate each brand (Leon. David, Elizabeth, Aron, Judith and Leslie, 2001p.525).

30
Some basic concepts help to understand consumer evaluation processes. First, the
consumer is trying to satisfy a need. Second, the consumer is looking for certain
benefits from the product solution. Third, the consumers see each product as a bundle
of attributes with varying abilities for delivering the benefits sought to satisfy this
need (Kotler and Keller, 2009. p.183). Naturally, the criteria chosen on which to base
the judgment are important. The criteria stem from beliefs and attitudes and intensions
(Bearham, 1995, p.7).
Purchase decision
In the evaluation stage, the consumer forms preference among the brands in
the choice set. The consumer may also form an intention to buy the most preferred
brand. In exciting a purchase intention, the consumer may make up to five sub-
decisions include brand, dealer, quantity, timing and payment method. (Kotler and
Keller, 2006, p.186-187)
Post purchase Behavior
After the purchase, the consumer might experience dissonance that stems from
noticing certain disquieting features or hearing favorable thing about other brands and
will be alert to information that support his or her decision. (Kotler and Keller, 2006,
p.188).”The level of satisfaction/dissatisfaction with the purchase choice is a useful
concept for understanding consumer behavior” (Peter and Olson, 1994, 168) For
instance, measures of consumer satisfaction can be used to indicate the success of a
company marketing strategies. Satisfied consumers are more likely to repurchase
product and become brand loyal, they are more likely to tell other people the product
and spread positive word-of-mouth communications. On the other hand,

31
dissatisfaction consumer can lead to complaints and negative word-of-mouth
communication and stop buying such product. (Peter and Olson, 1994, 168)
Conclusion
This literature review has explored the different elements that compose
customer behavior. These elements will provide a better understanding of what is
meant by customer behavior. From the definition customer behavior given by Leon,
David, Elizabeth, Aron, Judith and Leslie, (2001), it is understood that what is called
customer behavior is a set of activities whose final purpose is to purchase. However,
this process is seen as being strongly influenced first by elements and information
available in the market, but, most of all by the customer perceptions and aspirations.
This complex process needs to be simplified through a customer behavior
model in order to be easily understood and used. As there are many different
researchers studying customer’s behavior, there will be many models. The model
selected for the purpose of this study is the model proposed by Kotler and Keller in
Marketing Management (2006) as it seems the most complete and the clearest to use.
From this model, 6 key elements defining the purchase decision have been
identified. Out of these 6, the 2 that have a direct link to our study are the Consumer
Characteristics and the Consumer Psychology, as this study focuses on the consumer
element of the purchasing decision.
Once looking at the consumer elements, it is clear that all consumers’ behavior
is influenced by 3 key factors, Cultural, Social and Personal. Theses will be the key to
unlock the understanding of the mind of the consumer of carbonate soft drinks.

32
The cultural element is the underlying element of the consumer drinking
behavior and this has been clearly detailed in the Euromonitor study. Combined with
Maslow’s hierarchy of needs, 6 key drivers for understanding customers’ behavior
and needs when analyzing their drinking habits have been identified. The
combinations of Health, Thirst, Affordability, Convenience, Imagine and Status and
Sociability will the factors that will trigger the motivation and the purchasing process.
Now that all the elements to understand the consumer behavior in making his
purchasing decision have been gathered and more particularly the elements to be
applied to the drink market, they can be incorporated into the research methodology.
Furthermore, this literature review provides the elements to select the most
relevant research methodology as it is known what is important, and what is irrelevant,
in understanding the targeted group of consumers.

33
CHAPTER 3
RESEARCH METHODOLOGY
This chapter explains the processes of research methodology for major
construct of the study. The chapter comprises 2 sections which are the reviews of
research methodology and research method used for this study.
3.1 Review research methodology
3.1.1 Model of research process
3.1.2 Determine research design
3.1.3 Data collection method
3.1.4 Data collection form
3.1.5 Design sample and collect data
3.1.6 Analyze and interpret the data
3.1.7 Prepare research report
3.2 Statement of research methods used
Conclusion

34
3.1 Review Research Methodology
3.1.1 Model of research process
All research problems require their own special emphases and approaches.
Every research problem is unique in some ways, the research procedure is usually
custom tailored. Nonetheless, there is a sequence of step called the research process
which can be followed when designing the research project. Figure 3.1 presented the
sequence of steps in the design and implementation of a research study.
Figure 3.1 Stages in Research Process
Source: Basic Marketing Research (Churchill and Brown, 2004, p.40)
Formulate problem
Design Data Collection Forms
Determine Data Collection Method
Determine Research Design
Design Sample and Collect Data
Analyze and Interpret the Data
Prepare the Research Report

35
3.1.2 Determine Research Design
The second stage of conducting the research is determining research design. A
research design is simply the framework or plan for a study used as a guide in
collecting and analyzing data. Research designs can be classified in to some basic
types according to fundamental objective of the research include exploratory,
descriptive or causal. (Churchill and Brown, 2004, p.90)
Exploratory research
Exploratory research is used when the research objectives focus on gaining
background information and clarifying the research problems to create hypotheses and
establish research priorities. A hypothesis is a statement that specifies how two or
more measurable variables are related. (Churchill and Lacobucci, 2002, p.93)
Exploratory studies are characterized by their flexibility. There are four types of
exploratory studies including literature search, experience survey, focus group and
analysis of selected cases. These are used to gain the insight into a phenomenon. The
example of using exploratory research is that, the soft drinks manufacture faced with
decreased sales might conduct an exploratory study to generate possible explanations.
(Churchill and Lacobucci, 2002, p.91)
Descriptive research
Descriptive designs are used when the research objective emphasizes
describing and measuring marketing issues at a particular point in time (Hair, Bush
and Ortinau, 2006, 170). The descriptive study is typically guided by initial
hypothesis. Descriptive studies require a clear specification of who, what, when,
where, why, and how of the research. They are used when the research is intended to
describe the characteristics of certain group, to estimate the proportion of people who

36
behave in a certain way or the make prediction (Churchill and Lacobucci, 2002, p122).
Example of descriptive study is the investigations of the trends in the consumption of
soft drinks with respect to such characteristics are age, sex and geographic location
(Churchill and Lacobucci, 2002, p.91).
Descriptive studies are of two types including longitudinal and cross sectional.
Longitudinal studies rely on panel data .A panel is simply a fixed sample of
individuals or some other entities from whom repeated measurements are taken. There
are 2 different kinds of panel, the panels in which the same measurements are taken in
each measurement period and those in which different measurements are taken in
each measurement period.
Cross sectional study or sample survey is the best known and most important
type of descriptive design, as measured by the number of times it is used in
comparison to other method. (Churchill and Lacobucci, 2002, p.117). A great deal of
emphasis is placed on the scientific generation of the sample so that the members are
representative of the population of interest. A typical survey involves summarizing
and generalizing the data collected. The analysis of sample survey results rests
heavily in the cross-classification table which is used to report the joint occurrence of
the variables of interest (Churchill and Lacobucci, 2002, p.122).
There is a special type of research design under cross sectional study called
cohort analysis. This analysis can be used when there is a series of surveys and the
spacing between them corresponds to a natural or cohort, division of the population,
where a cohort refers to the aggregate of individuals who experience the same event
within the same time interval (Churchill and Lacobucci, 2002, p.118-119).

37
Causal research
A causal research design is concerned with determining cause and effect
relationships. The purpose of this research is to capture cause and affect relationships
by eliminating competing explanations of the observed finding. Experiments call for
selecting matched groups of subjects, subjecting then to different treatment,
controlling extraneous variables and checking whether observed response differences
are statistically significant (Kotler and Keller, 2006, p.190). Example of using causal
research design is that, a soft drink manufacturer may be interested to ascertaining the
effectiveness of different advertising appeals. (Churchill and Lacobucci, 2002, 91)

38
3.1.3 Determine Data Collection Method
The third stage of research process is determining data collection method.
Data is divided into two types which are primary and secondary data. Secondary data
are the data that were collected for another purpose and already exist somewhere
while the primary data are data freshly gathered for a specific research project.
Secondary data provide a starting point and offer the advantage of low cost and ready
availability .When the needed data are not exist, out dated, inaccurate or unreliable,
the primary data will need to be collected. (Kotler and Keller, 2006, p.98).The focus
of this research study is on primary data type only.
Data Collection: Primary Data
The types of primary data of interest to marketing research include
demographic and socioeconomic characteristics, psychological and lifestyle
characteristics, attitudes and opinions, awareness and knowledge, intentions,
motivation and behavior of individuals and group.
Demographic and Socioeconomic characteristics
One type of primary data is consumer’s demographic and socioeconomic
characteristics such as gender, income or social class, age, education, occupations,
marital status. These variables are used to cross classify the collected data help make
sense of the consumer’s response (Churchill and Lacobucci, 2002, p.258).For
example, the study of people’s attitudes toward ecology and pollution. Suspecting of
test and find that attitudes toward green marketing are related to the respondent’s
level of education.
39
Psychological/Lifestyle Characteristic
This is another type of primary data is the subject’s psychological and lifestyle
characteristics in the form of personality traits, activities, interests and values.
Personality refers to normal patterns of behavior exhibited by an individual, the
attributes, traits and mannerisms that distinguish one individual from
another.(Churchill and Brown,2004,p.209) People are often characterize by the
personality traits, aggressiveness, dominance, friendliness they display. While
lifestyle characteristic focus on knowing customer in term of how they live, what
interest them, and what they like. The purpose of value and lifestyle research is to
create the standard psychographic framework that can be used for a variety of
products. (Churchill and Brown, 2004, p.210)
Attitudes/Opinions
Attitude is used to refer to an individual’s preference, inclination views or
felling towards some phenomenon while the opinions are verbal expressions of
attitudes. (Churchill and Brown, 2004, p.211)
Attitude is one of more important notion because attitudes are relates to
behavior. If a person has a positive attitude toward a products or brand, the person is
more likely to buy that product. In contrast persons who has negative attitude are
likely not to buy that product. (Churchill and Brown, 2004, p.211-213)
Awareness/Knowledge
As used in marketing research, awareness and knowledge refers to what
respondents do and do not know about some object or phenomenon (Churchill and
Lacobucci, 2002, p.263).The testing of awareness is useful for determining whether

40
the respondent is aware of the product and its feature, its price and where it may be
purchased, its brand name and country of origin. In general, awareness questions help
to assess consumer’s knowledge of any element of the consumer experience,
advertisements, products, retail stores and so on. (Churchill and Lacobucci, 2002,
p.264)
Intentions
Another type of primary data is individual intentions; it refers to the
individual’s anticipated or planned future behavior. People’s intensions primarily
related to purchasing behavior. Intentions are often gathered by asking respondents to
best describe their plan with respect to a new product or service. (Churchill and
Lacobucci, 2002, p.264-265)
Motivation
The concept of motivation according to Churchill and Lacobucci is refer to
need, a want, a drive an urge, a wish, a desire, an impulse or any inner stage that
directs or channels behavior towards goal. Motives tend to be more stable than
particular behavior; therefore motives offer a better basis for predicting future
behavior than does past behavior. The understanding of motives behind a person’s
behavior will enable to understand the behavior better and in turn, are in a better
position to influence behavior, or at least provide offering consistent with that
anticipated behavior. (Churchill and Lacobucci, 2002, p.266)
Behavior
This is the last type of primary data. Behavior concerns what consumers have
done or are doing. Usually in marketing, this means purchase and usage behavior.

41
Behavior is a physical activity that takes place under specific circumstances, at a
particular time and involves one or more participants. The study of behavior involves
the development of a description of the purchase or use activity, either past or current.
(Churchill and Brown, 2004, p.215)
42
3.1.4 Design Data Collection Form
There are a choice of three main research instruments in collecting primary
data includes questionnaires, qualitative measures and mechanical device (Kotler and
Keller, 2006, p.101). According to this research study use questionnaire to collecting
the primary data, therefore the reviews will be focused on the concept of
questionnaire method only.
Questionnaire
The questionnaire is the most common instrument used to collect primary data.
A questionnaire consists of a set of questions presented to respondent (Kotler and
Keller, 2006, p.101). The role of questionnaire is to facilitate the extraction of data
from respondent. It provides consistency in the way the interview is conducted
(Hague and Morgan, 2004, p.99). Questionnaire needs to carefully developed, tested
and debugged before they are administered on a large scale. Interpreting questionnaire
requires carefully choosing the questions and their form, wording and sequence. The
form of questionnaire can influence the response. Therefore, it needs to be
distinguished between closed-end and open-end questions. Closed-end questions
specify all the possible answers and provide answers that are easier to interpret and
tabulate. While open questions allow respondents to answers in their own words and
often reveal more about how people think. They are especially useful in exploratory
research, where it looking for insight into how people think rather than measuring
how many people think a certain way. (Kotler and Keller, 2006, p.101)
A questionnaire can be administered in three different ways which are by
phone, face-to-face and self-completion. These three methods require difference
forms of questionnaire; Table 3.1 presented these three different types.

43
Table 3.1 The three different types of questionnaire
Source: Marketing research in practice: a guide to basic (Hague and Morgan, 2004,
p.99)
Structured questionnaires consist of closed or prompted questions. They are
used in large interview programs and may be carried out over the telephone, face-to-
face or by self-completion.
Semi-structure questionnaires comprise a mixture of closed and open
questions. They are used in business-to business market research where there is a need
to accommodate a large range of different responses from companies. The use of this
type of questionnaire enables a mix of qualitative and qualitative information to be
gathered. They can be administered over the telephone or face-to-face.
Unstructured questionnaire are made up of free-ranging questions that allow
respondents to express themselves in their own way. They are use in qualitative
research for depth interviewing and the basis of many studies into technical or narrow
market. (Hague and Morgan, 2004, p.99-100)
Questionnaire type Area of use Method of administration
Structured Large, quantitative Telephone/face to face/studies self-completion
Semi-structured Qualitative consumer Telephone/face-to-facestudies, business tobusiness studies
Unstructured Qualitative studies Depth telephone/face-to-face/group discussion

44
3.1.5 Design Sample and Collect Data
Sampling Procedures
After having developed appropriate research design and data-collection
method and data collection forms, the next step in the research process is to select
elements from which the information will be collected. One way of doing this would
be to collect information from a portion of the population by taking a sample of
elements from the large group (Churchill and Lacobucci, 2002, p.448). Figure 3.2
outlines a useful six-step procedure when drawing a sample of a population.
Figure 3.2 Six-Step Procedures for Drawing a Sample
Source: Marketing Research Methodological foundation (Churchill and Lacobucci,
2002, p.449)
Define the Target Population
Identify the Sampling frame
Collect the Data from the Designated Elements
Determine the Sample Size
Select a Sampling Procedure
Select the Sample Elements
Step 1
Step 2
Step 3
Step 4
Step 5
Step 6

45
3.1.5.1 Target Population
The fist step is to define the target population that will be sampled. The most
important thing in defending the target population is specifying exactly what elements
are of interest and what elements are to be excluded. (Churchill and Lacobucci, 2002,
p.450)
3.1.5.2 Sampling Frame
After deciding who or what should be investigated, the next step is to create a
list of eligible sampling units. The list should contain enough information about each
prospective sampling unit so the researcher can successfully contact them. Having an
incomplete sampling frame decrease the likelihood of drawing a representative of the
sample. Sampling frame list can be created from a number of different source such as
customer lists from companies internal database, random-digit dialing. (Hair, Bush
and Ortinau, 2006, p.345)
3.1.5.3 Sampling Procedure
The third step in the procedure for drawing a sample is closely linked with the
identification of the sampling frame. Choosing a sampling method or procedure
depends largely on what the researcher can develop for a sampling frame. Different
type of samples requires different types of sampling frames.
Probability and Nonprobability samples
The main types of samples include nonprobability and probability samples.
Probability samples are distinguished by the fact that each population element has a
known, nonzero chance of being included in the sample. With nonprobability samples
in contrast, a sample relies on personal judgment in the element selection process and

46
therefore prohibits estimating the probability that any population element will be
included in the sample thus, a degree of sampling error may be involved. (Churchill
and Brown, 2004, p.403-405).
The basic types of nonprobability samples are convenience, judgment and
quota samples. Convenience samples are also known as accidental sample because
those elements included just happened to be at the study site at the right time.
Population elements are hand picked to serve a specific purpose with judgment
samples, whereas with quota samples, the interviews personally select subjects with
specified characteristics in order to fulfill their quota.
The basic types of probability samples includes simple random simple,
stratified random sample and cluster sample. Simple random samples allow each
population has equal chance of being included and every combination of sample
elements. A stratified random sample is probability sample in which the parent
population is divined into mutually exclusive and exhaustive subset and a sample in
which the parent population is divided into set. While a cluster sample is a probability
sample in which the parent population is divined into mutually exclusive and
exhaustive subsets and then s random sample of subset is selected.(Churchill and
Lacobucci, 2002, p.491-492)
3.1.5.4 Sample Size
Determining the sample size is not an easy task, there are three factors playing
an important role in determining sample sizes, including, the variability of the
population characteristic under investigation and the level of confidence desired in the
estimate and the degree of precision desired in estimating the population
characteristics. The greater the variability of the characteristic under investigation, the
47
higher the level of confidence required. Similarly, the more precise the required
sample results the larger the necessary sample size (Hair, Bush and Ortinau, 2006,
p.317-318)
Statistical formulas are used to determine the required sample size in
probability sampling while sample sizes for nonprobability sampling designs are
determined using subjective methods such as industry standards, past studies or the
intuitive judgments of the researcher. The size of the defined target population does
not affect the size of the required sample unless the population is small relative to the
sample size. Sample sizes are not the same as usable observations for data analysis.
Having fewer observations than desired will affect the accuracy of the data. Therefore,
reachable rates, overall incidence rates and expected completion rates on the number
of prospective respondent contacts will necessary need to be considered to ensure
sample accuracy. (Hair, Bush and Ortinau, 2006, p.325-326)
3.1.5.5 Sample Element
An element is a person or object from which information is sought. An
element is often considered as a particular product or group of individuals. Elements
must be unique, countable and when added together, make up the whole of the target
population. Elements can be viewed collectively as the target population frame from
which a sample will be drawn. Target population elements might include a particular
consumer product, specific groups of people or specific organizations. (Hair, Bush
and Ortinau, 2006, p.310)

48
3.1.6 Analyze and Interpret Data
Towards the end of market research project, the fieldwork is completed and
the data must be analyzed. “Coding is the technical procedure by which raw data are
transformed into symbols, it involves specifying the alternative categories or classes
into which the responses are to be placed and assigning code numbers to the
classes ”(Churchill & Brown, 2004, p.518). Most often the symbols are numerals
because they can be handled easily by computers. There are 2 types of coding that are
called coding for coding closed-ended questions and coding open-ended questions.
Coding Closed-Ended Items
A closed question is one that requires respondents to choose an answer that is
presented to them in the interview. These types of items are generally quite simple to
code when there is a single possible answer to a questions, for example male or
female, the researcher uses one variable for the question and simply assigns a
character to each possible response, for example 1= female, 2=male. The appropriate
code number is then recorded in the data file.
The coding process for closed-ended items becomes a bit more complex when
respondents can indicate more than one answer for a given questions. In this situation,
a simple solution is to create variables to represent all possible answers and to indicate
for each whether or not the option was selected. A coding scheme is to record a “1” if
a respondent selected a response and to record a “0” if she did not select that response.
(Churchill & Brown, 2004, p.518-519)

49
Coding Open-Ended Items
Coding open-ended response is typically much more difficult than coding
open-ended response. The first step in coding open-ended question is to go through
each questionnaire and highlight each separate response given by each individual. The
next step in coding is specifying the categories or classes into which the responses are
to be placed. After an appropriate set of categories is identified, the actual coding of
response into the categories begins. (Churchill & Brown, 2004, p. 519-520)

50
3.1.7 Prepare the Research Report
Reporting findings provides an opportunity to make a strong impact on an
audience. The presentation slides style is often chosen for a reports rather than a
separate narrative report. Therefore, the presentation style reports must communicate
the findings clearly and lead to conclusions and recommendations.
A standard report generally contains the following elements including title
page, table of contents, summary, introduction, body, conclusion and recommendation
and appendix. (Churchill & Brown, 2004, p.665-666) Reporting requires a balance of
text, tables, charts, diagrams and graphics to communicate the different data. (Hague
and Morgan, 2004, p.194)

51
3.2 Statement of Research Used
In order to achieve the research objectives of this study, a conceptual
framework must be designed. The conceptual framework is created to gain the
consumer profile and understanding about consumer attitude, general behavior and
purchase behavior towards carbonate soft drinks. This research study used SPSS
program to analyze and interpreted the data of respondents.
Conceptual framework
52
3.2.1 Research Design
In gathering the primary data, survey method will be used to collect descriptive
research data. The descriptive study is used to gain understanding of consumer
behavior and attitude towards carbonate soft drinks with respect to such
characteristics as age, sex, geographic location.
The primary data that will be collected for this research study will be presented in
the conceptual framework includes demographic characteristic, attitude toward
carbonate soft drinks, general behavior and people intentions related to purchasing
behavior.
3.2.2 Design Sample
The target population of this research study is men and women who drink
carbonate soft drinks and are buying it at 7-Eleven.The population figures were from
the observation in three locations where the field simple will be conducted.
There were 2 observation questions used to obtain the target populations of
this study.
Q1: Have you ever drunk carbonate soft drinks?
If yes, ask 2nd question.
Q2: Have you ever bought it from 7-Eleven?
If yes, count as population
The results and observation details have been described as in table 3.2

53
Table 3.2 Number of Population by Location
Population
Branch Observation Date
& Time
Number of
population in
2 hours
Avg. per day
% Con
Branch: 7-Eleven Chachoengsao 29 March 2009, 1-3 p.m.
34 408 39%
Branch: 7-Eleven Siam Paragon 30 March2009, 9-11 a.m.
25 300 28%
Branch: 7-Eleven Muangthong Thanee 30 March 2009, 4-6 p.m.
29 348 33%
Total 30 1,056 100%
According to observation data, the total population for this study is 1,056.
The sampling method used for this study is a probability sample with stratified
random sample technique. As mentioned above that the field sampling will be held at
7-Eleven in three locations, this will help to better understand consumer’s behavior in
various geographical locations where the consumers may have different in attitudes,
drinking patterns and behaviors. Siam Paragon represents city people, Muangthong
Thanee represents outskirt or people who live not too far from the city and
Chachoengsao represents people who live away from the city.
The sample size of this research study follows the method of Yamane (1973).
n=N/ (1+Ne2) Where: n is the size of sample N is the population of the sample and e2 is the probability of error

54
Thus, the sample size for this study has been calculated according to procedure as Follows:
n =1,056/ ((1+1,056(0.05)2) = approximate 399.6
Within N=1,056 and e=5% (at 95% confidence level) Hence, the sample size is 400 respondents.
According to the field sampling will be conducted in three locations, therefore,
the sample size base on contribution of each location is as follows.
Table 3.3 Number of sample size by location
Branch % Con Total Sample size = 400
Chachoengsao 39% 155
Siam Paragon 28% 114
Muangthong Thanee 33% 131
Total 100% 400
3.2.3 Data Collection Form/Research Instrument
The research instrument used to collect primary data for this study is a
questionnaire. The questionnaire is designed in English and translated to Thai
language, the research questions are designed according to conceptual framework for
answering the main objectives of the study.

55
Pretest and Test reliability
A pilot research instrument was conducted with ten peoples to check the
clarity of each question between 11.00 am to 2 p.m. dates on 6 April 2009.At first, it
took about 10 minutes in average for each respondent to complete the questionnaire
and some of respondents were not willing to complete the questionnaire since they
found that there were too many questions. Later, a researcher has to improve the
questionnaire questions more concise and also adjusts the questionnaire format to be
more attractive. After improvement, the 2nd pilot test is hold again one day later with
ten respondents .The results presents that all of them understood all items and find it
easy to completed.
The result of Cronbanch’s validity instrument by Cronbrach for 30
questionnaire sampling is present as below.
Table 3.4 Validity instrument by Cronbach
Cronbach’s Alpha No of items
0.793 22
Table 3.4 presented the questionnaire pretest validity by Cronbach’s Alpha.
The number of standardized present at 0.79 which is greater than standardized
definition at 0.70; therefore the questionnaire for this research is validity.
There are three parts of questionnaire as follows.
The first part is classification; it designed to collect customers profile data at
7-Eleven include geographic location, age, and gender.
The second part of questionnaire is designed to collect consumer’s attitudes
and behavior toward carbonate soft drink at 7-Elven.This part consist of 3 questions,

56
the questionnaire deal with purchase influence factor, degree of carbonate soft drinks
answering the need factors of drinking, brand satisfaction.
The third part is designed to obtain the consumption and purchase behavior
data, the questionnaire deal with regular brands purchased, brand drink most often,
brand will buy next, purchase frequency, time of purchase, number of people in group
visit, plan or impulse purchase, item buy with carbonate soft drinks and prefer pack
size.
3.2.4 Research Measurement
In the study, there are 3 scales used to measure attitude and behavior of
consumers toward carbonate soft drink includes comparative rating scale, itemized-
rating scale and Likert scale.
Comparative Rating Scale
The constant-sum comparative rating scale is one example of comparative
rating scale used to measure which carbonate soft drink attributes are more important
to customers in influencing their purchase decision. Each individual would be asked
to divide 100 points among six attributes.
For example, if all attributes are assigned the same score, the attributes would
be judged to be equally important. On the other hand, if individual assigned 10 points
to attribute 1st - 5th each , and another 50 points assigned to attribute 6th. Attribute 6th
would be considered to be five times more important.
Itemized-Rating Scale
The itemized rating scale used to measure satisfaction of individual toward
carbonate soft drink brands. Each individual would be instructed to indicate their
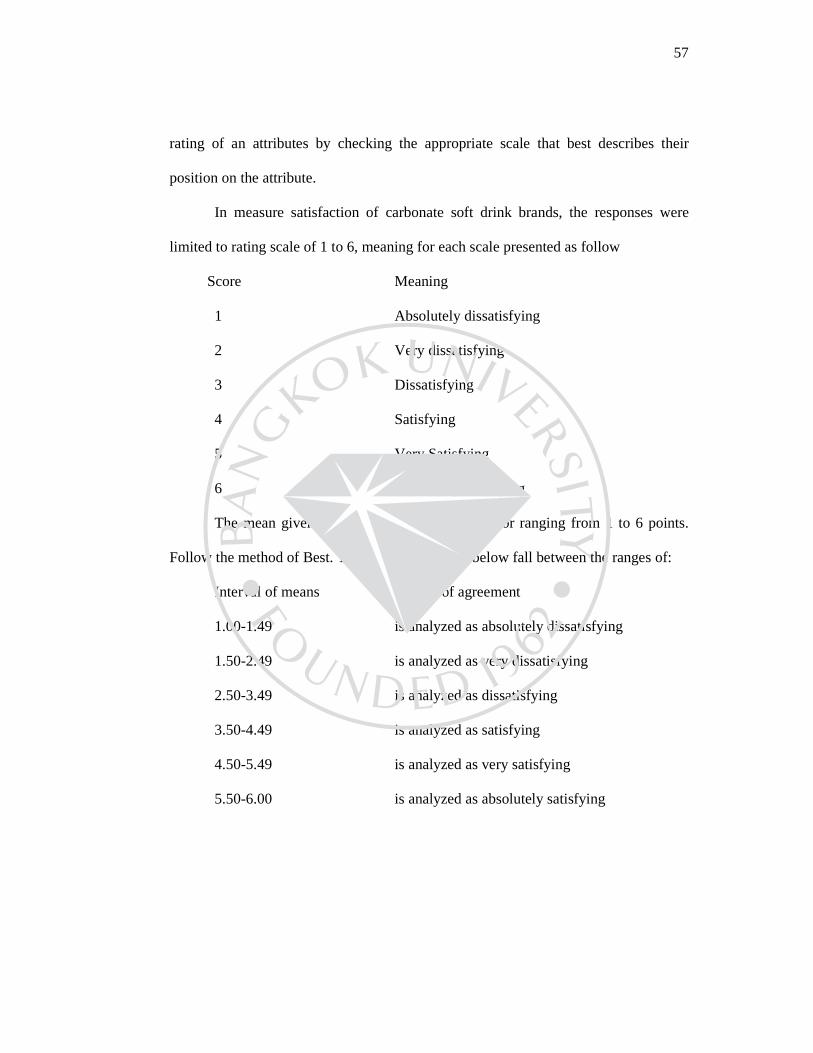
57
rating of an attributes by checking the appropriate scale that best describes their
position on the attribute.
In measure satisfaction of carbonate soft drink brands, the responses were
limited to rating scale of 1 to 6, meaning for each scale presented as follow
Score Meaning
1 Absolutely dissatisfying
2 Very dissatisfying
3 Dissatisfying
4 Satisfying
5 Very Satisfying
6 Absolutely Satisfying
The mean given from each interrelated indicator ranging from 1 to 6 points.
Follow the method of Best. The items with scores below fall between the ranges of:
Interval of means Degree of agreement
1.00-1.49 is analyzed as absolutely dissatisfying
1.50-2.49 is analyzed as very dissatisfying
2.50-3.49 is analyzed as dissatisfying
3.50-4.49 is analyzed as satisfying
4.50-5.49 is analyzed as very satisfying
5.50-6.00 is analyzed as absolutely satisfying

58
Likert Scale
The Likert scale used for attitude measurement in which the individual are
asked to indicate their degree of agreement with each of carbonate soft drinks
characteristics. The five-point Likert scale is as follows.
Score Meaning
5 Strongly Agree
4 Agree
3 Neither Agree nor Disagree
2 Disagree
1 Strongly Disagree
The mean given from each interrelated indicator ranging from 1 to 5 points,
follow the method of Best .This means that items with scores below fall between the
ranges of:
Interval of means Degree of agreement
1.00-1.49 is analyzed as strongly disagree
1.50-2.49 is analyzed as disagree
2.50-3.49 is analyzed as neither agrees nor disagrees
3.50-4.49 is analyzed as agree
4.50-5.00 is analyzed as strongly agree
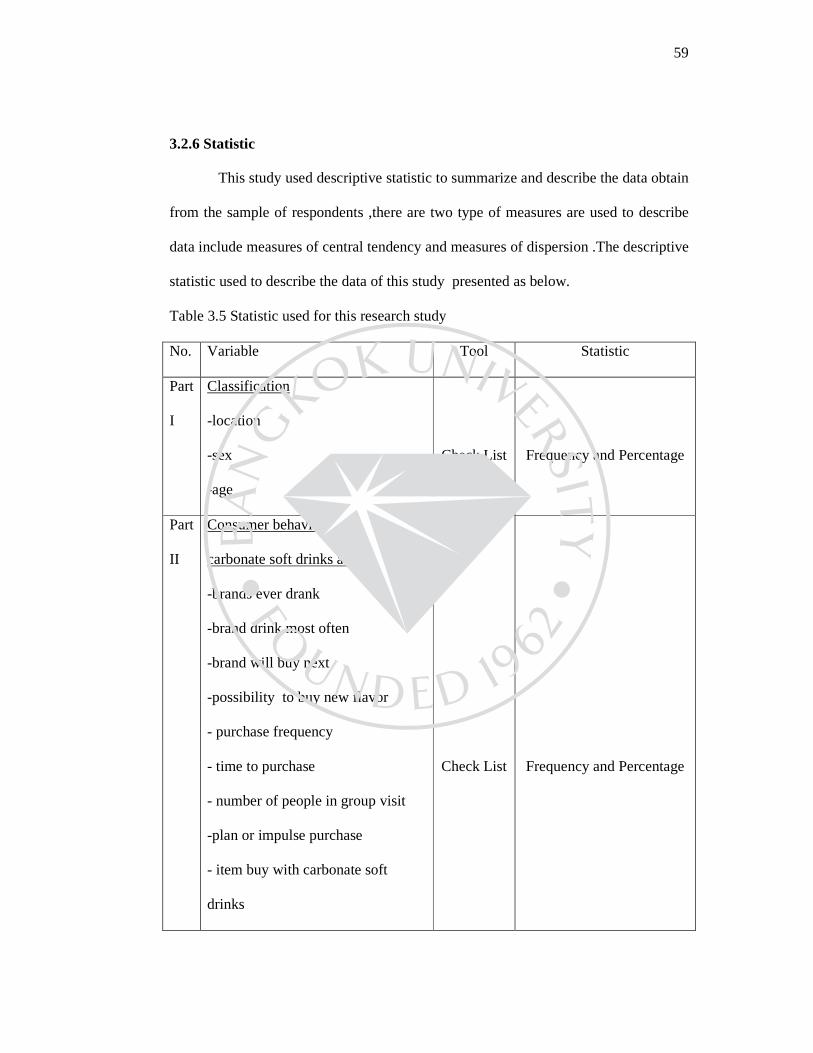
59
3.2.6 Statistic
This study used descriptive statistic to summarize and describe the data obtain
from the sample of respondents ,there are two type of measures are used to describe
data include measures of central tendency and measures of dispersion .The descriptive
statistic used to describe the data of this study presented as below.
Table 3.5 Statistic used for this research study
No. Variable Tool Statistic
Part
I
Classification
-location
-sex
-age
Check List
Frequency and Percentage
Part
II
Consumer behavior towards
carbonate soft drinks at 7-Eleven
-brands ever drank
-brand drink most often
-brand will buy next
-possibility to buy new flavor
- purchase frequency
- time to purchase
- number of people in group visit
-plan or impulse purchase
- item buy with carbonate soft
drinks
Check List
Frequency and Percentage
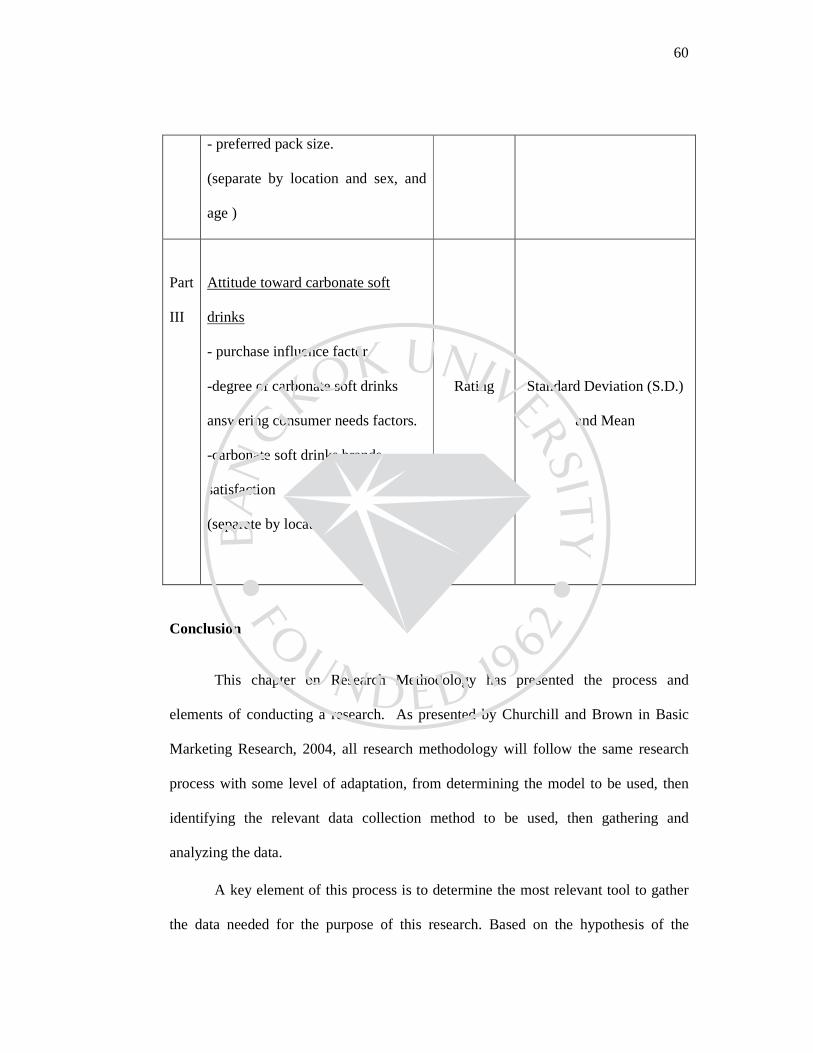
60
- preferred pack size.
(separate by location and sex, and
age )
Part
III
Attitude toward carbonate soft
drinks
- purchase influence factor
-degree of carbonate soft drinks
answering consumer needs factors.
-carbonate soft drinks brands
satisfaction
(separate by location, sex, age )
Rating
Standard Deviation (S.D.)
and Mean
Conclusion
This chapter on Research Methodology has presented the process and
elements of conducting a research. As presented by Churchill and Brown in Basic
Marketing Research, 2004, all research methodology will follow the same research
process with some level of adaptation, from determining the model to be used, then
identifying the relevant data collection method to be used, then gathering and
analyzing the data.
A key element of this process is to determine the most relevant tool to gather
the data needed for the purpose of this research. Based on the hypothesis of the
61
researcher, the research tool will be considered Exploratory, Descriptive, or Causal.
An exploratory research will be used if, for example, there is a need to gather more
general insight in particular phenomenon. A descriptive research will focuses on
detailing and quantifying a group, panel, cohort or phenomenon. Finally, a causal
research will focuses on the why of a behavior, trying to determine causes and effects.
This selection of the relevant research method leads to the data that needs to
be captured. The data can be already existing and available, having been gathered for
a similar study, or a different studies that’s data is still relevant for use for this
particular purpose. This will be called secondary data. Should no data be available,
then the need arise to gather the necessary data, which will be called Primary Data.
The need to gather primary data leads to the design of a primary data
collection tool. Kotler and Keller (2006) have identified the three main research
instruments in collecting primary data: questionnaires, qualitative measures and
mechanical device. Based on the research, for the purpose of this study, it is a
questionnaire that has been selected as the primary data tool to be used to gather the
primary data.
As presented by the research methodology, the use of a questionnaire means
selecting a target population, a sampling frame and sampling procedure, to finally
determine whether the sample should be a probability sample or nonprobability
sample. The probability sample will assume that every member of the population has
an identical chance of selection, while the nonprobability sample will select particular
individuals within the targeted group, thus carrying a certain level of error. All these
elements come together to determine the sample seized needed and will determine
how the data will be used and analyzed.

62
This process is combined together to prepare the concept framework that is
used for driving the research that is supporting this current study.
63
CHAPTER 4
DATA PRESENTATION
In this chapter, detailed information acquired from the questionnaire survey is
presented according to the research objectives. The research objective is to study the
consumer's attitude and consumer behavior toward carbonate soft drinks at 7-Eleven,
separate by locations, gender and age. The results presentation consists of 3 parts as
follows.
4.1 The results of customer’s demographic data by using descriptive statistic
and presented value in frequency and percentage.
4.2 The results of consumer’s behavior toward carbonate soft drinks at 7-
Eleven by using descriptive statistic, presented values in frequency and percentage.
4.3 The results of consumer’s attitude towards carbonate soft drinks by using
the descriptive statistic and presented in mean value for purchase influential factor,
using mean, standard deviation (S.D.) and translate meaning for consumer’s
perception and brand satisfaction.

64
4.1 The results of customer’s demographic data by using descriptive (Frequency
and Percentage)
Table 4.1 Number and Percentage of Respondents by Location Location
No. of respondents
Percentage
Siam Paragon
114 28.5
Muangthong Thanee
131 32.8
Chachoengsao
155 38.8
Total
400 100.0
Table 4.1 presents the results of the survey by number of respondents by location. The
result shows the split between the 3 locations of the 7-11 stores surveyed in Siam
Paragon, Muangthong Thanee and Chachoengsao. The number of respondents is 400
people. The 7-11 in Chachoengsao had the largest number of respondents with 155 or
38.8% of the sample, while the store in Siam Paragon had the smallest number of
respondents with 28.5%.
Table 4.2 Number and Percentage of respondents by Gender
Gender No. of respondent Percentage
Male 216 54
Female 184 46
Total 400 100
Table 4.2 presents the results of the survey by the gender of the respondents. Out of
the 400 respondents surveyed, 184 or 46% were female, compared to 216 or 54% for
male.
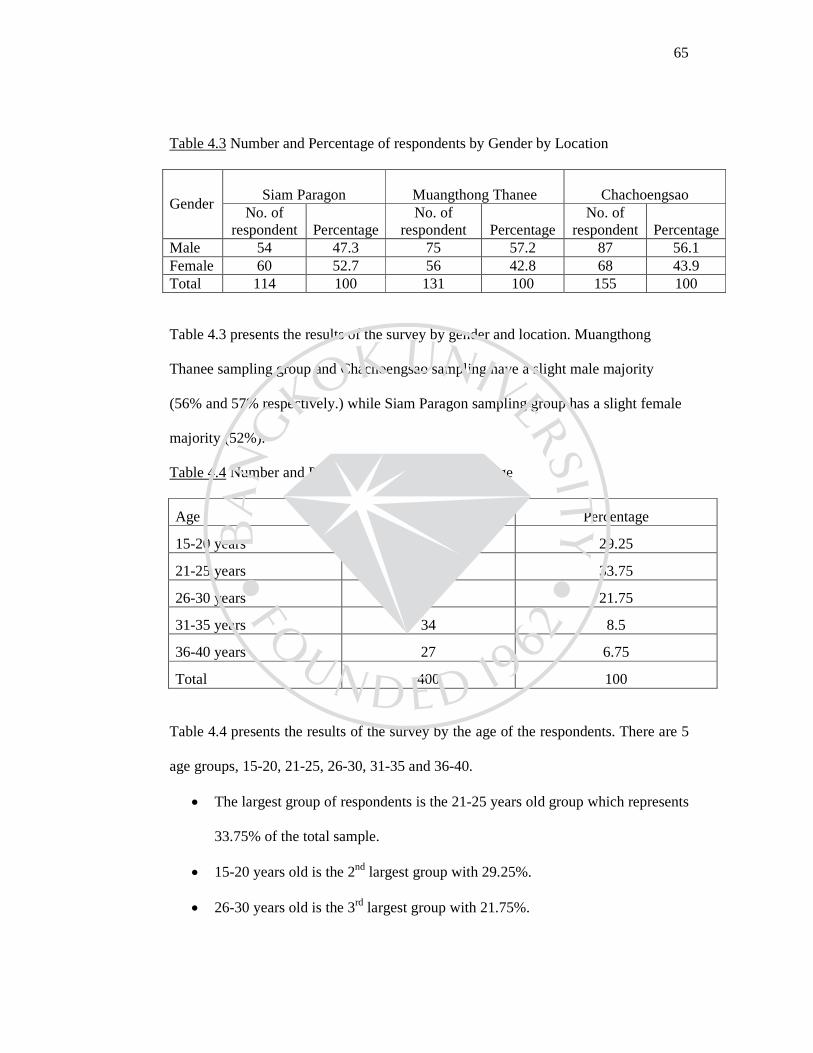
65
Table 4.3 Number and Percentage of respondents by Gender by Location
Siam Paragon Muangthong Thanee Chachoengsao Gender
No. of respondent Percentage
No. of respondent Percentage
No. of respondent Percentage
Male 54 47.3 75 57.2 87 56.1 Female 60 52.7 56 42.8 68 43.9 Total 114 100 131 100 155 100
Table 4.3 presents the results of the survey by gender and location. Muangthong
Thanee sampling group and Chachoengsao sampling have a slight male majority
(56% and 57% respectively.) while Siam Paragon sampling group has a slight female
majority (52%).
Table 4.4 Number and Percentage of respondents by Age
Age No. of respondent Percentage
15-20 years 117 29.25
21-25 years 135 33.75
26-30 years 87 21.75
31-35 years 34 8.5
36-40 years 27 6.75
Total 400 100
Table 4.4 presents the results of the survey by the age of the respondents. There are 5
age groups, 15-20, 21-25, 26-30, 31-35 and 36-40.
• The largest group of respondents is the 21-25 years old group which represents
33.75% of the total sample.
• 15-20 years old is the 2nd largest group with 29.25%.
• 26-30 years old is the 3rd largest group with 21.75%.

66
• Combined together, theses 3 groups represent the majority of the total sample
with an overall 84.75% of the total number of respondents.
Table 4.5 Number and Percentage of respondents by Age by Location
Table 4.5 presents the results of the survey by age class and percentage. This enables
us to study the relative distribution of each age group by location.
• In Siam Paragon, the 1st largest group is the 26-30 years old age group with
32% of respondents. The 2nd group is the 15-20 years old group with 28.9%.
Combined together, the 15 to 30 years old segment represent 80% of
respondents for this location.
• In Muangthong Thanee, the 1st largest group is the 21-25 years old age group
with 53.4% of respondents. The 2nd group is the 15-20 years old group.
Combined together, the 15 to 25 years old segment represent 81% of total
respondents.
Siam Paragon
Muangthong Thanee
Chachoengsao Age
No. of respondents
Percentage No. of
respondents Percentage
No. of respondents
Percentage
15-20 years
33 28.9 37 28.2 47 30.3
21-25 years
23 20.1 70 53.4 42 27
26-30 years
37 32.4 13 9.9 37 23.9
31-35 years
13 11.4 6 4.6 15 9.7
36-40 years
8 7.2 5 3.9 14 9.1
Total 114 100 131 100 155 100
67
• In Chachoengsao, the 1st largest group is the 15-20 years old age group with
30% of respondents. The 2nd group is the 21-25 years old group with 27%.
Combined together, the 15 to 30 years old segment represent 81% of
respondents for this location.
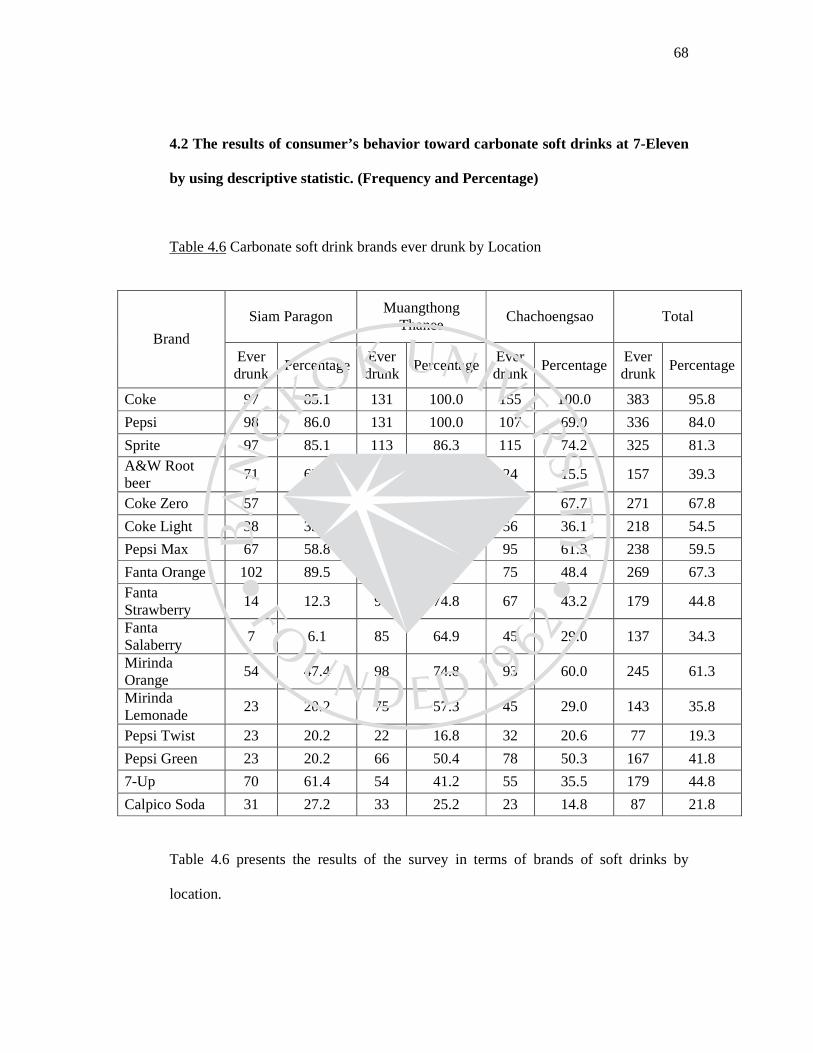
68
4.2 The results of consumer’s behavior toward carbonate soft drinks at 7-Eleven
by using descriptive statistic. (Frequency and Percentage)
Table 4.6 Carbonate soft drink brands ever drunk by Location
Siam Paragon
Muangthong Thanee
Chachoengsao Total
Brand Ever drunk
Percentage Ever drunk
Percentage Ever drunk
Percentage Ever drunk
Percentage
Coke 97 85.1 131 100.0 155 100.0 383 95.8
Pepsi 98 86.0 131 100.0 107 69.0 336 84.0
Sprite 97 85.1 113 86.3 115 74.2 325 81.3 A&W Root beer
71 62.3 62 47.3 24 15.5 157 39.3
Coke Zero 57 50.0 109 83.2 105 67.7 271 67.8
Coke Light 38 33.3 124 94.7 56 36.1 218 54.5
Pepsi Max 67 58.8 76 58.0 95 61.3 238 59.5
Fanta Orange 102 89.5 92 70.2 75 48.4 269 67.3 Fanta Strawberry
14 12.3 98 74.8 67 43.2 179 44.8
Fanta Salaberry
7 6.1 85 64.9 45 29.0 137 34.3
Mirinda Orange
54 47.4 98 74.8 93 60.0 245 61.3
Mirinda Lemonade
23 20.2 75 57.3 45 29.0 143 35.8
Pepsi Twist 23 20.2 22 16.8 32 20.6 77 19.3
Pepsi Green 23 20.2 66 50.4 78 50.3 167 41.8
7-Up 70 61.4 54 41.2 55 35.5 179 44.8
Calpico Soda 31 27.2 33 25.2 23 14.8 87 21.8 Table 4.6 presents the results of the survey in terms of brands of soft drinks by
location.

69
There are 16 different types of soft drinks surveyed, covering the soft drinks on offer
at 7-11. They are Coke, Coke Zero, Coke Light, Fanta Orange, Fanta Strawberry,
Fanta Salaberry, Sprite, Pepsi, Pepsi Max, Pepsi Twist, Pepsi Green, 7-Up, Mirinda
Orange, Mirinda Lemonade, Calpico Soda and A&W root beer.
• Coke is the overall most ever drink across all locations with 383 people having
ever drunk it, or 95.8% of the total respondents.
• Pepsi is the 2nd overall most ever drink across all locations with 336 people
having ever drunk it, or 84% of the total respondents.
• On the other end of the spectrum, Pepsi Twist and Calpico Soda are the lowest
ever drunk, with 77 respondents or 19.3% and 87 respondents or 21.8%.
• When looking across locations some brands emerged as being clearly more
popular in some location rather than some others.
• Coke Zero has been ever experienced by 83% of respondents in Muangthong
Thanee, compared to an average of 67% across the 3 surveyed sites.
• Coke Light has been ever experienced by 94.7% of respondents in
Muangthong Thanee, compared to an average of 54.5% across the 3 surveyed
sites.
• 7-Up has been ever experienced by 61.4% of respondents in Siam Paragon,
compared to an average of 44% across the 3 surveyed sites.
• A&W Root beer has been ever experienced by 62.3% of respondents in Siam
Paragon, compared to an average of 39.3% across the 3 surveyed sites.
• Finally, when looking across locations, some soft drinks brands such as Coke,
Pepsi, Sprite, show even distribution between the 3 reviewed stores.

70
Table 4.7 Carbonate soft drink brands drinking experience by Gender
Table 4.7 presents the results of the survey in terms of brands of soft drinks drunk by
gender.
• 3 brands have more than 75% consumption by both genders, they are Coke, Pepsi
and Sprite, and only 1 brand, Coke, has more than 90% of both genders drinking it,
making it the clear market leader.
• Orange flavored drinks show a clear female preference, with Fanta Orange being
drunk by 85% female vs. 51% male, and Mirinda Orange 76% vs. 48%.
• Only 1 brand, Sprite, has a stronger male than female support, with 85% vs. 76%.
However, this gender preference is not as wide as for Orange flavored drinks.
Male
Female
Brand
Ever drunk Percentage Ever drunk Percentage
Coke 203 94.0 180 97.8
Pepsi 176 81.5 160 87.0
Sprite 185 85.6 140 76.1
A&W Root beer 88 40.7 69 37.5
Coke Zero 142 65.7 129 70.1
Coke Light 118 54.6 100 54.3
Pepsi Max 125 57.9 113 61.4
Fanta Orange 111 51.4 158 85.9
Fanta Strawberry 78 36.1 101 54.9
Fanta Salaberry 48 22.2 89 48.4
Mirinda Orange 104 48.1 141 76.6
Mirinda Lemonade 71 32.9 72 39.1
Pepsi Twist 40 18.5 37 20.1
Pepsi Green 97 44.9 70 38.0
7-Up 74 34.3 105 57.1
Calpico Soda 41 19.0 46 25.0

71
Table 4.8 Carbonate soft drink brands drinking experience by Age
Table 4.8 presents the results of the survey in terms of brands of soft drinks drunk by
age groups.
• Coke is represented in every age segment as the dominant drink ever drunk,
from a low of 85% in the 31-35 age group to 100% in both 15-20 years old
and 36-40 years old.
• It s immediate competitor, Pepsi, has only ever been drunk by 50% of the 31-
35 age groups o a highest level of 92% for the 36-40 years old group.
15-20 years
21-25 years
26-30 years
31-35 years
36-40 years
Brand
Ever drun
k
Percentage
Ever drunk
Percentage
Ever drunk
Percentage
Ever drun
k
Percentage
Ever drun
k
Percentage
Coke 113 96.6 135 100.0 79 90.8 29 85.3 27 100.0 Pepsi 102 87.2 117 86.7 75 86.2 17 50.0 25 92.6 Sprite 99 84.6 105 77.8 68 78.2 27 79.4 26 96.3 A&W Root beer 35 29.9 52 38.5 48 55.2 11 32.4 11 40.7 Coke Zero 78 66.7 111 82.2 53 60.9 15 44.1 14 51.9 Coke Light 60 51.3 102 75.6 41 47.1 11 32.4 4 14.8 Pepsi Max 88 75.2 62 45.9 57 65.5 16 47.1 15 55.6 Fanta Orange 112 95.7 100 74.1 28 32.2 13 38.2 16 59.3 Fanta Strawberry 51 43.6 94 69.6 13 14.9 7 20.6 14 51.9 Fanta Salaberry 31 26.5 71 52.6 14 16.1 6 17.6 15 55.6 Mirinda Orange 73 62.4 118 87.4 30 34.5 10 29.4 14 51.9 Mirinda Lemonade 41 35.0 69 51.1 11 12.6 8 23.5 14 51.9 Pepsi Twist 27 23.1 28 20.7 14 16.1 6 17.6 2 7.4 Pepsi Green 66 56.4 66 48.9 27 31.0 5 14.7 3 11.1 7-Up 69 59.0 49 36.3 33 37.9 13 38.2 15 55.6 Calpico Soda 16 13.7 23 17.0 30 34.5 6 17.6 12 44.4
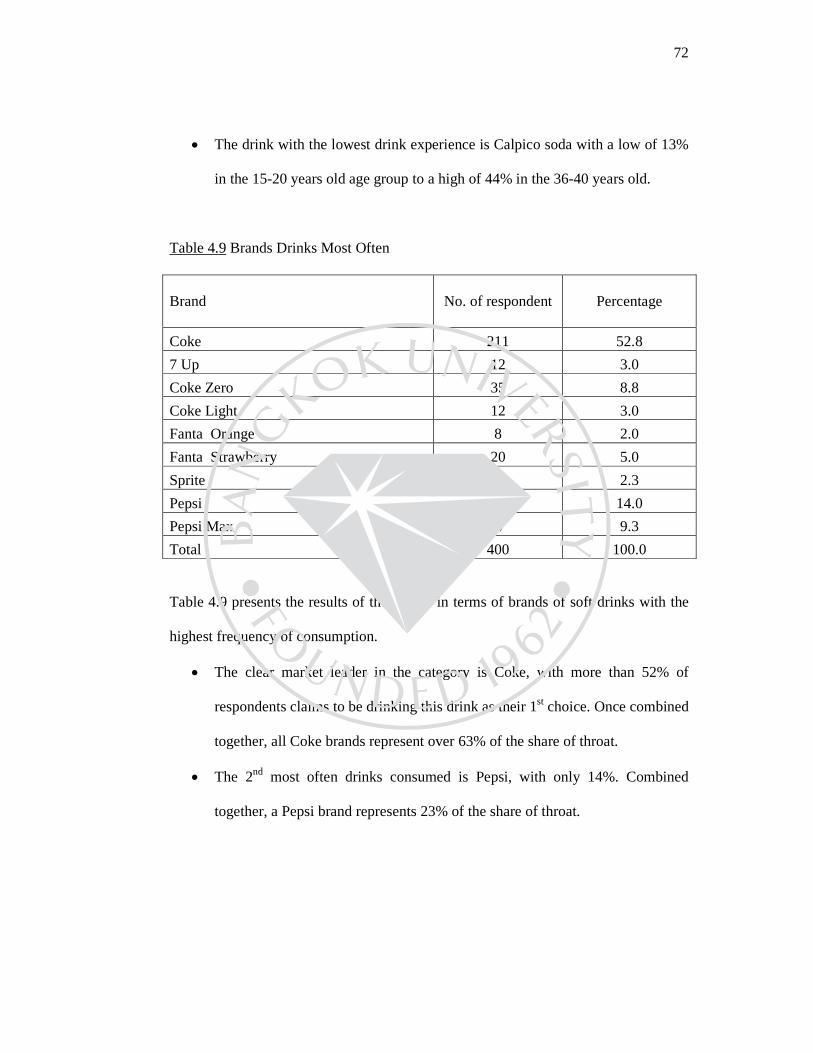
72
• The drink with the lowest drink experience is Calpico soda with a low of 13%
in the 15-20 years old age group to a high of 44% in the 36-40 years old.
Table 4.9 Brands Drinks Most Often
Table 4.9 presents the results of the survey in terms of brands of soft drinks with the
highest frequency of consumption.
• The clear market leader in the category is Coke, with more than 52% of
respondents claims to be drinking this drink as their 1st choice. Once combined
together, all Coke brands represent over 63% of the share of throat.
• The 2nd most often drinks consumed is Pepsi, with only 14%. Combined
together, a Pepsi brand represents 23% of the share of throat.
Brand
No. of respondent
Percentage
Coke 211 52.8
7 Up 12 3.0
Coke Zero 35 8.8
Coke Light 12 3.0
Fanta Orange 8 2.0
Fanta Strawberry 20 5.0
Sprite 9 2.3
Pepsi 56 14.0
Pepsi Max 37 9.3
Total 400 100.0

73
Table 4.10 Brands Drinks Most Often by Location
Table 4.10 presents the results of the survey in terms of brands of soft drinks most
often drunk by location.
• In Siam Paragon, respondents most often drink Pepsi, chosen by 35% of
respondents.
• In Muangthong Thanee, respondents most often drink Coke, chosen by 77% of
respondents.
• In Chachoengsao, respondents most often drink Coke, chosen by 49.7% of
respondents.
Siam Paragon
Muangthong Thanee
Chachoengsao
Brand No. of
respondents Percentage
No. of respondents
Percentage No. of
respondents Percentage
Coke 33 28.9 101 77.1 77 49.7 7 Up 0 0.0 0 0.0 12 7.7 Coke Zero 0 0.0 25 19.1 10 6.5 Coke Light
7 6.1 5 3.8 0 0.0
Fanta Orange
8 7.0 0 0.0 0 0.0
Fanta Strawberry
0 0.0 0 0.0 20 12.9
Sprite 1 0.9 0 0.0 8 5.2 Pepsi 40 35.1 0 0.0 16 10.3 Pepsi Max 25 21.9 0 0.0 12 7.7 Total 114 100.0 131 100.0 155 100.0

74
Table 4.11 Brands Drinks Most Often by Gender
Table 4.11 presents brand drink most often by genders.
• Male brand drink most often is Coke with 56.9% follow by Pepsi.
• Female brand drink most often is also Coke with 47.8% follow by Coke Zero
with 12.5%
Male
Female
Brand No. of
respondents Percentage
No. of respondents
Percentage
Coke 123 56.9 88 47.8 7 Up 3 1.4 9 4.9 Coke Zero 12 5.6 23 12.5 Coke Light 12 5.6 0 0.0 Fanta Orange 3 1.4 5 2.7 Fanta Strawberry 5 2.3 15 8.2 Sprite 3 1.4 6 3.3 Pepsi 36 16.7 20 10.9 Pepsi Max 19 8.8 18 9.8 Total 216 100.0 184 100.0

75
Table 4.12 Brands Drinks Most Often by Age
15-20 years
21-25 years 26-30 years 31-35 years 36-40 years
Brand No. of respo
n-dents
Percen-tage
No. of respon-dents
Percen-tage
No. of respo
n-dents
Percen
-tage
No. of respo
n-dents
Percentage
No. of respo
n-dents
Percen-tage
Coke 74 63.2 74 54.8 44 50.6 4 11.8 15 55.6
7 Up 0 0.0 0 0.0 11 12.6 0 0.0 1 3.7
Coke Zero 0 0.0 30 22.2 0 0.0 3 8.8 2 7.4
Coke Light 11 9.4 0 0.0 0 0.0 1 2.9 0 0.0
Fanta Orange
7 6.0 1 0.7 0 0.0 0 0.0 0 0.0
Fanta Strawberry
0 0.0 10 7.4 10 11.5 0 0.0 0 0.0
Sprite 0 0.0 8 5.9 1 1.1 0 0.0 0 0.0
Pepsi 4 3.4 10 7.4 13 14.9 20 58.8 9 33.3
Pepsi Max 21 17.9 2 1.5 8 9.2 6 17.6 0 0.0
Total 117 100.0 135 100.0 87 100.0 34 100.0 27 100.0
Table 4.12 presents brand drinks most often by age group.
• Brand drink most often in all age groups is Coke except in age group 31-35
years old, they drinks most often for a Pepsi brand.
• 2nd brand drink most often in age group 15-20 and 31-35 years old is Pepsi
Max with 17.9%and 17.6%
• 2nd brand drink most often in age group 21-25 years old is Coke Zero with
22.2%
• 2nd brand drink most often in age group 26-30 and 36-40 years old is Pepsi
with 14.9%and 33.3%

76
Table 4.13 Brands will buy next
Brand No. of respondents Percentage
Coke 189 47.3
Pepsi Green 7 1.8
7 Up 12 3.0
A&W Root beer 10 2.5
Coke Zero 21 5.3
Coke Light 26 6.5
Fanta Orange 8 2.0
Fanta Strawberry 10 2.5
Fanta Salaberry 8 2.0
Sprite 24 6.0
Pepsi 56 14.0
Pepsi Max 29 7.3
Total 400 100.0
Overall, Coke is the brand with the highest next purchase intention with 47% of
purchase intention. Pepsi is 2nd but far behind with only 14% of next purchase
intention.

77
Table 4.14 Brands will buy next separate by Location
Location
Siam Paragon
Muangthong
Thanee
Chachoengsao
Brand
No. of respon-
dent
Percen-tage
No. of respon-
dent
Percen-tage
No. of respon-
dent
Percen-tage
Coke 33 28.9 69 52.7 87 56.1
Pepsi Green 0 0.0 7 5.3 0 0.0
7 Up 0 0.0 0 0.0 12 7.7
A&W Root beer 0 0.0 0 0.0 10 6.5
Coke Zero 0 0.0 21 16.0 0 0.0
Coke Light 7 6.1 19 14.5 0 0.0
Fanta Orange 8 7.0 0 0.0 0 0.0
Fanta Strawberry 0
0.0 0 0.0
10 6.5
Fanta Salaberry 0 0.0 0 0.0 8 5.2
Sprite 9 7.9 15 11.5 0 0.0
Pepsi 40 35.1 0 0.0 16 10.3
Pepsi Max 17 14.9 0 0.0 12 7.7
Total 114 100 131 100 155 100
Table 4.14 presents the results of the survey in terms of brands purchase intention by
location.
• In Siam Paragon, the brand with the highest next purchase intention is Pepsi
with 35% and in close 2nd position is Coke with 28.9% of purchase intention.
• In Muangthong Thanee, the brand with the highest next purchase intention is
Coke with 52% of purchase intention.
• In Chachoengsao, the brand with the highest next purchase intention is Coke
with 56% of purchase intention.
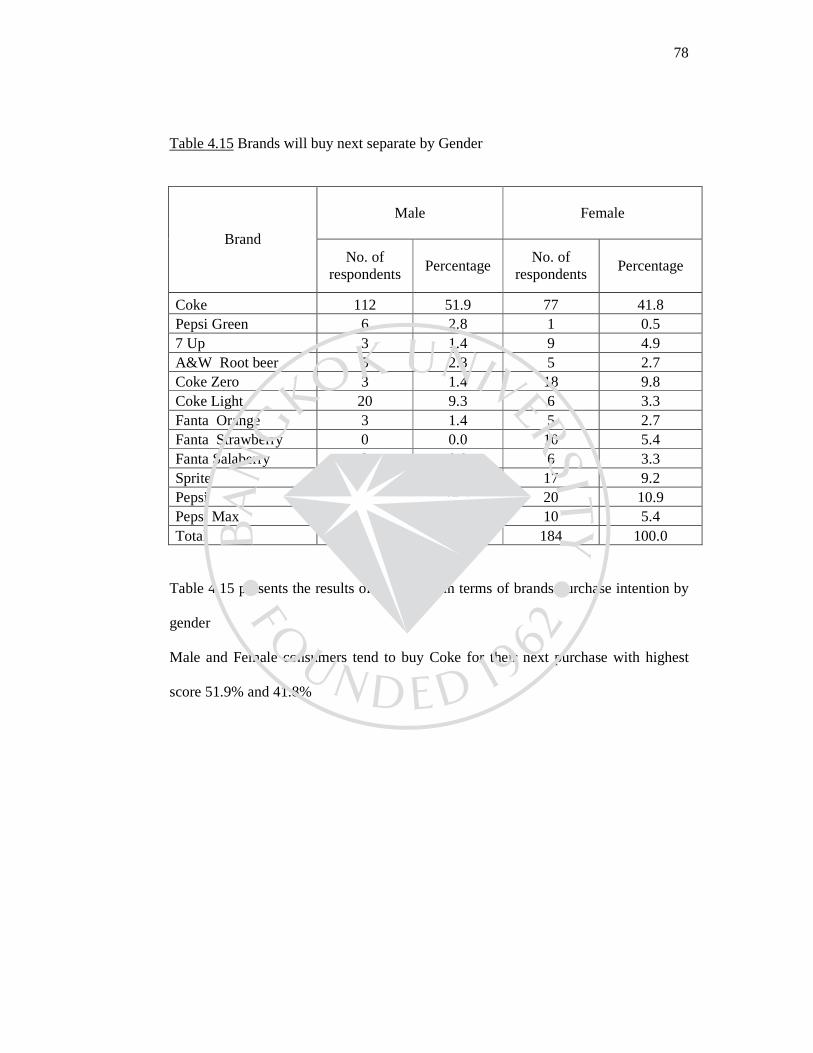
78
Table 4.15 Brands will buy next separate by Gender
Male
Female
Brand
No. of respondents
Percentage No. of
respondents Percentage
Coke 112 51.9 77 41.8 Pepsi Green 6 2.8 1 0.5 7 Up 3 1.4 9 4.9 A&W Root beer 5 2.3 5 2.7 Coke Zero 3 1.4 18 9.8 Coke Light 20 9.3 6 3.3 Fanta Orange 3 1.4 5 2.7 Fanta Strawberry 0 0.0 10 5.4 Fanta Salaberry 2 0.9 6 3.3 Sprite 7 3.2 17 9.2 Pepsi 36 16.7 20 10.9 Pepsi Max 19 8.8 10 5.4 Total 216 100.0 184 100.0
Table 4.15 presents the results of the survey in terms of brands purchase intention by
gender
Male and Female consumers tend to buy Coke for their next purchase with highest
score 51.9% and 41.8%

79
Table 4.16 Brands will buy next separate by Age
15-20 years
21-25 years
26-30 years
31-35 years
36-40 years
Brand No. of
respon-
dents
Percentage
No. of respo
n-dents
Percen-tage
No. of respon-dents
Percen-tage
No. of respo
n-dents
Percen-tage
No. of respo
n-dents
Percen-tage
Coke 57 48.7 74 54.8 44 50.6 2 5.9 12 44.4 Pepsi Green 5 4.3 0 0.0 0 0.0 0 0.0 2 7.4 7 Up 0 0.0 0 0.0 11 12.6 0 0.0 1 3.7 A&W Root beer 0 0.0 0 0.0 10 11.5 0 0.0 0 0.0 Coke Zero 0 0.0 21 15.6 0 0.0 0 0.0 0 0.0 Coke Light 11 9.4 9 6.7 0 0.0 4 11.8 2 7.4 Fanta Orange 7 6.0 1 0.7 0 0.0 0 0.0 0 0.0 Fanta Strawberry 0 0.0 10 7.4 0 0.0 0 0.0 0 0.0 Fanta Salaberry 0 0.0 8 5.9 0 0.0 0 0.0 0 0.0 Sprite 18 15.4 0 0.0 1 1.1 4 11.8 1 3.7 Pepsi 4 3.4 10 7.4 13 14.9 20 58.8 9 33.3 Pepsi Max 15 12.8 2 1.5 8 9.2 4 11.8 0 0.0 Total 117 100.0 135 100.0 87 100.0 34 100.0 27 100.0
Table 4.16 presents the results of the survey in terms of brands purchase intention by
age group
• Consumers in all age group tend to buy Coke for the next purchase except in
age group 31-35 years old; they tend to buy Pepsi for the next purchase.
• Sprite is the 2nd brand that consumer in age group 15-20 years old tend to buy
for the next purchase with 15.4 %
• Coke Zero is the 2nd brand that consumer in age group 21-25 years old tend to
buy for the next purchase with 15.6%
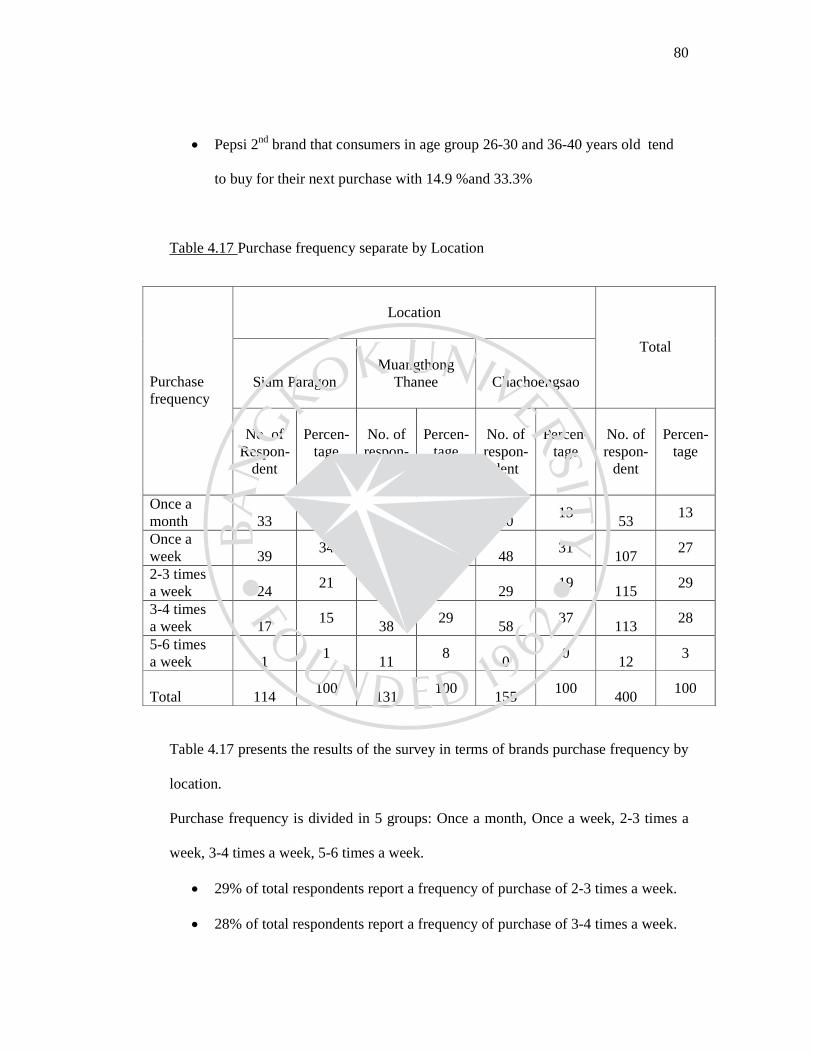
80
• Pepsi 2nd brand that consumers in age group 26-30 and 36-40 years old tend
to buy for their next purchase with 14.9 %and 33.3%
Table 4.17 Purchase frequency separate by Location
Table 4.17 presents the results of the survey in terms of brands purchase frequency by
location.
Purchase frequency is divided in 5 groups: Once a month, Once a week, 2-3 times a
week, 3-4 times a week, 5-6 times a week.
• 29% of total respondents report a frequency of purchase of 2-3 times a week.
• 28% of total respondents report a frequency of purchase of 3-4 times a week.
Location
Siam Paragon
Muangthong
Thanee
Chachoengsao
Total
Purchase frequency
No. of Respon-
dent
Percen-
tage
No. of respon-
dent
Percen- tage
No. of respon-
dent
Percen- tage
No. of respon-
dent
Percen- tage
Once a month 33
29 0
0 20
13 53
13
Once a week 39
34 20
15 48
31 107
27
2-3 times a week 24
21 62
47 29
19 115
29
3-4 times a week 17
15 38
29 58
37 113
28
5-6 times a week 1
1 11
8 0
0 12
3
Total 114
100 131
100 155
100 400
100

81
• 27% of total respondents report a frequency of purchase of once a week.
• Taken together, this show that 74% of respondents drink at least 1 soft drink
once a week
Table 4.18 Purchase frequency separate by Gender
Table 14.18 presents the results of the survey in terms of brands of soft drinks
frequency of purchase by Gender.
• Male respondents show a highest frequency of purchase of 2-3 times per week
(33% of respondents), with close to 90% of respondents showing a frequency
of purchase of at least once a week.
• Female respondents show a highest frequency of purchase of once a week,
(28% of respondents) with 85% of respondents purchasing at least once a
week, a result slightly lower than male respondents.
Male
Female
Purchase frequency
No. of respondents
Percentage No. of
respondents Percentage
Once a month 25 11.6 28 15.2 Once a week 55 25.5 52 28.3 2-3 times a week 72 33.3 43 23.4 3-4 times a week 63 29.2 50 27.2 5-6 times a week 1 0.5 11 6.0 Total 216 100 184 100
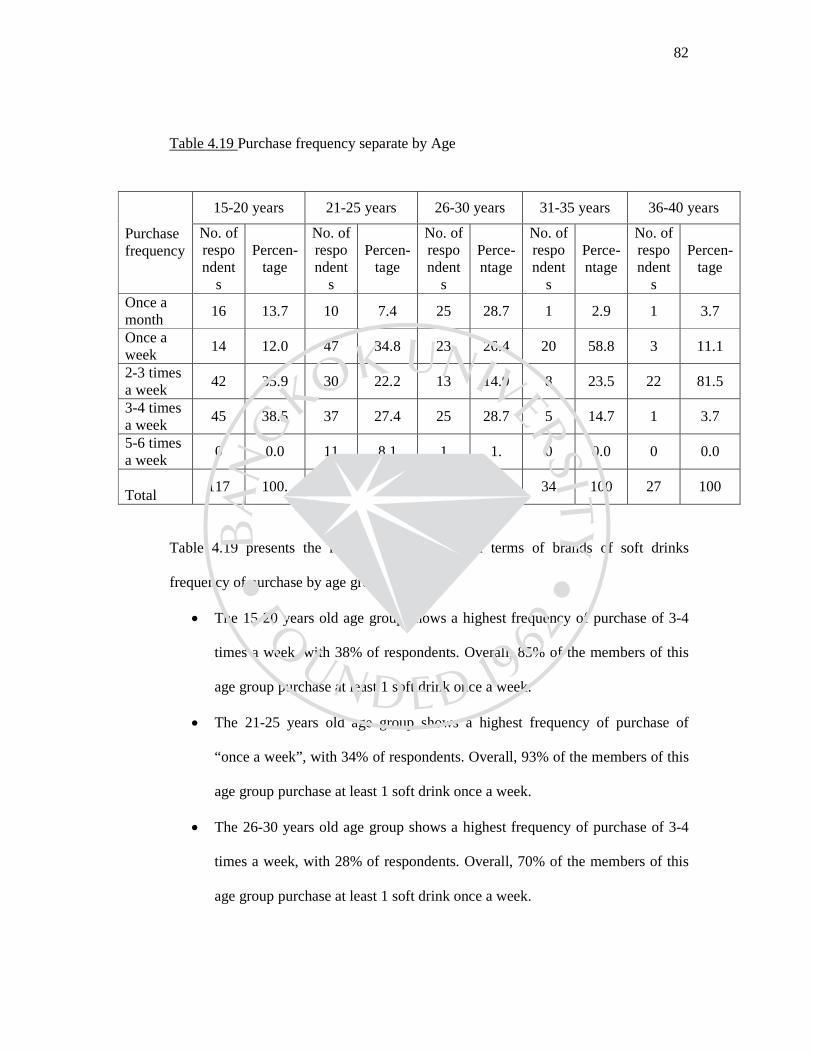
82
Table 4.19 Purchase frequency separate by Age
Table 4.19 presents the results of the survey in terms of brands of soft drinks
frequency of purchase by age group.
• The 15-20 years old age group shows a highest frequency of purchase of 3-4
times a week, with 38% of respondents. Overall, 85% of the members of this
age group purchase at least 1 soft drink once a week.
• The 21-25 years old age group shows a highest frequency of purchase of
“once a week”, with 34% of respondents. Overall, 93% of the members of this
age group purchase at least 1 soft drink once a week.
• The 26-30 years old age group shows a highest frequency of purchase of 3-4
times a week, with 28% of respondents. Overall, 70% of the members of this
age group purchase at least 1 soft drink once a week.
15-20 years 21-25 years 26-30 years 31-35 years 36-40 years
Purchase frequency
No. of respondent
s
Percen- tage
No. of respondent
s
Percen- tage
No. of respondent
s
Perce-ntage
No. of respondent
s
Perce-ntage
No. of respondent
s
Percen- tage
Once a month
16 13.7 10 7.4 25 28.7 1 2.9 1 3.7
Once a week
14 12.0 47 34.8 23 26.4 20 58.8 3 11.1
2-3 times a week
42 35.9 30 22.2 13 14.9 8 23.5 22 81.5
3-4 times a week
45 38.5 37 27.4 25 28.7 5 14.7 1 3.7
5-6 times a week
0 0.0 11 8.1 1 1. 0 0.0 0 0.0
Total
117 100. 135 100. 87 100 34 100 27 100

83
• The 31-35 years old age group shows a highest frequency of purchase of
“once” a week, with 58% of respondents. Overall, 72% of the members of this
age group purchase at least 1 soft drink once a week.
• The 36-40 years old age group shows a highest frequency of purchase of 2-3
times a week, with 81% of respondents. Overall, 97% of the members of this
age group purchase at least 1 soft drink once a week.
Table 4.20 Time Purchase separate by Location
Location
Siam Paragon
Muangthong Thanee
Chachoengsao
Total Time
purchase No. of respon-
dent
Percen- tage
No. of respon-
dent
Percen- tage
No. of respon-
dent
Percen- tage
No. of Respon-
dent
Percen- tage
Before 9.00 hrs 0 0.0 0 0.0 8 5.2 8 2.0 9.00-12.00 hrs 0 0.0 38 29.0 50 32.3 88 22.0 12.00-15.00 hrs 57 50.0 58 44.3 30 19.4 145 36.3 15.00-18.00 hrs 17 14.9 20 15.3 34 21.9 71 17.8 18.00 hrs later 40 35.1 15 11.5 33 21.3 88 22.0 Total 114 100.0 131 100.0 155 100.0 400 100.0
Table 4.20 presents the results of the survey in terms time of purchase by location.
The day is divided in 5 segments: before 9h, 9h-12h, 12h-15h, 15h-18h and after 18h.
• Siam Paragon respondents mostly make their purchase in the 12h-15h segment,
50% of time. The 2nd answer is after 18h, with 35% of purchases.

84
• Muangthong Thanee respondents mostly make their purchase in the 12h-15h
segment 44% of time. The 2nd answer is 9h-12h segment, with 29% of
purchases.
• Chachoengsao respondents mostly make their purchases in the 9h-12h
segment with 32% of purchase, the segments 15-18 and after 18h showing an
almost similar frequency of 21% of purchases.
• On an overall look, the prime time for purchase is the 12h-15h segment, with
36% of frequency. The 9h-12h segment and after 18h segment show equal
weight with 22%. The lowest segment is the before 9h with only 2% of
purchase being made.
Table 4.21 Number of people in group when shopping for carbonates soft drinks at 7-
Eleven separate by Location
Location
Siam Paragon Muangthong
Thanee Chachoengsao
Total People in group visit
No. of respon-
dent
Percen- tage
No. of respon-
dent
Percen- tage
No. of respon-
dent
Percen- tage
No. of respon-
dent
Percen-
tage
Alone 82 71.9 22 16.8 78 50.3 182 45.5 2-3 peoples 32 28.1 51 38.9 43 27.7 126 31.5 3-5 peoples 0 0.0 58 44.3 34 21.9 92 23.0 Total 114 100.0 131 100.0 155 100.0 400 100.0

85
Table 4.21 presents the results of the survey in terms of number of people in group
when shopping for carbonate soft drinks by location. The responses are divided in 3
groups: Alone, 2-3 people, 3-5 people.
• In Siam Paragon, 71.9% of people have made their purchase alone.
• In Muangthong Thanee, 44% of respondents have made their purchase while
in a group of 3-5 people.
• In Chachoengsao, 50% of people have made their purchase alone.
Overall, 45% of purchases of soft drinks are made alone.
Table 4.22 Planed or Unplanned purchase separate by Location
Location
Siam Paragon
Muangthong Thanee
Chachoengsao
Total
Purchase Planning
No. of respon-
dent
Percen- tage
No. of respon-
dent
Percen- tage
No. of respon-
dent
Percen- tage
No. of respon-
dent
Percen-
tage
Planed 42 36.8 16 12.2 69 44.5 127 31.8 Unplanned 72 63.2 115 87.8 86 55.5 273 68.3 Total 114 100.0 131 100.0 155 100.0 400 100.0
Table 4.22 presents the results of the survey in terms of whether the purchase is
planned or unplanned by location.
Across location, 68% of purchases are unplanned, ranging from 87% of unplanned
purchases in Muangthong Thanee, to 63% of unplanned in Siam Paragon, to 55% of
unplanned purchases in Chachoengsao.

86
Table 4.23 Planed or Unplanned purchase separate by Gender
Table 4.23 presents the results of the survey in terms of whether the purchase is
planned or unplanned by Gender.
Both Male and Female make a purchase without planning before with 69% and 66.8%
Table 4.24 Planed or Unplanned purchase separate by Age
Table 4.24 presents the results of the survey in terms of whether the purchase is
planned or unplanned by Age.
• About 70% of Consumer age group 15-30 years old have unplanned purchase.
• 67% of consumer age 31-35 years old have planed purchase
Male Female Planed or Unplanned No. of respondents Percentage No. of respondents Percentage
Planed 66 30.6 61 33.2
Unplanned 150 69.4 123 66.8
Total 216 100.0 184 100.0
15-20 years 21-25 years 26-30 years 31-35 years 36-40 years
Planed or Unplanned
No. of respo
n-dents
Perce-ntage
No. of respon-dents
Perce-ntage
No. of respo
n-dents
Perce-ntage
No. of respon- dents
Perce-ntage
No. of respo
n-dents
Perce- ntage
Planed 34 29.1 27 20.0 30 34.5 23 67.6 13 48.1
Unplanned 83 70.9 108 80.0 57 65.5 11 32.4 14 51.9
Total 117 10 135 100 87 100 34 100 27 100

87
Table 4.25 Item purchase with Carbonate soft drinks separate by Location
Table 4.25 presents the results of the survey in terms of combined purchase of item
with a soft drink by location.
There are 5 categories of items presented: Frozen Food, Snack, Magazine/Newspaper,
Bread/Hot dog bar, and other.
Across location the main item purchased with a soft drink is Snack, in 47% of answer.
The 2nd item is Bread/Hot dog bar with 34% of answers.
Location
Siam Paragon
Muangthong Thanee
Chachoengsao
Total
Items No. of respon-
dent
Percen- tage
No. of respon-
dent
Percen- tage
No. of respon-
dent
Percen- tage
No. of respon-
dent
Percen- tage
Frozen Food
8
7.0
5
3.8
0
0.0
13
3.3
Snack
55
48.2
51
38.9
85
54.8
191
47.8
Magazine /Newspaper
17
14.9
24
18.3
0
0.0
41
10.3
Bread/Hot dog bar
25
21.9
51
38.9
60
38.7
136
34.0
Other
9
7.9
0
0.0
10
6.5
19
4.8
Total
114
100.0
131
100.0
155
100.0
400
100.0

88
Table 4.26 Item purchase with Carbonate soft drinks separate by Gender
Male Female Item purchase with CSD
No. of respondents Percentage No. of respondents Percentage
Frozen Food 5 2.3 8 4.3
Snack 94 43.5 97 52.7
Magazine/Newspaper 30 13.9 11 6.0
Bread/Hot dog bar 68 31.5 68 37.0
Other 19 8.8 0 0.0
Total 216 100.0% 184 100.0
Table 4.26 presents the results of the survey in terms of combined purchase of item
with a soft drink by Gender.
Male and female tend to buy carbonate soft drinks with Snack and Bread/Hot dog bar
with a score about 80% of total.
Table 4.27 Pack size separate by Location
Table 4.27 presents the results of the pack seized purchase by location.
There are 4 different type of pack seize: 325ml can, 700ml bottle, 1.25 bottle, 2litre
bottle.
Location Siam Paragon
Muangthong
Thanee Chachoengsao
Total
Pack size No. of respon-
dent
Percen- tage
No. of respon-
dent
Percen- tage
No. of respon-
dent
Percen- tage
No. of respon-
dent
Percen- tage
325 ml in can 82 71.9 56 42.7 85 54.8 223 55.8 700 ml in bottle 25 21.9 14 10.7 8 5.2 47 11.8 1.25 liters in bottle 1 0.9 42 32.1 57 36.8 100 25.0 2 liters in bottle 6 5.3 19 14.5 5 3.2 30 7.5 Total 114 100.0 131 100.0 155 100.0 400 100.0

89
Across all location, the 325 can has the highest number of purchase, representing 55%
of answers.
Table 4.28 Pack size separate by Gender
Male Female Pack size No. of
respondents Percentage
No. of respondents
Percentage
325 ml in can 131 60.6 92 50.0
700 ml in bottle 20 9.3 27 14.7
1.25 liters in bottle 49 22.7 51 27.7
2 liters in bottle 16 7.4 14 7.6
Total 216 100.0 184 100.0
Table 4.28 presents the results of the pack size purchase by Gender
Both male and female, the 325 can has the highest number of purchase, representing
60.6% and 50% of answers on male and female.
Table 4.29 Pack size separate by Age
15-20 years
21-25 years 26-30 years 31-35 years 36-40 years
Pack size No. of respondent
s
Perce-ntage
No. of respondent
s
Perce-ntage
No. of respondents
Perce-ntage
No. of respondent
s
Perce-ntage
No. of respon-dents
Perce-ntage
325 ml in can
66 56.4 74 54.8 47 54.0 28 82.4 8 29.6
700 ml in bottle
6 5.1 20 14.8 19 21.8 2 5.9 0 0.0
1.25 liters in bottle
43 36.8 21 15.6 19 21.8 1 2.9 16 59.3
2 liters in bottle
2 1.7 20 14.8 2 2.3 3 8.8 3 11.1
Total 117 100 135 100 87 100 34 100 27 100

90
Table 4.29 presents the results of the pack size purchase by Age
• 15-35 years old consumer, the 325 can has the highest number of purchase,
representing about 55% of answer
• 36-40 years old consumer, the 1.25 liters in bottle has the highest number of
purchase, representing about 59% of answer

91
4.3 The results of attitude towards carbonate soft drinks, using the descriptive
statistic.
• Purchase influence factor : Percentage
• Consumer perception and Brand satisfaction: Mean, Standard Deviation (S.D.)
and Translate meaning.
Table 4.30 Purchase factors considering for shopping carbonate soft drinks
Overall, Taste is the most influential factor of purchase with 32.1% of answer. The 2nd
most influential factor is then Brand with 19.8%, follow by Pricing with 14.5%,
Packaging with 13.6%, Formula with 10.2% and less influential factor is Promotion
with only 9.8 %.
Purchase influence factor Mean Std. Deviation
Brand name 19.8 11.4
Feature/Packaging 13.6 9.4
Taste 32.1 12.3
Formula 10.2 7.8
Price 14.5 8.0
Promotion 9.8 9.7
Total 100.0
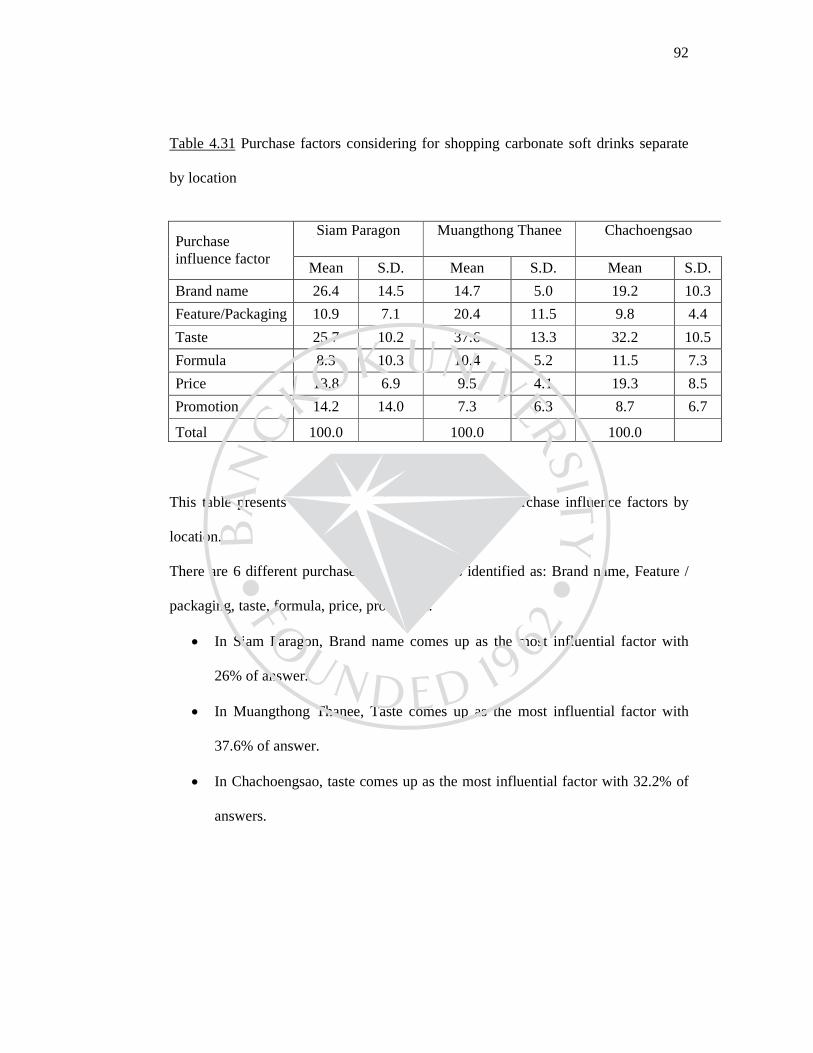
92
Table 4.31 Purchase factors considering for shopping carbonate soft drinks separate
by location
Siam Paragon
Muangthong Thanee
Chachoengsao
Purchase influence factor
Mean S.D. Mean S.D. Mean S.D.
Brand name 26.4 14.5 14.7 5.0 19.2 10.3
Feature/Packaging 10.9 7.1 20.4 11.5 9.8 4.4
Taste 25.7 10.2 37.6 13.3 32.2 10.5
Formula 8.3 10.3 10.4 5.2 11.5 7.3
Price 13.8 6.9 9.5 4.1 19.3 8.5
Promotion 14.2 14.0 7.3 6.3 8.7 6.7
Total 100.0 100.0 100.0
This table presents the results of the survey in terms purchase influence factors by
location.
There are 6 different purchase influence factors identified as: Brand name, Feature /
packaging, taste, formula, price, promotion.
• In Siam Paragon, Brand name comes up as the most influential factor with
26% of answer.
• In Muangthong Thanee, Taste comes up as the most influential factor with
37.6% of answer.
• In Chachoengsao, taste comes up as the most influential factor with 32.2% of
answers.
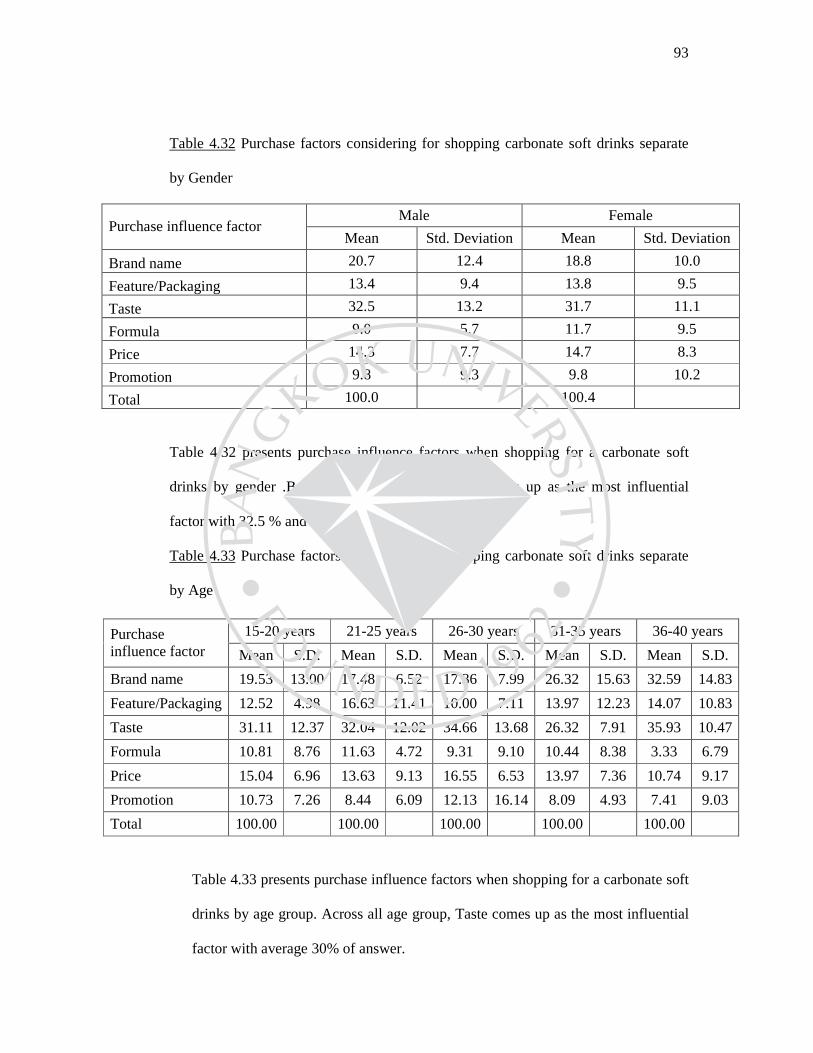
93
Table 4.32 Purchase factors considering for shopping carbonate soft drinks separate
by Gender
Male Female Purchase influence factor
Mean Std. Deviation Mean Std. Deviation
Brand name 20.7 12.4 18.8 10.0
Feature/Packaging 13.4 9.4 13.8 9.5
Taste 32.5 13.2 31.7 11.1
Formula 9.0 5.7 11.7 9.5
Price 14.3 7.7 14.7 8.3
Promotion 9.8 9.3 9.8 10.2
Total 100.0 100.4
Table 4.32 presents purchase influence factors when shopping for a carbonate soft
drinks by gender .Both Male and Female; Taste comes up as the most influential
factor with 32.5 % and 31.7 % of answer.
Table 4.33 Purchase factors considering for shopping carbonate soft drinks separate
by Age
Table 4.33 presents purchase influence factors when shopping for a carbonate soft
drinks by age group. Across all age group, Taste comes up as the most influential
factor with average 30% of answer.
15-20 years 21-25 years 26-30 years 31-35 years 36-40 years Purchase influence factor Mean S.D. Mean S.D. Mean S.D. Mean S.D. Mean S.D.
Brand name 19.53 13.00 17.48 6.52 17.36 7.99 26.32 15.63 32.59 14.83
Feature/Packaging 12.52 4.98 16.63 11.41 10.00 7.11 13.97 12.23 14.07 10.83
Taste 31.11 12.37 32.04 12.02 34.66 13.68 26.32 7.91 35.93 10.47
Formula 10.81 8.76 11.63 4.72 9.31 9.10 10.44 8.38 3.33 6.79
Price 15.04 6.96 13.63 9.13 16.55 6.53 13.97 7.36 10.74 9.17
Promotion 10.73 7.26 8.44 6.09 12.13 16.14 8.09 4.93 7.41 9.03
Total 100.00 100.00 100.00 100.00 100.00
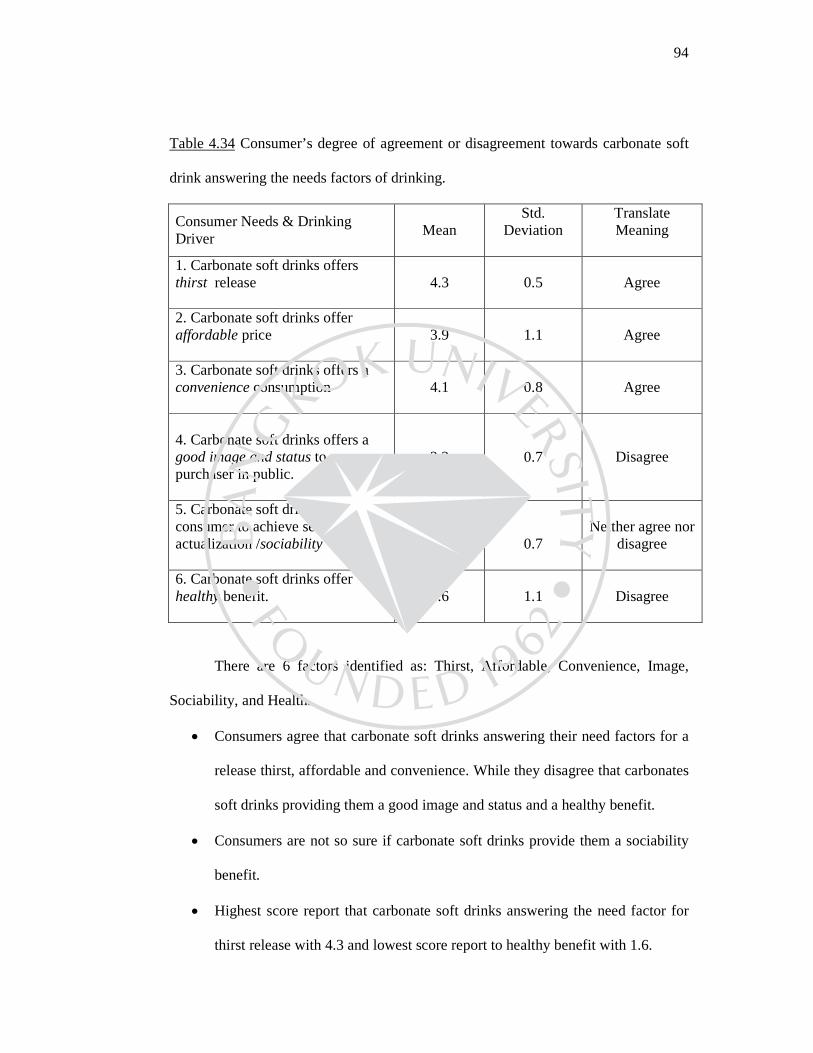
94
Table 4.34 Consumer’s degree of agreement or disagreement towards carbonate soft
drink answering the needs factors of drinking.
Consumer Needs & Drinking Driver
Mean
Std. Deviation
Translate Meaning
1. Carbonate soft drinks offers thirst release
4.3
0.5
Agree
2. Carbonate soft drinks offer affordable price
3.9
1.1
Agree
3. Carbonate soft drinks offers a convenience consumption
4.1
0.8
Agree
4. Carbonate soft drinks offers a good image and status to a purchaser in public.
2.2
0.7
Disagree
5. Carbonate soft drinks offers the consumer to achieve self actualization /sociability
2.8
0.7
Neither agree nor
disagree
6. Carbonate soft drinks offer healthy benefit.
1.6
1.1
Disagree
There are 6 factors identified as: Thirst, Affordable, Convenience, Image,
Sociability, and Health.
• Consumers agree that carbonate soft drinks answering their need factors for a
release thirst, affordable and convenience. While they disagree that carbonates
soft drinks providing them a good image and status and a healthy benefit.
• Consumers are not so sure if carbonate soft drinks provide them a sociability
benefit.
• Highest score report that carbonate soft drinks answering the need factor for
thirst release with 4.3 and lowest score report to healthy benefit with 1.6.
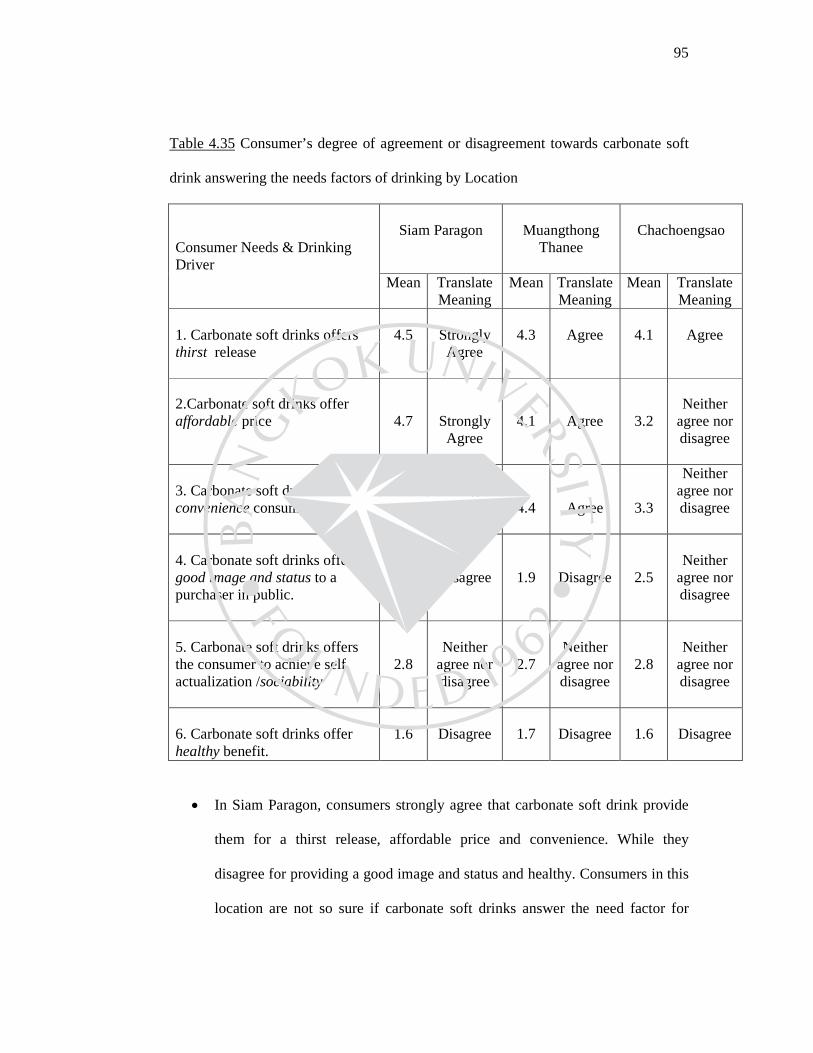
95
Table 4.35 Consumer’s degree of agreement or disagreement towards carbonate soft
drink answering the needs factors of drinking by Location
Siam Paragon
Muangthong
Thanee
Chachoengsao
Consumer Needs & Drinking Driver
Mean
Translate Meaning
Mean
Translate Meaning
Mean
Translate Meaning
1. Carbonate soft drinks offers thirst release
4.5
Strongly Agree
4.3
Agree
4.1
Agree
2.Carbonate soft drinks offer affordable price
4.7
Strongly Agree
4.1
Agree
3.2
Neither agree nor disagree
3. Carbonate soft drinks offers a convenience consumption
4.9
Strongly Agree
4.4
Agree
3.3
Neither agree nor disagree
4. Carbonate soft drinks offers a good image and status to a purchaser in public.
2.3
Disagree
1.9
Disagree
2.5
Neither
agree nor disagree
5. Carbonate soft drinks offers the consumer to achieve self actualization /sociability
2.8
Neither
agree nor disagree
2.7
Neither
agree nor disagree
2.8
Neither
agree nor disagree
6. Carbonate soft drinks offer healthy benefit.
1.6
Disagree
1.7
Disagree
1.6
Disagree
• In Siam Paragon, consumers strongly agree that carbonate soft drink provide
them for a thirst release, affordable price and convenience. While they
disagree for providing a good image and status and healthy. Consumers in this
location are not so sure if carbonate soft drinks answer the need factor for

96
sociability benefit. Highest score for this location report to convenience
benefit with 4.9, lowest score report to providing a healthy benefit with 1.6.
• In Muangthong Thanee, consumers agree that carbonate soft drinks answer the
need factors for release thirst, affordable and convenience. While they
disagree for it answer a good image and status and healthy factors. Consumers
are not so sure if carbonate soft drinks provide a sociability benefit.
• For both location, a highest score report to convenience benefit with 4.9 for
Siam paragon and 4.4 in Muangthong Thanee. The lowest score report to a
healthy benefit with 1.6 in Siam paragon and 1.7 in Muangthong Thanee.
• In Chachoengsao, consumers agree that carbonate soft drinks answer the need
factor for release thirst. While they disagree for provide a healthy benefit.
Consumers in this location are not sure if carbonate soft drinks answer the
need factor for affordable, convenience, provide a good image and status and
sociability benefit. Highest score report to thirst release with 4.1 and lowest
score report to healthy benefit with 1.6.

97
Table 4.36 Consumer’s degree of agreement or disagreement towards carbonate soft
drink answering the needs factors of drinking by Gender
Male Female
Consumer Needs & Drinking Driver Mean S.D.
Translate Meaning
Mean S.D. Translate Meaning
1. Carbonate soft drinks offers thirst release
4.3 0.5 Agree 4.3 0.5 Agree
2. Carbonate soft drinks offer affordable price
3.8 1.1 Agree 4.0 1.0 Agree
3. Carbonate soft drinks offers a convenience consumption
4.0 0.9 Agree 4.2 0.8 Agree
4. Carbonate soft drinks offers a good image and status to a purchaser in public.
2.3 0.7 Disagree 2.1 0.7 Disagree
5. Carbonate soft drinks offers the consumer to achieve self actualization /sociability
2.8 0.8 Neither
agree nor disagree
2.8 0.7 Neither
agree nor disagree
6. Carbonate soft drinks offer healthy benefit.
1.6 0.5 Disagree 1.7 1.5 Disagree
• Male and Female consumers agree that carbonate soft drinks answer their
drinking need factors for thirst release, affordable and convenience. While
they disagree for provide a good image and status and healthy benefit. Male
consumers neither agree nor disagree for providing a sociability benefit.
• Male and Female consumers indicate equal highest score to release thirst with
4.3 and lowest score report to healthy benefit with 1.6 and 1.7 for male and
female opinion.
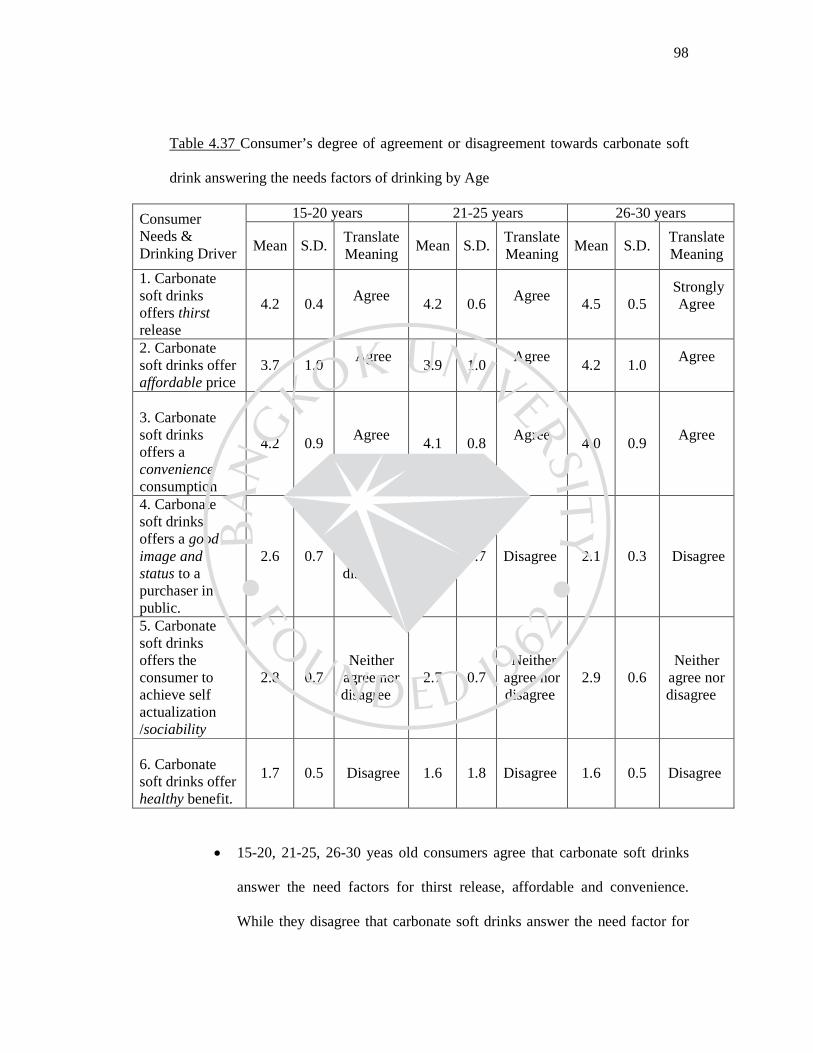
98
Table 4.37 Consumer’s degree of agreement or disagreement towards carbonate soft
drink answering the needs factors of drinking by Age
15-20 years 21-25 years 26-30 years Consumer Needs & Drinking Driver Mean S.D.
Translate Meaning
Mean S.D. Translate Meaning
Mean S.D. Translate Meaning
1. Carbonate soft drinks offers thirst release
4.2 0.4 Agree
4.2 0.6
Agree
4.5 0.5 Strongly
Agree
2. Carbonate soft drinks offer affordable price
3.7 1.0 Agree
3.9 1.0
Agree
4.2 1.0 Agree
3. Carbonate soft drinks offers a convenience consumption
4.2 0.9 Agree
4.1 0.8
Agree
4.0 0.9 Agree
4. Carbonate soft drinks offers a good image and status to a purchaser in public.
2.6 0.7 Neither
agree nor disagree
1.9 0.7 Disagree 2.1 0.3 Disagree
5. Carbonate soft drinks offers the consumer to achieve self actualization /sociability
2.8 0.7 Neither
agree nor disagree
2.7 0.7 Neither agree nor disagree
2.9 0.6 Neither
agree nor disagree
6. Carbonate soft drinks offer healthy benefit.
1.7 0.5 Disagree 1.6 1.8 Disagree 1.6 0.5 Disagree
• 15-20, 21-25, 26-30 yeas old consumers agree that carbonate soft drinks
answer the need factors for thirst release, affordable and convenience.
While they disagree that carbonate soft drinks answer the need factor for
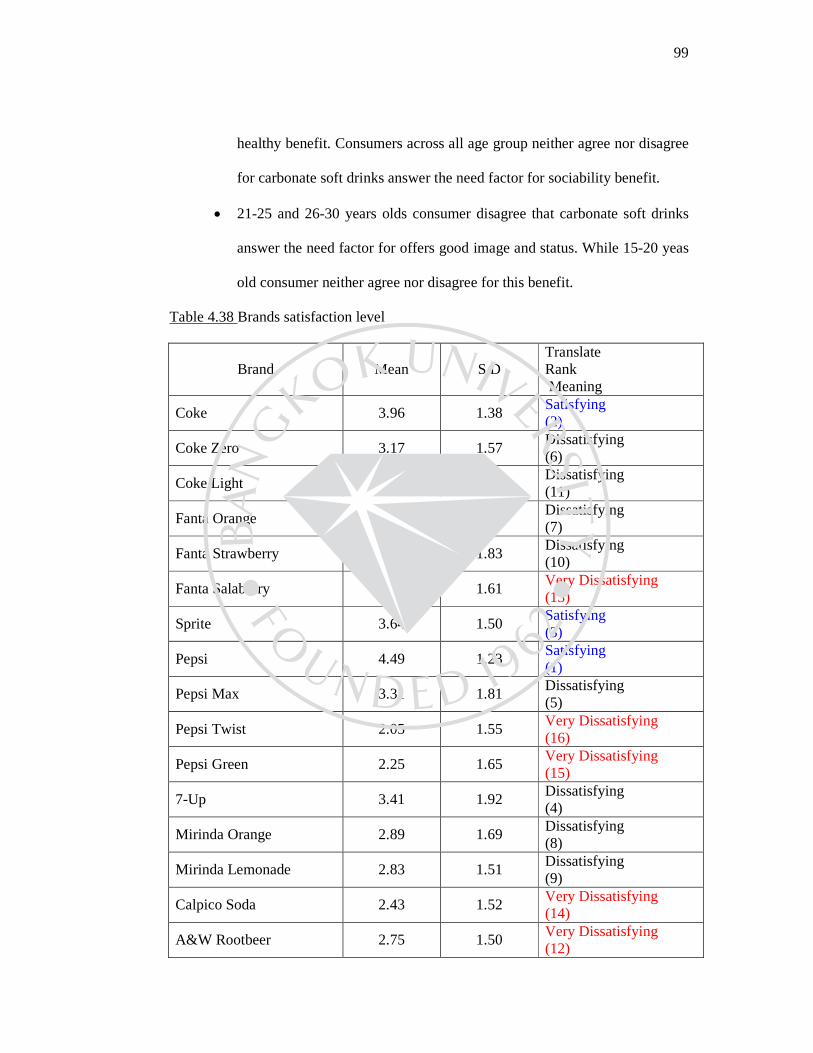
99
healthy benefit. Consumers across all age group neither agree nor disagree
for carbonate soft drinks answer the need factor for sociability benefit.
• 21-25 and 26-30 years olds consumer disagree that carbonate soft drinks
answer the need factor for offers good image and status. While 15-20 yeas
old consumer neither agree nor disagree for this benefit.
Table 4.38 Brands satisfaction level
Brand Mean S.D Translate Rank Meaning
Coke 3.96 1.38 Satisfying (2)
Coke Zero 3.17 1.57 Dissatisfying (6)
Coke Light 2.86 1.65 Dissatisfying (11)
Fanta Orange 2.97 1.72 Dissatisfying (7)
Fanta Strawberry 2.79 1.83 Dissatisfying (10)
Fanta Salaberry 2.46 1.61 Very Dissatisfying (13)
Sprite 3.64 1.50 Satisfying (3)
Pepsi 4.49 1.23 Satisfying (1)
Pepsi Max 3.31 1.81 Dissatisfying (5)
Pepsi Twist 2.05 1.55 Very Dissatisfying (16)
Pepsi Green 2.25 1.65 Very Dissatisfying (15)
7-Up 3.41 1.92 Dissatisfying (4)
Mirinda Orange 2.89 1.69 Dissatisfying (8)
Mirinda Lemonade 2.83 1.51 Dissatisfying (9)
Calpico Soda 2.43 1.52 Very Dissatisfying (14)
A&W Rootbeer 2.75 1.50 Very Dissatisfying (12)

100
Table 4.38 presented brands satisfaction , there are 16 brands includes Coke, Coke
Zero, Coke Light ,Fanta Orange, Fanta Strawberry, Fanta Salaberry ,Sprite, Pepsi,
Pepsi Max, Pepsi Twist, Pepsi Green,7 Up, Mirinda Orange, Mirinda Lemonade,
Calpico Soda and A&W root beer.
• Pepsi gain highest score with 4.49, represent that consumers satisfy this brand,
another 2 brands that also satisfy by consumers includes coke with 3.96 and
sprite with score 3.64.
• In the opposite ,lowest score reports to Pepsi Twist with 2.05 ,meaning that
consumer very dissatisfy this brand, there are another 5 brands which are very
dissatisfy by the consumers include Pepsi Green (2.25),Calpico Soda
(2.43),Fanta Salaberry (2.46) and A&W root beer(2.75).

101
Table 4.39 Brands satisfaction level by Location
Siam Paragon
Muangthong Thanee Chachoengsao
Brand
Mean S.D Translate Meaning
Mean S.D Translate Meaning
Mean S.D Translate Meaning
Coke 4.00 1.20 Satisfying 3.57 1.58 Satisfying 4.26 1.24 Satisfying
Coke Zero 2.66 1.16 Dissatisfying 4.07 1.66 Satisfying 2.79 1.44 Dissatisfying Coke Light
2.19 1.21 Very
Dissatisfying 4.13 1.76 Satisfying 2.28 1.14
Very Dissatisfying
Fanta Orange
2.81 1.43 Dissatisfying 4.08 1.97 Satisfying 2.14 1.08 Very
Dissatisfying Fanta Strawberry
2.11 1.31 Very
Dissatisfying 3.98 1.93 Satisfying 2.27 1.57
Very Dissatisfying
Fanta Salaberry
1.57 0.83 Very
Dissatisfying 3.42 1.87 Dissatisfying 2.30 1.35
Very Dissatisfying
Sprite 3.74 1.21 Satisfying 4.16 1.59 Satisfying 3.13 1.44 Dissatisfying
Pepsi 4.52 0.74 Very
Satisfying 4.90 1.23
Very Satisfying
4.13 1.41 Very
Satisfying Pepsi Max 4.05 1.44 Satisfying 3.00 2.08 Dissatisfying 3.01 1.65 Dissatisfying Pepsi Twist
2.26 1.33 Very
Dissatisfying 1.97 1.75
Very Dissatisfying
1.97 1.52 Very
Dissatisfying Pepsi Green
1.92 1.22 Very
Dissatisfying 2.73 1.88 Dissatisfying 2.09 1.63
Very Dissatisfying
7-Up 4.37 1.67 Satisfying 2.94 2.02 Dissatisfying 3.09 1.76 Dissatisfying Mirinda Orange
2.64 1.74 Dissatisfying 3.76 1.83 Satisfying 2.35 1.17 Very
Dissatisfying Mirinda Lemonade
2.27 1.12 Very
Dissatisfying 3.26 1.71 Dissatisfying 2.86 1.46 Dissatisfying
Calpico Soda
2.34 1.25 Very
Dissatisfying 2.80 1.93 Dissatisfying 2.18 1.23
Very Dissatisfying
A&W Rootbeer
3.52 1.41 Satisfying 2.79 1.85 Dissatisfying 2.15 0.85 Very
Dissatisfying
Table 4.39 presented brands satisfaction by Location.
• In Siam Paragon, Pepsi gain a highest score with 4.52, represent that
consumers very satisfy this brand. There are another 4 brands also satisfy by
the consumer includes Coke (4.0), Sprite (3.74), Pepsi Max (4.05) and 7-Up
(4.37).While lowest score report on Fanta Salaberry with 1.57 ,represent that

102
consumer very dissatisfy it. There are another 7 brands which are very
dissatisfy by the consumer also includes Coke Light (2.19), Fanta Strawberry
(2.11), Fanta Salaberry (1.57), Pepsi Twist (2.26), Pepsi Green (1.92), Mirinda
Lemonade (2.27) and Calpico Soda (2.34).
• In Muangthong Thanee ,Pepsi gain a highest score with 4.90 ,represents that it
is very satisfy by the consumers .There are another 7 brands which also satisfy
by the consumers include Coke(3.57),Coke Zero(4.07),Coke Light(4.13),
Fanta Orange
(4.08), Fanta Strawberry (3.98), Sprite (4.16), Pepsi (4.90), Mirinda Orange
(3.76).The lowest scores represent that it is very dissatisfy by the consumers
report to Pepsi Twist with score 1.97.
• In Chachoengsao, a highest score report on Pepsi with 4.13, meaning that
consumer very satisfying this brand. There are 2 more brands which are also
satisfy by the consumers includes Coke(4.26) and Pepsi(4.13).While the
lowest score report to Pepsi Twist with 1.97 ,meaning that consumers very
dissatisfy it .There are another 8 brands which are also very dissatisfy by the
consumers includes Coke Light(2.28), Fanta Orange(2.14), Fanta
Strawberry(2.27), Fanta Salaberry(2.30),Pepsi Twist (1.97), Pepsi Green
(2.09), Mirinda Orange (2.35), Calpico Soda(2.18) , A&W Root beer (2.15).

103
Table 4.40 Brands satisfaction level by Gender
Male
Female
Brand Mean
S.D.
Translate Meaning
Mean
S.D.
Translate Meaning
Coke 4.2 1.4 Satisfying 3.7 1.3 Satisfying
Pepsi 4.5 1.4 Very
Satisfying 4.5 1.1 Very
Satisfying Sprite 3.7 1.6 Satisfying 3.6 1.4 Satisfying A&W Root beer 2.9 1.6 Dissatisfying 2.5 1.3 Dissatisfying Coke Zero 3.2 1.7 Dissatisfying 3.1 1.5 Dissatisfying Coke Light 2.9 1.7 Dissatisfying 2.8 1.6 Dissatisfying Pepsi Max 3.3 1.9 Dissatisfying 3.4 1.7 Satisfying Fanta Orange 2.6 1.7 Dissatisfying 3.4 1.7 Satisfying Fanta Strawberry 2.5 1.8 Dissatisfying 3.1 1.8 Dissatisfying
Fanta Salaberry 2.1 1.6 Very
Dissatisfying 2.9 1.6 Dissatisfying Mirinda Orange 2.5 1.6 Dissatisfying 3.3 1.7 Dissatisfying Mirinda Lemonade 2.6 1.5 Dissatisfying 3.1 1.5 Dissatisfying
Pepsi Twist 2.0 1.7 Very
Dissatisfying 2.1 1.4 Very
Dissatisfying
Pepsi Green 2.4 1.9 Very
Dissatisfying 2.1 1.4 Very
Dissatisfying 7-Up 3.4 2.0 Dissatisfying 3.4 1.9 Dissatisfying
Calpico Soda 2.5 1.7 Dissatisfying 2.3 1.3 Very
Dissatisfying
Table 4.40 presented brands satisfaction by Gender
• Male and Female are most satisfying the brand such Pepsi with score 4.5.
• Male and Female , 2nd satisfying brand is Coke and the 3rd is belong to Sprite
• Female is also satisfying the brand such Pepsi Max and Fanta Orange with
equal score 3.4.
• Male and Female are very dissatisfying the brand such Pepsi Twist and Pepsi
Green with very low score by 2.0 in average.

104
Table 4.41 Brands satisfaction level by Age
15-20 years
21-25 years 26-30 years
Brand
Mean S.D Translate Meaning
Mean S.D Translate Meaning
Mean S.D Translate Meaning
Coke 4.4 1.8 Satisfying 3.5 0.9 Satisfying 3.9 1.2 Satisfying
Pepsi 5.2 1.2 Absolutely Satisfying
4.2 1.2 Satisfying 4.4 1.2 Satisfying
Sprite 3.9 1.3 Satisfying 3.7 1.7 Satisfying 3.6 1.1 Satisfying A&W Root beer
2.7 1.2 Dissatisfying 2.5 1.5 Dissatisfying 3.2 1.7 Dissatisfying
Coke Zero 3.2 1.6 Dissatisfying 3.7 1.8 Satisfying 2.5 1.0 Dissatisfying Coke Light
3.1 1.6 Dissatisfying 3.6 1.7 Satisfying 2.1 1.2 Very
Dissatisfying Pepsi Max 3.9 2.1 Satisfying 2.8 1.7 Dissatisfying 3.3 1.6 Dissatisfying Fanta Orange
3.1 1.4 Dissatisfying 3.6 2.0 Satisfying 1.9 1.2 Very
Dissatisfying Fanta Strawberry
2.5 1.6 Dissatisfying 4.0 1.8 Satisfying 1.5 0.8 Very
Dissatisfying Fanta Salaberry
2.2 1.3 Very
Dissatisfying 3.2 1.9 Dissatisfying 2.0 1.4
Very Dissatisfying
Mirinda Orange
2.9 1.3 Dissatisfying 3.8 1.9 Satisfying 2.1 1.5 Very
Dissatisfying Mirinda Lemonade
3.1 1.7 Dissatisfying 3.2 1.5 Dissatisfying 2.0 1.2 Very
Dissatisfying Pepsi Twist
2.7 2.3 Dissatisfying 1.9 1.0 Very
Dissatisfying 1.6 0.8
Very Dissatisfying
Pepsi Green
3.3 2.2 Dissatisfying 1.9 1.1 Very
Dissatisfying 1.8 1.2
Very Dissatisfying
7-Up 4.0 2.1 Satisfying 2.8 1.8 Dissatisfying 3.1 1.9 Dissatisfying Calpico Soda
2.5 1.6 Dissatisfying 2.4 1.5 Very
Dissatisfying 2.4 1.8
Very Dissatisfying
Table 4.41 presented brands satisfaction by Age group
• 15-20 years an old consumer, the most preferred brand is Pepsi with
absolutely satisfying level by score 5.2 follow by Coke with 4.4, 7 Up with 4.0,
Sprite and Pepsi Max with equal score at 3.9. Within this group, they very
dissatisfying the brand such Fanta Salaberry with a very poor score 2.2.

105
• 21-25 years old consumers.The most preferred brand is Pepsi with satisfying
level by score 4.2 .Within this group ,they very dissatisfying the brand such
Pepsi Twist, Pepsi Green and Calpico Soda.
• 26-30 years old consumer , There are 3 brands satisfying by this age group
include Peps, Coke and Sprite with score 4.4,3.9 and 3.6 ,the rest brands are
not satisfying to very dissatisfying by this age group.
Conclusion
The data presented in this chapter provided a very detailed picture of the
information gathered by this study.
The information enables the researcher to have an overview of the Thai consumer
of carbonated soft drinks at 7-Eleven.
The survey first presents the demographic data about the consumer, using
descriptive statistics, followed by behavior data using descriptive statistics, and finally
the attitude of the consumer using descriptive statistics.
In this raw format, the data highlight many interesting results in terms of
carbonate soft drinks consumption patterns and behavior. However, without a detailed
analysis, it is impossible to get an overall picture of the Thai consumer, and the
presented data will remain as a series of snapshot picture. It is therefore necessary to
synthesize this research data into a more meaningful picture in order to have a final
understanding of the Thai consumers of carbonate soft drinks at 7-Eleven.

106
Chapter 5
Data Analysis
This chapter analyzes the research results of consumer’s attitudes towards carbonate
soft drinks and their behavior when shopping for a carbonate soft drinks at 7-Eleven.
The data analysis consists of 3 parts as follows.
5.1 The analysis of customer’s demographic data
5.2 The analysis of consumer’s behavior toward carbonate soft drinks at 7-Eleven
5.3 The analysis of consumer’s attitude towards carbonate soft drinks
Conclusion

107
5.1 The analysis of customer’s demographic data
The first part of the analysis of the results data analysis focuses on the
customer demographic data. The demographic data gathered by this study shows
some key characteristics of the respondents and provides a description of the average
Thai carbonate soft drink consumers.
The first task is to determine whether the consumer of carbonate soft drinks in
Thailand is gender specific or whether both genders are equally represented. From the
data presented in chapter 4, table 4.2, 54%of respondents is male and 46% are female.
Therefore, we can conclude that there is a slight majority of male consumers’ vs.
female consumers.
The next step is to determine the average age of the Thai carbonate soft drinks
consumer. Based on results presented in chapter 4, table 4.4, about 80% of
respondents, which were people buying carbonate soft drinks have an age between 15
to 30 years old.
Based on theses findings, the average Thai consumer of carbonate soft drinks
is most likely to be male and in the 15 to 30 years old segment. Theses findings are
similar to the results of the study presented by Euromonitor International. In its
chapter 1, it identified the average carbonate soft drink consumer at a worldwide level
as a young 15 – 30 years male. This result is significant for the purpose of this study
as it validate the model presented by the Euromonitor study and will enable the results
of this present study to be compared with the Euromonitor’s finds.
However, while the demographic data presents an average vision of the Thai
consumer, it reduces considerably the level of details in the way of consumption

108
behavior. It is therefore necessary to have a closer look at the behavior of consumer
and see whether any behavior is specific to any type of consumer.
109
5.2 The analysis of consumer’s behavior toward carbonate soft drinks at 7-
Eleven
The second part of the analysis of the results data analysis focuses on the
customer behavior data. The behavior data gathered by this study shows some key
characteristics of the respondents and most importantly analyze the patterns and
behavior to try to present a predictive model of behavior based on consumers data.
The analysis will first look at what brand is been chosen the customers, and then the
underlying trends that emerge from consumption behavior.
Coke vs. Pepsi
The first of the analysis of the Thai consumers of carbonate soft drink is to
understand what he drinks.
Based on results presented in chapter 4, table 4.6 carbonate soft drinks brand
ever drunk. Cola carbonated soft drinks – Coke, Sprite and Pepsi brands, represent the
brands of carbonated soft drinks with high consumption levels over 80%. These
brands represent the “classic” offer from the carbonate soft drinks companies. They
are also the brands which have been the longest in the market.
Amongst all these brands, there is a company that emerges as owning the
market leading brand. Based on results presented in chapter 4 on table 4.9, Coke
brands (Coke + Coke Zero + Coke Light + Sprite) is most often drinks by the
consumers. Coca Cola Company and it local representative, Pure Thai Drinks
Company represents over 63% of the share of throat.

110
Another key indicator of brand popularity is the purchase intention. Based on
results presented in chapter 4 on table 4.13 brand will buy next, Coke is the brand
with the highest next purchase intention with 47%.
This gives Coca Cola a very strong competitive advantage. The 2nd Brand
chosen by the Thai consumers is Pepsi with 23% of share of throat and only 14% next
purchase intention as seen in chapter 4 on table 4.13.
It is also interesting to note that based on results presented in chapter 4 on
table 4.16, Pepsi is 2nd brand that consumers in age group 26-30 and 36-40 years old
tend to buy for their next purchase. This means that the Pepsi consumer is most likely
to be in 30 and above age group. It shows that Pepsi is declining in popularity in the
younger Thai generations compared to Coke. This would lead to further declining
share of throat for Pepsi should this trend continues.
A market receptive to new products
Coke, the Thai market leading brand, is an old brand that has been in existence
over 100 years. it is interesting to note that while theses brands have been the longest
on the market, other brands, such as A&W root beer or Calpico Soda, which have
been on the Thai market for over 10 years have an ever been drunk results of 39% and
22% respectively. On the other hand, a newly launched brand such as Pepsi Twist,
which was launched only a few months ago, shows already that it has been
experienced by 19% of carbonate soft drinks consumers.
It can therefore be concluded that the consumption behavior is not linked with
amount of time the brand has been available on the market. The results shown by the

111
adoption of Pepsi Twist shows that the consumer is highly likely to try new products
offers if presented with an offer that raise his or her interest.
The influence of the health trend
Another finding of this study on the Thai consumer behavior is the adoption of
low sugar carbonate soft drinks. Based on the findings presented in table chapter 4,
table 4.6 carbonate soft drinks brand ever drunk, 60 % of consumers experienced with
drinking low sugar carbonate soft drinks such as Coke Light, Coke Zero, Pepsi Max.
Overall, the Low sugar carbonates soft drinks brands (Coke Light + Coke Zero
+ Pepsi Max) represent 20% of total market. With such a high level of consumption, it
can be concluded that low sugar soft drinks are an important product offer for the
Thai Consumer. The Euromonitor study has shown that the global carbonate soft
drinks consumer has become highly sensitive to his health and his drinking behavior
has been modified accordingly. The present study shows that the Thai consumer is
following the same trend as presented by the Euromonitor study. The Health and
Wellness trend has clearly influenced the Thai consumer. A healthier, less sugar
beverage offer is an important expectation of the Thai consumer.
It is also interesting to look at who is most likely to drink these lower sugar
carbonated soft drinks. Based on results presented in chapter4, table 4.7 carbonate soft
drinks brand ever drunk by gender, all low sugar soft drinks have a higher female
consumption than male consumption (Coke Zero M 68% vs. 67% F, Coke Light
M42% vs. F59%, Pepsi Max M57% vs. F84%). However, it is interesting to note that
while the low sugar carbonate soft drink consumer is predominantly female, an
average of 50% of male consumers have ever tried it.

112
Finally, when considering the average age of the low sugar carbonate drink
consumer, as in chapter 4 on table 4.12 brand drinks most often by age, the 2nd brand
drink most often in age group 15-20 and 31-35 years old is Pepsi Max with 17.9%and
17.6% while the 2nd brand drink most often in age group 21-25 years old is Coke Zero
with 22.2%.
This basically shows that apart from classic cola, a young consumer (15-25
years old) drinks most often for a low sugar carbonate soft drinks.
Fruit juice drinks consumption interest within the Thai female consumers
The analysis of consumer behavior also shows that the second most drunk
carbonate soft drinks are carbonate version of orange juice and fruit juice, such as
Fanta and Mirinda.
However, the popularity of the carbonate juice is rather gender specific. Based
on results presented in chapter 4, table 4.7 carbonate soft drinks brand ever drunk by
gender, Fruits juice based carbonate soft drinks are more popular amongst female
rather than male.
Furthermore, based on results presented in chapter 4 on table 4.8, brand ever
drunk by age group, Juice variant have been drunk by young age group(15-25 years
old) rather than older age group (26-40 years old).
Therefore, it can be concluded that Thai consumers are, in general, aware of
the high sugar level of soft drinks and are seeking a healthier, less sugar alternative.
This healthier trend is lead by female consumers, but nonetheless followed also by
male consumers. Carbonate fruit juices consumption are a reflection of this quest for
healthier alternative. While highly visible within the younger age groups and female
113
group, the health trend is not gender nor age specific but affecting the overall Thai
market. Finally, being such an important trend amongst the younger generation, it is
very likely that the trend will only carry on as customers’ age, meaning this will be
the underlying market need of the future consumers.
Urban trends (Bangkok) and Countryside
So far, this analysis has shown what is being consumed, and by whom.
Another important point of this study’s has been to consider whether the location of
the consumer, whether urban from the countryside has an impact on the consumer’s
behavior.
The results presented in chapter 4 on table 4.10 Brand drinks most often by
location, the findings shows that Normal Coke is more popular upcountry with 50%
of respondent having purchased it there. Furthermore, Coke represents 50% of total
carbonate soft drinks market. When combining with Pepsi, normal non low sugar
carbonate soft drink is 74% of total Thai market in upcountry.
The same results show that 51% of total Low Sugar market is drunk in
Bangkok (Siam paragon + Muangthong Thanee). This is extremely interesting in
terms of consumer’s behavior as it means urban drinks more low sugar carbonate soft
drinks than countryside.
Frequency and time of purchase behavior
The next point to consider while studying the Thai carbonate soft drinks
behavior is the purchase behavior. Based on results presented in chapter 4 on table

114
4.17, close to 60% of respondents consume at least 2 times a week, and up to 4 times
a week.
However, theses findings need to be considered more specifically through a
location perspective. Basically, the results of the study shows that Bangkok
consumers purchase carbonate soft drinks less often (once a week) compared with
outskirt (2-3 times a week) and upcountry (3-4 times a week).
This basically means that carbonate soft drinks are more popular, with a
higher frequency purchase in Upcountry. On the other hand, carbonate soft drinks are
drunk less often in Bangkok. This may be caused by the consumer behavior and
expectation, but also by the wide availability of small coffee and juice kiosk, thus
offering consumers more drinking choices and reducing the impact of 7-Eleven as a
place of purchase.
Furthermore, when considering the results presented in chapter 4 on table 4.18,
it shows that Male have a slightly higher purchase carbonate soft drinks often than
female with frequency 2-3 times a week.
While there is no massive imbalance between genders, it can be assumed that
both genders are consumers of carbonate soft drinks, but that male are the biggest
consumer groups for frequency.
Furthermore, based on results presented on table 4.19, young consumers (15-20
years old) more often purchase carbonate soft drink than any other age group. This
means the carbonate soft drink consumers is extremely age specific.

115
Factors triggering purchase behavior
The behavior of the Thai consumer of carbonate soft drinks is strongly
influenced by the moment of purchase within the day. Based on results presented in
chapter4, table 4.20, purchase times are mostly in the afternoon with 75% of purchase
made after 12h.
There seems to be no group or social influence on the purchase process, as
results presented in chapter 4 on table 4.21 shows that almost 50% of consumers
shopping for a carbonate soft drinks at 7-Eleven alone and another 50%, they come in
group.
It seems that while the time of day is a factor, it is interesting to look for other
factors linked with purchasing.
The results presented in chapter4, table 4.22 Planed or Unplanned purchase
shows that close to 70 %of consumer decided to buy carbonate soft drinks when they
were in the stores. This is a very important information from a promotional
perspective, as this means carbonate soft drinks is kind of impulse product, therefore a
good display is very necessary for this category.
Age and location have an impact on this overall picture. The results presented
in chapter 4 on table 4.24, shows that young to young adult consumers (15-30 years)
have no planed purchase as over 68% responded that their purchased was unplanned.
On the other hand, older consumers (31-40 years old) presents the exact opposite
behavior with close to 70% responding that the purchase was planned. Finally,
Countryside consumers have planed purchase than urban consumers.
To understand this behavior, we need to have a closer look at what types of
carbonate soft drinks are being purchased and what with.

116
The results presented in chapter 4 on table 4.25, shows that carbonate soft
drinks are most purchased with Snack and Bread / hot dog bar with 80% in total
across all locations.
This seems to mean that the purchase of carbonate soft drinks is meant as
refreshment, thirst quencher or as complement to snack or food.
This finding can be further fine tuned when looking at the type of carbonate
soft drink packages that are being purchased by location.
The results presented in chapter 4 on table 4.27, pack size purchase shows that
the 325 ml is the favored purchased form of carbonate soft drinks (55%).Linked with
the previous finding that theses purchases are mostly unplanned and spontaneous, this
suggest individual, on the spot consumption.
At the same time, close to 40% of carbonate soft drinks in 12 liters pack size is
sold in residential area (Muangthong Thanee and Chachoengsao).
Finally, the results presented in Chapter 4 on table 4.29, pack size purchase by
Age shows that 15-35 years old consumers most purchase carbonate soft drinks with
individual pack size 325 ml while consumers age 36-40 years old most purchase in
1.25 liters pack size. These types of packages are too big for individual, instant
consumption.
Linked with our previous finding that theses purchases of large packs are
planned purchases, this means that in residential area, carbonate soft drinks are
consumed at home or among family
The analysis of the consumer of carbonate soft drinks’ behavior provides deep
insight into the consumer mind. The analysis highlight want brand the consumer
prefer, namely coke, what are Thai male and female consumers preference, what they

117
are most likely to buy, when they are most likely to buy depending on whether they
are urban or from the countryside, and what are the main purchase triggers, be it
unplanned on the spot consumption with snacks or planned purchases for
consumption with the family meal. While the study provides a very accurate purchase
of the consumer behavior, the underlying factors that motivate this behavior are still
unclear. This will be the final step of the data analysis.

118
5.3 The analysis of consumer’s attitude towards carbonate soft drinks
The final part of the analysis of the results data analysis focuses on the
customer attitude data. The analysis of the attitudes and expectation of the carbonate
soft drinks consumer will provide a clear picture of the motivations of the consumers
and some key data on how to influence this behavior.
The research done by Euromonitor had identified 6 key driving factors for
drinks consumption. They are Thirst, Affordability, Convenience, Image and Status,
Sociability and Health. This has been declined in this study under the 5 following
factors: Brand name, Feature / Packaging, Formula, Price, and Promotion. This was
necessary as these attributes are clearly identified by consumers and will not influence
the answers in a way that will affect the analysis to match with the 6 key drivers.
Based on results presented in chapter 4 on table 4.30, the most influential
purchase factors on carbonate soft drinks product is Taste with 32.1% of answer. The
2nd most influential factor is then Brand with 19.8%, followed by Pricing with 14.5%,
Packaging with 13.6%, Formula with 10.2% and less influential factor is Promotion
with only 9.8 %.
This results in not affected by gender differences. However, there are a few
variations depending on age and location. Based on results presented in chapter 4 on
table 4.31, 4.33, purchase factors considering for shopping carbonate soft drinks
separate by location and age, it can seen that urban and countryside people have
different considerations.
For urban people, being respondents from Siam Paragon and Muangthong
Thanee, Brand name and Taste are the key influential purchase factors.
119
However, People in countryside have more concern on price than urban
consumers. Price influence comes as 2nd the key concern 19 % vs. 11.6% as price
concern in urban respondents. This of course can be linked with the income
differences between urban people and countryside people in Thailand.
Furthermore, age has also an influence on driving factors. Results of the data
analysis shows that 31-40 years old or adult’s consumers tend to have less price
concern than young consumers. 10% of the 31-40 present price as a concern vs. 15%
for the 15-20 years old group.
These results present a clear picture of what motivate purchase of carbonate
soft drinks from a consumer point of view. Taste, Brand name and Price are clear
final motivator. However, it possible to fine tune this analysis by looking at how
consumer perceive their satisfaction toward the 6 key basic driving needs for drinking.
The next step of the analysis analyses the agreement level of consumers
toward the needs factors of drinking carbonate soft drinks. The results for this
question are presented in chapter 4 on table 4.34 consumer’s degree of agreement or
disagreement towards carbonate soft drink answering the needs factors of drinking.
From the answers, the analysis shows that consumers agreed that carbonate
soft drinks are answering their need factors for a release thirst, affordable and
convenience.
At the same time, they disagree with the fact that carbonates soft drinks
provide them a good image and status and a healthy benefit.
Finally, based on the results of the statistical analysis, it is still
questionable whether carbonate soft drinks provide a sociability benefit.

120
Once we link theses results to the previous research presented in Chapter 2,
under the association of Drinking and Maslow’s Hierarchy of Needs, it can be
concluded that these drivers match the 2 lowest tiers of the pyramid of needs.
Basically, Thirst, Convenience and Affordable correspond to the Survival & Security
and Safety levels.
However, as they disagree with the fact that carbonates soft drinks provide
them with Image, Status, they basically do not link it with the superior tiers of
Maslow’s pyramid, Belonging and Esteem Status.
Theses results need to be further analyzed under the criteria of location. As it
has been presented before, there are usually attitude difference between urban
respondents and Upcountry respondents.
Based on results presented in chapter 4 on table 4.35, it can be seen that the
difference opinion between urban and countryside consumers is that, countryside
consumers have not found a strong benefit of carbonate soft drinks for affordable
price and convenience benefit as found by urban consumers. Therefore, it can be
concluded that urban consumers have more time constraint than countryside
consumers.
On the other hand, the same results shows that Countryside consumers find
benefit of carbonate soft drinks offer a good image and status than urban consumers.
This is interesting as it has been seen earlier that countryside consumers are
also more price sensitive for drinks such as carbonate soft drinks. From this, it could
be concluded that countryside consumers rank carbonate soft drinks higher in terms of
social image, to some kind of affordable luxury when compared to water, while urban

121
consumers would rank the carbonate soft drinks more toward a commodity, a
convenient drink that is neutral in terms of social image.
Finally, the social benefit factor is further highlighted for a specific age group
of consumers. Based on results presented in chapter 4 on table 4.37, young consumers
15-20 years old find benefit of carbonate soft drinks offer a good image and status
more than any older consumers group.
From the Euromonitor study, it has been presented that this social age group is
highly receptive to peer pressure and branding activities. This social group usually
defines itself from its brands consumption and is the most in need of social
identification. From this analysis, it can be concluded that this also apply to the Thai
consumers, and therefore the 15-20 years old group associate and define itself with
the soft drinks brands he consumes.
Since the consumers associate themselves with the brands consumed, it is
important to have a better understanding on the level of satisfaction with the brands
available on the Thai market.
Based on results presented in chapter 4 on table 4.38 brands satisfaction, there are
only 3 brands out of 16 brands which are ranked as satisfying by the consumers. They
are Pepsi, Coke and Sprite.
Since location is a rather distinctive criterion amongst customer, it is necessary to
have a closer look at any variation in consumer satisfaction based on this criterion.
The results are presented in chapter 4 on table 4.39 and on table 4.40. According to
theses, the consumers of both genders and across all locations are satisfied by Coke
and Pepsi brands.

122
In the meanwhile, the consumers of both genders and across all location are very
dissatisfied by the Fanta Salaberry, Pepsi Twist, Pepsi Green, Mirinda Lemonade and
Calpico soda brands. This is also translated in the data presented in terms of
frequency of purchase and next purchase intention. Overall it can also be concluded
that Pepsi variants are less popular compared to Coke variants

123
Conclusion
The result of the analysis of the data gathered by the study has provided a
clear picture of the Thai consumers of carbonate soft drinks.
The Thai consumers appears to be a young male, aged 15 to 30 years old,
with an average drink consumption frequency of 2 to 3 times per week. His favorite
drink is Coke classic. He is a consumer that is highly susceptible to trying new
products; he is overall brand conscious, health conscious and price sensitive.
Going beyond this first picture, the analysis shows that there are some clear
distinction in attitudes and expectation between genders, ages and finally urban and
countryside customers.
Female consumers show the strongest interest in carbonate fruit juices, and
show the highest level of interest in low sugar drinks.
Urban consumers show the highest level of interest in lower sugar drinks, they
are fewer prices conscious and more likely to spontaneous, unplanned purchases.
They are individual drinkers who look for refreshment.
Countryside consumers show less interest in low sugar soft drinks. Their
purchases are usually planned, and drinks are purchased for family consumption, most
likely with meals. They are brand conscious and more price conscious than their
urban counter parts.
Overall, the Thai consumers follow the model presented by the Euromonitor
study. However, the Thai consumer is not yet as sophisticated as the global drinker
presented by the study. There is a clear division between the urban, more health
conscious and more image driven consumers and the countryside consumer, who is
more brands and price sensitive.

124
Since the different type of consumers behavior have been identified along with
the underlying motivation drivers, it is now possible to formula recommendations to
target specific consumers segments.

125
CHAPTER 6
CONCLUSION AND RECOMMENDATION
This chapter will concluded and point out the key findings from the study
which in some extend will enable carbonate soft drinks companies and 7 Eleven
improve their offer regarding this product category to the target consumers.
The conclusion and recommendation made here were collected to answer
major and sub research questions. The research questions of this study are as follows.
Major research question
1. What are the factors and the implication of consumer behavior towards
carbonate soft drinks at 7-Eleven?
Sub questions
2. What factor has most influential on consumer’s purchase decision when
shopping for a carbonate soft drinks?
3. What is the consumer’s attitude towards carbonate soft drinks answering the
need factors of drinking?
4. What is the satisfaction level of consumers toward carbonate soft drinks brands?
126
The previous chapter has provided a full analysis of the data gathered by the
survey. The behavior of carbonate soft drinks at 7-Eleven has been reviewed, and
based on the insight identified; it is now possible to have a full understanding of the
factors that motivates the consumer’s purchase.
From the previous analysis, the Thai consumer of carbonate soft drink is a
young male, aged 15 – 30 years old. He is a Coke classic drinker, with an average
buying frequency of 2 to 3 times per week. He is brand conscious and somewhat price
sensitive.
If he is an urban, then he tends to be health conscious and most likely to have
switched to low sugar version of his favorite carbonated soft drink. If he is from the
countryside, he is not so concerned by health and low sugar version and with higher
price sensitivity than his urban counterpart.
The Thai female carbonate soft drink is more concerned about her health than
her male urban counterpart. She is more a carbonate fruit juice drinker.
Finally the study shows that the Thai consumer is very receptive to new
products. Urban consumers are most likely to impulse purchase, and therefore are
most receptive to on site communication and promotion.
From this simplified picture of what has been presented previously, it is now possible
to present a full set of recommendations for both carbonate soft drinks manufacturers
and to 7-Eleven. The recommendation targeted at the manufacturer will mostly look
at branding and new product development, while the recommendation targeted at 7-
Eleven will look at on site promotion.
127
6.1 Recommendation to carbonate soft drinks companies
Carbonate soft drinks manufacturers are Coke, Pepsi, or any company willing
to enter this particular market. It is necessary for them to have a clear picture of the
drivers and expectation of each of their consumers.
Brand communication
The results of the study have shown that Brand is a very determining factor of
the consumption. Coke is currently enjoying a larger share of throat over Pepsi, with
63% of the market for Coke versus 23% only for Pepsi.
Furthermore, the target consumer of carbonate soft drinks is within the 15-20
years old group. As seen with the Euromonitor study and the consumer behavior
marketing literature, this group is particularly receptive to new trends, new
advertising and is actually at a socialization stage, which means peer pressure is also
an effective way to affect their behavior.
Therefore, an effective strategy to build branding is to communicate at this
target group in ways that present a fun and social image.
This could be achieved through viral marketing over the internet, having
special clubs on Facebook or Twitter. Creating a strong sense of shared values and
community is the best way to build a strong identification with the brand, and
therefore lock the consumer relationship.
Finally, in traditional media such as press and TV advertising, it is necessary
to have strong universal opinion leaders and opinion makers endorsing the brand.
This kind of communication does not need to present the products features or
taste, but only focus on the “social benefit” i.e. to be part of the “in group” in order to
128
be effective. As thirst and refreshment are key triggers of the purchase, the final
objective of the communication plan will be to provide this reassurance that the
product does indeed quench the thirst, provide the ultimate refreshment, on top of
providing the ultimate social integration tool.
Finally the communication strategy can go all the way to final consumer by
designing special cans or bottle with special looks or visuals. This packaging acts both
as promotional item and collector item, reinforcing the close link and intimate
relationship between the brand and the consumer.
An effective branding and promotion strategy is a very powerful way to
support the sales of carbonate soft drinks, as the consumer is very socially driven.
However, the underlying trends and segmentation calls for specific products to cater
for the needs of specific groups of consumers.
New products for new consumers needs
From the data gathered in the study, 2 trends have been identified amongst the
Thai consumers suggesting interesting opportunities for new products development.
Theses trends are carbonates fruit juices consumption and healthier lifestyle aspiration.
Cashing on the health trend
In order to seize the opportunity presented by the healthier trends, carbonated soft
drinks manufacturers can also launch new products that are not carbonated soft drinks.
As seen from the Euromonitor study, Asian populations are returning to the health
values of traditional drinks such as green tea and developing strong interest for coffee.
It is therefore a good opportunity for these manufacturers to develop new range of
products along these trends, either in tea or coffee category. These products should be
129
in forms of soda, i.e. with sugar or artificial sweeteners and in PET bottle format,
targeted at young affluent health conscious urban consumers.
Gender targeted drinks
First of all, data shows that the Thai Female consumers are the largest consuming
group of carbonated fruit juices and the largest consumers of low sugar level drinks.
Currently, there are only Fanta and Mirinda brands of carbonated fruit juice
available on the market. They are not gender specific, and they have no low sugar
level option. An interesting new product opportunity would be a low sugar,
carbonated fruit juice, specifically targeted at Thai Women. It should also present
additional health benefits if possible in order to make it even more attractive to the
targeted consumer.
This new drink should be in a convenient individual package such as a PET bottle,
or can, in the 300 ml – 500 ml format. A can would need to be in a smaller format
seize as the consumption is mostly personal and a can does not offer the option to be
closed once opened. A PET bottle would be the most convenient format for this kind
of product.
Finally, there is a large expectation of urban males to consume low sugar
carbonated soft drinks, as seen from the results of this survey.
It is interesting to note that traditionally, low sugar carbonated soft drinks have
been targeted at female consumers only. However, data show that about 20% of males
are the consumer of the low sugar carbonated soft drinks.
A specific, male targeted low sugar carbonated soft drink will be able to address
the needs of theses consumers and offer a branded alternative to the existing “female

130
branded” offer. This would mean males are now encouraged to have a distinctive low
sugar drink, that is socially acceptable and “in” within their social group, therefore
enabling to increase consumption.
The carbonate soft drinks manufacturers have overall strategic opportunities in
order to keep their market share and retain customers. They start with specific
branding and communication to a longer term approach of new products development
specifically targeted at different segment of their consumers in order to answer their
specific needs.
However, theses options are relatively medium to long terms strategies. There
is one short term option that can be used in order to increase consumption and this is
in store communication and promotion. This would need store support and
corporation, therefore, this will need to been presented with 7-Eleven.

131
6.2 Recommendation to 7-Eleven
In order to optimize it store revenues, 7-Eleven needs to understand its
customers behavior and answer their needs From the results of the survey, some
interesting in store behavior and purchases drivers have come to light for 7-Eleven.
The first point is the large difference in consumption behavior between Urban
and country side consumers. In urban stores, such as in Siam Paragon, consumption is
mostly unplanned and individual consumption. In peripheral urban site such as
Muangthong Thanee and countryside store such as in Chachoengsao, consumption is
mostly planned, in large packs, and brought home, for food consumption.
Urban stores promotion
The first recommendation to 7-Eleven to optimize stores revenues in urban
sites is to offer specific, targeted promotions to carbonate soft drinks consumers.
From the results of the study, about 28% of these urban purchasers come in groups of
2 or 3 people. It should be interesting to target these customers by offering them
attractive promotions.
By offering a buy 1 get 1 free, or buy 2 get 1 free option, or buy 2 get 3rd at
50%, on small 500 ml PET bottle or 300ml cans, the store is able to create an interest
and a willingness to purchase for this particular group. By ensuring that the entire
group purchases the same drink, the store is able to increase its volume sold on this
specific beverage.
These promotions will rely on in store POP and visual communication near the
fridges and the drinks counter in order achieve maximum efficiency.

132
Countryside store promotion
From the research data gathered by this study and the analysis describe in the
previous chapter, it is clear that the countryside behavior of the consumer is motivated
by rather different drivers and needs than by the urban consumers. The purchase
behavior of consumers of countryside 7-Eleven is mostly planned, repetitive and for
home consumption. Pack seize purchased are large, 2l or higher.
7-Eleven can best take advantage of this behavior by creating specific
promotion that encourage repeated in store purchases. This could be promotion that
are not specific to the carbonated soft drinks itself, but linked with the store itself. For
example, a coupon system would offer collectable coupons with every purchase worth
a minimum amount (i.e. 100 Bahts) in 7-Eleven. Once the consumer has collected a
certain amount of coupons, theses can be redeemed for discounted items from a list,
or used to redeem special promotion, such a free drink purchase.
If working closely with drinks manufacturers, such promotional items could
be branded glasses or branded clothing’s, such as t-shirts, in order reinforce customer
relationship.
Another type of effective promotion to be used in store is to link pack
purchase with food consumption, as the data shows that these consumers purchase
their drinks to go along with their family meals. For example, the store can offer a
rebate on food purchased in stores such as snacks, sausages, bread etc…
This promotion will need to be advertised at the snack bar and near the food
selling gondolas in order to reach maximum effect and add a spontaneous purchase of
food to the planned purchased of carbonated soft drinks.

133
Conclusion
The purpose of this study has been to establish what are the factors and the
implication of consumer’s behavior towards carbonate soft drinks at 7-Eleven. The
data that has been gathered presented and analyzed in this study has been able to
answer this central question.
First, an overall description of the average carbonate soft drink consumer
demographic has been established, providing a simple but effective picture of the
consumer. Then, through deeper analysis, it has been possible to fine tune this
analysis by bringing to light different segments of consumers, such as female drinkers,
urban males consumers, countryside consumers.
The 2nd objective to this study was to determine what the most influential
factors in the purchase decision process are. From the data gathered and the analysis
of this report, it has been established that while thirst and price are important driver in
the conscious mind of the consumers, underlying drivers such as brand, health
concern and social image consumption mode are the final factors determining the type
of purchase made by the consumers.
The 3rd objective of this study was to determine whether the consumer’s needs
are being satisfied by the carbonate soft drinks beverage. From the research of the
survey and the analysis, it seems that while overall consumer’s needs are being
satisfied, there are also segments of consumers which needs are being ignored of are
not fully satisfied. Such needs are seen with the opportunity to have female targeted
carbonate low sugar fruits juice, male targeted low sugar carbonate cola drinks.
Finally, the global concern with the health trends is seen to be present in the Thai
134
market, but it does not seem that many manufacturers are trying yet to catch on this
trend.
The fact that so many needs go unanswered provides an answer to the 4th
objective of this study which was to determine the level of satisfaction of consumers
toward carbonated soft drinks. The data presented in the study has shown that while
the consumers are on average satisfied with the classic brands of Coke, Pepsi, Sprite,
there are several other brands that do not satisfy the consumers, such as the current
offer of carbonated fruit juice, 7-Up, or Calpico Soda. This is a direct translation of
the fact that consumers’ expectations for low sugar fruit juice or low sugar drinks are
being ignored.
However, the roots causes of this dissatisfaction have been clearly identified
with this study. Furthermore, the recommendations for the manufacturers to take
advantages of theses needs to launch new products have been presented.
This study has been able to answer all the major research questions and sub
research questions. It has been able to establish the attitude of the carbonate soft
drinks consumers, their behavior, and the driving factors behind it. Finally, it has been
able to provide a set of recommendations to both carbonated soft drinks manufacturer
and to 7-Eleven to act on theses findings.
135
BIBILOGRAPHY
Books
Bareham, J.R (1995).Consumer Behavior in the food industry : European
Perspective.Butterworth-Heinemann Ltd.
Gibert A.Churchill, Jr. and Dawn lacobucci (2002). Marketing Research:
Methodological Foundations. South-Western Thomson Learning.
Gibert A.Churchill, Jr.&Tom J.Brown.Basic (2004).Marketing Research (5th
ed.).South Western Thomson Coorporation.
Gordon R.Foxall & Ronald E.Goldsmith (1994).Consumer Psychology for
Marketing.Thomson International Business Press.
I.Hawkins, Roger J.Best, Kenneth A. Coney (1998).Consumer Behavior: building
marketing strategy (7th ed.).The McGraw-Hill companies,Inc.
I Schiff man & Leon G (2001). Consumer Behavior (2nd ed.).Person Education
Australia Pty Limited.
Joseph F.Hair, Jr., Robert P.Bush &David J.Ortinau (2006).Marketing research:
within a Changing Information Environment( 3rd ed.).The McGraw-Hill
companies,Inc

136
J.Paul Peter & Jerry C.Olson(1994).Understanding Consumer Behavior.RI CHARD
D.IRWIN,INC.
Paul Hague, Nick Hague & Coral-Ann Morgan (2004). Marketing Research in
Practice: a guide to basic.Kogan Page Ltd.
Philip Kotler & Kevin lane Keller (2006). Marketing Management (12th ed.).New
Jersey, Pearon Education, Inc.
Internet
Euromonitor International,Retrived March 5,2009 from
http://www.portal.euromonitor.com/passport/ResultsList.aspx.

137
APPENDIXS

138
Appendix A: Questionnaire for Carbonate Soft Drinks Study
Location
� 1) Siam Paragon (No……...….…)
� 2) Muangthong Thanee (No……………)
� 3) Chachoengsao (No……………)
Do you drinks carbonate soft drinks?
� 1) Yes
� 2) No (stop)
Have you ever buy carbonate soft drinks at 7-Eleven?
� 1) Yes
� 2) No (stop)
Part I: Classification Please check mark (����) by your answer in the space provided
1) Age: � 1) 15-20 years
� 2) 21-25 years
� 3) 26-30 years
� 4) 31-35 years � 5) 36-40 years � 6) 40-45 years
2) Gender: � 1) Male
� 2) Female

139
Part II: Consumer’s behavior towards carbonate soft drinks at 7-Eleven Please check mark (����) by your answer in the space provided
1) How often do you purchase carbonate soft drinks at 7-Eleven?
� 1) Once a month � 2) Once a week
� 3) 2-3 times a week � 4) 3-4 time a week
� 5) 5-6 times a week � 5) Everyday
2) What time do you normally purchase carbonate soft drinks at 7-Eleven?
� 1) Before 9.00 hrs � 2) 9.00-12.00 hrs
� 3) 12.00-15.00 hrs � 4) 15.00-18.00 hrs
� 5) 18.00 hrs later
3) How many people were in your group when purchasing carbonate soft drinks?
� 1) Alone (go to No.5) � 2) 2-3 peoples
� 3) 3-5 peoples
4) Who do you go with when purchasing carbonate soft drinks at 7-Eleven?
� 1) Family � 2) Friend
� 3) Colleague � 4) Boy/Girl friend
5) Have you planed or un-plan when purchase carbonate soft drinks at 7-Eleven?
� 1) Planed � 2) Un-planed
6) What items do you purchase with carbonate soft drinks at 7-Eleven?
� 1) Frozen Food � 2) Snack
� 3) Household � 4) Magazine/Newspaper
� 5) Bread/Hot dog bar � 6) Others soft drinks
� 7) Other

140
7) What pack size of carbonate soft drinks do you normally purchase at 7-Eleven?
� 1) 325 ml in can � 2) 700 ml in bottle
� 3) 1.25 liters in bottle � 4) 2 liters in bottle

141
Part II: Consumer attitude’s towards carbonate soft drinks.
1) Please advice 100 points among each of the following attributes when shopping for carbonate soft drinks according to your degree of liking for each.
__________Brand name
__________Packaging
__________Taste
__________Formula
__________Price
__________Promotion
100
2) Please indicate your degree of agreement or disagreement regarding carbonate soft drinks answering need factors of drinking.
Consumer needs factors of drinking Strongly Disagree
(1)
Disagree
(2)
Neither Agree nor
Disagree (3)
Agree
(4)
Strongly Agree
(5)
1. Carbonate soft drinks offers thirst release
2. Carbonate soft drinks offer affordable price
3. Carbonate soft drinks offers a convenience consumption
4. Carbonate soft drinks offers a good image and Status to a purchaser in public.
5. Carbonate soft drinks offers the consumer to achieve self actualization /sociability
6. Carbonate soft drinks offer healthy benefit.

142
3) a. Check all the brands of carbonate soft drinks that you have ever drank (Check all that apply) b. Check the one you drink most often (Check one box) c. Check the one brand you will probably buy next (Check one box) d. For each brand please indicate how much you like the brand overall. Rate each brand, whether you have drank the brand or not
D. Brand satisfaction
Brands
A. Ever drunk
B. Drink most often
C. Will buy next
Absolutely dissatisfying
(1)
Very dissatisfying
(2)
Dissatisfying
(3)
Satisfying
(4)
Very Satisfying
(5)
Absolutely Satisfying
(6)
Coke
Coke Zero
Coke Light
Fanta Orange
Fanta Strawberry
Fanta Salaberry
Sprite
Pepsi
Pepsi Max
Pepsi Twist
Pepsi Green
7 Up
Mirinda Orange
Mirinda Lemonade
Calpico Soda
A&W Root beer

143
Appendix B: ������������ ��
���������ก�����������������ก�� ��������� ���!"��� #�
���$%�
� 1) ��������ก� (�������� �����……………)
� 2) ���������� (�������� �����……………)
� 3) �� ��� ��� (�������� �����……………)
�&' ��������� ���!"��� #�(���)�� ?
� 1) ��� � 2) ��� (����ก��� ��!")
�&'���*�!������� ���!"��� #�$%� 7-Eleven (���)��
� 1) ��� � 2) ��� (����ก��� ��!")
��$%� 1: �����#������$���)+��������������� ��,(�$���% ������(��� ���� #, � (������#��ก$%���������������+- ����$��
1) �#: � 1) ���
� 2) �$��
2) ����: � 1) 15-20 %&
� 2) 21-25 %& � 3) 26-30 %& � 4) 31-35 %& � 5) 36-40 %& � 6) 40-45 %&

144
��$%� 2 ����ก���ก��������/ก��*�!������� ���!"��� #���#�ก������ 7-Eleven
1) '�(��)� '���������) ��*������ 7-Eleven ����'���?
� 1) �����'�*)� � 2) �*%���+��'�*)� � 3) 2-3 '�*)�,���*%���+
� 4) 3-4 '�*)�,���*%���+ � 5) 5-6 '�*)�,���*%���+ � 6) ��ก!*
2) -��%�ก,��.!'�(/�)� '���������) ��*������ 7-Eleven !����?
� 1) 24.00-06.00 . � 2) 06.00-12.00 . � 3) 12.00-15.00 .
� 4) 15.00-18.00 . � 5) 18.00 -24.00 .
3) ����'�(��/�)� '���������) ��*������ 7-Eleven '�(��ก��'?
� 1) ��' ���! (�%,���.� 5) � 2) 2-3 ' � 3) 3-5 '
4) ����'�(��/�)� '���������) ��*������ 7-Eleven %�ก,��.!'�(��ก*��'�?
� 1) '���'�*! � 2) ���� � 3) ������!��� � 4) 0
5) ����'�( ���ก/�)� '���������) ��*������ 7-Eleven %�ก,��.!'�(��ก��!��1��ก����!��.��������?
� 1) !��1��!��.� � 2) ,*����"/�)�����.�
6) ����'�(/�)� '���������) ��*������ 7-Eleven -��%�ก,��.!'�(/�)�) ��*�������'.�%�� 2���?( ���ก �����.� ���!)
� 1) ������ � �3"�4%���3� � 2) ��ก���ก��� � 3) '�������.2����.�
� 4) �,����/�*��������+ � 5) ��%5�/��.ก��ก � 6) '���������%�� 2����6
� 7) ���6
7) ����'�(/�)� '���������) ��*������ 7-Eleven -��%�ก,��.!'�("�/�)��������"�2*(7+ �����?
� 1) ก��%8�� 325 �������,� � 2) �!� 700 �������,�
� 3) �!� 1.25 ��,� � 4) �!� 2 ��,�
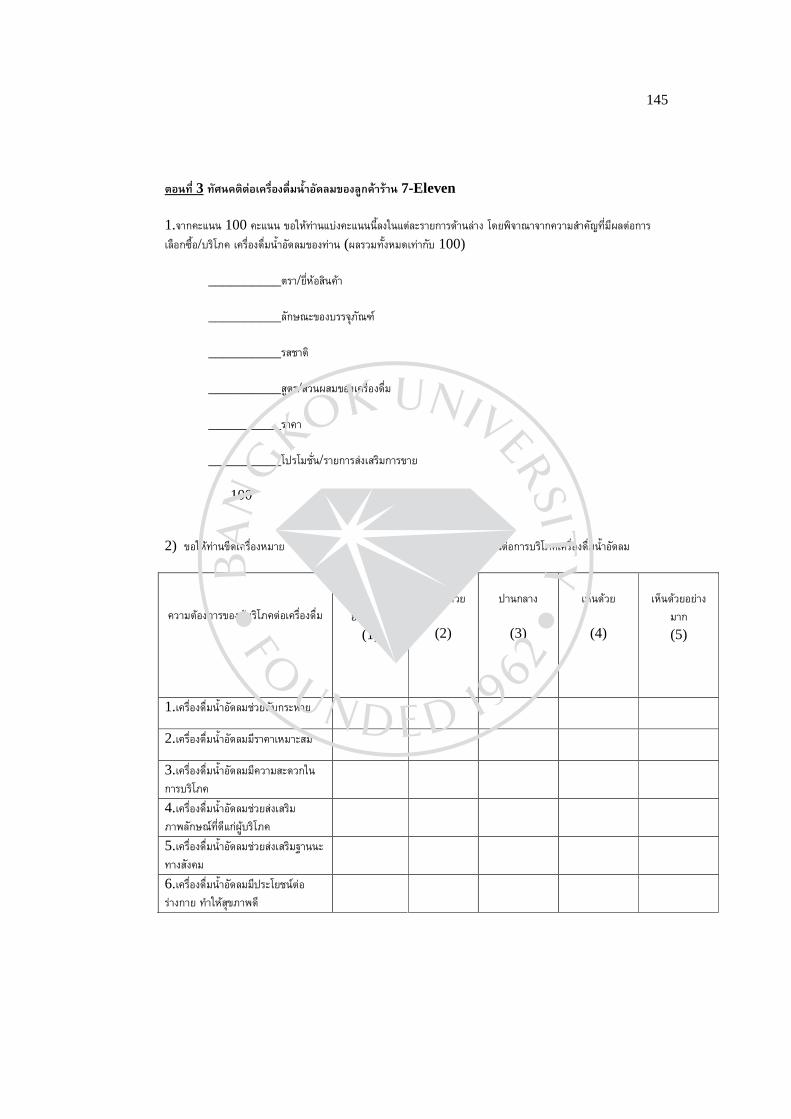
145
��$%� 3 $�.������������ ���!"��� #���#�ก������ 7-Eleven
1."�ก'� 100 '� ����.������'��)���,������ก���.����� -����"�(�"�ก'!��� �'*$�����1�,��ก�� ���ก/�)�/���-2' '���������) ��*��������� (1��!��*)���� ���ก*� 100)
__________,��/����.���'.�
__________�*ก9(�������"�2*(7+
__________����,�
__________�4,�/��!1����� '���������
__________��'�
__________-%�-��*�/���ก����� ����ก�����
100
2) ����.������ '��������� � �,*! ���ก���,��,���2��'!�� %:"���������,��ก�����-2' '���������) ��*���
'!��,.��ก�����14.���-2',�� '������������ �3�.!��������ก
(1)
��� �3�.!�
(2)
%�ก���
(3)
�3�.!�
(4)
�3�.!��������ก(5)
1. '���������) ��*�����!��*�ก�����
2. '���������) ��*�������'� ������
3. '���������) ��*�����'!�����!ก�ก�����-2'
4. '���������) ��*�����!���� ����2���*ก9(+�����ก�14.���-2'
5. '���������) ��*�����!���� ����;������*�'�
6. '���������) ��*�����%��-��+,������ก�� � ���.���2����

146
3) ก.����.���ก��(���� '��������� � ��� � -����"��(�"�ก '���������) ��*��������� '����� ( ���ก��.��กก!�� 1 �.�)
�.����.���ก��(���� '��������� � ��� � -����"��(�"�ก '���������) ��*����������������������� ( ���ก ���� �.�) '.����.���ก��(���� '��������� � ��� � -����"��(�"�ก '���������) ��*�����������""� ���ก/�)��'�*)��*��%2������� !�� ��� ( ���ก ���� 1 �.�)�.����.���ก��(���� '��������� � ��� � -����"��(�"�ก'!�����/'!���<����"��������,�� '���������) ��*����,������ -�� 1 �����<���������ก������ �� 10 �����<� �����ก������ ��.'� '���������) ��*����,�������<��.!�������""���� '����-2'ก3,��
�.���*�'!���<����"/'!�����
,����'.�
ก. '�����
�. ��������������
'. "�/�)��'�*)��*��%
��������ก������ (1)
��������ก
(2)
������
(3)
���
(4)
�����ก
(5)
�����ก������ (6)
-'.ก
-'.ก /�-��
-'.ก ���+
0,.� ���.�
0,.� ���,�� �����
0,.� ����� �����
��%��+
%%/��
%%/�� �3ก/+
%%/�� �!���+
%%/�� ก��
/ !� �*�
�����.����.�
�����.� �����!
'��%=-ก. -/��
� ��+ �*����! �4� ����+
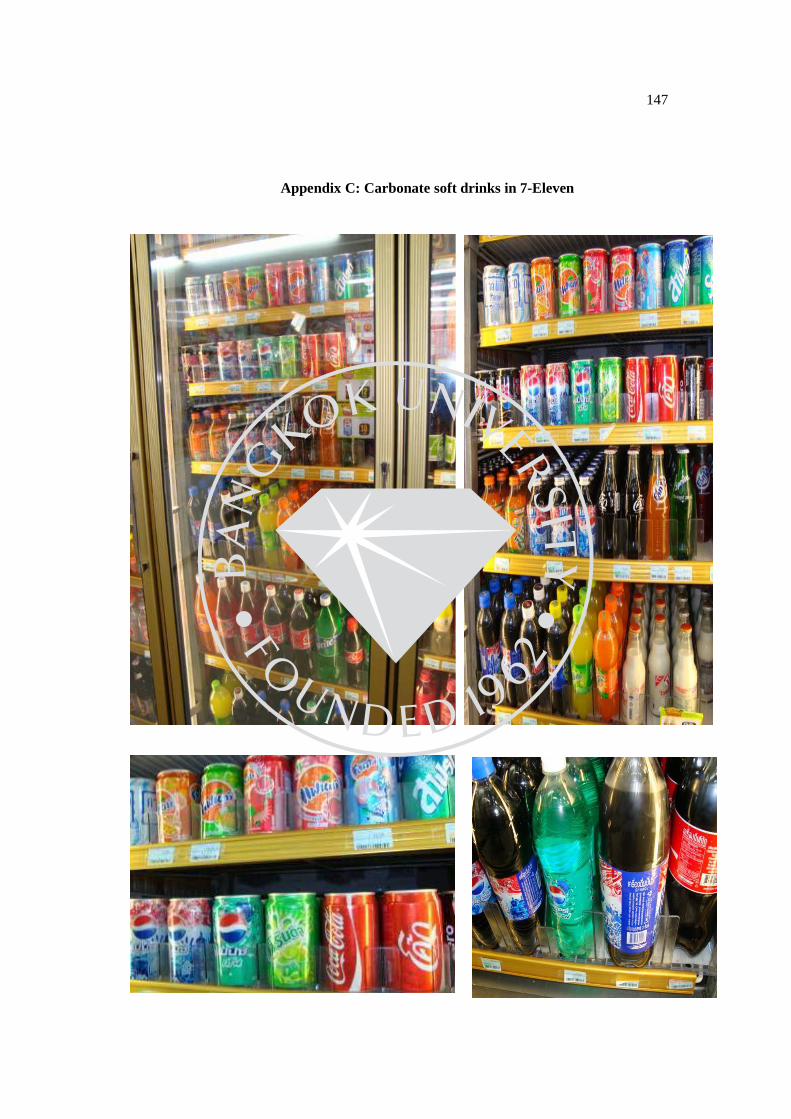
147
Appendix C: Carbonate soft drinks in 7-Eleven
148
BIODATA
Name : Miss Arunee Nakmongkol
Date of Birth : 2 March 1977
Place of Birth : Chachoengsao, Thailand
Nationality : Thai
Residence : Thailand
Education : Rajchabhat Pranakorn University (Computer Science), 1999.
: Bangkok University; Master of Business Administration, 2009.