The Status and Future of EVs - NCPA
15
The Status and Future of EVs Sandra Berg, Vice Chair, California Air Resources Board Daniel Sperling, CARB and UC Davis September 25, 2019 Squaw Valley, California 1
Transcript of The Status and Future of EVs - NCPA
The Status and Future of EVs
Sandra Berg, Vice Chair, California Air Resources Board
Daniel Sperling, CARB and UC Davis
September 25, 2019
Squaw Valley, California
1

Electric Utility Transportation Electrification
2

Mobile Source Emissions are Significant
3
Areawide4%
Stationary13%
Light-Duty Vehicles
18%
Heavy-Duty Vehicles
35%Other Mobile
Sources30%
South Coast Air Basin NOx Emissions (2017)
Recycling and Waste
3%
High GWP5%
Industrial21%
Electric Power16%
Residential & Commercial
10%
Agriculture9%
Light-Duty Vehicles
29%
All Other Transportation
7%
California GHG Emissions(2017)
Mobile
Sources
>80%
Mobile
Sources
~35%
Mobile sources represent ~50% of GHG inventory
when including emissions from fuel production
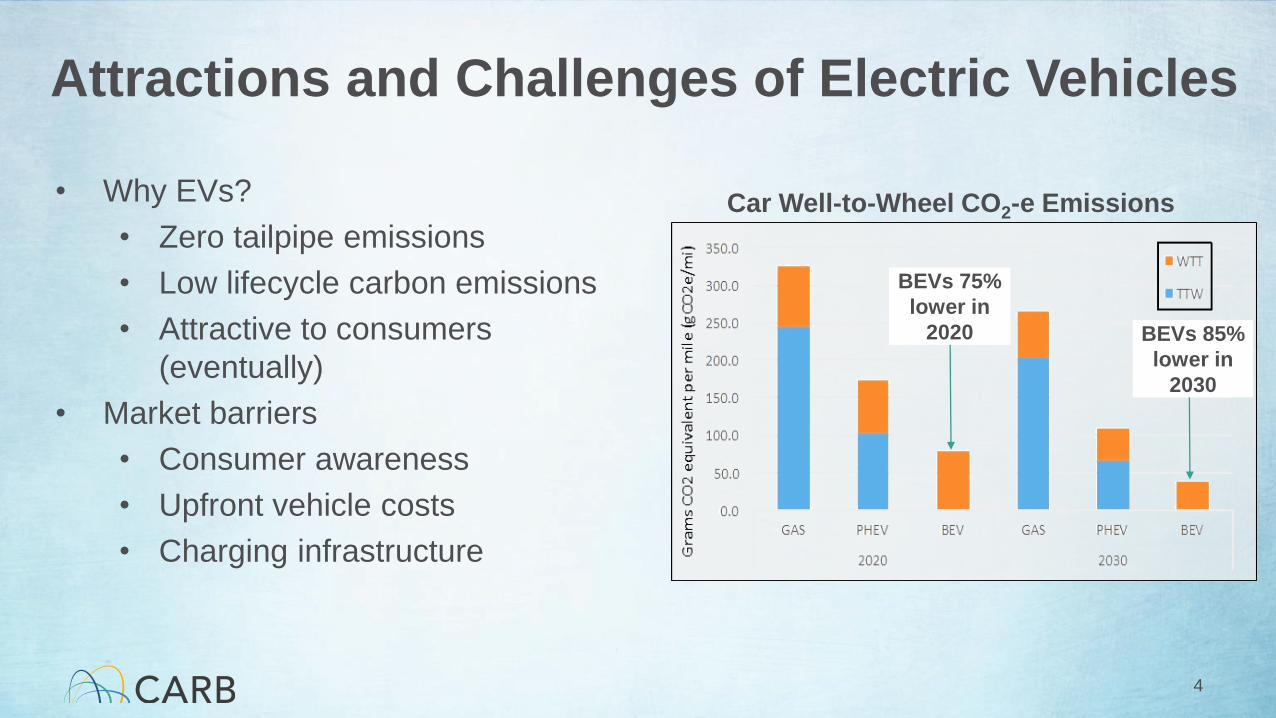
BEVs 75%
lower in
2020 BEVs 85%
lower in
2030
Car Well-to-Wheel CO2-e Emissions
Attractions and Challenges of Electric Vehicles
• Why EVs?
• Zero tailpipe emissions
• Low lifecycle carbon emissions
• Attractive to consumers
(eventually)
• Market barriers
• Consumer awareness
• Upfront vehicle costs
• Charging infrastructure
4
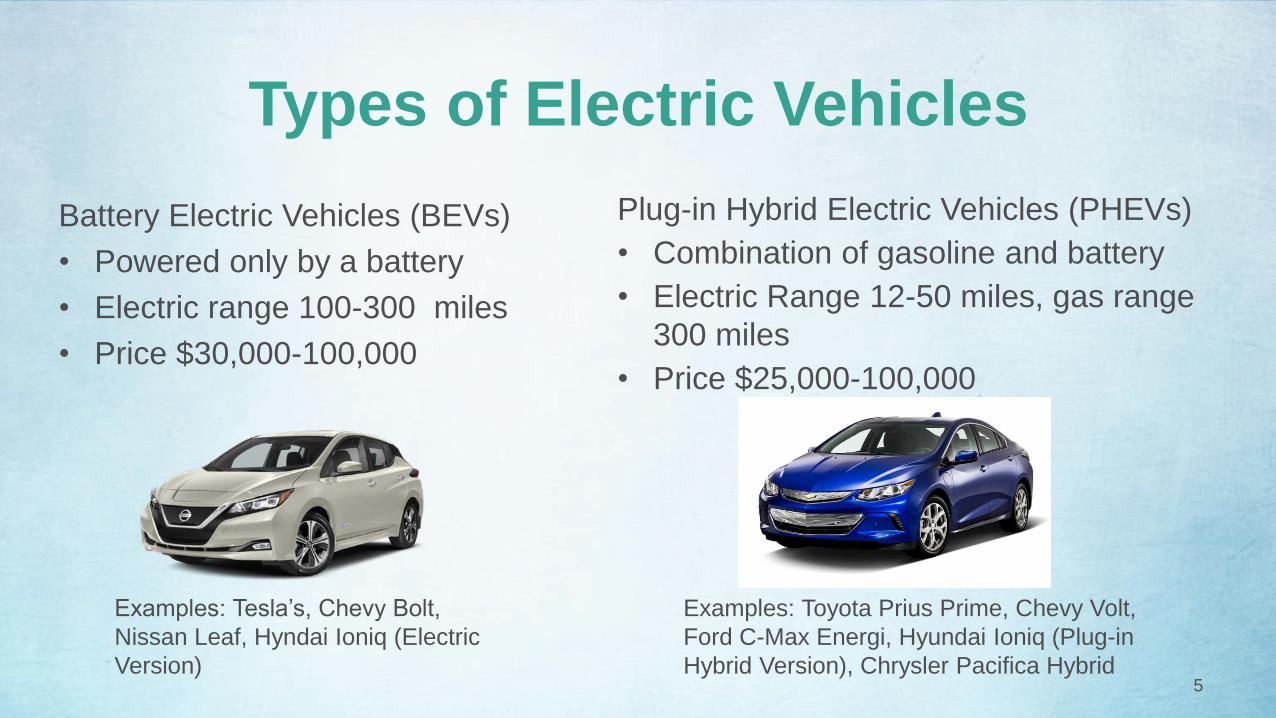
Types of Electric Vehicles
Battery Electric Vehicles (BEVs)
• Powered only by a battery
• Electric range 100-300 miles
• Price $30,000-100,000
Plug-in Hybrid Electric Vehicles (PHEVs)
• Combination of gasoline and battery
• Electric Range 12-50 miles, gas range
300 miles
• Price $25,000-100,000
5
Examples: Tesla’s, Chevy Bolt,
Nissan Leaf, Hyndai Ioniq (Electric
Version)
Examples: Toyota Prius Prime, Chevy Volt,
Ford C-Max Energi, Hyundai Ioniq (Plug-in
Hybrid Version), Chrysler Pacifica Hybrid

Model Availability
03 October 2019
6
0
100
200
300
400
500
600
Mo
dels
fo
r S
ale
Global
0
10
20
30
40
50
60
Mo
dels
fo
r S
ale
US


ZEVs Gaining Momentum & Market Share
8Source: Auto Alliance Sales Dashboard for 2011 through December 2018
0
1
2
3
4
5
6
7
8
9
0
20,000
40,000
60,000
80,000
100,000
120,000
140,000
160,000
180,000
2011 2012 2013 2014 2015 2016 2017 2018
An
nu
al M
ark
et
Sh
are
(%
)
Ve
hic
le S
ale
s
Annual California Light-Duty ZEV and PHEV Sales
Total ZEV & PHEV Sales Market Share

Global Plug-in Electric Vehicle Sales
03 October 2019
9
0
500,000
1,000,000
1,500,000
2,000,000
2,500,000
2008 2009 2010 2011 2012 2013 2014 2015 2016 2017 2018
An
nu
al
Sale
s
China USA Norway Germany UK
France Japan Canada Korea Sweden
Netherlands Belgium Spain Italy Other

ZEV Infrastructure is Critical
EV Charging
• AB 8 investments
• Electrify America Volkswagen investments
• Go-Biz and CEC support for local government planning
• Building standards for new construction
• Electric utility transportation electrification
10

ZEV Consumer Incentive Programs
• Federal ZEV $7,500
• CA State Rebate
• $5,000 – Fuel Cell
• $2,500 – BEV
• $1,500 – PHEV
• Clean Vehicle Assistance Program
• Clean Cars 4 All
• Regional Air District ZEV Grants
• Clean Fuel Reward (CFR) Program (2020)
11
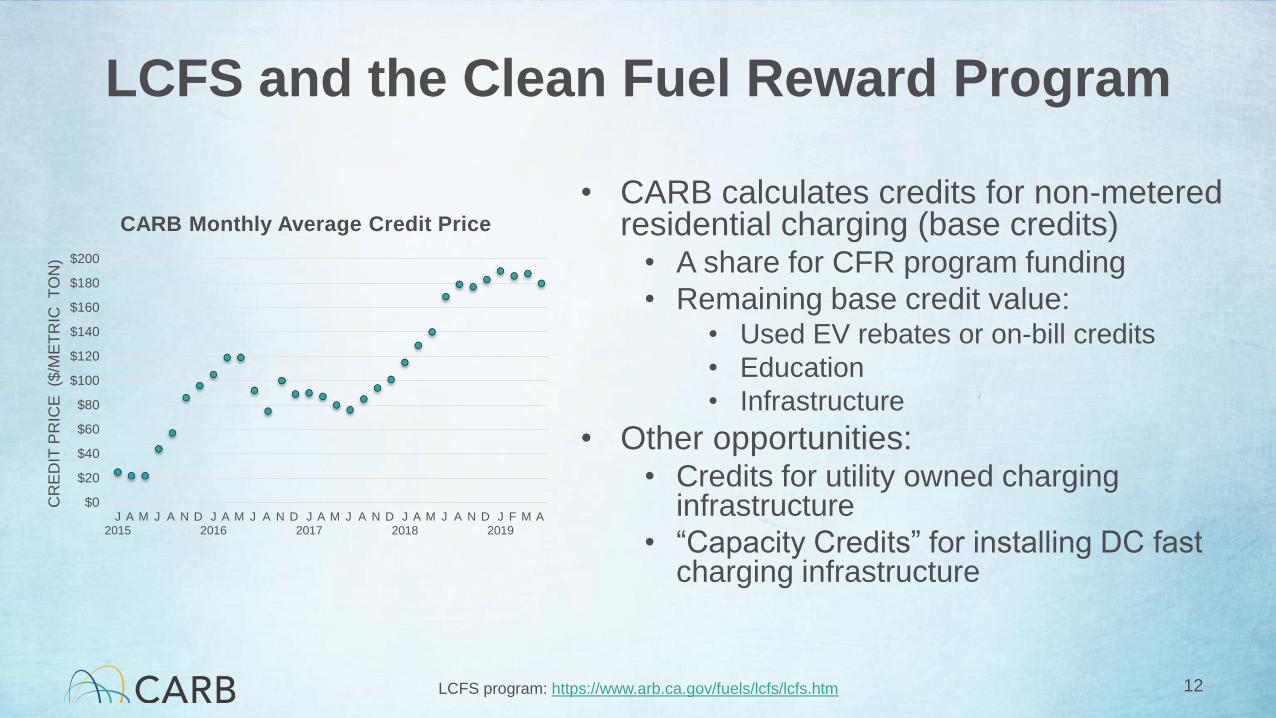
LCFS and the Clean Fuel Reward Program
• CARB calculates credits for non-metered residential charging (base credits)
• A share for CFR program funding
• Remaining base credit value: • Used EV rebates or on-bill credits
• Education
• Infrastructure
• Other opportunities: • Credits for utility owned charging
infrastructure
• “Capacity Credits” for installing DC fast charging infrastructure
12LCFS program: https://www.arb.ca.gov/fuels/lcfs/lcfs.htm
$0
$20
$40
$60
$80
$100
$120
$140
$160
$180
$200
J2015
A M J A N D J2016
A M J A N D J2017
A M J A N D J2018
A M J A N D J2019
F M A
CR
ED
IT P
RIC
E ($
/ME
TR
IC T
ON
)
CARB Monthly Average Credit Price

And Trucks and Buses Too
• Buses
• Gradual transition to 100% ZEBs by
2040
• Zero Emission Airport Shuttle
• 100% zero emission by end of 2035
• Medium and Heavy Duty Trucks
next….
13

14
Regulations
Help ensure ZEVs are produced and that
fleets use them
Incentives
Help encourage consumers and fleets to purchase and test
ZEVs
Supporting Programs
Help provide fueling infrastructure,
education, and best practices
ZEV Programs