The Social Cost of Government Regulation of Milk
34
The Social Cost of Government Regulation of Milk Author(s): Richard A. Ippolito and Robert T. Masson Source: Journal of Law and Economics, Vol. 21, No. 1 (Apr., 1978), pp. 33-65 Published by: The University of Chicago Press Stable URL: http://www.jstor.org/stable/725140 Accessed: 08/03/2009 15:20 Your use of the JSTOR archive indicates your acceptance of JSTOR's Terms and Conditions of Use, available at http://www.jstor.org/page/info/about/policies/terms.jsp. JSTOR's Terms and Conditions of Use provides, in part, that unless you have obtained prior permission, you may not download an entire issue of a journal or multiple copies of articles, and you may use content in the JSTOR archive only for your personal, non-commercial use. Please contact the publisher regarding any further use of this work. Publisher contact information may be obtained at http://www.jstor.org/action/showPublisher?publisherCode=ucpress. Each copy of any part of a JSTOR transmission must contain the same copyright notice that appears on the screen or printed page of such transmission. JSTOR is a not-for-profit organization founded in 1995 to build trusted digital archives for scholarship. We work with the scholarly community to preserve their work and the materials they rely upon, and to build a common research platform that promotes the discovery and use of these resources. For more information about JSTOR, please contact [email protected]. The University of Chicago Press is collaborating with JSTOR to digitize, preserve and extend access to Journal of Law and Economics. http://www.jstor.org
Transcript of The Social Cost of Government Regulation of Milk

The Social Cost of Government Regulation of MilkAuthor(s): Richard A. Ippolito and Robert T. MassonSource: Journal of Law and Economics, Vol. 21, No. 1 (Apr., 1978), pp. 33-65Published by: The University of Chicago PressStable URL: http://www.jstor.org/stable/725140Accessed: 08/03/2009 15:20
Your use of the JSTOR archive indicates your acceptance of JSTOR's Terms and Conditions of Use, available athttp://www.jstor.org/page/info/about/policies/terms.jsp. JSTOR's Terms and Conditions of Use provides, in part, that unlessyou have obtained prior permission, you may not download an entire issue of a journal or multiple copies of articles, and youmay use content in the JSTOR archive only for your personal, non-commercial use.
Please contact the publisher regarding any further use of this work. Publisher contact information may be obtained athttp://www.jstor.org/action/showPublisher?publisherCode=ucpress.
Each copy of any part of a JSTOR transmission must contain the same copyright notice that appears on the screen or printedpage of such transmission.
JSTOR is a not-for-profit organization founded in 1995 to build trusted digital archives for scholarship. We work with thescholarly community to preserve their work and the materials they rely upon, and to build a common research platform thatpromotes the discovery and use of these resources. For more information about JSTOR, please contact [email protected].
The University of Chicago Press is collaborating with JSTOR to digitize, preserve and extend access to Journalof Law and Economics.
http://www.jstor.org

THE SOCIAL COST OF GOVERNMENT REGULATION OF MILK*
RICHARD A. IPPOLITO and ROBERT T. MASSON Civil Aeronautics Board Cornell University
U.S. Department of Justice
INTRODUCTION
IN the United States there are almost 300,000 dairy farmers, none of whom possess any significant market power. Yet, the markets for raw fluid milk in the United States diverge considerably from what would be expected in a competitive environment. The reason for this divergence is the existence of federal and state regulations that affect prices, outputs, costs, and locations of milk flows throughout the United States. The regulations have existed in some parts of the country for over forty years, but the portion of U.S. output which is subject to government regulation has steadily increased. Of the 1.1 billion hundredweight of raw milk sold in the United States in 1973 (valued at $8 billion), approximately 60 per cent was produced in federally regulated areas; another 15 per cent was subject to state regulation.
These regulations employ a price discrimination scheme whereby the price paid for raw grade A milk designated for fluid uses (for example, bottled milk) is higher than the price paid for milk designated for manufacturing uses (for example, cheese, butter, powdered milk, and ice cream). Grade B milk, which is not regulated, passes lower sanitation standards and may only be used for manufactured products. Virtually all grade A milk is regulated. The federal regulations cover about 78 per cent of the grade A milk produced in the United States, and state regulations cover an additional 18 per cent. In an earlier article KesselI considered some of the historical reasons behind the development of the federal order system and provided a simple analysis of the operation of a single federal order.
In this paper we develop a model of regulated milk markets in the United States. Using this model, the price and output effects of regulation on regu- lated and unregulated areas will be illustrated, and, further, estimates will be made of the inefficiencies and transfers inherent in the schemes. We will
* Nothing herein is intended to represent or should be construed as representing the views of any agency of the United States Government.
l Reuben A. Kessel, Economic Effects of Federal Regulation of Milk Markets, 10 J. Law & Econ. 51 (1967).
33

34 THE JOURNAL OF LAW AND ECONOMICS
also explore the announced goals of regulation and examine how these goals, together with the spatially related character of the market, determine the observed configuration of prices, outputs, production locations, and milk flow restrictions. Our analysis covers only price regulations and does not treat the price support system. The year 1973 was chosen for empirical analysis because of the low involvement of price-support purchases of milk products.
There are both state and federal milk regulations. But state regulations generally exhibit the same relevant characteristics as federal regulations. Hence, our explanation of the history and our discussion of the analytical framework of milk regulation will focus on the system of federal regulation; the interactions between federal- and state-regulated areas will be consid- ered later.
HISTORICAL UNDERPINNINGS OF THE SYSTEM OF FEDERAL REGULATION
A review of the history of the milk market prior to the development of federal regulation in the 1930s is useful for understanding the development and continuation of federal regulations, their relevance at the time they were passed, and their relevance for today's economy. Raw milk is a highly perishable product; even with refrigeration, high bacteria counts develop rapidly. Without refrigeration, milk is storable for very short periods of time and can be transported over very short distances. Hence, in the early 1900s, farmers were forced to deal with one or very few local handlers (namely, processors), thus conferring some degree of monopsony power to buyers of milk.
Ostensibly to offset this power, a section on cooperatives was included in the 1914 Clayton Act,2 and in 1922 the Capper-Volstead Act3 was passed by Congress. These acts allowed farmers to join together into bargaining cooperatives to market their milk. The creation of farm cooperatives soon followed which established "classified pricing" schemes based on the "use class" of milk. These price discrimination schemes sought to take advantage of the relatively inelastic demand for fluid milk products without unduly restricting demand for more elastic manufactured milk products like cheese. They therefore established a higher price for raw milk destined for fluid uses vis-a-vis milk destined for manufacturing uses. In its simplest form, a cooperative would raise the price of milk for bottling, which has a very low marginal revenue, and release the displaced milk for manufactured products at higher marginal revenue (albeit at a lower price). For any quantity of
2 Clayton Act, ch. 323, 38 Stat. 730 (1914). 3 Capper-Volstead Act, ch. 57, 42 Stat. 388 (1922).

35 COST OF GOVERNMENT REGULATION OF MILK
milk, this shifting based on marginal revenues raises total revenues and
average revenues or farm milk prices.4 Milk designated for bottling use is generally referred to as Class I milk, and milk designated for manufacturing products is generally referred to as Class II milk.5 The cooperative would multiply Class I and Class II prices times the quantity of milk sold for bottling and manufacturing purposes respectively and divide by its total milk sold to arrive at a weighted average or "blend price" that it would pay to cooperative members. Classified pricing, though, sows the seeds of its own destruction because it invites output expansion and free riding. As we show below, by raising the average price received by farmers, the system of classified pricing raises the milk production of farmers. Although monopoly power is operating to raise the price and reduce the quantity in the fluid bottling market, the effect at the farm level is to raise the price of raw milk and to increase the total quantity of milk produced.
More importantly, classified pricing provides an incentive for individual farmers to act as free riders. That is, suppose that a cooperative set a price of $3.00 per hundredweight of milk sold for fluid uses and $2.00 per hun- dredweight sold for manufacturing uses. Then, if 90 per cent of the coopera- tive's milk was used for fluid bottling purposes, its producer members would receive an average price, or blend price, equal to $2.90 per hundredweight. But then an individual farmer has the incentive to leave the cooperative and market all of his milk to a bottler at a price somewhat below $3.00, say $2.95. By so doing, he could raise his average supply price by $.05 per hundredweight. Moreover, as the cooperative's blend price attracts output expansion, the incentive to free ride becomes even more intense. That is, since the Class I price (and hence Class I quantity) is pegged, output expan- sion leads to progressively larger amounts of Class II milk being produced relative to Class I; hence, the cooperative's blend price tends to fall farther below the Class I price. To illustrate, consider a cooperative which has 50 per cent of its milk used for bottling purposes; at the same $3.00 and $2.00 prices, that cooperative's blend price would then be $2.50. But if a farmer could find a bottler that would buy his milk year round for bottling purposes at a $2.95 price, he could increase his return by $.45 per hundredweight by free riding. Thus, by raising farmers' returns through classified pricing over a period of several years, farmers would increase their output, putting more pressure on the
4 See Edwin W. Gaumnitz & Ofie M. Reed, Some Problems Involved in Establishing Milk Prices (USDA, 1937) for a discussion of this period of developing cooperative market power and for an economic model of classified pricing. 5 Sometimes manufacturing products are sold in two or more categories and the milk then is generally referred to as Class II, Class III, and Class III special milk.

36 THE JOURNAL OF LAW AND ECONOMICS
cooperatives' ability to maintain classified pricing due to the free-rider prob- lem. By the same logic, these free-rider problems would be increased consid- erably if the demand for bottled milk decreased.
As a consequence of free-rider problems, cooperatives would-par- ticularly if they could find an alternative outlet for their milk-have an incentive to strike, that is, cut off any handler who purchased milk from free riders. Processors, fighting the increased marketing power of cooperatives, would use lockouts of milk when they could find alternative milk sources. As a result, some milk markets were characterized by unusual instability during the late 1920s.
With the advent of the depression in the 1930s, the demand for fluid milk fell. Hence, proportionally more milk was used for manufacturing products, exacerbating the free rider problem. This, along with the social climate of the time, led to withholding actions, lockouts, violence, and instability in several milk markets. By 1932 the milk markets had collapsed: the average prices received by farmers for milk fell from about $2.53 per hundredweight in 1929 to $1.28 in 1932 and $1.30 in 1933. During the period from 1929 to 1933, prices paid by dairy farmers for their inputs fell by roughly 15 per cent.6
In 1937 the Agricultural Adjustment Act was passed.7 This act established minimum prices for Class I and Class II milk in any marketing area where two-thirds of the producers (or producers representing two-thirds of the milk output) voted for federal regulation. The act also provided for auditing procedures carried out by a United States government "market adminis- trator" to verify the usage by the class of milk purchased by the processors. Within a marketing area, the handlers would pay a Class I price for the milk they used for bottling and a Class II price for the milk they used for man- ufacturing purposes. The government could then ensure that the blend price was paid to farmers whose milk went to the plants which sold milk in a defined area regardless of whether or not the individual farmer's milk was shipped to a bottling plant or a manufacturing plant. In addition, the gov- ernment audit ensured that the prices paid by handlers for the milk they purchased reflected the amount of milk destined for bottling purposes.8 In
6 U.S. Dep't of Agriculture (USDA), Stat. Bull. No. 175 Agricultural Marketing Service, Crop Reporting Board, Milk: Production, Distribution and Income: Revised Estimates 1950-54 (April 1956). The input price decline is calculated by use of the parity ratio as reported in 77 Cong. Rec. 688-901 (1933) (remarks of Rep. Frear).
7 The Agricultural Adjustment Act, ch. 25, ?? 1, 2, 48 Stat. 31, 32 (1933) started with a "Declaration of Emergency" due to ". .. a severe and increasing disparity between the prices of agricultural and other commodities." The 1933 act was designed to ". . . reestablish prices to farmers at a level that will give agricultural commodities a purchasing power . . . equivalent to the purchasing power of agricultural commodities in the base period [August 1909-July 1914]."
8 Moreover, because butterfat in milk has a different value than the milk itself, a United

37 COST OF GOVERNMENT REGULATION OF MILK
short, the act put the government in the role of policing the two-price scheme. (The state acts have also generally included these provisions.)
The coverage of these regulations increased from the late 1930s; by 1945, 34.6 per cent of total U.S. grade A milk was federally regulated, and 58 per cent was regulated by state and/or federal regulation. By 1955 the latter figure increased to 75 per cent; by 1965 it was 92 per cent, and by 1973 it was 96 per cent.9
Ostensibly, the aims of the act were to reduce violence and instability; to prevent over-disinvestment in milk farming owing to unusually low depres- sion prices with a consequent long lag before supply could be adequately reinstated; to raise producers' incomes; and to "assure an adequate supply of milk" for fluid bottling (a notion to be discussed later).
Perhaps it can be argued that the degree of power given to farmers was appropriate to offset monopsony power of buyers at the time, given the peculiar economic conditions that existed during the Depression. These con- ditions are no longer pertinent today, yet supracompetitive milk prices still prevail. The estimated differential cost of producing grade A vis-a-vis grade B milk (to satisfy the fluid bottling health requirements) is estimated to be 15 cents per hundredweight.'? Yet in the Chicago area where massive milk surpluses abound, the regulated difference between Class I and Class II prices was $1.26 in 1973." Still higher prices were established in markets farther from the surplus milk production areas in the upper Midwest.
In the next section we examine a static model of some of the direct costs of federal regulation, assuming a primary purpose for continued regulation is to raise farmer's incomes. We then discuss the interaction between federally regulated areas and state regulated areas. In the static model we compare the social costs of milk regulation with the competitive norm. We discuss possi- ble dynamic benefits of milk regulation after the static model and static social cost estimates have been developed. Most of the analysis is oriented toward determining a minimum bound on the costs of regulation. By this technique, we arrive at estimates of gross transfers to regulated farmers of approximately $210 million per year and estimates of deadweight losses of approximately $60 million per year.
States Department of Agriculture audit ensured that there was no cheating on the butterfat tests of milk to avoid paying the full classified price.
9 Alden C. Manchester, Market Structure Institutions and Performance in the Fluid Milk Industry 14 (USDA, 1974).
,o Roland W. Bartlett, Bringing Federal Order Class I Pricing Up to Date and In Line with Antitrust Regulation, in Dairy Marketing Facts 7 (Univ. of Illinois at Urbana-Champaign, Dep't of Agricultural Econ., AE-4335, 1974).
"l USDA, Summary of Major Provisions in Federal Milk Marketing Orders: January 1, 1973, 51 (1973).

38 THE JOURNAL OF LAW AND ECONOMICS
THE STRUCTURE OF MILK REGULATION TODAY
Milk regulation in the United States in 1973, our primary period of analy- sis, was composed of sixty federally regulated areas called "federal orders" and seventeen state-regulated areas (sometimes overlapping with federal orders). The state regulations are generally similar to federal regulations and, together, the federal and state orders comprised about 96 per cent of the grade A milk produced in the United States in 1973. Because, as we shall see, federal milk regulation effectively sets the levels of regulated milk prices, we will focus our explanation on the federally regulated areas. We first examine the equilibrium conditions in an idealized single isolated fed- eral order and then consider equilibrium when state and federal orders are interdependent.
Equilibrium in a Single Federal Order
Each federal order specifies minimum prices to be paid for Class I milk (for fluid bottling) and for Class II milk (for cheese, butter, milk powder, and other manufactured milk products). The Class I price Pi is higher than the Class II price P,,. Some divergence of Class I and Class II prices would occur in a competitive market. To qualify for fluid bottling, milk must come from a grade A dairy farm, one which satisfies higher sanitary standards than a grade B farm. Federal regulation applies only to grade A milk; grade B milk is sold in a free market.
The handlers (essentially purchasers of raw milk and sellers of milk prod- ucts) are regulated and audited and must pay (at least) the federally specified prices. A handler is regulated on the basis of the area where he makes the majority of his sales of Class I fluid milk product rather than on his plants' locations or his raw milk procurement area. Ignoring spatial factors, each handler pays the Class I price times the amount of bottled milk he produces into a governmentally regulated account. The government market adminis- trator then computes the average price paid for milk and pays this blend price to farmers regardless of the use class of an individual farmer's milk.12 At the regulated prices the farmer is thus indifferent between sending his milk to a Class I or Class II outlet. Knowing the quantity of Class I milk Q, and of Class II milk Q,, the blend price may be determined as
p =PiQl + P. Qll QI + Qi
'
Since farmers individually are price takers, the supply function in any given federal order may be specified as Qs = QS(Pb). The demand for Class I
12 The actual mechanics are slightly more complicated, but except for a lowering of transac- tion costs by the use of a "settlement fund," the actual system achieves essentially this result.

COST OF GOVERNMENT REGULATION OF MILK 39
milk may be specified as Qi = Qi(Pi)? With no loss of generality, we may assume that Class I demand is satisfied first. The residual satisfies Class II
consumption along a demand curve that is assumed to be infinitely elastic at the price Pn. The Class II price may be considered as exogenous for the individual order; that is, Class II milk products are interregionally fungible, and each federal order produces only a small portion of total Class II con- sumption in the United States. The United States Department of Agriculture (USDA) sets a Class II price based on the competitive price paid for milk in a
large unregulated manufacturing milk (grade B) area in the upper Midwest to be described shortly. With federal minimum prices of PI and PII for the
given order, market equilibrium is found by solving
P _ PIQI(PI) + PnI[Q(Pb) - Qi(Pi)] b
OSpW
for Pb. Graphically, this equilibrium is shown in Figure I. The average revenue curve AR is determined by varying Qii in the formula:
p = PIQI(PI) + PIIQII
Qi(Pi) + QII
For any set of prices Pi and Pii and any supply curve QS = Qs(P) producer incomes and rents will be increased by raising Pi if, and only if, the marginal revenue for Class I milk is below the marginal revenue/price of Class II milk. Otherwise, for any total quantity of milk, total revenues can be increased by transferring milk from low to high marginal revenue uses. In such cases, an increase in Pi leads to an upward shift of the AR curve and higher Ricardian rents. Figure I is constructed without MR curves because, as we note later, the regulated system is not operated at the rent-maximizing level, but at some lower, still supracompetitive, level..
Equilibrium Among Federal and State Orders
Spatially, within each order area, the Class II price is constant, but the Class I price and the blend price are adjusted by the system of regulation. Moving by concentric circles from any federal order market center, the Class I price and the blend price are reduced by the regulators by a factor of 1.5 cents per hundredweight per ten miles within the federal order. This 1.5 cents factor approximates the transport costs of milk. 13 Thus, within federal orders, prices are set so that a producer in any area is indifferent between selling milk to a nearby processor or to a processor located between his location and the federal order market center. A processor, by virtue of the
13 More recently the transport costs, but not the regulated differentials, have gone even higher.

40 THE JOURNAL OF LAW AND ECONOMICS
s pb ----><Aa
,*^-* og- *( Quantity
._ ?s ~ AI
FIGURE I EQUILIBRIUM FOR A SINGLE FEDERAL ORDER
Class I price differential, would be indifferent between locating near the farms or at a point between the farms and market center.14
These zone differentials are also important for understanding the general equilibrium properties between federal order areas. Kessel based his assump- tion of isolated federal orders on legal restrictions that limited the effective ability of a handler (for example, a processor) located in one order to buy milk from a handler not regulated by the same federal milk marketing order. These restrictions, however, did not prevent producers in one order from selling raw milk to processors in another order, nor did they sig-
14 Actually, transport costs for raw milk are marginally higher than the regulated differential and for packaged products slightly higher still. This is designed to have fluid milk come from nearby sources leading to bottling operations close to cities and manufacturing operations in "country plants."
COST OF GOVERNMENT REGULATION OF MILK 41
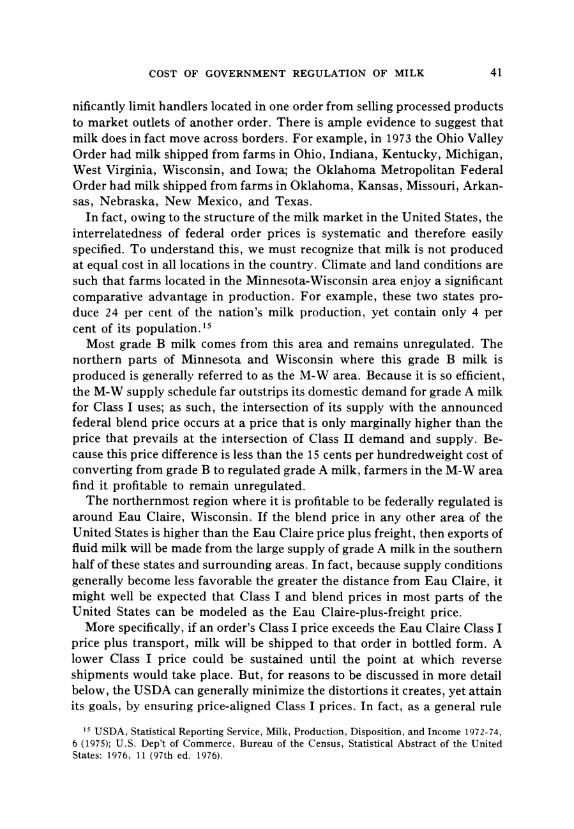
nificantly limit handlers located in one order from selling processed products to market outlets of another order. There is ample evidence to suggest that milk does in fact move across borders. For example, in 1973 the Ohio Valley Order had milk shipped from farms in Ohio, Indiana, Kentucky, Michigan, West Virginia, Wisconsin, and Iowa; the Oklahoma Metropolitan Federal Order had milk shipped from farms in Oklahoma, Kansas, Missouri, Arkan- sas, Nebraska, New Mexico, and Texas.
In fact, owing to the structure of the milk market in the United States, the interrelatedness of federal order prices is systematic and therefore easily specified. To understand this, we must recognize that milk is not produced at equal cost in all locations in the country. Climate and land conditions are such that farms located in the Minnesota-Wisconsin area enjoy a significant comparative advantage in production. For example, these two states pro- duce 24 per cent of the nation's milk production, yet contain only 4 per cent of its population.1s
Most grade B milk comes from this area and remains unregulated. The northern parts of Minnesota and Wisconsin where this grade B milk is produced is generally referred to as the M-W area. Because it is so efficient, the M-W supply schedule far outstrips its domestic demand for grade A milk for Class I uses; as such, the intersection of its supply with the announced federal blend price occurs at a price that is only marginally higher than the price that prevails at the intersection of Class II demand and supply. Be- cause this price difference is less than the 15 cents per hundredweight cost of converting from grade B to regulated grade A milk, farmers in the M-W area find it profitable to remain unregulated.
The northernmost region where it is profitable to be federally regulated is around Eau Claire, Wisconsin. If the blend price in any other area of the United States is higher than the Eau Claire price plus freight, then exports of fluid milk will be made from the large supply of grade A milk in the southern half of these states and surrounding areas. In fact, because supply conditions generally become less favorable the greater the distance from Eau Claire, it might well be expected that Class I and blend prices in most parts of the United States can be modeled as the Eau Claire-plus-freight price.
More specifically, if an order's Class I price exceeds the Eau Claire Class I price plus transport, milk will be shipped to that order in bottled form. A lower Class I price could be sustained until the point at which reverse shipments would take place. But, for reasons to be discussed in more detail below, the USDA can generally minimize the distortions it creates, yet attain its goals, by ensuring price-aligned Class I prices. In fact, as a general rule
'5 USDA, Statistical Reporting Service, Milk, Production, Disposition, and Income 1972-74, 6 (1975); U.S. Dep't of Commerce, Bureau of the Census, Statistical Abstract of the United States: 1976, 11 (97th ed. 1976).

42 THE JOURNAL OF LAW AND ECONOMICS
regulated Class I prices are accurately modeled as Eau Claire-plus-transport prices.
Blend prices are aligned by market forces. That is, if a federal order exhibits a supply curve that intersects its blend line AR at a price that exceeds the Eau Claire blend price plus transport, raw milk will be imported to the order; hence, blend prices will generally be aligned with Eau Claire. If an order exhibits a supply curve that intersects the blend line below the Eau Claire-plus-transport import price, then it will be isolated to some degree; hence, to the extent that federal orders are insulated, the blend prices will not be aligned completely. We will test the accuracy of the Eau Claire price-plus-transport model for Class I and blend prices after discussing the relation of state-regulated prices to the federal order model.
State order areas are also regulated on a classified pricing basis. State prices must approximate the federal prices in nearby markets because inter- state barriers to raw milk or milk product flows are unconstitutional unless overriding health and safety can be demonstrated by a state's authorities. Therefore state Class I and blend prices may also be modeled roughly as Eau Claire-plus-freight cost. The only significant exceptions to this rule pertain to milk produced west of the Rocky Mountains. Owing to unusually high transport costs from Eau Claire and favorable local milk producing condi- tions, regulated Class I and blend prices in some western areas are sig- nificantly lower than predicted by the Eau Claire-plus-freight model. Due to low transport costs of manufactured products, Class II prices are virtually uniform across all states. In several state-regulated areas, however, there are other factors that make alignment of blend prices only roughly equal to nearby federal order prices. Several states use grandfather clauses (or some- thing like rotating grandfather clauses) for milk qualification (eligibility to receive a regulated price rather than the Class II price), which tend to slow the tendency toward equilibrium. Other states have assigned market outlets and some employ so-called "base-surplus plans." As a first-order approxima- tion, however, the assumption of state-aligned prices is fairly accurate.
To illustrate the degree to which regulated prices are aligned across regu- lated markets, regressions were run using the Class I price and blend price in 79 federal and state orders. The blend price observations were made annu- ally over the period 1972-1974 and Class I price observations were made monthly for January, March, and May of 1973. If the system of regulation could be modeled as Eau Claire-plus-transport costs, a significant distance coefficient of $.0015 per mile (marginal transport cost) and an R-squared equal to one would be expected. If perfect market insulation existed, an insignificant distance coefficient and an R-squared equal to zero would be expected.
The results of the regressions are reported in Table 1. In addition to

TABLE 1 CLASS I AND BLEND PRICE ALIGNMENT ACROSS 79 REGULATED AREAS IN THE UNITED STATES
(t-value in parentheses)
Distance from Dependent Constant Eau Claire, Wisc. Federal West of Time Time Variable (dollars per cwt.) (in miles) Order Rocky Mts. 1 2 R2 D.W. n
Class I price* 6.76 .00127 -.436 -1.60 -.274 -.116 .775 1.42 228
(97.92) (25.02) (.94) (20.17) (6.03) (2.56) Blend
price** 7.77 .00137 -.237 -1.59 -2.19 -1.16 .901 1.48 230 (89.69) (21.46) (4.07) (16.45) (38.45) (20.44)
* Monthly data for January, March, and May, 1973. Sources: USDA, Statistical Reporting Service, Crop Reporting Board, Fluid Milk and Cream 18-19 (Feb. 1973); id., (April 1973); id., (June 1973). ** Annual data for 1972, 1973, and 1974. Mouicfs: USDA. Statistical Reporting Service, Crop Reportmg Board, Agricultural Prices: Annual Summary, 1972, dd., 1973; td., 1974; USDA, Ar.cultural Marketing Service, Dairy Division, Federal
Milk Order Market Statistics: Annual Summary for 1972, zd , 1973, Idt., 1974.
?
o <
0
t -z
Z
H
c:
r
S;
oz
M
r
4^

44 THE JOURNAL OF LAW AND ECONOMICS
distance from Eau Claire, the independent variables included time dummies (Time 1 and Time 2), a regulation dummy to measure the differential impact of federally regulated orders, and a location dummy for areas located west of the Rocky Mountains. The regressions yield an estimated-distance coefficient in the blend-price regression that is highly significant and only marginally below the $.0015 marginal transport cost expected. Moreover, the R-squared is .901, thereby suggesting that the model captures a large degree of the blend-price variation over the period. The distance coefficient and the R-squared in the Class I regression suggest that regulated prices are less perfectly aligned compared to blend prices but, still, the regression explains . 775 of the Class I price variation throughout the regulated markets of the United States.
The results also suggest that while Class I prices are set in coordination across federal and state orders, state regulations apparently succeed in dis- couraging the free flow of milk sufficiently so as to generate marginally higher blend prices than federal orders. Additionally, as expected, orders located west of the Rockies represent aberrations in the Eau Claire-plus- transport model: the Class I and blend prices in those areas are approxi- mately $1.60 below Eau Claire-plus-freight price. In general, however, as long as West Coast disparities are accounted for, the price-alignment data suggest that a model portraying regulated prices throughout the United States as the federal order price at Eau Claire-plus-freight is accurate to a first-order approximation.
Adequate Supplies of Fluid Milk
Thus far we have examined the structure of regulated milk prices throughout the United States, but we have yet to illustrate how the general level of regulated prices is determined. Kessel implied that prices were set to maximize farm rents in regulated areas. But empirical observation shows this assumption to be a misrepresentation of true equilibrium. Estimates of Class I demand elasticities are consistently and substantially less than unity in absolute magnitude, thereby implying a negative marginal revenue for Class I milk. Conversely, estimates of the Class II elasticity exceed unity.16 Thus, the federal price P, is below the rent-maximizing price. The phenom- enon might seem puzzling if we rely on a Stiglerian producer-serving in-
16 Elasticity estimates for Class I and Class II raw milk demand at the farm level are approximately -.23 and -1.36 respectively-these estimates are discussed in the Appendix. The regulated prices for Class I and Class II in the Chicago Federal Order, net of differential marginal cost of grade A milk production, were $7.16 and $6.15 in 1973 (see Appendix). Thus, the comparable marginal revenue at equilibrium output in 1973 was -$23.99 for Class I demand and +$1.66 for Class II demand. Therefore, the price spread in 1973 was considerably below the profit-maximizing level, one that requires net marginal revenues to be equal across markets.

45 COST OF GOVERNMENT REGULATION OF MILK
terpretation of regulation, but it is consistent with a Peltzman vote- maximizing view. 17 That is, the Peltzman model might predict that farmers' benefits will be considered by regulators but not to the total exclusion of consumer interests. In fact, the USDA does appear to determine the general level of price in relation to a goal of ensuring that "adequate supplies" of bottled milk are available throughout the year in all its market orders. The notion of adequate supplies of milk was developed at a time when the long-distance transport of milk was prohibitively expensive, and hence all markets tended to be local in character. 18 It is useful to examine the rationale of adequate supplies in this context. Consider, for example, the single iso- lated federal order shown in Figure II. This figure is like Figure I, except that it allows for a crude representation of the cyclical variation of milk supplies. The supply curve Qs(P) is drawn as a function of the average annual price level P. For simplicity,-we assume that the peak production month will yield a production level equal to (1 + or)Qs(P), and that the lowest production month will yield the output (1
- o')Qs(P), where 0 < o' <
1.19 Given a static fluid milk demand schedule, and given the noninventori- able nature of the product, a price cycle for raw fluid milk will therefore occur. Class II products are inventoriable; hence for simplicity we may assume that the Class II price is fixed at the level PI over the year.20 In an
unregulated market let us posit that the average annual supply price isP*, which is determined by the intersection of demand and average supply in Figure II.21 The average annual milk production capacity will be given by
17 George J. Stigler, The Theory of Economic Regulation, 2 Bell J. Econ. 3 (1971); Sam Peltzman, Toward a More General Theory of Regulation, 19 J. Law & Econ. 211 (1976). 18 This is not to say that the blend price and the Class I price alignment was not relevant during the period. Short distance transport of
raw milk or of packaged products left a chain linking each market to its closest surrounding markets. '9 For simplicity, farmers are assumed to be risk neutral. But we note that risk aversion may be important in this market. Moreover, peaks and troughs will not in general be symmetrically distributed around the average annual level. Additionally, the distribution will be related to the cyclical time path of
prices that is in part dependent upon whether there is a blend price mechanism. For
the purposes of illustration, however, we needn't consider these complicating factors. 2o If the variations in milk supply were "small," it is easily proven that Class II storability would effectively eliminate seasonal variations
in Class II and Class I prices. But, in fact, the milk supply in the fall months is low enough that current production in many markets would be almost totally devoted to the production of Class I milk in a free market. Under these conditions, the basic seasonal fluctuations in Class I price would be expected to (and in fact do) occur, even though Class II milk is intertemporally fungible. 22 In fact, the equilbrium will not occur precisely at this intersection because the market price will cycle in a fashion not derivable from a simple linear function of quantity; moreover, changes in quantities will not necessarily be symmetric over both sides of the cycle in any case. This simple assumption does, however, generate a crude representation of the cyclical produc- tion problem.

----* * * * I
-
46 THE JOURNAL OF LAW AND ECONOMICS
\^ I\
K I< <I %t1
PI
PI
I '
^
IP
P I
/ ^ I I \ I
I
FIGURE II LOCAL MILK MARKET WITH SEASONAL SUPPLY VARIATION
the upward sloping supply curve Qs(P) at P*. Once capacity is fixed, monthly output will yield perfectly inelastic supply curves for each month. The supply curve for the shortest month is represented by the solid vertical line labelled (1 - (r)Qs(P*) and for the longest month by the solid vertical unlabelled line. In a regulated environment, the regulator sets the Class I price at the level P, and thus creates the blend price line of PB(PI). It is assumed that the average annual blend price is P*B and that the average annual quantity supplied is Qs(P*B). The shortest month's supply curve will then be assumed to be the dashed line (1 - cr)Qs(P*B); the longest month's supply curve is represented by the unlabelled dashed vertical line.
We may now represent a standard of "adequate supply" as it appears to be applied by the USDA. In the unregulated market in our example the price of
/- ios (P *
[
t&
w.PI osp

COST OF GOVERNMENT REGULATION OF MILK 47
raw milk for fluid uses will fluctuate between P*, in the shortest production month and P, in the longest production month. Processed fluid (for exam- ple, bottled) milk prices would fluctuate by the same amount. In the regu- lated case, however, the fluid price remains constant at the level of P, over the annual cycle. The value of P, is chosen such that: (a) it is lower than the highest fluid milk price that would otherwise prevail in a free market, and (b) it creates a blend price that is sufficiently higher than the free market average annual price P* to ensure that the quantity of milk Q,t(P,) is avail- able even in the low-production months.
In short, in the context of local markets, a Class I price is chosen in each market which guarantees a supply of milk in low-production months that exceeds the free market output (that is, the free market output is "inade- quate" during these periods). Assuming that consumers receive the benefit of price stability and of supply "adequacy" in all months of the year, consumers must pay an average price of fluid milk that is higher than it would be otherwise. The policy also has the effect of increasing regulated farmers' incomes. Thus, the goals of ensuring adequate supplies of milk and of in- creasing farmer incomes are closely intertwined.
Which Class I price that satisfies criteria (a) and (b) is chosen? This de- pends upon the degree of random fluctuations in supply and demand condi- tions. Regulators desire to set a price that generates a quantity of fluid milk Q,(P,) that will be available under most market conditions. They therefore wish to set a price which, in a typical year, yields a "cushion" or reserve of fluid milk. Milk economists generally argue that the amount of cushion needed to assure an adequate supply (that is, Q,(P,)) for short production- high demand days in bad years is approximately twenty per cent. This reserve is defined as R = (Q7/Q?)100, where Qn and Qi are average quan- tities during a typical fall season.
If all markets were completely separable, then regulators could reach their adequate supply goal by setting P, to establish R = 20 per cent in each market. But as previously illustrated, regulated milk markets are not inde- pendent; in fact, they are generally aligned. Given blend and Class I price alignment, regulators cannot determine a separate reserve in each local mar- ket. Moreover, because milk is produced relatively more efficiently in the upper Midwest, the reserves that are generated by the choice of any level of price alignment cannot be identical across markets.
Consider one of the northernmost markets, say Chicago, and the nearest market to its south. If the Chicago Class I price is P, and its blend price is PB, then the reserve in Chicago Rc will be:22
RC = (Pl - PB)/(PB - P,,), 22 The blend price in Chicago is PB = [PiQI(PI) + PIQII]/[QI + Qn]. Solving for Qn and
dividing by Qt(Pl) yields Re.

48 THE JOURNAL OF LAW AND ECONOMICS
where P,i is the price of Class II milk (assumed constant). If the market directly to the south of Chicago requires transport costs of fluid products or raw milk of T, then the Class I price in this market will be Pt + T and the blend price will be PB + T. Given the choice of P, in Chicago, the reserve in this southern market will therefore be given by23
R, = (PI - PB)/(PB + T - PI).
Thus it follows that Rc > Rs. In fact, given price alignment, the reserve will generally fall as one moves farther away from the high productivity of the upper Midwest.
In short, given price alignment, milk regulators cannot control the reserve ratios of individual markets. From examination of Re and Rs above, it is apparent that regulators can generally raise the reserve ratio across markets by increasing the regulated price P,. But it is also apparent that, given Pt, reserve ratios will also be higher the closer the markets are to the more efficient (exporting) orders in the upper Midwest. Given perfect price align- ment, then, milk regulators can control one price, hence one reserve ratio. Given this choice, all prices and all utilization ratios will effectively be given by the level of transport costs.24
Regulators have traditionally chosen to control their target variable in the market of shortest supply. For simplicity (and general accuracy) we shall call this market Florida. If the required cushion in Florida is to be, say, 20 per cent, the cushion in Chicago must be much higher. In September 1976, for example, the average reserve in Florida was 13 per cent. In Chicago it was 220 per cent.25 We noted earlier that the regulators could violate Class I price alignment by setting, say, the price in Chicago somewhat higher (but not lower) than the Florida price net of transport. In so doing, however, they would increase the Chicago reserve even higher than 220 per cent. Hence, the Florida reserve is established with the smallest distortion in Chicago by ensuring the alignment of regulated Class I prices.
AN ESTIMATION MODEL FOR THE COSTS OF REGULATION
The Model
The Eau Claire-plus-transport structure of the U.S. regulated milk mar- ket greatly simplifies the task of calculating the Harberger distortions inher- ent in the two-price scheme. Assuming that all regulated markets would still
23 The result follows in the same way as in note 22 supra, except that PB + T andPt + T are substituted for PB and P,.
24 As our alignment equations showed earlier, this statement is not entirely accurate particu- larly for some western states.
25 USDA, Federal Milk Order Market Statistics: September, 1976 Summary 14 (1976).

49 COST OF GOVERNMENT REGULATION OF MILK
marginally import fluid milk at the Eau Claire-plus-transport price in a competitive world-that is, if the market would remain price aligned after deregulation of milk26-then, for purposes of analysis, the Harberger distor- tions in all regulated milk markets can be calculated using Eau Claire prices (that is, local prices net of transport costs from Eau Claire) and assuming that all consumption of milk products takes place in Eau Claire.27
Markets that are self-sufficient under regulation and that would remain so in a competitive world-notably markets west of the Rocky Mountains- could potentially bias the results. Accordingly, these markets should be considered separately; in fact, however, the regulated prices in California (by far the largest market in this area) were almost identical to those in Eau Claire in the year 1973. Assuming that the Class I demand and supply elasticities for this area are similar to those characterizing the Eau Claire aggregated market, we may simply add these western markets to the Eau Claire aggregation without netting out transport costs.
A modification of our Figure I showing a single market order is required to show all milk as if it were within a single order located in Eau Claire, Wisconsin. Because of the high cost of transporting bottled milk, the Class I demand curve in each regulated market may be considered local in charac- ter. Hence the aggregate Class I demand may be found by horizontally summing all market demand curves net of transport costs from Eau Claire. But Class II products are interregionally fungible, and therefore the aggre- gate Class II demand curve will be considerably less elastic than that which characterizes each order individually. Figure III illustrates the market equilibrium for the aggregated regulated market.
The Class I and Class II demand curves facing regulated producers are portrayed in the first two panels of the figure. The third panel portrays the supply curve of regulated producers and the horizontal sum of Class I and Class II demand curves; the aggregate demand is therefore shown by the "kinked" schedule labelled D. The demand schedules and regulated prices depicted are net of transportation costs. They are also net of differential marginal costs of producing grade A milk, which is usable for Class I or Class II use, and grade B milk which is usable for manufactured (Class II) products only.
26 If orders importing milk under regulation would be self-sufficient in a competitive world, that is, if price alignment would break down at lower competitive prices, then our model would underestimate the price reduction owing to deregulation; hence, in these instances, our tech- nique of aggregation will bias the results in a downward direction.
27 We note here, however, that the technique assumes the relative distortions of price inter- vention are the same across markets. But, with price alignment, Class I and marginal supply prices will rise with transport costs. Accordingly, since the Class II price is approximately constant across markets, the wedge between regulated prices and the Class II price induced by regulation increases with distance from Eau Claire. We ignore this wedge in most of our theoretical discussion but introduce an adjustment for it later.

50 THE JOURNAL OF LAW AND ECONOMICS
CLASS I MARKET CLASS TMARKET AGGREGATE MILK MARKET
Price ^ \ \ 'O,d Lia,,'
PI--\I V /
pe Xi\ r p ^
- I I // 0 1 0, Quantity O , , Ay, Quwntity O &1 Q? Quontity
A0t Ax A,? ao
FIGURE III DEPICTS THE SOCIAL COST OF MILK REGULATION
The third panel of the figure is constructed as if the federal/state order Class I price were first specified and the Class I quantity were thus deter- mined. The demand curve for Class II milk, P,,(Q,,), is then superimposed as if the first units of Class II milk were sold only after the Class I market was supplied. This curve is labelled D,, + Q,. An average revenue curve AR is constructed much like the average revenue curve in Figure I, that is,
AR = P . + P,(Q,)Q, 28
QO + Q,,
where P,, is no longer a constant.29 The competitive price and output that would prevail absent regulation is determined by the intersection of supply and aggregate demand; these equilibrium values are depicted by the points P? and Q?. The equilibrium prices under regulation are shown as P, and P, and the regulated output as Q.
28 The AR curve shown in this equation and in Figure III is in fact a simplification of the true aggregate blend price line. It can easily be shown that the aggregate blend line would generate the same output under regulation as the sum of all orders deemed separately only if reserve ratios (QO/Q,) were identical across orders. But for reasons discussed above, we know that reserve ratios generally fall with distance from Chicago. This aggregation bias relates to the bias noted above, note 26 supra, and is discussed below.
29 While we portray regulators as setting the Class I price, this is a simplification. As a procedural matter, in the federal order system, the Class II price is the price which is set first and then a fixed differential is maintained between the Class I and Class II prices. In the state orders similar procedures are followed. At any single static equilibrium there is no loss in generality in using our assumption.

51 COST OF GOVERNMENT REGULATION OF MILK
Harberger Distortions
Regulation in the milk market establishes differential prices for Class I and Class II milk; it therefore leads to a misallocation of milk between its alternative uses. That is, the price for Class I (and Class II) milk would be P? in a competitive world, and Class I consumption would be Q,?. Therefore, since the regulated price is pegged at some higher value P,, quantity con- sumed falls to (); Class I consumers purchase less output under regulation than they otherwise would. Using the usual Harberger assumptions,30 the social cost of this distortion is measured by area/g] in the figure.
The misallocation distortion, however, is not completely described by this area because its calculation assumes that the alternative use of the forgone milk consumption is valued by the amount P?. In fact, the output is effec- tively transferred to Class II users whose valuation of this output is everywhere below P?. For analytic clarity we first examine allocative losses assuming that aggregate output is unaffected by regulation. In this case, the decrease in Class I milk, AOQ, becomes transferred into Class II milk, that is A?Q = -A?Q. The first unit of Class II milk beyond the competitive quan- tity is evaluated at the price P?. Additional units are evaluated at the declin- ing demand price for Class II milk as Class II consumption is expanded past its competitive level. Therefore, the total misallocation distortion is mea- sured by the sum of the shaded triangles a and/g in Figure III.
Regulation also induces an overexpansion of total milk output relative to the level that would prevail under competition. The regulated price of Class I milk P, leads to a blend price P that exceeds the nonregulated price P? Given entry and expanded production by existing producers, output there- fore increases from Q? to Q. Ricardian rents to milk farm inputs therefore increase by the amount shown by the hatched trapezoidal area R in Figure III. The relevant demand valuation of the net increase in output can be seen if the demand for Class II milk, D,, is transposed to the aggregate milk market starting at Qj, as illustrated. Each incremental unit of output expan- sion is measured along this transposed demand curve. Assuming that inputs used by milk farmers are sufficiently nonspecialized that their factor prices are independent of regulated milk output, then the supply function repre- sents the true social marginal cost of producing milk output. Accordingly, the reduction in social welfare owing to the output distortion caused by milk regulation is represented by the shaded area X in Figure III.
The distortion inherent in the regulation-induced increase in Class II out-
30 These assumptions are that the demand price measures the value of output to consumers, that the supply price measures the value of output to producers, and that transfers do not affect aggregate welfare; see Arnold C. Harberger, Three Basic Postulates for Applied Welfare Eco- nomics: An Interpretive Essay, 9 J. Econ. Lit. 785 (1971).

B_ '--Xt x
52 THE JOURNAL OF LAW AND ECONOMICS
put can be more fully illuminated by a more detailed model of the Class II market. Recall that there is a natural comparative advantage in milk pro- duction in the upper Midwest, owing to the advantageous land and tempera- ture conditions. For reasons discussed earlier, farmers in the M-W area find that grade B milk is more profitable to produce than grade A milk. In regulated markets the blend price is paid only'for grade A milk (that is, milk qualifying for fluid bottling purposes) received by state and federally regu- lated farmers who produce grade A milk. Much of this milk is devoted to manufacturing use, even though lower-production-cost grade B milk could be used equally advantageously. The grade A milk expansion caused by regulation effectively depresses the price of manufactured milk products and thus of grade B milk, and therefore has adverse effects on the unregulated M-W farmers. Consideration of the interaction between state and federal order farmers and M-W farmers (and other grade B farmers) in the Class II market demonstrates the exact nature of this regulation-induced output dis- tortion.
This interaction slightly complicates the measurement of A from Figure III. To show this, the excess Class II demand curve facing regulated farm- ers, as used in Figure III, is reproduced in the first panel of Figure IV (the scale in Figure IV is different from Figure III). The schedule TU in the first panel of Figure IV is the segment of the supply curve in Figure III trans- posed over the range of prices between the competitive and regulated prices of Class II milk. The equilibrium prices with and without state and federal regulation--previously determined in Figure III-are also shown, together with appropriate outputs in regulated areas.
Regulated M-W Area Total Output
^ -- -- - U S
, ---r K \ \o5
@ +^+ 8r w ow oo 87 h-Aff- W-^oX S WA^-
A+-A^AM+^or I FIGURE IV
EFFECTS OF REGULATION IN THE CLASS II MARKET

53 COST OF GOVERNMENT REGULATION OF MILK
In the second and third panels, the supply of grade B milk characterizing the M-W area is depicted by the schedule SM_W, and the total U.S. demand for Class II products is depicted by D,,U'S'. In competitive equilibrium, QT? units of Class II products are consumed where QM? of this output is produced by farmers in the M-W area and QI? (= QT? - Q M?) by farmers in regulated areas.
The effect of state- and federal-order regulation is to reduce the Class II price from P? to PII, as previously illustrated. At the lower price, total consumption of Class II products increases by the amount AQ?r, as shown in the third panel of Figure IV. But since the elasticity of Class II demand is lower for the United States as a whole compared to the excess demand curve facing regulated areas, it follows that the output expansion by regulated farmers exceeds the expansion in total consumption, that is, AQII > AQr. The remainder of the output expansion in regulated areas comes at the expense of farmers in the M-W area.31 That is, at the lower Class II price, the M-W output is reduced by A(QM units. Because the excess demand sched- ule D, is defined as the horizontal difference between total Class II con- sumption and M-W supply, then QM + Qii? = QT. Since a similar relation holds in competitive equilibrium, we are assured that AQ/it equals AQr + |AQM|.
It is easily proved that areas s and p equal areas I and a in Figure IV, and hence that area I is equivalent to areas sc + p - a. Area A in Figure III therefore corresponds to areas Q + I = fl + : + p. In other words, the distortions measured as areas X and a in Figure III are composites of two components: (a) an efficiency effect owing to a transfer of AQsM units of output from a more efficient to a less efficient set of farmers, and (b) a net output effect owing to an overconsumption of AQ?r units of Class II milk products. We also note that the regulation-induced reduction in M-W output causes rents to grade B farmers to fall by the amount measured by area c) +
sc in Figure IV.
MEASUREMENT OF TRANSFERS AND HARBERGER DISTORTIONS
The critical parameters required to calculate the varied effects of milk regulation are: (a) the long-run supply elasticity of milk output for regulated (grade A) and grade B farmers, (b) Class I and Class II demand elasticities facing regulated markets, (c) the aggregate Class II demand elasticity for the United States as a whole, and (d) regulated prices and outputs. The appro- priate parameter values are derived in the Appendix. Using these estimates, the model described above was solved.
31 The M-W area produces approximately 50% of grade B milk in the United States. (USDA Statistical Reporting Service, supra note 15, at 6). Other grade B producers are dispersed throughout the country.

TABLE 2 QUANTITY AND PRICE EFFECTS OF REGULATION
(Prices are dollars per cwt.; quantities are millions of cwts.)
Absolute Percentage Change Change
Variable ?=.4 e = .9 e = .4 e = .9 Average
P, .675 .584 10.1 8.5 9.3 P,, --.335 --.426 -5.0 -6.3 -5.6 PB .295 .207 4.4 3.0 3.7 Q, -10.5 -9.1 -2.0 -1.7 -1.9 Qn 24.7 31.4 8.3 11.0 9.6 Q 14.2 22.4 1.7 2.7 2.2 QM -7.1 -14.2 -2.6 -4.6 -3.6 QT 7.1 8.2 1.2 1.4 1.3
Source: See Appendix infra.
The effects of regulation on price and quantity variables are presented in Table 2. The estimates are presented for the mean values of the demand elasticities */i,r)/ and for the upper- and lower-bound supply elasticities e-see Appendix. Broadly speaking, the effect of regulation is estimated to increase the price of Class I milk by 9.3 per cent (at the farm level), to decrease the price of milk for Class II products by approximately 5.6 per cent (at the farm level), and to increase the blend price facing regulated farmers by 3.7 per cent. Class I consumption accordingly decreases by approximately 1.9 per cent, and Class II consumption increases by 9.6 per cent. While total regulated output increases by 2.2 per cent, grade B output falls by 3.6 per cent and total milk supply rises by 1.3 per cent.
The transfers inherent in the regulatory scheme are considerable. The scheme taxes consumers of Class I (fluid) milk by the amount (P, - P?)Ol (see Figure III); subsidizes consumers of Class II milk products by the amount (P?o- P,)Q,; increases rents to regulated producer inputs by the amount measured by area R in Figure III; and reduces rents to M-W producers by the amount measured by area co + s in Figure IV. The estimates of these transfers were insensitive to the range of demand elasticities considered in the Appendix. Thus, Table 3 lists the results for the mean values of Class I and Class II elasticities (7i = -.23; rl,, = -1.36) for the upper- and lower- bound supply elasticities. The estimates suggest that, on average, regulation enforces a tax on consumers of Class I milk in the amount of $333.8 million per annum, and grants a subsidy to consumers of Class II products equal to approximately $120.9 million per annum. Regulated producers experience an increase in rents equal to $210.6 million (gross of any regulation-induced expenditures) while M-W producers experience a reduction in rents on the order of $105.2 million per annum.
54 THE JOURNAL OF LAW AND ECONOMICS

TABLE 3 TRANSFERS OWING TO MILK REGULATION
(Estimates are in Millions of Dollars)
Elasticity of Supply
Group e = .4 e = .9 Average
Class I users -358.1 -309.4 -333.8 Class II users +107.1 +134.7 +120.9 Regulated producers + 248.9 + 172.3 + 210.6 M-W producers -88.9 -121.4 -105.2
Source: See Appendix infra.
Estimates of the Harberger distortions created by regulation-the misallo- cation of consumption between Class I and Class II milk users, the misallo- cation of output among regulated and nonregulated producers, and the overproduction of the total output of milk (areas ,B + a + A in Figure III)-are presented in Table 4 for the range of elasticities derived earlier. The estimates increase with the elasticities of demand and supply, but all estimates fall within the range of $5.9 to $12.1 million per annum. Using estimates that correspond to the mean values of the demand elasticities (see star notation), the best estimate of these Harberger distortions caused by regulation of milk is put at roughly $9 million per annum.
TABLE 4 ESTIMATES OF THE SOCIAL COST OF MILK REGULATION
(Estimates are in Millions of Dollars)
e = .4 e = .9
r/l B.l
--.12 --.23 --.34 --.12 -.23 -.34 -.97 5.9 6.5 6.8 -.97 7.3 7.5 7.6
7r/H -1.36 7.1 8.0* 8.7 H// -1.36 9.3 9.7* 10.0 -1.75 8.0 9.2 10.1 -1.75 10.9 11.6 12.1
Source: See Appendix tnfra. * Denotes estimate at mean values of demand elasticities.
OTHER COSTS OF REGULATION
The aggregate milk market model utilized above was designed to illustrate and measure some of the major Harberger effects of milk regulation. But other, perhaps more important, costs are also induced by regulation: nota- bly, those associated with excessive transport of fluid milk and those pertain- ing to the cost of administering the federal/state order system.
COST OF GOVERNMENT REGULATION OF MILK 55

56 THE JOURNAL OF LAW AND ECONOMICS
Inefficient Transport of Class II Milk
Because the resource allocation model used above netted out transport costs, it failed to capture an important social cost induced by regulation. To understand this, recall three fundamental characteristics of the milk market: (a) that milk is produced most efficiently in the upper Midwest, (b) that raw milk prices can be modeled as approximately Eau Claire-plus-transport costs (ignore the West Coast aberrations for the moment), and (c) that fluid milk is considerably more costly to ship than milk incorporated in Class II products. Regarding the latter point, consider that one pound of cheese requires ten pounds of raw fluid milk to process and butter requires twenty pounds. Hence, it is grossly inefficient to produce cheese and butter at the point of consumption. Even assuming the same transport cost per pound-mile, butter and cheese could be shipped at a fraction of the transport cost of fluid milk if it were processed in the efficient M-W area.
Yet, under a system of regulation, Class II products are widely produced at the point of consumption at a price that is considerably higher than the M-W price. Why? To understand this, return to our earlier discussion re- garding the regulators' goal to ensure adequate supplies of fluid milk in all regulated orders. Regulators administer a reserve system that satisfies all Class I demand at the regulated price under most market conditions. To accomplish this goal, they effectively impose a demand for raw milk that is coincident with the blend line that they create rather than with the Class I demand curve. The horizontal difference between the Class I quantity con- sumed at the regulated price and the supply of fluid generated by the blend line represents a "reserve" of fluid milk. This reserve is generated to accom- modate random and seasonal increases in Class I demand or random and seasonal decreases in milk supply; that is, to ensure that all Class I demand is met without a price rise under most circumstances.
Portions of this reserve are sometimes used to produce Class I milk; oth- erwise, the reserve is dumped into the production of Class II products. As a result, much of the raw milk used for Class II products is not produced at approximately the M-W price P,, but at price P,, plus T, the cost of trans- porting milk in fluid form. If QHi is the quantity of Class II milk produced in the ith regulated order in the typical year, and Ti is the transport cost of fluid milk (in excess of the Class II products transport cost) then the social cost of generating reserves of fluid milk in the system is ETiQ,/.
How did our aggregate model miss this calculation? By netting out trans- port cost, the model ignored the important difference in transport cost be- tween Class I and Class II milk products. In our model of regulation, milk is produced in the upper Midwest and transported in fluid form to consumption areas and then separated into Class I and Class II uses. In a competitive equilibrium the milk would be separated into Class I and Class II use before

it was transported. Only Class I milk would be shipped in fluid form. Class II products would be produced at the point of raw milk production and shipped to consumption points at nominal costs. Our aggregation technique does not account for the consequent transport cost savings. In fact, all milk is not produced solely in the upper Midwest, as this model suggests; hence fluid destined for Class II products under regulation does not always incur physical transport costs. But because of price alignment, the marginal cost of producing fluid milk is the same as if it were produced and shipped from Eau Claire in most regulated orders. Thus, the fact that some Class II consump- tion is produced using local resources valued at a cost equal to Eau Claire- plus-transport costs does not alter the implication that without regulation Class II products would be sold at approximately the M-W price.
To appreciate the essential nature of the bias in the earlier model, consider the following simplified spatial model. Suppose that there are two markets X units of distance apart; the transport cost for fluid milk (in raw or bottled form) is T for X units of distance. Also, assume that all of the milk for both markets is supplied by the relatively efficient market (say market 1), and that market l's supply curve is horizontal over the relevant range at price Ps. Under these conditions, the blend price in market 1 will be Ps and in market 2, Ps + T. Similarly, if the regulated Class I price is set at P, in market 1, then the corresponding price will be P, + T in market 2; thus the model is characterized by price alignment. Finally, assume that the Class II demand curve in each market is horizontal at price P,.
The simple price-aligned model is depicted graphically in panels (1) and (2) of Figure V. With regulation, Class I consumption in markets 1 and 2 is Q,1 and Q 2, and total consumption in either market is Qi and Q2. In a competi- tive environment, Class I consumption and total output would be Q ? and Q2? in either market (that is, in this model Class II consumption would not exist). Straightforward calculation shows that the Harberger distortions
\-? \ t^Ps p2 V^/'2W^+z P \0^f,h#^PQfPiT)
W t]~~~~~p, + r - i-. t, \, < It ? ?? B, ?2
Q'oQ' 6o,oQ ? 4+a4 (1) (2) (3)
FIGURE V AGGREGATION BIAS
57 COST OF GOVERNMENT REGULATION OF MILK
58 THE JOURNAL OF LAW AND ECONOMICS
induced by regulation is measured by the sum of areas /31 + a, + ki in panel 1, and areas /32 + a2 + A22 + K in panel 2.
To illustrate our aggregation bias, we combine markets 1 and 2 in panel 3 of Figure V in the same way that we aggregate markets in Figure III. In particular, the aggregate Class I demand curve is the sum of demands net of transport costs evaluated at the site of market 1. The Class I and blend prices used earlier are equivalent to P, and Ps. The regulated output is the aggregate of all regulated outputs (0, + 02).32 The sum of Class I outputs QI1 + Q,2 corresponds exactly with Q, in panel 3; similarly, the sum of outputs under competition Q1? + Q2? corresponds exactly to output Q? in panel 3. By construction: a = a1 + a2; a = /3a + 82; and A = Il + t2. Thus, in the third panel the areas a, f8, and A correspond to our areas a, /3, and A in Figure III. That is, our aggregation technique underestimates the true social cost of regulation by an amount measured by area K. This area is equal to the transport costs times the absolute value of the change in Q?2, plus transport costs times the absolute value of the change in total milk supply to market 2.
In the simplified model depicted in Figure V, all milk is produced in area 1; hence IAQ,2I + |IA2- - Q,2. In other words, the transport inefficiency is equal to T times either the change in Class II milk or total Class II milk consumed in market 2. However, this correspondence is specific to this model. Thus, the question arises whether the calculation in general turns out to be TAQ,,2 or TQI,2. In fact, it can be demonstrated that TQ,2 is the appropriate measure to use if and only if price alignment would be main- tained after deregulation. If price alignment breaks down with degregula- tion, it can be easily shown that our earlier Harberger estimates are biased downward. It can also be shown that the transport adjustment using the measure TQ,,2 would lead to an overstatement of the true transport adjust- ment. However, it can be shown33 that the use of the measure TAQzz2 leads to a conservative estimate of the true transport inefficiency; hence our calculation of the adjustment was made using AQ/z2. In particular, the excess transport cost induced by regulation is calculated as ST-(bIAQ,I + ciAQ),
32 The aggregate blend line in panel 3 of Figure V is drawn as if it would intersect P, at the output Q, + Q2. In fact, because the Class I price rises with distance from Eau Claire, it turns out that the actual aggregate blend line would be somewhat lower than our aggregation tech- nique suggests.
33 The amount AQ, is a residual equal to the absolute value of AQ,, plus A(Q. Thus T^Q,, = TAQz + TAQ. In the case we are now considering, the importing market will arrive at a price below Ps + T. The left-hand side of our transport area K between Q,2 and Q2? is equal to TAQ,. The new equilibrium will entail an even lower Class I price (and higher Q,) so the estimated TAQz understates the gain to social welfare accruing to transport savings from the lowered Class I price. For an equilibrium price below Ps + T, the importing market must have an indigenous supply curve which cuts Ps + T above Q2? and below Q2; otherwise, either price would not fall below Ps + T (for example, supply to the left of Q2?). Again, the area under the supply curve which is saved must be similarly bounded by TAQ.

COST OF GOVERNMENT REGULATION OF MILK 59
where AQ, and AQ are the regulation-induced output changes calculated earlier and bi and ci are the shares of Class I and total consumption in the ith regulated order.
The variable Ti is not actually a measure of transport cost from Eau Claire to the ith order. If it were, T~ would accurately reflect the true cost adjust- ment for that portion of the United States that is in price alignment. But for other areas, for example, California, such an estimate would grossly over- state the true marginal cost of producing Class II products under regulation. The appropriate measure of T7 is simply the amount by which the actual Class I blend price in the ith order exceeds the upper Midwest Class I blend price. Thus, for price-aligned markets, Ti equals transport costs, and for areas like California Ti is approximately zero.
According to whether the supply elasticity was assumed to be .4 or .9, the resulting adjustment to the Harberger measure was calculated to equal $16.32 or $20.13 million.34
Administrative Costs
Our original Harberger estimates were also made under the assumption that the costs of obtaining and maintaining the order system are zero. Regu- lation may be sought to augment income to factors of production. Further, the cost of obtaining and maintaining such favorable treatment is not zero.35 Since federal order farmers receive the annual incremental rent measured by area R in Figure III, it is reasonable to assume that farmers have spent and continue to spend resources to obtain such regulation. The cost of regulation should, therefore, include the amount of these resources. Since the costs of initially obtaining regulation have already been made, they are irrelevant to a consideration of the cost savings of deregulation. Resources, however, are no doubt expended to maintain the rent-augmenting scheme, and, further- more, resources must be expended to operate the discriminatory regulation.
This "Tullock" effect, however, is difficult to measure. It is known, for example, that milk cooperatives spend considerable sums to maintain the order system.36 But since the full extent of these expenditures is not known and since the social cost of these expenditures may, in some instances, be partially offset by social benefits (as in the information provided to voters by
34 The minimum bound estimate is only a small fraction of TQ, (our area K). Accordingly, our estimate could be highly conservative.
35 Richard A. Posner, The Social Costs of Monopoly and Regulation, 83 J. Pol. Econ. 807 (1975); Gordon Tullock, The Welfare Costs of Tariffs, Monopolies, and Theft, 5 W. Econ. J. 224 (1967).
36 For example, in the eighteen months preceding June 30, 1976, three dairy cooperatives contributed almost $500,000 to House and Senate members (see Washington Post, Aug. 3, 1976, ? A at 16, col. 1), and cooperatives sent representatives to order hearings, to propose amend- ments, and so forth.

political campaign expenditures), these maintenance expenditures will be ignored for our purposes. Instead, we will only consider the actual cost of operating the market administrator's office which oversees the federal order system.
Milk produced in the federal order system was taxed at an average rate of about $.04 per hundredweight in 1973 to pay for the administrative costs of the system.37 This $.04 tax is independent of assessments made by the market administrator's office to test weights and butterfat content and to monitor sanitary conditions. In particular, this "administrative assessment" finances the auditing of detailed forms that are submitted to the USDA by federal order milk handlers. Approximately 950 people examine order re- ports for errors and misrepresentations. Additional private bookkeeping costs may well be in the same order of magnitude as this fee, but for lack of a method of estimation this cost is ignored in our analysis.
Assuming that the costs of administering state systems are comparable to the federal order cost, the $.04 tax times the approximately 850 million hundredweight of milk produced in the state and federal order systems in 1973, or $34 million, is an estimate of the direct annual social cost of operat- ing the two-price state and federal order schemes. By ignoring all other Tullockian costs, the $34 million figure may be used as a conservative esti- mate of the Tullock portion of the social cost calculation. Adding this to previous estimates of Harberger and transport inefficiencies, the social cost of milk regulation is put at roughly $60 million per annum (see Table 5).
TABLE 5 TABULATION OF THE SOCIAL COST OF MILK REGULATION
(Estimates in Millions of Dollars)
Source e = .4 e = .9
Misallocation of consumption between Class I and Class II use 4.29 3.21
Net expansion in output 3.73 6.51 Transport adjustment 16.32 20.13
Adjusted total Harberger costs 24.34 2 9.85 Administrative costs 34.00 34.00
Total 58.34 63.85
Source: See Appendix infra.
CONCLUDING REMARKS
Admittedly, our analysis considers only the costs of regulation. It might well be argued that the benefits of regulation could easily outweigh these
60 THE JOURNAL OF LAW AND ECONOMICS
37 USDA, Summary of Major Provisions in Federal Milk Marketing Orders 35 (1973).

COST OF GOVERNMENT REGULATION OF MILK 61
costs. Most of the classic alleged benefits of regulation, however, are of questionable validity, particularly in the context of present market condi- tions.38 For example, arguments in favor of regulation in the 1930s held that the high costs of transport and communication led to artificially depressed farm incomes. Hence, regulation was required to offset the monopsony power of buyers. In addition, Congress was attempting to stem the exit of farmers at a time of unusually low prices. But as we have stated above, these arguments can no longer be employed to justify the continued existence of regulation. To be sure, the system serves to increase farm incomes of regu- lated farmers. But, at the same time, it reduces the incomes of M-W farmers and fluid milk consumers. It is not clear how such a transfer of income can be legitimately claimed as a social benefit.
Proponents of regulation argue that raising regulated farm incomes is not the prime purpose of the two-price scheme; rather, it is held that the purpose of regulation is to reduce the variability in price (hence, quantity available) of Class I fluid milk and that the Class I tax is the cost of ensuring price stability and "adequate" supplies of fluid milk across markets. Assuming that consumers realized a net benefit to such stability in the 1930s, it is questionable that the net valuation is still positive today.
First, to the extent that price variability is introduced by local changes in demand or supply within orders, then the interrelatedness of orders today would substantially lessen price variability within one or several orders. Second, even if the benefits of price stability (hence "availability") have been constant over time, the costs of providing these benefits have risen. In an isolated market order world, regulators can generate a reserve of fluid equal to 20 per cent of Class I consumption in each market. With price alignment, however, the guarantee of such a reserve in Florida generates reserves of 200 per cent in some northern markets. These arguments imply that the benefit- cost ratio of the program is considerably lower than in the past, but, admit- tedly, they do not prove that the ratio is below unity.
A recent technological development, however, does suggest that the no- tion of price instability in a competitive milk market may be outdated. The new development is efficient and realistic milk reconstitution. Consumer ac- ceptance of reconstituted milk in places where milk production is expensive (for example, Hawaii and the Virgin Islands) suggests some substantial mar- ket potential for this product. The process essentially involves the reduction of milk to powdered form and its reconstitution to its original fluid form
38 For an analysis of the stated goals of milk regulation in light of today's economy, see Robert T. Masson & Philip M. Eisenstat, Goals and Results of Federal Milk Regulation: A Reevaluation, 6 J. Northeastern Agricultural Council: Proc. 193 (1977); and id., The Pricing Policies and Goals of Federal Milk Order Regulations: Time for Reevaluation, S.D. Law Rev. (forthcoming 1978).

62 THE JOURNAL OF LAW AND ECONOMICS
without significantly affecting its taste or chemical content. The powder is
different from the fat-free powder used in many homes today, which is
converted to fluid by the simple addition of water and which does not taste,
and is not intended to taste, like real fluid milk. Reconstituted milk requires
conversion at a processing plant and can partially or fully restore the fat
content of the original fluid milk. Since the transport cost of shipping powder
is virtually zero compared to fluid milk and the powder is storable for
considerable periods of time, its development has far-reaching implications
for the structure of milk markets.
First, since the product can be economically inventoried, the traditional
seasonal price cycle could be reduced considerably. Second, because the
product can be transported at virtually zero cost, the price of milk would be
expected to fall to Eau Claire cost plus the marginal cost of drying milk for
reconstitution, say M. Thus, for all parts of the country for which M is less
than transport costs from Eau Claire, price would fall. In fact a fully recon-
stituted product would have some taste differences. However a partially
reconstituted product (for example, half-fresh fluid milk and half reconsti-
tuted milk) would have a great deal of potential.39
If the product is really almost identical to fluid milk, then why is it not
utilized more? The answer is that federal and state regulations in effect
outlaw its use. That is, regulations are written so that processors in all
regulated areas are required to in effect pay a price for all milk they reconsti-
tute that is equal to the Class I price (instead of P,) plus M, thereby preclud-
ing reconstituted milk from these markets.
It is not hard to understand why regulators have barred the introduction
of reconstituted milk. Its successful introduction would virtually ensure a
substantial exit of farmers located far away from the efficient M-W area;
conversely M-W farmers would no doubt experience a substantial increase in
demand for their output. In this regard, it is also worth recalling that milk
regulation generally has induced Class II producers to locate at the source of
consumption rather than in the efficient M-W area. Hence, the whole notion
of deregulation-even if regulation was admitted to be of little benefit to
producers now-would imply a large locational drift of production and pro-
cessing activity toward the upper Midwest. It is not surprising, then, that
farmers and processors who stand to experience substantial capital losses are
vehemently opposed to such a proposition. The existence of such transitional
costs suggests that the only feasible means of deregulating milk markets may
involve a gradual phasing-out of regulation.
One form of potential deregulation is discussed in a recent volume pub-
39 Our social cost estimates do not include the additional costs due to suppression of this
technology. See both papers by Robert T. Masson & Philip M. Eisenstat, supra note 38.

COST OF GOVERNMENT REGULATION OF MILK 63
lished by the Department of Justice.40 Here they discuss a gradual decreas- ing of the Class I differential over the Class II price over a period of eight years, and then the removal of the blend price system when the three prices (Class I, Class II, and blend) have become equal. A complete analysis of forms of deregulation is, however, beyond the scope of this paper.
APPENDIX
DERIVATION OF PARAMETER VALUES
To solve for prices and quantities in the milk model, estimates of long-run elas- ticities of supply and Class I and Class II demand in regulated areas are required, as well as levels of regulated prices. In a regulated world, M-W farmers more profitably produce grade B milk and, hence, are functionally separate from the regulated (grade A) markets over the relevant range of prices. Therefore, the supply elasticity for each of these areas may be approximated by long-run estimates for milk production in the United States as a whole. This elasticity has been estimated to be in the range .4 to .9.41
Class I demand elasticities are not difficult to obtain. The transport cost of Class I bottled milk is relatively high, and hence these markets tend to be local in character. Therefore, elasticity calculations for most geographical markets are useful for the purpose of characterizing the typical regulated order market. Ten cross-section time series studies are summarized in Bartlett42 and the reported long-run elasticities fall within the range -.30 to -.83.
These estimates, however, pertain to the retail level. Our calculations require the use of elasticities of derived raw milk demand. Assume that the retail price P and the Class I farm price P, of a unit of fluid milk are related by P = P, + C, where C is a composite price of processing, transport, and retail services. Also assume that C is independent of milk output over the relevant range. It follows that the farm elasticity of Class I demand (r77) is related to the retail elasticity (*7R) by 7/~ = (P//P)Tn, where P,/P is the cost share of farm activity in the retail price. The value of P,IP is available in George and King43 and is equal to .412. Using this conversion factor, Class I demand elasticities at the farm level are found to lie in the range -.12 to -.34.
Unlike bottled milk, manufactured milk products are relatively cheap to transport, and hence the Class II market tends to be national in scope. Thus, we must consider the Class II demand facing regulated areas as an excess demand curve. In particular,
40 J. Hall, R. Fones, & Robert T. Masson, Milk Marketing (U.S. Dep't of Justice, 1977). 41 See Harold W. Halvorson, The Response of Milk Production to Price, 40 J. Farm Econ.
1101 (1958); Robert R. Wilson & Russell G. Thompson, Demand, Supply, and Price Relation- ships for the Dairy Sector, Post-World War II Period, 49 J. Farm Econ. 360 (1967).
42 Roland W. Bartlett, Fluid Milk Sales As Related to Demand Elasticities, 47 J. Dairy Sci. 1314 (1964).
43 P. S. George & G. A. King, Consumer Demand for Food Commodities in the United States with Projections for 1980, 58, 62 (1971).

64 THE JOURNAL OF LAW AND ECONOMICS
if Qxt is the quantity of Class II milk demanded from regulated milk producers, then Qtt = QIIT - QM-W, where QITr is the total Class II milk demanded in the United States and QM-W is the quantity of Class II milk supplied by grade B (for example, M-W) producers. Differentiating and converting to elasticity form,
f)u = sr /T + (1 - S)eM,
where
s = Q T/Qtt.
~/t, is the elasticity of Class II demand facing regulated producers, rt ur is the elasticity of national demand for Class II milk, and EM is the elasticity of supply of Class I milk offered by grade B/M-W producers.
The market share of Class II milk sales for regulated producers (1/s) was approxi- mately .435 in 1973.44 Long-run estimates of Class II demand elasticity at the retail level for the United States as a whole lie in the range -.54 to -.66.45 Using an estimate of the farm cost share of retail price equal to .367,46 these elasticities convert to -.20 to -.26 at the farm level. Estimates of EM were previously reported to lie in the range of .4 to .9. Using these estimates, the value of the elasticity of the excess demand curve r),, is found empirically to lie in the range -.97 to -1.75.
For reasons stated earlier, the relevant Class I, Class II, and blend prices under regulation are those that pertain to the federal and state regulated markets in the upper Midwest. The average observed Class I and Class II prices for 1973 were $7.41 (in the upper Midwest) and $6.15 per hundredweight of milk.47 Recall that the Class I price would be somewhat higher than the Class II price, owing to the sanitary standards in the production of fluid milk. This natural price differential has been estimated to be on the order of $.15;48 to be conservative, we used a $.25 natural differential. Hence, the Class I price, net of conversion costs, is $7.16.49
Assuming linear demand and supply functions, the prices and quantities were
44 USDA, Federal Milk Order Market Statistics: Annual Summary for 1973, 25 (1974); USDA, supra note 15.
45 William T. Boehm & Emerson M. Babb, Household Consumption of Perishable Manufac- tured Dairy Products (Purdue Univ., Agricultural Experiment Station Bull. No. 105, 1975); id., Household Consumption of Storable Manufactured Dairy Products (Purdue Univ., Agricultural Experiment Station Bull., No. 85, 1975); G. E. Brandow, Interrelations Among Demands for Farm Products and Implications for Control of Market Supply (Penn. Agricultural Experiment Station Bull. No. 680, 1961); Cameron Thraen, Jerome Hammond, & Boyd M. Buxton, An Analysis of Household Consumption of Dairy Products (Univ. of Minn., Agricultural Experi- ment Station Bull. No. 515, 1976).
46 P.S. George & G.A. King, supra note 43. 47 The simple average of the Chicago Class II price and the Duluth Superior Class II prices
was $6.15. See USDA, supra note 44, at 61. Due to lags in the system of arriving at the Class I price, the reported Class I price is arrived at by adding the $1.26 fluid differential to the observed Class II price. See note 11 supra.
48 Roland W. Bartlett, supra note 10. 49 We actually locate our estimates at Chicago rather than Eau Claire. Chicago is the first
major fluid consumption area to the south of Eau Claire.

COST OF GOVERNMENT REGULATION OF MILK 65
solved under the assumption of competition. Comparisons of regulated and competi- tive equilibrium yield measures of social cost and income transfers that are reported in the text.5o
50 We note that milk cooperatives have succeeded in attaching a premium to regulated Class I prices in 1973, thereby perhaps biasing the relation between regulated prices and observed quantities. Analysis of this bias showed that the estimate of social costs coming from the federally regulated price structure was insensitive to this correction.