U.S. Gulf Coast LNG to Asia: Low-Cost Diversification of Supply

1966 Milk
Per
Cow
3.5
Gal
/Day
198
2 M
ilk P
er C
ow 4
.9 G
al/D
ay
1996 Milk
Per Cow 6.4 Gal/D
ay
Cost of MilkProduction2014 Annual
California
1950: Milk Per Cow 2.5 Gal/Day
2014: Milk Per Cow 7.6 Gal/Day

INSIDE . . .
3 California Cost of Production in 2014
5 California Cost of Production Summary, by Area
6 Statewide Cost Comparison Summary
7 Statewide, Quarterly, and 5-Year Cost Comparison Summaries
10 Herds Summary/Cost Comparison for Holstein, Jersey, Crossbred, California 3X vs. 2X Milking, and Organic Herds; Feed and Labor Costs
22 Top Ten Counties Profile, 2014
23 U.S. Mailbox Prices, Average Prices Paid to Producers
24 Quota Summary and Transfers
25 California Dairy Producer Assessment Rates
26 Glossary of Terms
This publication was prepared in the Division of Marketing Services, Dairy Marketing Branch by:
Cost of Production Unit StaffMike Francesconi, SupervisorDavid DaSilva, Mirek Wilczek,
Cindy (Davis) Prentice, and Tom Kimball
In Cooperation With:Dairy Marketing Branch Economics and Statistics
Units, the Milk Pooling Branch and the
U.S. Department of Agriculture, Washington, D.C.Tom Vilsack, Secretary
National Agricultural Statistics ServiceCindy Clark, Administrator;
Vic Tolomeo, Pacific Regional Director
This publication would not be possible without the cooperation of the many dairy producers throughout the State who participate in the Cost of Production Program. Their willingness to voluntarily share their milk production cost data is of great benefit to the entire dairy industry. Both corrections of errors and revisions based on receipt of more complete information and changes in methodology are the basis of all changes from previously published data. Data in columns displaying “percent change” are subject to rounding.
Department of Food and AgricultureKaren Ross, Secretary
Dairy Marketing Branch1220 N Street, Sacramento, CA 95814
(916) 900-5014 / www.cdfa.ca.gov/dairy
California Cost of Milk Production Annual
Cost of Production Collection Methods
The California Department of Food and Agriculture (Department) Cost of Production Unit (COP) collects and summarizes cost data from a sample of California dairy farms and is the only state in the U.S. that has an impartial government agency reporting comprehensive milk production cost information. Milk Production Cost Auditors specializing in cost accounting and other accounting procedures review dairy farm financial records on-site and work with dairy management to perform a compilation of dairy expenditures. This information is provided primarily as a service to those participating in the cost studies, in order for them to compare the results of their operations with the information presented on the accompanying schedules. All published data is subject to revision.
COP Secure Website
The COP has developed a secure website called the “Cost of Production Unit Document Library” which allows cost study participants to access their financial
information compiled by the auditors into specialized reports. This site has been developed to make sure that confidential and personal information will not be compromised. The link for the website is located at http://www.cdfa.ca.gov/dairy click on Cost of Production and a link for the secure website will be at this location.
On the Cover
The cover graphic depicts the trendline of the California average milk production per cow from 1950-2014. (See actual graph on page 4).
2 California Cost of Production Annual 2014

or California in 2014, compared to the previous year, total milk production was up 2.6 percent, the number of dairy cows was up 0.9 percent, milk per cow was up 2.0 percent, and the number of dairies decreased 1.7 percent. The annual average prices paid to producers was $22.08 per hundredweight (cwt.), with the lowest average price in 2014 at $17.85/cwt. in December and the highest average price at $23.62/cwt. in March.
Milk Production
The year 2014 started with robust milk production in comparison to 2013, with net increases throughout the year when compared to the same months in 2013 (with the exception of December which showed relatively no change). Total milk production for the year finished at a 2.6 positive percent (+1.085 billion pounds) when compared to 2013.
The five leading milk producing counties recorded 73 percent of the milk production in 2014: Tulare, Merced, Kings, Stanislaus, and Kern counties. Grade B milk production in 2014 recorded a decrease of 68.5 percent (-453.6 million pounds) when compared to 2013. Milk production per cow in 2014 was estimated at 23,702 pounds and the number of cows estimated to be at 1.79 million head.
Utilization
In 2014, utilization of butter and dried milk powders (Class 4a) dropped slightly to 33.0 percent (compared to 34.4 percent in 2013), while the percentage of the milk supply going into cheese production (Class 4b) increased slightly to 45.8 percent in 2014 (from 44.2 percent in 2013). In comparison to 2013 production, California butter production showed a decrease of 3.4 percent, nonfat dry milk production significantly increased by 23.3 percent (offset by a 21.5 percent decrease in the production of “other dry milk products” including skim milk powders), while cheese production increased by 5.7 percent in 2014. For the top three
INSIDE . . .
3 California Cost of Production in 2014
5 California Cost of Production Summary, by Area
6 Statewide Cost Comparison Summary
7 Statewide, Quarterly, and 5-Year Cost Comparison Summaries
10 Herds Summary/Cost Comparison for Holstein, Jersey, Crossbred, California 3X vs. 2X Milking, and Organic Herds; Feed and Labor Costs
22 Top Ten Counties Profile, 2014
23 U.S. Mailbox Prices, Average Prices Paid to Producers
24 Quota Summary and Transfers
25 California Dairy Producer Assessment Rates
26 Glossary of Terms
California Cost of Milk Production in 2014
California’s Dairy Industry in 2014
cheeses (comparing 2014 to 2013): Mozzarella increased 7.5 percent, Cheddar increased 7.1 percent, and Monterey Jack increased 1.9 percent. In 2014, utilization of pooled milk for Class 1 (fluid milk) products was at 12.8 percent (from 13.1 percent in 2013). Class 1 sales continued to decline, recording a decrease of 3.6 percent compared to 2013. Whole, reduced fat, and skim milks showed decreased sales compared to 2013, while lowfat milk sales increased 2.7 percent and half-and-half remained flat.
Milk Prices
The 12-month average prices paid to California producers in 2014 was $22.08/cwt., compared to $18.49/cwt. in 2013. The year 2014 showed steady milk production at or above previous year levels, inventories of dairy products were low, exports of dairy products continued to be strong, and prices paid to producers were above last year levels.
e t r o N l e D
u o y i k s i S
c o d o M
n e s s a L
a t s a h S y t i n i r T
t d l o b m u H
o n i c o d n e M a m a h e T
e t t u B
s a m u l P
n n e l G
e k a L
a r r e i S a s u l o C
o l o Y a m o n o S
a b u Y
a d a v e N
r e c a l P
o d a r o D l E
r e t t
u S
a p a N
o n a l o S
o t n e
m a r c
a S
r o d a m A e n i p l A
o n o M
o c s i c n a r F n a S
n i r a M
a t s o C a r t n o C n a S n i u q a o J
s a r e v a l a C
o
e t
a M
n a
S a d e m a l A
e n m u l o u T
z u r C a t n a S
a r a l C a t n a S s u a l s i n a t S
d e c r e M a s o p i r a M
a r e d a M
n a S o t i n e B
y e r e t n o M o n s e r F
s g n i K
o y n I
e r a l u T
o p s i b O s i u L n a S
n r e K
a r a b r a B a t n a S
a r u t n e V
s e l e g n A s o L
e g n a r O
o g e i D n a S
l a i r e p m I
e d i s r e v i R
o n i d r a n r e B n a S
North Coast
North Valley
South Valley
Southern California
(Grey areas not included in the survey areas)
Cost of Production Survey Areas in 2014
F
California Cost of Production Annual 2014 3

California Cost of Milk Production in 2014
Cost of Production Survey Area Data Breakdown for 2014
16,097,037,721
99
1,797 1,038
SouthernCalifornia
22,912,431,598 2,370,596,382
952,319 102,730
Average Herd Size 330 1,003
South Valley
530
2014 Data Breakdown
Milk Production (In Pounds)
Estimated Number of Milk Cows
Number of Dairies
53,447 680,944
162 679
North Coast North Valley
925,033,218
CaliforniaTotals
42,305,098,919
1,789,440
1,470
1,217
5,000
7,000
9,000
11,000
13,000
15,000
17,000
19,000
21,000
23,000
25,000 California Milk Production Per Cow, 1950-2014
Milk
Pro
duct
ion
Per C
ow, I
n Po
unds
Annual milk production per cow between 1950 and 2014 increased by 207 percent. In 1950, annual milk production per cow was estimated at 7,710 pounds and in 2014 it was estimated at 23,702 pounds, a consistent upward trend during this time period. Even though annual milk production per cow has been strong and shown a steady increase over the last 65 years, there were 12 years where production per cow actually decreased from the prior year. The number of
dairies has decreased from 19,428 in 1950, to 1,470 in 2014. At the same time, the number of milk cows in 1950 was estimated at 761,000 million cows and in 2014 estimated at 1.8 million cows. The concentration of more cows on fewer farms has been accompanied by a dramatic increase in milk production per cow, partly stemming from improvements in genetic selection, feeds, herd health care, cow comfort, and management techniques.
4 California Cost of Production Annual 2014

California Cost of Milk Production Summary, by Area
North CoastIn 2014, the North Coast area represented 2.05 percent of the total milk production in the state, a decrease of 0.10 percent compared to a year ago. This area contains a large percentage of the organic herds in the state which is one reason why annual production per cow is lower compared to the other three regions in the state. Annual milk production per cow in 2014 increased by 2.08 percent, compared to 2010.
North ValleyThe North Valley area is the most diverse in terms of herd size, herd type, and weather. In 2014, the North Valley area represented 37.98 percent of total milk production in the state, an increase 0.25 percent compared to a year ago. In 2004, North Valley represented 37.73 percent of the state’s milk production. Annual milk production per cow increased by 7.99 percent, compared to 2010.
YearAnnual Milk
Per Cow(In Pounds)
2010 16,955
2014 17,307
2011 16,683
2012 16,696
2013 17,100
2014 23,647
2011 22,723
2012 23,104
2013 23,298
YearAnnual Milk
Per Cow(In Pounds)
2010 21,898
South ValleySouth Valley is the largest area in terms of milk production; in 2014 this area produced 54.34 percent of the state’s total milk production, an increase of 0.14 percent, compared to a year ago. In 2004, South Valley represented 47.27 percent of the state’s milk production. Annual milk production per cow in 2014 increased by 9.77 percent, compared to 2010.
Southern CaliforniaIn 2014, the Southern California area represented 5.63 percent of total milk production in the state, a decrease of 0.29 percent, compared to a year ago. In 2004, Southern California represented 12.25 percent of the state’s milk production. Annual milk production per cow in 2014 increased by 7.79 percent, compared to 2010.
The COP collects and compiles cost of production data based on four unique areas of the state: North Coast, North Valley, South Valley, and Southern California. Each area provides dairy producers with a different set of natural resources for milk production. The map displayed on Page 3 of this annual highlights the geographical boundary for each area. The COP also provides special analysis (feedback) reports for the following herd types: Holstein, Jersey, Organic, Crossbred, and Holstein milking 3X and 2X. In 2014, the sample of dairies that participated in the Cost of Production survey represented approximately 8 percent of all California dairies and 9.5 percent of the state’s total milk production.
2014 24,062
2011 22,987
2012 23,306
2013 23,538
YearAnnual Milk
Per Cow(In Pounds)
2010 21,920
2011 21,349
2014 23,077
Year
2010
2012
2013
22,972
22,959
Annual Milk Per Cow
(In Pounds)
21,409
74.34
8.89
$13.67 $12.72
Organic
61.01 49.71
4.75 3.86
Income Over Feed Cost $/cwt. $10.86 $11.17
Jersey
9.36
Based on CDFASample of Dairies
Pounds of Milk SoldPer Milk Cow, Per Day
Fat Test Percentage
Solids-Not-Fat Test Percentage
3.60 3.80
8.87 9.02
Holstein Crossbred
77.19
California Cost of Production Annual 2014 5

Total Feed Costs Total Hired Labor Costs Total Replacement Costs Total Operating Costs Total Milk Marketing Costs Allowance: Return on Investment
Cost Comparison Summary, 2014(Cost per Hundredweight)
California Cost Comparison Summary
The California Cost Comparison Summary (Cost Comp) is used to monitor the cost of milk production on a sample of dairy farms. A summary is published for each production area, based on monthly and quarterly cost of production data. The comparison provides a statewide weighted average of all costs and allowances for each area.
In addition to reporting costs for feed, labor, operating, replacements and marketing, the Cost Comp includes an allowance for return on management and return on investment. The return on investment is based on the Moody’s BAA Corporate Bond Index that is published monthly.
2014 Cost Comp Year in Review
Based on the Cost Comp for 2014, the cost per cow increased by 1.7 percent, but cost per cwt. increased by only 0.2 percent. This increase in the total cost per cwt. is due to higher milk output per cow which increased by 1.4 percent from 2013. The five-year cost comparison shows milk production per cow increased by 6.6 percent. All cost categories, except feed, increased compared to a year ago. Feed costs decreased by 3.6 percent on a per cwt. basis. This decrease was due mainly to lower prices paid for corn. As corn prices decreased, other grain commodities and byproducts also trended downward in price. Grain, minerals, and supplements averaged $307.49 per ton, a decrease of 9.6 percent compared to a year ago. As prices for grain commodities decreased, the amount fed increased by 3.6 percent. Dry roughage and wet roughage costs increased as dairy producers paid higher prices for alfalfa hay, corn for silage, and other forages. The ongoing drought in California impacted the quantity and quality of forage grown in 2014. The price for milk-cow alfalfa hay averaged $294.16 per ton, an increase of 11.0 percent compared to a year ago. As a result of higher cost for alfalfa hay and lower prices for grain commodities, the amount of alfalfa hay fed decreased by 9.3 percent, compared to a year ago.
The feed cost averaged $11.05 per cwt. of milk compared to $11.46 per cwt. of milk in 2013. Feed cost represented 63.4 percent of the total cost to produce a cwt. of milk. Income-over-feed cost increased by 53.4 percent compared to 2013. The increased income is reflected in the mailbox price that producers received for their milk,
Return On Investment
$0.77
Return on Management
$0.89
Marketing $0.56
Operating $2.88
Labor $1.56
Replacements$1.37
Statewide Cost Comparison Summary
which averaged $22.37 per cwt., an increase of 18.7 percent compared to a year ago.
Compared to 2013, the following cost changes recorded on a per cwt. basis. Total hired labor cost increased by 2.7 percent. The amount of milk sold, per-person (all labor), per-month increased by 1.2 percent, an increase of 2,866 pounds (see Table on Page 20). The operating costs for utilities, supplies, services etc. increased by 3.9 percent. All cost categories under operating expenses increased, except for fuel and oil, and interest expense, which decreased by 6.2 and 36.3 percent, respectively. Interest expense decreased as the higher mailbox price allowed producers to pay down debt. The replacement cost had the largest increase of all cost categories, increasing by 26.6 percent. The increase in replacement cost is a result of higher demand for replacement animals.
Feed $11.05
6 California Cost of Production Annual 2014

Statewide Cost Comparison Summary, 2014
Statewide Cost Comparison Summary
Number of Herds 114 12 58 38 3 111Feed Costs a. Dry Roughage $48.16 $75.42 $45.68 $48.44 $66.43 $48.96 1.6% b. Wet Feed & Wet Roughage $46.06 $21.67 $52.69 $45.54 $44.42 $47.70 3.6% c. Concentrates $115.16 $101.93 $100.94 $112.60 $111.39 $107.89 -6.3% d. Minerals & Supplements $8.05 $2.28 $10.29 $7.67 $2.98 $8.29 3.0% e. Pasture $1.55 $37.55 $1.13 $0.00 $0.00 $1.20 -22.6%Total Feed Costs $218.99 $238.84 $210.74 $214.25 $225.22 $214.04 -2.3% Total Feed Costs ($/cwt.) $11.46 $17.07 $10.79 $11.12 $10.59 $11.05 -3.6% Total Feed Costs (% of total cost) 66.0% 68.6% 61.9% 64.2% 64.2% 63.4%Total Hired Labor $28.96 $37.28 $33.27 $27.69 $30.62 $30.17 4.2% Total Hired Labor Costs ($/cwt.) $1.52 $2.67 $1.70 $1.44 $1.44 $1.56 2.7% Total Labor Costs (% of total cost) 8.7% 10.7% 9.8% 8.3% 8.7% 8.9%Total Herd Replacement $20.73 $18.78 $25.07 $28.11 $25.22 $26.60 28.4% Total Replacement Costs ($/cwt.) $1.08 $1.34 $1.28 $1.46 $1.19 $1.37 26.6% Total Replacement Costs (% of total cost) 6.2% 5.4% 7.4% 8.4% 7.2% 7.9%Operating Costs a. Utilities $5.49 $8.45 $5.99 $5.60 $5.30 $5.79 5.4% b. Supplies $9.93 $10.25 $11.52 $9.56 $8.89 $10.28 3.5% c. Veterinary & Medicine $7.37 $3.76 $8.42 $8.28 $7.74 $8.21 11.4% d. Outside Services $3.50 $2.15 $4.61 $3.32 $3.19 $3.78 8.0% e. Repairs & Maintenance $6.33 $6.15 $8.81 $6.32 $10.34 $7.49 18.3% f. Miscellaneous $1.41 $1.42 $1.68 $1.53 $0.74 $1.54 8.9% g. Bedding & Manure Haul $0.98 $2.16 $1.28 $0.77 $1.78 $1.05 7.2% h. Fuel & Oil $3.86 $5.07 $3.96 $3.47 $2.18 $3.62 -6.2% i. Interest Expense $1.33 $0.34 $0.41 $1.19 $0.64 $0.85 -36.3% j. R E Lease Expense $5.43 $1.80 $5.58 $5.49 $8.03 $5.59 2.9% k. Depreciation $4.97 $4.40 $6.19 $4.57 $5.09 $5.21 5.0% l. Taxes & Insurance $2.27 $1.96 $2.34 $2.31 $2.13 $2.31 1.7%Total Operating Costs $52.87 $47.90 $60.78 $52.42 $56.05 $55.71 5.4% Total Operating Costs ($/cwt.) $2.77 $3.42 $3.11 $2.72 $2.63 $2.88 3.9% Total Operating Costs (% of total cost) 15.9% 13.8% 17.9% 15.7% 16.0% 16.5%Milk Marketing Costs a. Hauling $6.88 $2.43 $6.88 $7.73 $9.64 $7.41 7.7% b. State Assessments $2.57 $2.37 $2.59 $2.50 $2.82 $2.55 -0.7% c. Federal Assessments & Misc. Ded. $0.97 $0.63 $0.99 $0.98 $1.06 $0.98 0.6%Total Milk Marketing Costs $10.42 $5.44 $10.45 $11.21 $13.52 $10.93 5.0% Total Milk Marketing Costs ($/cwt.) $0.55 $0.39 $0.53 $0.58 $0.64 $0.56 3.5% Total Milk Marketing Costs (% of total cost) 3.1% 1.6% 3.1% 3.4% 3.9% 3.2%Total Cost ($/Cow/Month) $331.95 $348.24 $340.31 $333.68 $350.64 $337.45 1.7%Total Cost ($/cwt.) $17.37 $24.90 $17.42 $17.32 $16.48 $17.42 0.2%Return on Investment and Management a. Allowance: Return on Investment ($/cwt.) $0.79 $1.01 $0.75 $0.77 $0.76 $0.77 -2.5% b. Allowance: Return on Management ($/cwt.) $0.74 $0.92 $0.89 $0.88 $0.89 $0.89 20.3%Total Costs and Allowances ($/cwt) $18.90 $26.83 $19.06 $18.97 $18.13 $19.08 0.9%Milk Production Data a. Milk Sold/Total Cow/Month/ (cwt.) 19.11 13.99 19.54 19.27 21.27 19.38 1.4% b. Lbs Milk Sold/milk cow/day 72.18 53.40 73.90 72.33 79.21 72.92 1.0% f. Income Over Feed Cost ($/cwt.) $7.38 $10.75 $12.21 $10.63 $11.66 $11.32 53.4% g. Fat Test % 3.83% 3.84% 3.91% 3.76% 3.44% 3.80% h. SNF Test % 8.95% 8.82% 8.99% 8.95% 8.84% 8.96%Related Data i. Milk Cow Feed Costs ($/Cow/Day) $7.81 $8.50 $7.51 $7.61 $7.86 $7.60 -2.7% j. Milk Cow Feed Costs ($/cwt.) $10.85 $15.92 $10.16 $10.51 $9.92 $10.46 -3.6% l. Total Cows 1,360 269 1,271 1,978 1,591 1,414 3.9%Milk Volume Percentages 1 100.00% 2.05% 37.98% 54.34% 5.63% 100.00%
1 Weighted average computed based on 2014 milk volume percentages.
Statewide Cost Comparison Summary
All costs: per cow per month, unless noted 2013 Average
North Coast
North Valley
South Valley
Southern California
2014 Average Percent
Change
California Cost of Production Annual 2014 7

Statewide Quarterly Cost Comparison Summary, 2014
Statewide Quarterly Cost Comparison Summary
All costs: per cow per month, unless noted1st Quarter
2014 Average 1
2nd Quarter 2014
Average 1
3rd Quarter 2014
Average 1
4th Quarter 2014
Average 1
2014 Annual
SummaryNumber of Herds 114 113 114 115 111
Feed Costs a. Dry Roughage $48.34 $49.31 $48.38 $50.28 $48.96 b. Wet Feed & Wet Roughage $46.34 $49.22 $46.85 $48.59 $47.70 c. Concentrates $111.91 $115.27 $102.60 $101.32 $107.89 d. Minerals & Supplements $8.04 $8.72 $8.43 $8.23 $8.29 e. Pasture $0.74 $1.59 $1.52 $0.73 $1.20Total Feed Costs $215.37 $224.10 $207.78 $209.15 $214.04 Total Feed Costs ($/cwt.) $10.80 $11.07 $11.12 $11.23 $11.05 Total Feed Costs (% of total cost) 65.2% 65.4% 62.2% 61.0% 63.4%Total Hired Labor $29.56 $29.87 $30.28 $31.54 $30.17 Total Hired Labor Costs ($/cwt.) $1.49 $1.48 $1.62 $1.69 $1.56 Total Labor Costs (% of total cost) 8.9% 8.7% 9.0% 9.2% 8.9%Total Herd Replacement $20.41 $23.06 $28.06 $34.38 $26.60 Total Replacement Costs ($/cwt.) $1.02 $1.14 $1.50 $1.84 $1.37 Total Replacement Costs (% of total cost) 6.2% 6.7% 8.4% 10.0% 7.9%Total Operating Costs $53.92 $54.24 $57.54 $57.24 $55.71 Total Operating Costs ($/cwt.) $2.70 $2.68 $3.07 $3.07 $2.88 Total Operating Costs (% of total cost) 16.3% 15.8% 17.2% 16.7% 16.5%Milk Marketing Costs a. Hauling $7.27 $7.82 $7.21 $7.11 $7.41 b. State Assessments $2.67 $2.71 $2.48 $2.36 $2.55 c. Federal Assessments & Misc. Ded. $1.01 $1.03 $0.95 $0.94 $0.98Total Milk Marketing Costs $10.95 $11.56 $10.64 $10.41 $10.93 Total Milk Marketing Costs ($/cwt.) $0.55 $0.57 $0.57 $0.56 $0.56 Total Milk Marketing Costs (% of total cost) 3.3% 3.4% 3.2% 3.0% 3.2%Total Cost ($/Cow/Month) $330.22 $342.83 $334.30 $342.71 $337.45Total Cost ($/cwt.) $16.56 $16.93 $17.88 $18.39 $17.42Return on Investment and Management a. Allowance: Return on Investment ($/cwt.) $0.74 $0.72 $0.79 $0.79 $0.77 b. Allowance: Return on Management ($/cwt.) $0.92 $0.90 $0.91 $0.91 $0.89Total Costs and Allowances ($/cwt.) $18.22 $18.55 $19.58 $20.09 $19.08Milk Production Data a. Milk Sold/Total Cow/Month/ (cwt.) 20.01 20.30 18.75 18.69 19.38 b. Lbs Milk Sold/milk cow/day 75.10 76.07 70.87 70.63 72.92 c. Gross Milk Receipts ($/cwt.) $23.27 $22.85 $23.04 $20.91 $22.57 d. Mailbox Price ($/cwt.) $23.10 $22.54 $22.76 $20.88 $22.37 f. Income Over Feed Cost ($/cwt.) $12.30 $11.47 $11.64 $9.65 $11.32 g. Fat Test % 3.84% 3.72% 3.72% 3.89% 3.80% h. SNF Test % 8.97% 8.93% 8.89% 9.01% 8.96% i. Lbs Fat Sold/milk cow/month 86.4 85.9 80.9 84.3 84.3 j. Lbs SNF Sold/milk cow/month 202.2 206.1 193.2 195.1 198.7 k. Percent Quota 24% 23% 25% 25% 24%Related Data i. Milk Cow Feed Costs ($/Cow/Day) $7.70 $7.96 $7.37 $7.39 $7.60 j. Milk Cow Feed Costs ($/cwt.) $10.29 $10.49 $10.43 $10.51 $10.46 l. Total Cows 1,376 1,410 1,419 1,409 1,4141 Weighted average computed based on 2014 milk volume percentages.
Statewide Quarterly Cost Comparison Summary, 2014
8 California Cost of Production Annual 2014

Statewide 5-Year Cost Comparison Summary
Statewide 5-Year Cost Comparison Summary
Number of Herds 147 142 126 114 111Feed Costs a. Dry Roughage $33.27 $43.23 $48.39 $48.16 $48.96 b. Wet Feed & Wet Roughage $26.56 $36.47 $44.02 $46.06 $47.70 c. Concentrates $74.33 $97.97 $111.99 $115.16 $107.89 d. Minerals & Supplements $7.56 $8.47 $9.10 $8.05 $8.29 e. Pasture $0.80 $1.25 $1.45 $1.55 $1.20Total Feed Costs $142.52 $187.37 $214.95 $218.99 $214.04 Total Feed Costs ($/cwt.) $7.84 $10.10 $11.48 $11.46 $11.05 Total Feed Costs (% of total Cost) 55.8% 62.4% 65.3% 66.0% 63.4%Total Hired Labor $27.81 $28.14 $28.47 $28.96 $30.17 Total Hired Labor Costs ($/cwt.) $1.53 $1.52 $1.52 $1.52 $1.56 Total Labor Costs (% of total cost) 10.9% 9.4% 8.7% 8.7% 8.9%Total Herd Replacement $24.35 $22.25 $23.14 $20.73 $26.60 Total Replacement Costs ($/cwt.) $1.34 $1.20 $1.24 $1.08 $1.37 Total Replacement Costs (% of total cost) 9.5% 7.4% 7.0% 6.2% 7.9%Total Operating Costs $51.49 $52.51 $52.48 $52.87 $55.71 Total Operating Costs ($/cwt.) $2.83 $2.83 $2.80 $2.77 $2.88 Total Operating Costs (% of total cost) 20.2% 17.5% 15.9% 15.9% 16.5%Milk Marketing Costs a. Hauling $6.06 $6.36 $6.66 $6.88 $7.41 b. State Assessments $2.32 $2.47 $2.43 $2.57 $2.55 c. Federal Assessments & Misc. Ded. $0.95 $0.95 $0.95 $0.97 $0.98Total Milk Marketing Costs $9.33 $9.78 $10.04 $10.42 $10.93 Total Milk Marketing Costs ($/cwt.) $0.51 $0.53 $0.54 $0.55 $0.56 Total Milk Marketing Costs (% of total cost) 3.7% 3.3% 3.1% 3.1% 3.2%Total Cost ($/Cow/Month) $255.50 $300.05 $329.07 $331.95 $337.45Total Cost ($/cwt.) $14.06 $16.17 $17.57 $17.37 $17.42Return on Investment and Management a. Allowance: Return on Investment ($/cwt.) $0.90 $0.87 $0.80 $0.79 $0.77 b. Allowance: Return on Management ($/cwt.) $0.59 $0.74 $0.66 $0.74 $0.89Total Costs and Allowances ($/cwt.) $15.55 $17.78 $19.03 $18.90 $19.08Milk Production Data a. Milk Sold/Total Cow/Month/ (cwt.) 18.17 18.56 18.73 19.11 19.38 b. Lbs Milk Sold/milk cow/day 69.17 70.64 71.03 72.18 72.92 c. Gross Milk Receipts ($/cwt.) $15.05 $18.85 $17.00 $18.97 $22.57 d. Mailbox Price ($/cwt.) $14.80 $18.49 $16.92 $18.85 $22.37 f. Income Over Feed Cost ($/cwt.) $6.96 $8.39 $5.45 $7.38 $11.32 g. Fat Test % 3.71% 3.78% 3.82% 3.83% 3.80% h. SNF Test % 8.88% 8.89% 8.91% 8.95% 8.96% i. Lbs Fat Sold/milk cow/month 78.0 81.1 82.6 84.1 84.3 j. Lbs SNF Sold/milk cow/month 186.8 190.9 193.0 196.5 198.7 k. Percent Quota 26% 25% 26% 26% 24%Related Data i. Milk Cow Feed Costs ($/Cow/Day) $5.11 $6.71 $7.67 $7.81 $7.60 j. Milk Cow Feed Costs ($/cwt.) $7.40 $9.52 $10.82 $10.85 $10.46 l. Total Cows 1,289 1,346 1,355 1,360 1,4141 Weighted average computed based on 2014 milk volume percentages.
2013 Average 1
2014 Average 1
Statewide 5-Year Cost Comparison Summary
All costs: per cow per month, unless noted 2010
Average 12011
Average 12012
Average 1
California Cost of Production Annual 2014 9
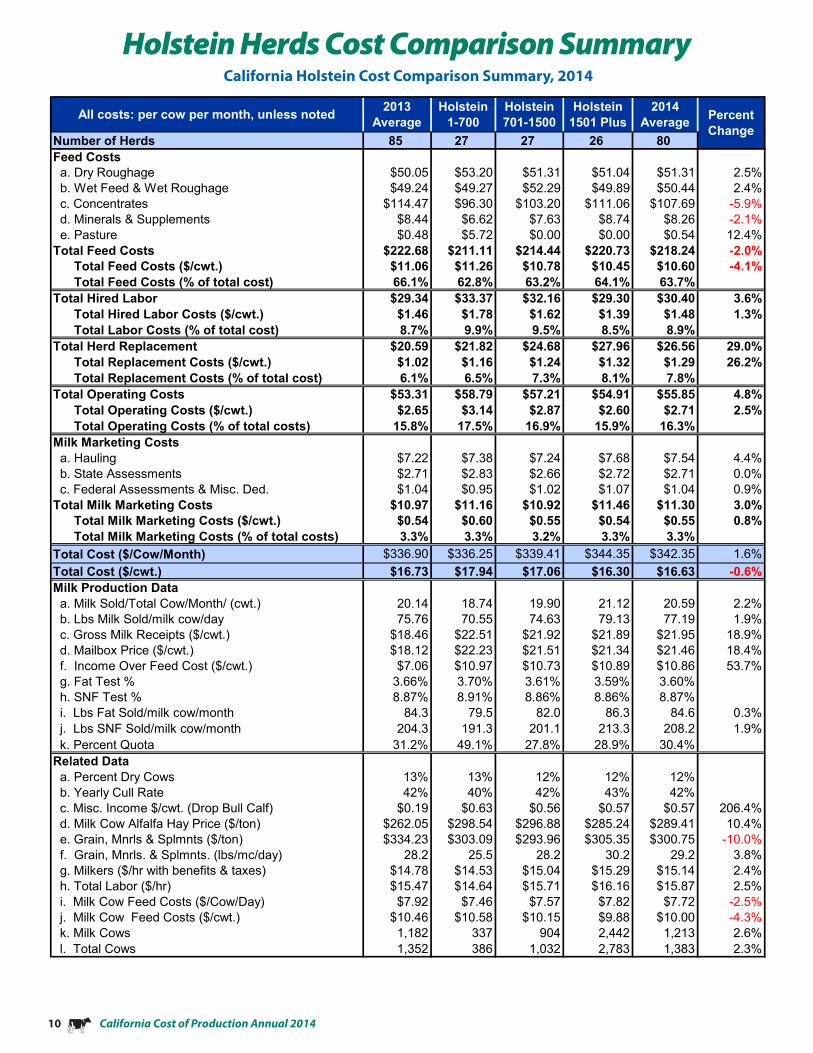
California Holstein Cost Comparison Summary, 2014
Holstein Herds Cost Comparison Summary
Number of Herds 85 27 27 26 80Feed Costs a. Dry Roughage $50.05 $53.20 $51.31 $51.04 $51.31 2.5% b. Wet Feed & Wet Roughage $49.24 $49.27 $52.29 $49.89 $50.44 2.4% c. Concentrates $114.47 $96.30 $103.20 $111.06 $107.69 -5.9% d. Minerals & Supplements $8.44 $6.62 $7.63 $8.74 $8.26 -2.1% e. Pasture $0.48 $5.72 $0.00 $0.00 $0.54 12.4%Total Feed Costs $222.68 $211.11 $214.44 $220.73 $218.24 -2.0% Total Feed Costs ($/cwt.) $11.06 $11.26 $10.78 $10.45 $10.60 -4.1% Total Feed Costs (% of total cost) 66.1% 62.8% 63.2% 64.1% 63.7%Total Hired Labor $29.34 $33.37 $32.16 $29.30 $30.40 3.6% Total Hired Labor Costs ($/cwt.) $1.46 $1.78 $1.62 $1.39 $1.48 1.3% Total Labor Costs (% of total cost) 8.7% 9.9% 9.5% 8.5% 8.9%Total Herd Replacement $20.59 $21.82 $24.68 $27.96 $26.56 29.0% Total Replacement Costs ($/cwt.) $1.02 $1.16 $1.24 $1.32 $1.29 26.2% Total Replacement Costs (% of total cost) 6.1% 6.5% 7.3% 8.1% 7.8%Total Operating Costs $53.31 $58.79 $57.21 $54.91 $55.85 4.8% Total Operating Costs ($/cwt.) $2.65 $3.14 $2.87 $2.60 $2.71 2.5% Total Operating Costs (% of total costs) 15.8% 17.5% 16.9% 15.9% 16.3%Milk Marketing Costs a. Hauling $7.22 $7.38 $7.24 $7.68 $7.54 4.4% b. State Assessments $2.71 $2.83 $2.66 $2.72 $2.71 0.0% c. Federal Assessments & Misc. Ded. $1.04 $0.95 $1.02 $1.07 $1.04 0.9%Total Milk Marketing Costs $10.97 $11.16 $10.92 $11.46 $11.30 3.0% Total Milk Marketing Costs ($/cwt.) $0.54 $0.60 $0.55 $0.54 $0.55 0.8% Total Milk Marketing Costs (% of total costs) 3.3% 3.3% 3.2% 3.3% 3.3%Total Cost ($/Cow/Month) $336.90 $336.25 $339.41 $344.35 $342.35 1.6%Total Cost ($/cwt.) $16.73 $17.94 $17.06 $16.30 $16.63 -0.6%Milk Production Data a. Milk Sold/Total Cow/Month/ (cwt.) 20.14 18.74 19.90 21.12 20.59 2.2% b. Lbs Milk Sold/milk cow/day 75.76 70.55 74.63 79.13 77.19 1.9% c. Gross Milk Receipts ($/cwt.) $18.46 $22.51 $21.92 $21.89 $21.95 18.9% d. Mailbox Price ($/cwt.) $18.12 $22.23 $21.51 $21.34 $21.46 18.4% f. Income Over Feed Cost ($/cwt.) $7.06 $10.97 $10.73 $10.89 $10.86 53.7% g. Fat Test % 3.66% 3.70% 3.61% 3.59% 3.60% h. SNF Test % 8.87% 8.91% 8.86% 8.86% 8.87% i. Lbs Fat Sold/milk cow/month 84.3 79.5 82.0 86.3 84.6 0.3% j. Lbs SNF Sold/milk cow/month 204.3 191.3 201.1 213.3 208.2 1.9% k. Percent Quota 31.2% 49.1% 27.8% 28.9% 30.4%Related Data a. Percent Dry Cows 13% 13% 12% 12% 12% b. Yearly Cull Rate 42% 40% 42% 43% 42% c. Misc. Income $/cwt. (Drop Bull Calf) $0.19 $0.63 $0.56 $0.57 $0.57 206.4% d. Milk Cow Alfalfa Hay Price ($/ton) $262.05 $298.54 $296.88 $285.24 $289.41 10.4% e. Grain, Mnrls & Splmnts ($/ton) $334.23 $303.09 $293.96 $305.35 $300.75 -10.0% f. Grain, Mnrls. & Splmnts. (lbs/mc/day) 28.2 25.5 28.2 30.2 29.2 3.8% g. Milkers ($/hr with benefits & taxes) $14.78 $14.53 $15.04 $15.29 $15.14 2.4% h. Total Labor ($/hr) $15.47 $14.64 $15.71 $16.16 $15.87 2.5% i. Milk Cow Feed Costs ($/Cow/Day) $7.92 $7.46 $7.57 $7.82 $7.72 -2.5% j. Milk Cow Feed Costs ($/cwt.) $10.46 $10.58 $10.15 $9.88 $10.00 -4.3% k. Milk Cows 1,182 337 904 2,442 1,213 2.6% l. Total Cows 1,352 386 1,032 2,783 1,383 2.3%
Percent Change
All costs: per cow per month, unless noted 2013 Average
Holstein 1-700
Holstein 701-1500
Holstein 1501 Plus
2014 Average
10 California Cost of Production Annual 2014

California Jersey Cost Comparison Summary, 2014
Jersey Herds Cost Comparison Summary
Number of Herds 12 14Feed Costs a. Dry Roughage $37.81 $39.14 3.5% b. Wet Feed & Wet Roughage $39.20 $41.29 5.3% c. Concentrates $113.11 $104.62 -7.5% d. Minerals & Supplements $9.32 $10.98 17.8% e. Pasture $0.00 $0.00Total Feed Costs $199.44 $196.03 -1.7% Total Feed Costs ($/cwt.) $12.44 $12.25 -1.5% Total Feed Costs (% of total cost) 63.1% 60.3%Total Hired Labor $28.84 $31.20 8.2% Total Hired Labor Costs ($/cwt.) $1.80 $1.95 8.4% Total Labor Costs (% of total cost) 9.1% 9.6%Total Herd Replacement $23.26 $29.03 24.8% Total Replacement Costs ($/cwt.) $1.45 $1.81 25.1% Total Replacement Costs (% of total cost) 7.4% 8.9%Total Operating Costs $55.67 $58.69 5.4% Total Operating Costs ($/cwt.) $3.47 $3.67 5.6% Total Operating Costs (% of total cost) 17.6% 18.1%Milk Marketing Costs a. Hauling $5.95 $7.01 17.9% b. State Assessments $2.11 $2.07 -2.2% c. Federal Assessments & Misc. Ded. $0.82 $0.81 -1.4%Total Milk Marketing Costs $8.88 $9.89 11.3% Total Milk Marketing Costs ($/cwt.) $0.55 $0.62 11.6% Total Milk Marketing Costs (% of total cost) 2.8% 3.0%Total Cost ($/Cow/Month) $316.09 $324.84 2.8%Total Cost ($/cwt.) $19.71 $20.29 3.0%Milk Production Data a. Milk Sold/Total Cow/Month/ (cwt.) 16.04 16.01 -0.2% b. Lbs Milk Sold/milk cow/day 61.54 61.01 -0.9% c. Gross Milk Receipts ($/cwt.) $20.52 $24.84 21.1% d. Mailbox Price ($/cwt.) $21.35 $25.92 21.4% f. Income Over Feed Cost ($/cwt.) $8.92 $13.67 53.2% g. Fat Test % 4.80% 4.75% h. SNF Test % 9.37% 9.36% i. Lbs Fat Sold/milk cow/month 89.9 88.1 -2.1% j. Lbs SNF Sold/milk cow/month 175.4 173.7 -1.0% k. Percent Quota 2.7% 2.3%Related Data a. Percent Dry Cows 14% 14% b. Yearly Cull Rate 50% 51% c. Misc. Income $/cwt. (Drop Bull Calf) $0.03 $0.04 38.2% d. Milk Cow Alfalfa Hay Price ($/ton) $272.41 $320.55 17.7% e. Grain, Mnrls & Splmnts ($/ton) $331.01 $304.53 -8.0% f. Grain, Mnrls. & Splmnts. (lbs/mc/day) 28.2 29.0 2.9% g. Milkers ($/hr with benefits & taxes) $13.14 $14.46 10.1% h. Total Labor ($/hr) $14.87 $16.09 8.2% i. Milk Cow Feed Costs ($/Cow/Day) $7.19 $7.04 -2.1% j. Milk Cow Feed Costs ($/cwt.) $11.68 $11.53 -1.2% k. Milk Cows 2,075 2,116 2.0% l. Total Cows 2,421 2,453 1.3%
California Jersey Cost Comparison Summary 2014
All costs: per cow per month, unless noted 2013 Average 2014 Average Percent Change
California Cost of Production Annual 2014 11

California Crossbred, Mixed-and-Other Herds Cost Comparison Summary, 2014
Crossbred Herd Cost Comparison Summary
Number of Herds 6 7Feed Costs a. Dry Roughage $36.10 $35.93 -0.5% b. Wet Feed & Wet Roughage $55.86 $63.55 13.8% c. Concentrates $106.32 $97.86 -8.0% d. Minerals & Supplements $5.00 $6.61 32.1% e. Pasture $0.61 $0.77 26.0%Total Feed Costs $203.89 $204.71 0.4% Total Feed Costs ($/cwt.) $10.92 $10.45 -4.2% Total Feed Costs (% of total cost) 66.2% 64.1%Total Hired Labor $29.85 $29.13 -2.4% Total Hired Labor Costs ($/cwt.) $1.60 $1.49 -6.9% Total Labor Costs (% of total cost) 9.7% 9.1%Total Herd Replacement $15.55 $18.08 16.3% Total Replacement Costs ($/cwt.) $0.83 $0.92 10.9% Total Replacement Costs (% of total cost) 5.0% 5.7%Total Operating Costs $47.69 $55.97 17.4% Total Operating Costs ($/cwt.) $2.55 $2.86 12.0% Total Operating Costs (% of total cost) 15.5% 17.5%Milk Marketing Costs a. Hauling $7.54 $7.98 5.9% b. State Assessments $2.52 $2.58 2.3% c. Federal Assessments & Misc. Ded. $0.95 $1.02 7.7%Total Milk Marketing Costs $11.00 $11.58 5.2% Total Milk Marketing Costs ($/cwt.) $0.59 $0.59 0.4% Total Milk Marketing Costs (% of total cost) 3.6% 3.6%Total Cost ($/Cow/Month) $307.98 $319.47 3.7%Total Cost ($/cwt.) $16.49 $16.32 -1.0%Milk Production Data a. Milk Sold/Total Cow/Month/ (cwt.) 18.68 19.58 4.8% b. Lbs Milk Sold/milk cow/day 72.12 74.34 3.1% c. Gross Milk Receipts ($/cwt.) $18.57 $22.20 19.6% d. Mailbox Price ($/cwt.) $18.46 $21.62 17.1% f. Income Over Feed Cost ($/cwt.) $7.55 $11.17 48.0% g. Fat Test % 3.80% 3.80% h. SNF Test % 8.99% 9.02% i. Lbs Fat Sold/milk cow/month 83.3 85.8 3.1% j. Lbs SNF Sold/milk cow/month 197.2 204.0 3.5% k. Percent Quota 14.1% 5.6%Related Data a. Percent Dry Cows 15% 13% b. Yearly Cull Rate 34% 32% c. Misc. Income $/cwt. (Drop Bull Calf) $0.20 $0.62 211.3% d. Milk Cow Alfalfa Hay Price ($/ton) $249.22 $279.12 12.0% e. Grain, Mnrls & Splmnts ($/ton) $330.79 $296.60 -10.3% f. Grain, Mnrls. & Splmnts. (lbs/mc/day) 25.8 26.7 3.7% g. Milkers ($/hr with benefits & taxes) $15.58 $13.89 -10.9% h. Total Labor ($/hr) $16.76 $15.12 -9.8% i. Milk Cow Feed Costs ($/Cow/Day) $7.33 $7.35 0.2% j. Milk Cow Feed Costs ($/cwt.) $10.16 $9.88 -2.8% k. Milk Cows 884 1,004 13.6% l. Total Cows 1,038 1,159 11.7%
Percent Change
Crossbred Herd Cost Comparison SummaryAll costs: per cow per month, unless noted 2013 Average 2014 Average
12 California Cost of Production Annual 2014
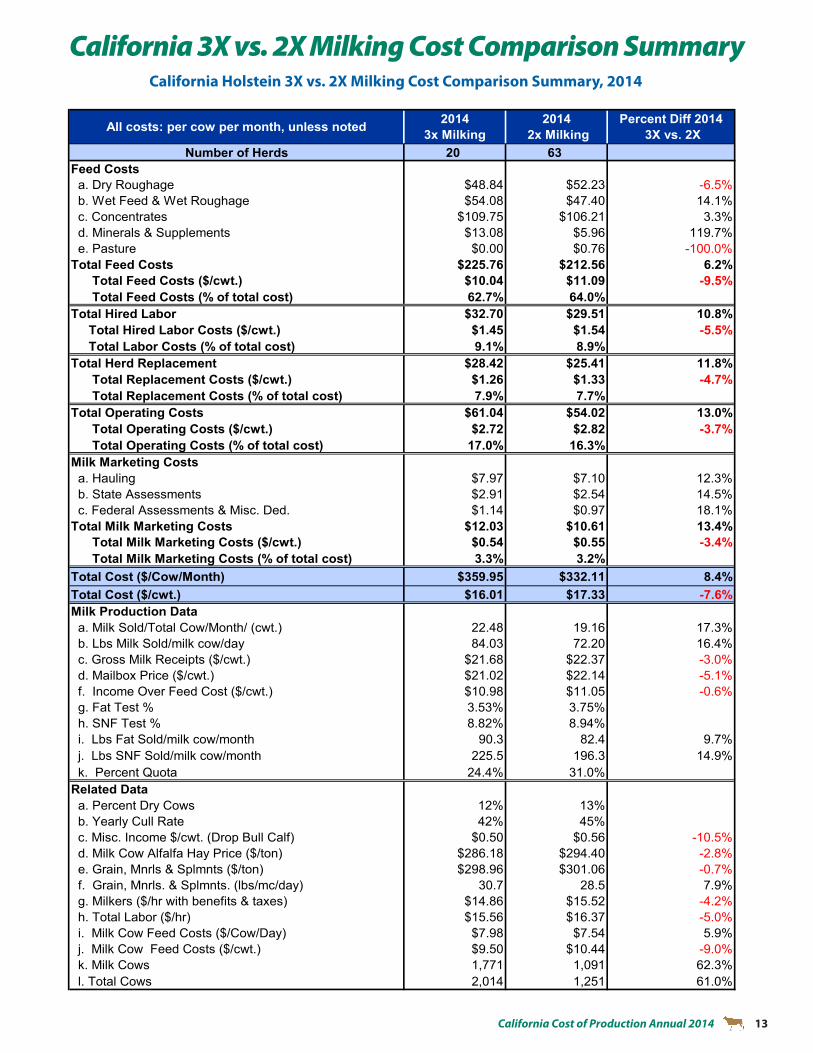
California Holstein 3X vs. 2X Milking Cost Comparison Summary, 2014
California 3X vs. 2X Milking Cost Comparison Summary
Number of Herds 20 63Feed Costs a. Dry Roughage $48.84 $52.23 -6.5% b. Wet Feed & Wet Roughage $54.08 $47.40 14.1% c. Concentrates $109.75 $106.21 3.3% d. Minerals & Supplements $13.08 $5.96 119.7% e. Pasture $0.00 $0.76 -100.0%Total Feed Costs $225.76 $212.56 6.2% Total Feed Costs ($/cwt.) $10.04 $11.09 -9.5% Total Feed Costs (% of total cost) 62.7% 64.0%Total Hired Labor $32.70 $29.51 10.8% Total Hired Labor Costs ($/cwt.) $1.45 $1.54 -5.5% Total Labor Costs (% of total cost) 9.1% 8.9%Total Herd Replacement $28.42 $25.41 11.8% Total Replacement Costs ($/cwt.) $1.26 $1.33 -4.7% Total Replacement Costs (% of total cost) 7.9% 7.7%Total Operating Costs $61.04 $54.02 13.0% Total Operating Costs ($/cwt.) $2.72 $2.82 -3.7% Total Operating Costs (% of total cost) 17.0% 16.3%Milk Marketing Costs a. Hauling $7.97 $7.10 12.3% b. State Assessments $2.91 $2.54 14.5% c. Federal Assessments & Misc. Ded. $1.14 $0.97 18.1%Total Milk Marketing Costs $12.03 $10.61 13.4% Total Milk Marketing Costs ($/cwt.) $0.54 $0.55 -3.4% Total Milk Marketing Costs (% of total cost) 3.3% 3.2%Total Cost ($/Cow/Month) $359.95 $332.11 8.4%Total Cost ($/cwt.) $16.01 $17.33 -7.6%Milk Production Data a. Milk Sold/Total Cow/Month/ (cwt.) 22.48 19.16 17.3% b. Lbs Milk Sold/milk cow/day 84.03 72.20 16.4% c. Gross Milk Receipts ($/cwt.) $21.68 $22.37 -3.0% d. Mailbox Price ($/cwt.) $21.02 $22.14 -5.1% f. Income Over Feed Cost ($/cwt.) $10.98 $11.05 -0.6% g. Fat Test % 3.53% 3.75% h. SNF Test % 8.82% 8.94% i. Lbs Fat Sold/milk cow/month 90.3 82.4 9.7% j. Lbs SNF Sold/milk cow/month 225.5 196.3 14.9% k. Percent Quota 24.4% 31.0%Related Data a. Percent Dry Cows 12% 13% b. Yearly Cull Rate 42% 45% c. Misc. Income $/cwt. (Drop Bull Calf) $0.50 $0.56 -10.5% d. Milk Cow Alfalfa Hay Price ($/ton) $286.18 $294.40 -2.8% e. Grain, Mnrls & Splmnts ($/ton) $298.96 $301.06 -0.7% f. Grain, Mnrls. & Splmnts. (lbs/mc/day) 30.7 28.5 7.9% g. Milkers ($/hr with benefits & taxes) $14.86 $15.52 -4.2% h. Total Labor ($/hr) $15.56 $16.37 -5.0% i. Milk Cow Feed Costs ($/Cow/Day) $7.98 $7.54 5.9% j. Milk Cow Feed Costs ($/cwt.) $9.50 $10.44 -9.0% k. Milk Cows 1,771 1,091 62.3% l. Total Cows 2,014 1,251 61.0%
California Holstein 3X vs. 2X Milking Cost Comparison Summary, 2014
All costs: per cow per month, unless noted 2014 3x Milking
2014 2x Milking
Percent Diff 2014 3X vs. 2X
California Cost of Production Annual 2014 13

Organic Herds ComparisonCalifornia Organic Herds Production Cost Comparison, 2014
Number of Herds 10 10Feed Costs a. Dry Roughage $56.33 $67.39 19.6% b. Wet Feed & Wet Roughage $16.96 $20.10 18.5% c. Concentrates $120.97 $122.41 1.2% d. Minerals & Supplements $3.33 $3.33 0.1% e. Pasture $47.24 $36.43 -22.9% Total Feed Costs $244.84 $249.66 2.0% Total Feed Costs ($/cwt.) $19.32 $19.35 0.1% Total Feed Costs (% of total cost) 69.9% 70.6%Total Hired Labor $36.22 $33.94 -6.3% Total Hired Labor Costs ($/cwt.) $2.86 $2.63 -8.0% Total Labor Costs (% of total cost) 10.3% 9.6%Total Herd Replacement $14.84 $15.91 7.2% Total Replacement Costs ($/cwt.) $1.17 $1.23 5.3% Total Replacement Costs (% of total cost) 4.2% 4.5%Total Operating Costs $51.83 $51.16 -1.3% Total Operating Costs ($/cwt.) $4.09 $3.96 -3.1% Total Operating Costs (% of total cost) 14.8% 14.5%Milk Marketing Costs a. Hauling $0.51 $0.67 32.4% b. State Assessments $1.90 $2.00 5.5% c. Federal Assessments & Misc. Ded. $0.31 $0.41 33.2%Total Milk Marketing Costs $2.72 $3.09 13.7% Total Milk Marketing Costs ($/cwt.) $0.21 $0.24 11.6% Total Milk Marketing Costs (% of total cost) 0.8% 0.9%Total Cost ($/Cow/Month) $350.44 $353.77 0.9%Total Cost ($/cwt.) $27.66 $27.42 -0.9%Milk Production Data a. Milk Sold/Total Cow/Month/ (cwt.) 12.67 12.90 1.8% b. Lbs Milk Sold/milk cow/day 48.93 49.71 1.6% c. Gross Milk Receipts ($/cwt.) $28.82 $29.18 1.2% d. Mailbox Price ($/cwt.) $30.90 $32.07 3.8% f. Income Over Feed Cost ($/cwt.) $11.57 $12.72 9.9% g. Fat Test % 3.85% 3.86% h. SNF Test % 8.89% 8.89% i. Lbs Fat Sold/milk cow/month 57.3 58.3 1.8% j. Lbs SNF Sold/milk cow/month 132.3 134.5 1.6% k. Percent Quota 28.3% 32.2%Related Data a. Percent Dry Cows 15% 15% b. Yearly Cull Rate 37% 29% c. Misc. Income $/cwt. (Drop Bull Calf) $0.20 $0.58 199.1% d. Milk Cow Alfalfa Hay Price ($/ton) $315.44 $333.92 5.9% e. Grain, Mnrls & Splmnts ($/ton) $610.64 $589.91 -3.4% f. Grain, Mnrls. & Splmnts. (lbs/mc/day) 16.4 17.3 5.9% g. Milkers ($/hr with benefits & taxes) $14.56 $15.45 6.1% h. Total Labor ($/hr) $14.40 $15.33 6.4% i. Milk Cow Feed Costs ($/Cow/Day) $8.88 $9.01 1.4% j. Milk Cow Feed Costs ($/cwt.) $18.15 $18.12 -0.2% k. Milk Cows 378 325 -14.1% l. Total Cows 445 381 -14.3%
Percent Change
Organic Herds Cost Comparison Summary
All costs: per cow per month, unless noted 2013 Average 2014 Average
14 California Cost of Production Annual 2014

Pou
nd
s Fe
d P
er C
ow/P
er D
ay
Average Alfalfa Hay and Other Forage PricesBased on California Cost of Milk Production Studies
0.0
2.0
4.0
6.0
8.0
10.0
1Q 2Q 3Q 4Q 1Q 2Q 3Q 4Q
2013 2014
$0
$50
$100
$150
$200
$250
$300
$350
$400
Corn Pounds Fed Corn $ Per Ton
0.0
2.0
4.0
6.0
8.0
10.0
12.0
1Q 2Q 3Q 4Q 1Q 2Q 3Q 4Q
2013 2014
$0
$50
$100
$150
$200
$250
$300
$350
Alfalfa Pounds Fed Alfalfa $ Per Ton
Pounds of Corn Fed Per Cow-Per Day/Dollars Per Ton
Pounds of Alfalfa Fed Per Cow-Per Day/Dollars Per Ton
Pou
nd
s Fe
d P
er C
ow/P
er D
ayD
ollars Per To
nD
ollars Per To
n
Labor Cost Percentage, 2012
Feed Commodity Prices Paid forPremium Alfalfa, Canola, Rolled Corn, Soybean Meal, Whole Cottonseed, and Dried Distillers Grain
Based on California Cost of Production SurveysJanuary 2013-December 2014
$150
$225
$300
$375
$450
$525
$600
1Q 2Q 3Q 4Q 1Q 2Q 3Q 4Q
2013 2014
Alfalfa Hay Rolled Corn Cottonseed
Canola Soybean Meal Dried Distillers Grain
Dol
lars
Per
Ton
California Cost of Production Annual 2014 15

This Annual Feed Summary provides a breakdown for feed ingredients fed to milk and dry cows throughout the year. The summary provides the dollars-per-ton fed for each commodity fed, feed intake per-cow per-day, estimated dry matter intake per-cow per-day, and the percent of total feed cost. This table represents the Holstein herds throughout California participating in the COP survey. This summary table does not contain organic herds.
California Holstein Dairies - Feed Summary, 201412-Month Weighted Averages, Based on CDFA Cost Study Dairy Surveys
Holstein Herd Feed Summary
$ Per Ton 1
As Fed #'s Per Cow
Per Day 1
Dry Matter #'s Per Cow
Per Day 2
% ofTotal Feed
Cost 1
$ Per Ton 1
As Fed #'s Per Cow
Per Day 1
Dry Matter #'s Per Cow
Per Day 2
% ofTotal Feed
Cost 1
DRY ROUGHAGEAlfalfa Hay $290.64 9.17 8.24 17.0% $268.30 1.73 1.55 7.0%Other Hay $155.85 0.60 0.54 0.6% $194.32 9.62 8.60 1.6%Almond Hulls & Shells $153.76 4.90 4.37 4.6% $150.44 2.24 2.00 0.3%Total Dry Roughage $239.38 14.67 13.15 22.5% $196.48 13.59 12.15 40.1%
SILAGE Corn Silage $71.10 28.45 9.52 12.9% $71.09 12.68 4.24 13.5%Other Silage $69.26 9.40 3.10 4.2% $62.54 22.75 7.55 21.3%Green Chop $68.94 1.48 0.38 0.7% $68.94 0.27 0.07 0.3%Total Silage $70.57 39.33 13.00 17.8% $65.62 35.70 11.86 35.2%
OTHER FORAGES & WET FEEDS Earlage $185.76 0.02 0.01 0.0% $185.76 0.01 0.00 0.0%Wet Distiller Grain $91.58 3.08 0.97 1.8% $91.58 0.25 0.08 0.3%Wet Corn Gluten $97.02 1.54 0.49 1.0% $97.02 0.22 0.07 0.3%Whey $38.99 4.01 0.62 1.0% $38.99 0.27 0.04 0.2%Other Wet Feeds $40.67 2.56 0.53 0.7% $36.81 2.66 0.55 1.5%Total Other Forages & Wet Feeds $62.04 11.21 2.62 4.4% $45.02 3.39 0.74 2.3%
CONCENTRATES & BYPRODUCTS Inside Barn Mix $279.26 1.62 1.39 2.9% $279.26 0.01 0.01 0.0%Rolled Corn $220.56 9.58 8.43 13.5% $220.56 1.01 0.89 3.3%Rolled Barley $222.98 0.23 0.20 30.0% $222.99 0.04 0.03 0.1%Whole Cottonseed/Pima $419.12 2.48 2.28 0.3% $411.67 0.01 0.01 0.1%Soybean Meal $505.89 0.07 0.06 0.2% $505.89 0.00 0.00 0.0%Canola $359.78 4.00 3.66 9.2% $359.78 0.45 0.41 2.4%Beet Pulp $237.65 0.25 0.23 0.4% $237.65 0.03 0.03 0.1%Wheat Millrun $201.69 0.46 0.42 0.6% $201.69 0.10 0.09 0.3%Dried Distillers Grain $253.52 1.81 1.66 2.9% $253.52 0.18 0.17 0.7%Other Grains & byproducts $312.87 2.81 2.55 5.6% $320.38 1.96 1.74 8.8%Mill/Custom Mix $326.04 4.31 3.72 9.0% $327.75 0.13 0.11 0.0%Total Concentrates & Byproducts $290.58 27.62 24.61 51.4% $291.11 3.92 3.49 16.5%
MINERALS & ADDITIVES All Minerals $395.64 1.47 1.21 3.7% $586.20 0.63 0.48 5.5%
PASTURE Pasture $50.00 0.71 0.15 0.2% $50.00 0.62 0.13 0.5%
TOTALS $164.47 95.01 54.74 100.0% $115.47 57.06 28.85 100.0%
Cost Per Cow-Per Day $8.01 Cost Per Cow-Per Day $3.29Cost Per Cwt. of Milk $10.38 Cost Per Cwt. of Milk $0.60Avg. Milk Cows per Dairy 1,216 Avg. Dry Cows per Dairy 128Milk Production Per Cow-Per Day 77.15
1 All figures based on weighted averages2 Dry Matter is estimated
MILK COWS DRY COWS
12-Month Weighted Averages, Based on CDFA Cost Study Dairy Surveys
FEED
16 California Cost of Production Annual 2014

This Annual Feed Summary provides a breakdown for feed ingredients fed to milk and dry cows throughout the year. The summary provides the dollars-per-ton fed for each commodity fed, feed intake per-cow per-day, estimated dry matter intake per-cow per-day, and the percent of total feed cost. This table represents the Jersey herds throughout California participating in the COP survey. This table does not contain organic herds.
California Jersey Dairies - Feed Summary, 201412-Month Weighted Averages, Based on CDFA Cost Study Dairy Surveys
Jersey Herd Feed Summary
$ Per Ton 1
As Fed #'s Per Cow
Per Day 1
Dry Matter #'s Per Cow
Per Day 2
% of Total Feed
Cost 1
$ Per Ton 1
As Fed #'s Per Cow
Per Day 1
Dry Matter #'s Per Cow
Per Day 2
% of Total Feed
Cost 1
DRY ROUGHAGEAlfalfa Hay $321.68 6.07 5.43 13.6% $288.41 0.84 0.75 4.3%Other Hay $174.24 1.60 1.35 1.8% $159.75 10.14 7.61 1.7%Almond Hulls & Shells $158.62 3.19 2.87 3.3% $158.62 2.14 1.93 0.4%Total Dry Roughage $252.01 10.86 9.65 19.1% $167.79 13.12 10.29 39.3%
SILAGE Corn Silage $72.11 24.53 8.15 12.4% $72.11 8.78 2.92 11.3%Other Silage $66.15 9.41 3.19 4.3% $59.44 17.64 5.98 18.7%Green Chop $0.00 0.00 0.00 0.0% $0.00 0.00 0.00 0.0%Total Silage $70.46 33.95 11.34 16.7% $63.66 26.42 8.90 30.1%
OTHER FORAGES & WET FEEDS Earlage $0.00 0.00 0.00 0.0% $0.00 0.00 0.00 0.0%Wet Distiller Grain $91.75 2.48 0.76 1.6% $91.75 0.41 0.12 0.7%Wet Corn Gluten $94.80 1.68 0.67 1.1% $94.80 0.67 0.27 1.1%Whey $28.18 2.05 0.21 0.4% $28.18 1.95 0.20 1.0%Other Wet Feeds $34.15 1.30 0.30 0.3% $45.67 0.93 0.22 0.8%Total Other Forages & Wet Feeds $65.09 7.52 1.94 3.4% $50.12 3.96 0.81 3.5%
CONCENTRATES & BYPRODUCTS Inside Barn Mix $0.00 0.00 0.00 0.0% $0.00 0.00 0.00 0.0%Rolled Corn $218.81 9.99 8.82 15.3% $218.81 1.35 1.19 5.3%Rolled Barley $0.00 0.00 0.00 0.0% $0.00 0.00 0.00 0.0%Whole Cottonseed/Pima $393.35 3.38 3.12 9.3% $394.12 0.12 0.11 0.9%Soybean Meal $419.74 0.13 0.11 0.4% $419.74 0.03 0.03 0.2%Canola $348.12 4.14 3.80 10.1% $348.12 0.73 0.67 4.6%Beet Pulp $233.57 0.23 0.21 0.4% $233.57 0.05 0.05 0.2%Wheat Millrun $209.57 0.14 0.12 0.2% $0.00 0.00 0.00 0.0%Dried Distillers Grain $246.45 1.45 1.33 2.5% $246.45 0.15 0.14 0.7%Other Grains & byproducts $316.32 5.11 4.65 11.3% $309.12 1.19 1.07 6.6%Mill/Custom Mix $398.54 2.18 1.89 6.1% $0.00 0.00 0.00 0.0%Total Concentrates & Byproducts $296.72 26.74 24.06 55.4% $283.32 3.62 3.26 18.4%
MINERALS & ADDITIVES All Minerals $398.76 1.93 1.58 5.4% $584.00 0.83 0.70 8.7%
PASTURE Pasture $0.00 0.00 0.00 0.0% $0.00 0.00 0.00 0.0%
TOTALS $176.81 81.00 48.56 100.0% $116.65 47.95 23.96 100.0%
Cost Per Cow-Per Day $7.06 Cost Per Cow-Per Day $2.76Cost Per Cwt. of Milk $11.52 Cost Per Cwt. of Milk $0.72Avg. Milk Cows per Dairy 2,044 Avg. Dry Cows per Dairy 327Milk Production Per Cow-Per Day 62.14
1 All figures based on weighted averages2 Dry Matter is estimated
MILK COWS DRY COWS
FEED
California Cost of Production Annual 2014 17

$0
$2
$4
$6
$8
$10
$12
2010 2011 2012 2013 2014
$0.04 $0.07 $0.08 $0.08 $0.06 $1.46 $1.96 $2.35 $2.41 $2.46
$1.83 $2.33
$2.58 $2.52 $2.53
$4.51
$5.73 $6.47
$6.45 $5.99
Dol
lars
per
Cow
per
Mon
th
Total Feed Costs Per Cow Per Month1/ California, 2009 - 2013
Pasture Wet Roughage Dry Roughage Concentrate 1/ Includes Feed costs for both milk cows and dry
$0
$40
$80
$120
$160
$200
$240
2010 2011 2012 2013 2014
$0.80 $1.25 $1.45 $1.55 $1.20 $26.56 $36.47 $44.02 $46.06 $47.70
$33.27 $43.23
$48.39 $48.16 $48.96
$81.89
$106.43 121.09
$123.21 116.18
Dol
lars
per
Cow
per
Mon
th
Total Feed Costs Per Cow Per Month1/ California, 2008 - 2012
Pasture Wet Roughage Dry Roughage Concentrate 1/ Includes Feed costs for both milk cows and dry
Total Feed Costs Per Cow, Per Month 1
California, 2010-2014Total Feed Cost Per Hundredweight of Milk 1
California, 2010-2014
Do
llars
Per
Cow
Per
Mo
nth
Do
llars
Per
Hu
nd
red
wei
gh
t of M
ilk
1 Includes feed costs for both milk cows and dry cows.
$11.04$214.04$218.98$214.95
$187.37
$142.52
$11.46$11.48
$10.10
$7.84
Feed Cost Breakdown
Dry Roughage and Concentrate Costs,California, 2010-2014
Dry Roughage and Concentrate Costs,California, by Area, 2014
Dol
lars
Per
Ton
Dol
lars
Per
Ton
$0
$75
$150
$225
$300
$375
$450
$525
North Coast North Valley South Valley
Southern California
Statewide Average
$322 $306 $287
$274 $294
$487
$315 $298 $283 $307
Dol
lars
per
Ton
Milk Cow Hay Concentrates
$0
$50
$100
$150
$200
$250
$300
$350
2010 2011 2012 2013 2014
$164
$246 $273 $265
$294
$234
$298
$338 $340
$307
Dol
lars
per
Ton
Milk Cow Hay Concentrates
18 California Cost of Production Annual 2014

Average Milker and Outside Labor Monthly WagesIncluding Benefits and Employer Taxes
California Cost of Production Areas, 2014
Dol
lars
Per
Mon
thD
olla
rs P
er H
our
Average Milker and Outside Labor Hourly WagesIncluding Benefits and Employer Taxes
California Cost of Production Areas, 2014
Average Milk and Outside Labor Wages
$0
$1,000
$2,000
$3,000
$4,000
$5,000
North Coast North Valley South Valley Southern California
Statewide Average
$3,169
$3,623
$3,308 $3,516 $3,456
$3,295
$4,304
$4,005 $4,146 $4,144
Milker Monthly Wage Outside Monthly Wage
$0.00
$4.00
$8.00
$12.00
$16.00
$20.00
North Coast North Valley South Valley Southern California
Statewide Average
$14.39
$15.91
$13.97
$16.99
$14.94 $14.95
$17.64
$16.60 $16.09
$17.09
Milker Hourly Wage Outside Hourly Wage
California Cost of Production Annual 2014 19

Labor Statewide Comparison, by Cost of Production Area, 2014
Labor Costs Comparison, by Area
2013 2014Statewide StatewideAverage Average
CASH WAGE / HIRED MILKER $2,622 $2,159 $2,816 $2,635 $2,837 $2,712 3.4%
PERQUISITES / HIRED MILKER 1 $280 $493 $283 $242 $203 $267 -4.8%
TAXES / HIRED MILKER 2 $446 $518 $523 $431 $476 $477 6.9%
PERQUISITES & TAXES / HIRED MILKER 1 $726 $1,010 $807 $673 $679 $744 2.4%
TOTAL WAGE / HIRED MILKER 2 $3,349 $3,169 $3,623 $3,308 $3,516 $3,456 3.2%
HOURS / MONTH / HIRED MILKER 231 220 228 237 207 231 0.1%
HOURLY CASH WAGE / HIRED MILKER $11.35 $9.80 $12.37 $11.12 $13.71 $11.73 3.3%
HOURLY PERQUISITES / HIRED MILKER 1 $1.21 $2.24 $1.24 $1.02 $0.98 $1.15 -5.0%
HOURLY TAXES / HIRED MILKER 2 $1.93 $2.35 $2.30 $1.82 $2.30 $2.06 6.8%
HOURLY PERQUISITES & TAXES / HIRED MILKER 1 $3.15 $4.59 $3.54 $2.84 $3.28 $3.22 2.3%
HOURLY WAGE / HIRED MILKER 2 $14.50 $14.39 $15.91 $13.97 $16.99 $14.94 3.1%
CASH WAGE / HIRED LABOR $3,124 $2,413 $3,307 $3,224 $3,470 $3,249 4.0%
PERQUISITES / HIRED LABOR 1 $340 $329 $362 $264 $106 $314 -7.7%
TAXES / HIRED LABOR 2 $538 $553 $635 $516 $570 $581 8.0%
PERQUISITES & TAXES / HIRED LABOR 1 $878 $882 $997 $780 $676 $895 1.9%
TOTAL WAGE / HIRED LABOR 2 $4,002 $3,295 $4,304 $4,005 $4,146 $4,144 3.5%
HOURS / MONTH / HIRED LABOR 241 220 244 241 258 243 0.5%
HOURLY CASH WAGE / HIRED LABOR $12.94 $10.95 $13.55 $13.36 $13.46 $13.40 3.5%
HOURLY PERQUISITES / HIRED LABOR 1 $1.41 $1.49 $1.49 $1.09 $0.41 $1.29 -8.1%
HOURLY TAXES / HIRED LABOR 2 $2.23 $2.51 $2.60 $2.14 $2.21 $2.40 7.5%
HOURLY PERQUISTIES & TAXES / HIRED LABOR 1 $3.64 $4.00 $4.09 $3.23 $2.62 $3.69 1.5%
HOURLY WAGE / HIRED LABOR 2 $16.58 $14.95 $17.64 $16.60 $16.09 $17.09 3.1%
CASH WAGE / ALL HIRED $2,827 $2,273 $3,038 $2,861 $3,063 $2,936 3.9%
TOTAL WAGE / ALL HIRED 2 $3,615 $3,226 $3,931 $3,575 $3,741 $3,743 3.5%
HOURLY CASH WAGE / ALL HIRED $12.02 $10.32 $12.92 $11.99 $13.61 $12.44 3.5%
HOURLY WAGE / ALL HIRED 2 $15.37 $14.64 $16.72 $14.98 $16.62 $15.86 3.2%
HOURS / COW / MONTH / ALL HIRED 1.92 2.55 1.99 1.85 1.84 1.93 0.5%
CASH COST / COW / MONTH / ALL HIRED $23.06 $26.27 $25.71 $22.16 $25.07 $24.00 4.1%
COST / COW / MONTH / ALL HIRED 2 $29.49 $37.28 $33.27 $27.69 $30.62 $30.60 3.7%
NUMBER COWS / HIRED MILKER 207 157 215 209 190 210 1.4%NUMBER COWS / HIRED LABOR 301 193 262 337 342 293 -2.4%
NUMBER COWS / ALL MILKERS & LABOR 3 122 86 118 129 122 122 -0.2%
MILK SOLD / PERSON / MONTH (LBS.) 3 233,362 119,744 230,497 248,314 259,816 236,228 1.2%
REVENUE GENERATED / PERSON / MONTH 3 $44,356 $30,641 $52,811 $55,185 $58,796 $53,422 20.4%
2 Includes Cash Wages, Perquisites, and Employment Taxes Paid by Employer3 Includes All Dairy Workers, Hired and Family
1 Includes Fair Market Value For Housing Supplied By Employer, Health Insurance, Meat, Etc. and Employment Taxes (FICA, Worker's Compensation,Unemployment Insurance) Paid by Employer
Labor Statewide Comparison, by Cost of Production Area, 2014
SouthernCalifornia
PercentChangeAVERAGES North
Coast NorthValley
SouthValley
20 California Cost of Production Annual 2014
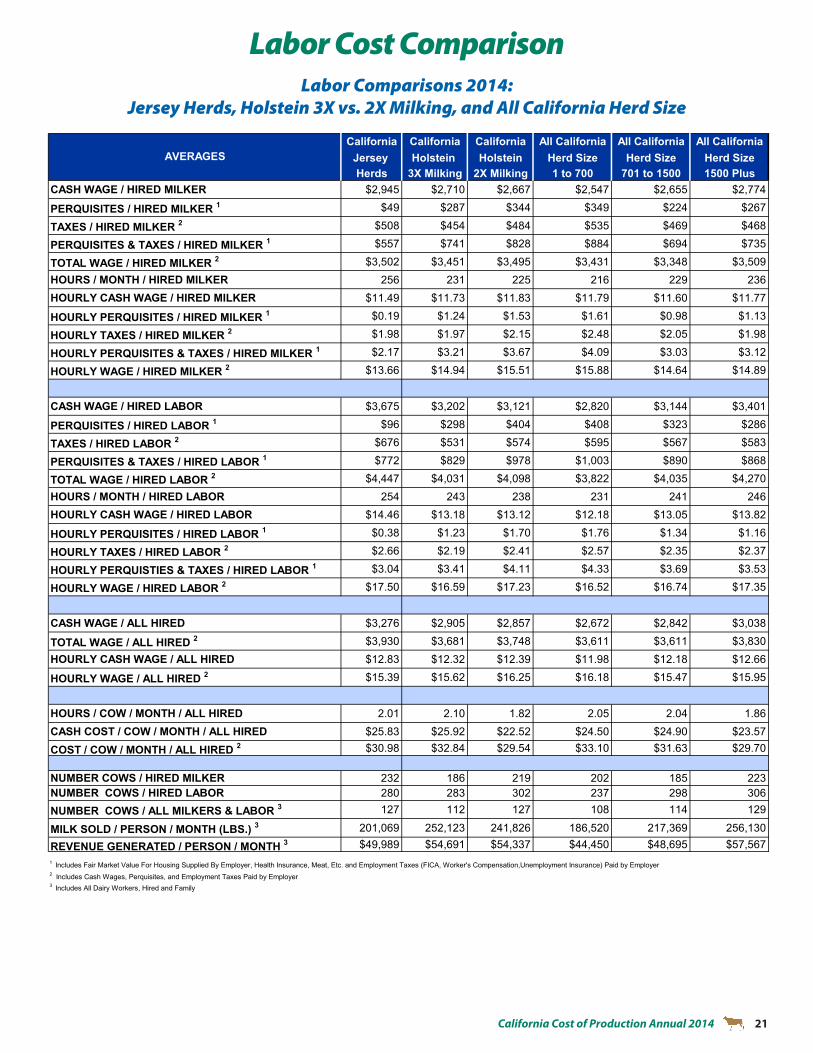
Labor Comparisons 2014: Jersey Herds, Holstein 3X vs. 2X Milking, and All California Herd Size
Labor Cost Comparison
California California California All California All California All CaliforniaJersey Holstein Holstein Herd Size Herd Size Herd SizeHerds 3X Milking 2X Milking 1 to 700 701 to 1500 1500 Plus
CASH WAGE / HIRED MILKER $2,945 $2,710 $2,667 $2,547 $2,655 $2,774
PERQUISITES / HIRED MILKER 1 $49 $287 $344 $349 $224 $267
TAXES / HIRED MILKER 2 $508 $454 $484 $535 $469 $468
PERQUISITES & TAXES / HIRED MILKER 1 $557 $741 $828 $884 $694 $735
TOTAL WAGE / HIRED MILKER 2 $3,502 $3,451 $3,495 $3,431 $3,348 $3,509HOURS / MONTH / HIRED MILKER 256 231 225 216 229 236HOURLY CASH WAGE / HIRED MILKER $11.49 $11.73 $11.83 $11.79 $11.60 $11.77
HOURLY PERQUISITES / HIRED MILKER 1 $0.19 $1.24 $1.53 $1.61 $0.98 $1.13
HOURLY TAXES / HIRED MILKER 2 $1.98 $1.97 $2.15 $2.48 $2.05 $1.98
HOURLY PERQUISITES & TAXES / HIRED MILKER 1 $2.17 $3.21 $3.67 $4.09 $3.03 $3.12
HOURLY WAGE / HIRED MILKER 2 $13.66 $14.94 $15.51 $15.88 $14.64 $14.89
CASH WAGE / HIRED LABOR $3,675 $3,202 $3,121 $2,820 $3,144 $3,401
PERQUISITES / HIRED LABOR 1 $96 $298 $404 $408 $323 $286
TAXES / HIRED LABOR 2 $676 $531 $574 $595 $567 $583
PERQUISITES & TAXES / HIRED LABOR 1 $772 $829 $978 $1,003 $890 $868
TOTAL WAGE / HIRED LABOR 2 $4,447 $4,031 $4,098 $3,822 $4,035 $4,270HOURS / MONTH / HIRED LABOR 254 243 238 231 241 246HOURLY CASH WAGE / HIRED LABOR $14.46 $13.18 $13.12 $12.18 $13.05 $13.82
HOURLY PERQUISITES / HIRED LABOR 1 $0.38 $1.23 $1.70 $1.76 $1.34 $1.16
HOURLY TAXES / HIRED LABOR 2 $2.66 $2.19 $2.41 $2.57 $2.35 $2.37
HOURLY PERQUISTIES & TAXES / HIRED LABOR 1 $3.04 $3.41 $4.11 $4.33 $3.69 $3.53
HOURLY WAGE / HIRED LABOR 2 $17.50 $16.59 $17.23 $16.52 $16.74 $17.35
CASH WAGE / ALL HIRED $3,276 $2,905 $2,857 $2,672 $2,842 $3,038
TOTAL WAGE / ALL HIRED 2 $3,930 $3,681 $3,748 $3,611 $3,611 $3,830HOURLY CASH WAGE / ALL HIRED $12.83 $12.32 $12.39 $11.98 $12.18 $12.66
HOURLY WAGE / ALL HIRED 2 $15.39 $15.62 $16.25 $16.18 $15.47 $15.95
HOURS / COW / MONTH / ALL HIRED 2.01 2.10 1.82 2.05 2.04 1.86CASH COST / COW / MONTH / ALL HIRED $25.83 $25.92 $22.52 $24.50 $24.90 $23.57
COST / COW / MONTH / ALL HIRED 2 $30.98 $32.84 $29.54 $33.10 $31.63 $29.70
NUMBER COWS / HIRED MILKER 232 186 219 202 185 223NUMBER COWS / HIRED LABOR 280 283 302 237 298 306NUMBER COWS / ALL MILKERS & LABOR 3 127 112 127 108 114 129
MILK SOLD / PERSON / MONTH (LBS.) 3 201,069 252,123 241,826 186,520 217,369 256,130
REVENUE GENERATED / PERSON / MONTH 3 $49,989 $54,691 $54,337 $44,450 $48,695 $57,567
2 Includes Cash Wages, Perquisites, and Employment Taxes Paid by Employer3 Includes All Dairy Workers, Hired and Family
AVERAGES
Jersey Herds, Holstein 3X vs. 2X Milking, and All California Herd SizeLabor Comparisons 2014:
1 Includes Fair Market Value For Housing Supplied By Employer, Health Insurance, Meat, Etc. and Employment Taxes (FICA, Worker's Compensation,Unemployment Insurance) Paid by Employer
California Cost of Production Annual 2014 21

Market Milk Production (Grade A) Manufacturing Milk Production (Grade B)
Top California Counties Profile, 2014
Profile of Top Ten Dairy Counties, 2014
County Million Poundsof Milk
Numberof Dairies
Number of Cows
(Thousands)
Number of Cows
Per Farm
Gallons of MilkPer Cow/Per Day
Tulare 11,555 281 484 1,723 7.61Merced 6,460 228 276 1,212 7.46Kings 4,419 119 184 1,544 7.65Stanislaus 4,277 207 180 869 7.57Kern 4,096 51 167 3,281 7.81Fresno 2,842 79 117 1,480 7.74San Joaquin 2,460 113 103 911 7.61Madera 1,891 43 78 1,824 7.72San Bernardino 1,187 62 51 830 7.42Riverside 913 28 40 1,412 7.27
1,509 7.59(Average) (Average)
10-County Total 40,100 1,211 1,680
Percent of State Totals 97% 82% 94%
County(by rank)
Pounds ofMilk Produced in 2014
% Changefrom 2013
Tulare 11,525,431,684 2.06%
Merced 6,380,980,229 11.21%
Kings 4,415,641,581 4.48%
Stanislaus 4,251,633,179 1.42%
Kern 4,093,925,299 0.73%
Fresno 2,838,807,692 4.34%
San Joaquin 2,459,425,000 6.22%
Madera 1,885,857,128 6.59%
San Bernardino 1,187,165,693 -5.71%
Riverside 912,238,592 -1.69%
County (by rank)
Pounds ofMilk Produced in 2014
% Changefrom 2013
Merced 79,240,130 -81.82%
Humboldt 39,250,319 -4.90%
Tulare 29,642,746 4.64%
Stanislaus 25,168,216 -78.87%
Del Norte 7,631,037 -4.28%
22 California Cost of Production Annual 2014

Mailbox price is defined as the net price received by dairy producers for milk. The mailbox price includes all payments received for milk sold and deducts costs associated with marketing the milk. It makes no difference whether a California producer is shipping milk to a cooperative or a proprietary plant, the mailbox price will be comparable. The Department uses the same criteria to calculate the mailbox price that USDA uses to calculate mailbox prices for Federal Milk Marketing Orders. Total Receipts less Marketing Costs & Assessments = Mailbox Price Total Receipts: Adjusted Gross; Quality Payments; Component Premiums; Yield Premiums; Seasonal Bonuses; Monthly Distribution of Cooperative Earnings; and Direct Contracts Marketing Costs and Adjustments: Haul and Stop Charges; Cooperative Dues; Equity Deductions; Federal Assessments; State Assessments; Inspection Fees; and Lab Fees * Please note, annual “thirteenth checks” are not included in the mailbox price.
2014 Mailbox Milk Prices for Selected Reporting Areas in Federal Milk Orders & California
Reporting Areas Jan Feb March April May June July Aug Sept Oct Nov Dec
California $22.04 $22.67 $23.36 $23.13 $21.72 $21.60 $21.32 $22.27 $23.31 $22.66 $20.26 $17.64New England States $24.68 $25.94 $26.30 $26.41 $25.91 $24.92 $25.06 $25.94 $27.18 $25.80 $24.06 $22.84New York $23.64 $25.06 $25.58 $25.66 $25.16 $24.08 $24.27 $25.25 $26.39 $24.85 $23.00 $21.53Eastern Pennsylvania $23.75 $25.10 $25.48 $25.58 $25.12 $24.07 $24.20 $25.17 $26.25 $24.85 $22.99 $21.60Appalachian States $24.59 $25.41 $25.96 $25.78 $25.77 $24.68 $25.27 $26.46 $27.14 $26.11 $24.58 $23.68Southeast States $24.62 $25.69 $26.10 $25.83 $26.12 $24.85 $25.83 $27.29 $27.98 $26.79 $25.11 $24.48Southern Missouri $23.69 $24.57 $24.92 $24.64 $24.63 $23.66 $24.44 $25.77 $27.34 $26.44 $24.69 $22.84Florida $25.33 $26.77 $27.27 $27.13 $27.41 $25.78 $27.40 $28.67 $29.25 $28.10 $26.43 $25.98Western Pennsylvania $23.69 $25.20 $25.61 $25.77 $24.87 $23.70 $23.83 $24.89 $26.27 $25.24 $22.99 $21.36Ohio $23.68 $24.92 $25.24 $25.38 $24.45 $23.34 $23.61 $24.66 $25.83 $24.88 $23.00 $21.36Indiana $23.03 $24.22 $24.46 $24.51 $23.87 $22.61 $22.96 $24.31 $25.35 $24.31 $22.42 $20.51Michigan $22.94 $24.28 $24.62 $24.66 $23.90 $22.97 $23.08 $23.99 $25.50 $23.69 $22.04 $19.98Wisconsin $23.51 $25.31 $25.34 $25.91 $24.38 $22.91 $23.16 $23.96 $26.27 $25.76 $21.82 $20.92Minnesota $23.48 $25.48 $25.43 $26.06 $24.47 $22.85 $23.11 $23.98 $26.52 $25.91 $21.69 $20.24Iowa $23.84 $25.44 $25.75 $25.97 $24.83 $23.48 $23.76 $24.61 $26.22 $25.55 $23.10 $21.20Illinois $23.75 $25.50 $25.61 $25.81 $24.80 $23.33 $23.61 $24.63 $26.40 $26.00 $23.28 $20.97Corn Belt States $22.77 $24.24 $24.39 $24.51 $23.32 $21.84 $21.84 $22.59 $24.55 $23.88 $22.21 $19.50Western Texas $22.73 $24.31 $24.32 $24.42 $22.96 $21.43 $21.56 $22.37 $24.10 $23.65 $21.87 $18.80New Mexico $21.53 $22.90 $22.96 $22.94 $21.77 $20.25 $20.25 $21.10 $22.88 $22.59 $20.80 $18.09Northwest States $23.73 $24.63 $25.36 $24.97 $23.85 $23.29 $23.47 $24.38 $25.86 $24.04 $21.81 $19.53All Federal Order Areas $23.47 $24.91 $25.18 $25.33 $24.37 $23.11 $23.36 $24.29 $25.92 $24.88 $22.46 $20.83
*Mailbox milk prices for selected Milk Marketing Orders by month, 2014
2014 Mailbox Milk Prices
Dollars Per Hundredweight
U.S. Mailbox Milk Prices/Prices Paid to Producers
Average Prices Paid to Producers in CaliforniaFor All Bulk Milk (Grade A and Grade B), by Month, 2010-2014 1, 2
AnnualYear January February March April May June July August September October November December Average
2010 14.42 13.94 13.11 13.30 13.57 13.96 14.68 15.42 16.39 16.89 15.88 14.86 14.702011 15.67 17.96 18.40 17.89 18.11 20.31 20.18 20.27 18.98 18.22 18.91 17.38 18.522012 16.66 15.51 15.47 14.91 14.31 14.65 15.12 16.55 17.70 19.69 19.91 18.61 16.592013 17.90 17.80 17.30 18.22 18.25 17.82 17.53 18.12 18.71 19.41 20.03 20.77 18.492014 22.19 22.91 23.62 23.39 22.00 21.89 21.62 22.56 23.60 22.90 20.46 17.85 22.08
1 Prices are F.O.B. plant, at actual test.2 Includes in-state pool shipments and California milk shipped into Federal Milk Marketing Orders. Excludes bonuses and premiums.
AnnualYear January February March April May June July August September October November December Average
2010 14.44 13.92 13.15 13.28 13.57 13.99 14.70 15.41 16.34 16.86 15.92 14.91 14.712011 15.68 17.93 18.38 17.92 18.13 20.30 20.16 20.27 18.99 18.23 18.89 17.37 18.522012 16.65 15.51 15.47 14.90 14.30 14.64 15.11 16.53 17.67 19.67 19.89 18.60 16.582013 17.89 17.80 17.30 18.19 18.22 17.81 17.53 18.11 18.70 19.40 20.02 20.76 18.482014 22.18 22.90 23.61 23.38 21.99 21.89 21.63 22.55 23.59 22.89 20.45 17.85 22.08
1 Prices are F.O.B. plant, at actual test.2 Includes in-state pool shipments and California milk shipped into Federal Milk Marketing Orders. Excludes bonuses and premiums and exempt production.
AnnualYear January February March April May June July August September October November December Average
2010 14.14 14.20 12.31 13.52 13.63 13.31 14.46 15.72 17.21 17.52 15.13 14.01 14.602011 15.11 19.61 19.33 16.64 16.96 21.17 21.33 20.60 18.31 17.89 19.89 17.64 18.712012 16.90 15.64 15.84 15.38 15.27 16.37 17.06 18.77 20.28 22.36 21.78 19.15 17.902013 18.74 18.23 17.65 19.75 19.76 18.15 17.82 18.50 19.23 19.83 20.57 21.53 19.152014 23.76 23.95 25.06 24.66 23.04 22.42 20.89 22.79 25.82 25.78 22.11 17.74 23.17
1 Prices are F.O.B. plant, at actual test.
Dollars Per Hundredweight
Average Prices Paid Producers In CaliforniaFor Manufacturing Milk (Grade B), By Month, 2010-2014 1
Dollars Per Hundredweight
AVERAGE PRICES PAID PRODUCERSAverage Prices Paid Producers In California
For All Bulk Milk (Grade A and Grade B), By Month, 2010-2014 1 2
Dollars Per Hundredweight
Average Prices Paid Producers In CaliforniaFor Market Milk (Grade A), By Month, 2010-2014 1 2
California Annual Weighted Average Mailbox Milk Prices 2013: $18.24/cwt. 2014: $21.85/cwt. Percent Change from 2013: 19.8% Increase
California Cost of Production Annual 2014 23

Summary of Quota Transfers, 2014
California Grade A milk producers are paid based on a system of quota and non-quota prices (pool prices). The Quota Reform legislation in 1993 introduced a fixed price differential of $1.70/cwt. between “quota” and “overbase” prices which changed the method of determining pool prices.
Quota and its associated base have always been freely transferable on the open market and can move anywhere in the state. Quota selling prices are
1 The average ratio is the relation of total quota fat to total quota SNF
Effective No. of Sales1st of the No. of No. of Sales at Without Cows Total Quota Total Quota Average
Month Sellers Buyers 100% Low Avg. High Fat Transferred SNF Transferred Ratio 1
January 3 3 2 $415 $425 $445 1,160 2,696 2.33February 5 6 2 $430 $445 $450 2,856 6,929 2.43
March 3 3 1 $420 $440 $450 1,160 2,616 2.25April 4 3 4 $450 $460 $475 737 1,796 2.44May 2 3 1 $465 $483 $500 2,962 7,133 2.41June 1 2 1 $525 $525 $525 828 1,974 2.38July 3 5 3 $500 $519 $531 4,535 11,061 2.44
August 2 2 1 $525 $538 $550 112 275 2.45September 6 8 5 $500 $523 $550 10,076 24,616 2.44
October 3 3 1 $525 $525 $525 1,961 4,809 2.45November 3 5 3 $525 $525 $525 1,433 3,587 2.50December 6 7 4 $512 $522 $525 3,721 8,935 2.40
TOTAL 41 50 28 $483 $494 $504 31,543 76,426 2.42
Quota Summary
Average Total TotalNo. of No. of Sales at Sales Quota Fat Quota SNF
Year Sellers Buyers 100% Without Cows Transferred Transferred2005 65 79 48 $478 24,715 60,2432006 52 75 41 $501 26,107 63,2492007 77 93 70 $495 31,060 75,3672008 56 68 51 $534 40,425 98,6542009 105 109 84 $415 36,479 87,9782010 52 55 34 $422 17,801 43,6542011 40 55 31 $443 15,297 37,2832012 87 118 69 $441 49,852 122,5782013 86 104 54 $404 47,500 116,2302014 41 50 28 $494 31,543 76,426
Annual Summary of Quota Transfers, 2005-2014
quoted on a per pound of solids-not-fat basis per day. For 2014, statewide quota holdings were valued at about $1,103.7 billion.
Producers can sell market milk without owning any quota. In this case, however, they receive the overbase price. In 2014, approximately 56 percent of all market milk producers held quota.
24 California Cost of Production Annual 2014

CALIFORNIA DAIRY PRODUCER ASSESSMENT RATES
Milk Pooling Administration Fee: (.011 cents per hundredweight) - Funds used to administer the functions of the Milk Pooling Branch. Functions include: • Pool and distribute milk revenue • Establish the monthly quota and overbase prices • Administer the registration and transfer of quota holdings • Audit monthly reports of California plants to verify receipts and usage
Market Milk Administration Fee: (.008 cents per hundredweight on Grade A milk) - Funds used to administer the functions of the Dairy Marketing Branch. Functions include: • Establish the minimum farm price for milk • License all milk handlers in the State • Production and manufacturing cost audits • California dairy industry statistics
Manufacturing Milk Administration Fee: (.012 cents per hundredweight on Grade B milk) - Funds used for the same purpose as Market Milk Administration Fee above.
Dairy Council Fee (DCC): (Class 1 milk .015 cents per hundredweight, other milk .006 cents per hundredweight)- Funds used to administer the functions of the Dairy Council. This program’s function is to provide nutrition education materials that show the role of dairy products in a balanced diet.
California Milk Advisory Board Fee (CMAB): (Market milk, 10 cents per hundredweight) - Funds used to administer the functions of the California Milk Advisory Board. This program is involved in advertising, promotion and research of all dairy products.
California Manufacturing Milk Advisory Board Fee (CMMAB): (Manufacturing milk, 10 cents per hundredweight on Grade B milk). This program is similar to CMAB but does not promote fluid milk products because fluid milk products can-not contain Grade B milk.
Milk and Dairy Foods Safety Fee: (.001 cents per hundredweight) - Funds used for the testing of milk fat, solids not fat and the weighing and sampling of market milk delivered to handlers by producers.
National Dairy Promotion and Research Board (NDPRB): (.05 cents per hundredweight on all milk) - Funds used to administer the functions of the NDPRB, a federal program. This program conducts promotions and research activities on behalf of all United States dairy farmers. (not shown in table above)
POOL ADMIN MKT. MILK MFG. MILK DAIRY COUNCIL MKT ORDER MKT ORDER MILK & DAIRYFEE ADMIN. FEE ADMIN. FEE CLASS 1% CLASS 1 OTHER MILK (MKT) (MFG) FOOD
RATE (CWT) RATE (CWT) RATE (CWT) QUOTA FAT QUOTA SNF RATE (CWT) RATE (CWT) RATE (CWT) RATE (CWT) SAFETY (CWT)Jan 0.011 0.008 0.012 36.15% 69.38% 0.0150 0.0060 0.1000 0.1000 0.001Feb 0.011 0.008 0.012 36.32% 70.06% 0.0150 0.0060 0.1000 0.1000 0.001Mar 0.011 0.008 0.012 35.98% 67.73% 0.0150 0.0060 0.1000 0.1000 0.001Apr 0.011 0.008 0.012 37.36% 69.03% 0.0150 0.0060 0.1000 0.1000 0.001May 0.011 0.008 0.012 36.14% 67.32% 0.0150 0.0060 0.1000 0.1000 0.001June 0.011 0.008 0.012 37.25% 65.76% 0.0150 0.0060 0.1000 0.1000 0.001July 0.011 0.008 0.012 38.39% 65.68% 0.0150 0.0060 0.1000 0.1000 0.001Aug 0.011 0.008 0.012 37.57% 67.59% 0.0150 0.0060 0.1000 0.1000 0.001Sept 0.011 0.000 0.000 37.79% 70.17% 0.0150 0.0060 0.1000 0.1000 0.001Oct 0.011 0.000 0.000 38.52% 72.77% 0.0150 0.0060 0.1000 0.1000 0.001Nov 0.011 0.000 0.000 37.21% 69.62% 0.0150 0.0060 0.1000 0.1000 0.001Dec 0.011 0.000 0.000 38.94% 70.50% 0.0150 0.0060 0.1000 0.1000 0.001
2014
► Assessment Rates
Assessment Rates
California Cost of Production Annual 2014 25

Glossary of Terms
The Production Cost Comparison (Cost Comp) is a comprehensive report pertaining solely to the dairy enterprise. This information includes all costs and activities related only to milking and dry (total) cows. It does not include information relating to calf raising, heifer raising and other farming enterprises. The Cost Comp is designed to provide a constructive tool for better decision–making and to closely reflect the actual cost of producing milk. All costs are based on a per cow/per month basis, unless otherwise noted.Number of Herds – number of herds in each size category.
Feed Costs - All feed costs attributed to the dairy enterprise.a) Dry Roughage – All forages low in moisture content
and high in fiber (e.g.) alfalfa hay, oat hay and almond hulls.
b) Wet Feed and Wet Roughage – All forages high in moisture content (e.g.) Wet Feed: brewers’ malt, wet whey, wet citrus and cull vegetables. Wet Roughage: haylage, earlage, corn silage, and green chop.
c) Concentrates – Products relatively high in energy and low in fiber, including grains, milled by-products, and protein product (e.g.) rolled corn or barley, whole cottonseed, dried distillers grain and custom premixes.
d) Mineral & Supplements – Micro or macro minerals and any vitamins and feed additives that improve feed efficiency (e.g.) molasses and bicarbonate.
e) Pasture – Includes any grazing on land that contains pasture grasses or legumes.
Total Feed Costs – Total of above line items, (a) through (e)
Total Feed Costs/Cwt. - Total Feed cost per cow, divided by the total monthly hundredweight of milk shipped per cow.
Total Hired Labor – Comprises all paid labor attributed to the dairy enterprise. • Salaried and hourly labor total includes gross wages
earned by hired milkers, pushers, feeders, and outside workers plus employer taxes and perquisites (e.g.) Employer Taxes: workers compensation insurance, unemployment insurance, and social security; Perquisites: house, utilities, health insurance, union dues, and 401K or retirement plans..
Total Hired Labor Costs/Cwt. - Total labor cost per cow, divided by the total monthly hundredweight of milk shipped per cow.
Total Herd Replacement – A twelve-month rolling average of the number and value of cows entering the herd, minus the total receipts of cows culled and dead, adjusted for the increase or decrease in herd inventory.
Total Replacement Costs/Cwt. - Total herd replacement cost per cow, divided by the total monthly hundredweight of milk shipped per cow.
Operating Costsa) Utilities – Includes electricity, natural gas, garbage,
telephone, water, etc.b) Supplies – Includes products needed for producing milk
(e.g.) soaps, iodine, hoses, office supplies, A.I. expenses, etc.
c) Veterinary and Medicine – All costs for veterinary work, medicine and supplies, including rBST.
d) Outside Services – Hired services (e.g.) accountant, nutritionist, hoof trimmer, DHIA or private testing, etc.
e) Repairs and Maintenance – All repairs and maintenance of equipment and structures used by the dairy enterprise (e.g.) milking parlor, free-stalls, corrals, feedwagons, etc.
f ) Miscellaneous – Any other operating costs not covered above (e.g.) County or state permits, regulatory fees, branding fees, subscriptions, producer association
fees, etc.g) Bedding & Manure Haul – Cost incurred to scrape
corrals and haul manure, may include any dirt or filler to maintain corrals and free-stalls.
h) Fuel & Oil – Fuel and oil used by the dairy enterprise. i) Interest – Interest expense paid on outstanding short
term loans for operating costs.j) Lease Expense – Expense for leasing dairy facility.k) Depreciation – Straight–line depreciation on any owned
equipment or buildings used by the dairy enterprise, less a salvage value.
l) Taxes & Insurance – Tax expense due on owned real and personal property. Insurance for public liability, property damage, fires and storm coverage.
Total Operating Costs– Total of above line items, (a) through (l).
Total Operating Costs/Cwt. - Total operating cost per cow, divided by the total monthly hundredweight of milk shipped per cow.
Milk Marketing Costs – Hauling charges, mandatory assessments and miscellaneous deductions.a) Hauling – Fees paid to haul milk from ranch to plant,
plus any stop charges.b) State Assessments – Dairy Marketing, Milk Pooling, Milk
& Dairy Foods Control, Dairy Council and Milk Advisory Board, plus county health inspections.
c) Federal Assessments and Misc. Deductions – National Dairy Promotion and any permits or third party component testing.
► Appendix A
Appendix A
26 California Cost of Production Annual 2014

Glossary of Terms - (Continued)
Total Milk Marketing Cost/Cwt. – Total marketing cost per cow, divided by the total monthly hundredweight of milk shipped per cow.
Total Cost/Cow/Month – Total of above line items, divided by total cows.
Total Cost /Cwt. – Total costs, divided by the total monthly hundredweight of milk shipped per cow.
Milk Production Dataa) Milk Sold/Total Cow/Month (cwt) – Total hundredweight
of milk shipped for the month, divided by total cows. b) Lbs. Milk Sold/Milk Cow/Day – Total pounds of milk
shipped, divided by number of milk cows.c) Gross Milk Receipts (cwt) – Blend price based on
California’s Pool Price Announcement, minus regional quota adjuster (RQA), plus any transportation allowances. It does not include any quality or yield bonuses.
d) Mailbox Price ($/cwt) – Total receipts (receipts includes gross dollars, quality payments, component premiums, yield premiums, seasonal bonuses, monthly distribution of cooperative earnings) less marketing costs and assessments.
f ) Income Over Feed Cost (cwt.) - Mailbox price less total feed cost.
g) Fat Test % – Total pounds of fat shipped, divided by total pounds of milk shipped for the month.
h) SNF Test % – Total pounds of solids–not–fat shipped, divided by total pounds of milk shipped for the month.
i) Fat Sold/Milk Cow/Month (lb.) – Total pounds of fat shipped, divided by total milk cows.
j) SNF Sold/Milk Cow/Month (lb.) – Total pounds of solids–not–fat shipped, divided by total milk cows.
k) Percent Quota – Total pounds of quota solids-not-fatproduced divided by total pounds of solids-not-fat shipped.
Related Dataa) Percent Dry Cows – Total number of dry cows, divided
by total cows.b) Yearly Cull Rate – Twelve–month total of cows leaving
the herd, divided by total cows.c) Misc. Income (cwt.) - Total dollars recieved for drop bull
calves divided by total cwts. of milk sold.d) Milk Cow Alfalfa Hay Price ($/ton) – Average blend price
of alfalfa hay fed to milking cows.
e) Grain, Minerals & Supplements ($/ton) – Total grain, mineral/ supplement costs, divided by total tons fed to milking cows.
f ) Grain Minerals & Supplements (lb./mc day) – Total pounds of grain, minerals and supplements fed, divided by total milking cows, divided by the number of days in month.
g) Milkers ($/hr) – Average hourly wage received by milkers, plus employer taxes and perquisites.
h) Total labor ($/hr) – Average hourly wage received by all hired employees, plus employer taxes and perquisites.
i) Milk Cow Feed Costs per Day – Total feed costs for milking cows, divided by number of milking cows, divided by the number of days in the month.
j) Milk Cow Feed Costs per Cwt. – Total feed costs for milking cows, divided by total hundredweight of milk shipped.
k) Milk Cows – Average number of lactating cows in herds represented by COP survey.
l) Total Cows – Average number of lactating and dry cows in herds represented by COP survey.
Appendix A - Continued
California Cost of Production Annual 2014 27

California Department of Food and AgricultureDairy Marketing Branch 1220 N StreetSacramento, CA 95814-5621 www.cdfa.ca.gov/dairy
First ClassU.S. Postage
PAIDPermit No. 81
Sacramento, CA