The Scientific Method Aprende Middle School 6 th Grade Science.
24
The Scientific Method Aprende Middle School 6 th Grade Science
-
Upload
dwight-golden -
Category
Documents
-
view
214 -
download
1
Transcript of The Scientific Method Aprende Middle School 6 th Grade Science.

The Scientific MethodAprende Middle School6th Grade Science

What is the Scientific Method?
Scientific Method: A way to solve problems in an
orderly, logical way.• The Scientific Method is a process that
is used to find answers to questions about the world around us. We don’t just use it in Science class – we use it
everyday in almost everything we do – without thinking about it.

Is there only one Scientific Method?
• No, there are several versions of the Scientific Method. Some have a few steps and some have more steps.• All versions begin with the same thing:
The identification of a problem or a question based on observations of the
world around us.

Be Curious!
• Keep your eyes wide open and watch for the unusual.
• Wonder about everything.• Don’t take anything for granted.• Constantly ask questions such as:
• “What will happen?”• “Why is this happening?”• What can I learn from this?”• “How can I improve something?”• “How can this help me in real life?”
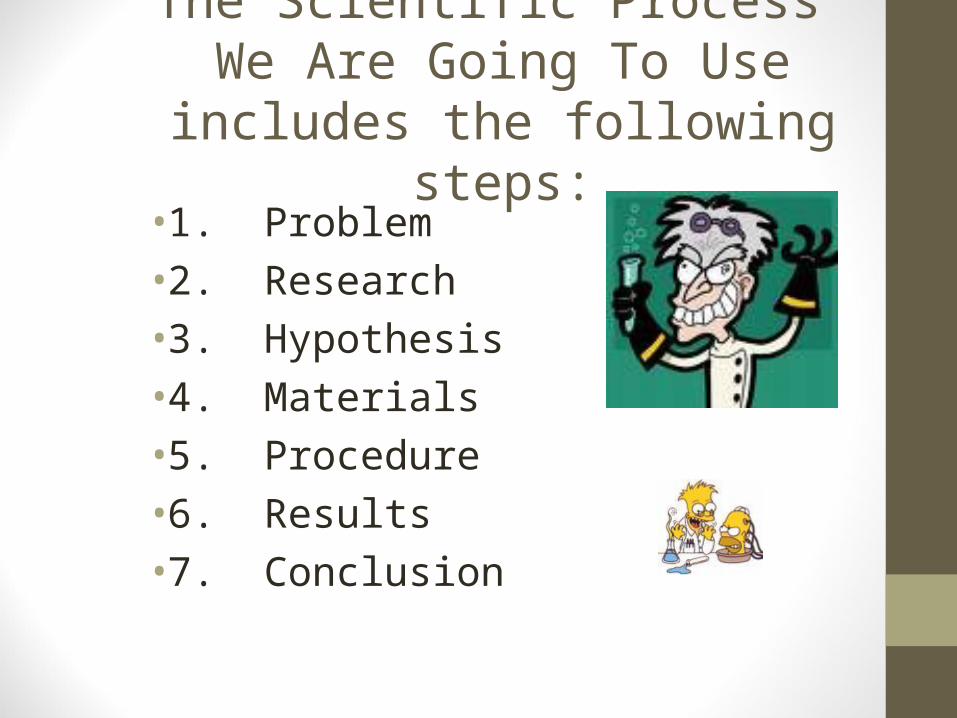
The Scientific Process We Are Going To Use includes the
following steps:• 1. Problem• 2. Research• 3. Hypothesis• 4. Materials• 5. Procedure• 6. Results• 7. Conclusion

Scientific Method: A way to solve problems in an orderly, logical
way.7 Steps: 1. Problem – what are we solving?2. Research – background info.3. Hypothesis – educated guess4. Materials – supplies used5. Procedure – steps to solving problem6. Results – what happened7. Conclusion – stating the outcome

Problem
• Identify a problem or a question based on observations of the world around you.
• What do you want to find out?• What do you want to solve?

Research
• Facts about the subject; background information that you have read, discussed or have prior knowledge about.

Hypothesis
• Educated guess.• What you think will happen and why.• Must be able to be tested by an experiment.• Need evidence of research.

Materials
• Detailed list of all the items you need to perform your experiment.• 1 ¾ liter water – not some water• 4 pieces of 8 ½” by 11” plain white
computer paper – not paper• Be organized. • Gather all your materials before your start.

What could be improved on this list?
• Aluminum foil• Water• Paper• 1 box Toothpicks• 8 Rubber bands• 2 glasses
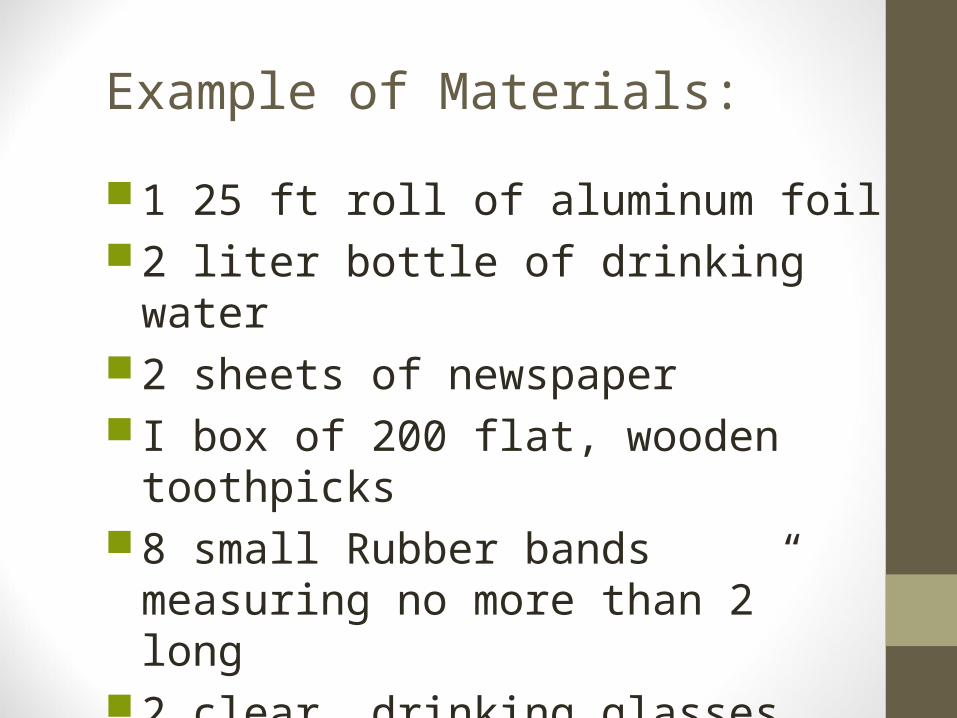
Example of Materials:
1 25 ft roll of aluminum foil 2 liter bottle of drinking water 2 sheets of newspaper I box of 200 flat, wooden toothpicks 8 small Rubber bands measuring no
more than 2” long 2 clear, drinking glasses able to hold at
least one liter of water

Procedure• Design an experiment to test your
hypothesis.• Your experiment should be carefully
planned and controlled.• Manage all the variables except one – only
one factor being tested should vary.• Exact, step-by-step instructions so that
someone else could do your experiment exactly the same way.
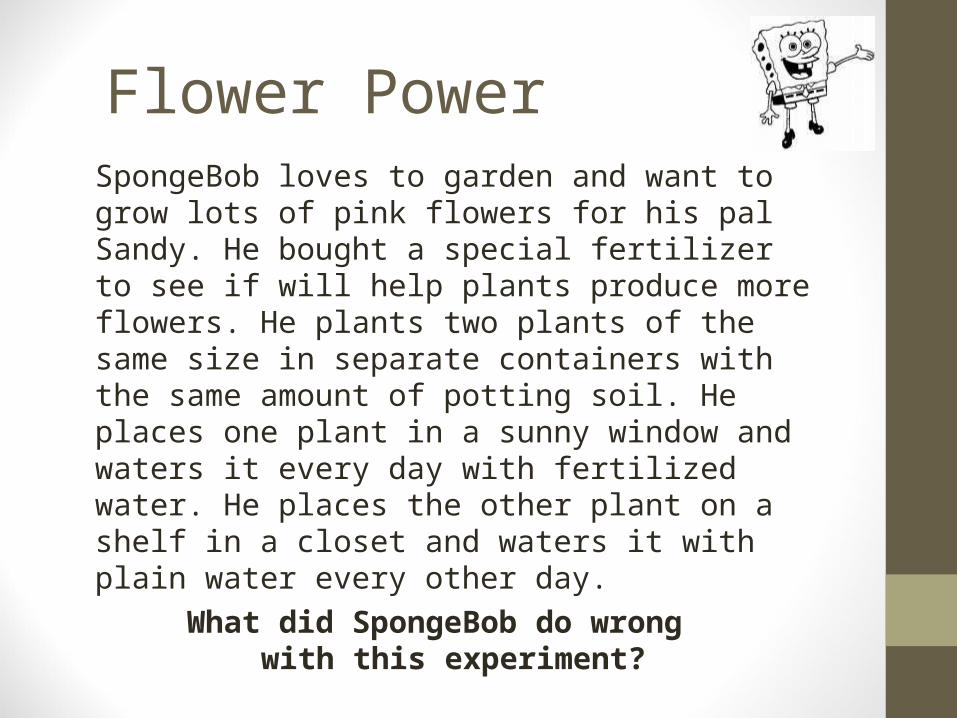
Flower PowerSpongeBob loves to garden and want to grow lots of pink flowers for his pal Sandy. He bought a special fertilizer to see if will help plants produce more flowers. He plants two plants of the same size in separate containers with the same amount of potting soil. He places one plant in a sunny window and waters it every day with fertilized water. He places the other plant on a shelf in a closet and waters it with plain water every other day.
What did SpongeBob do wrong with this experiment?

Flower Power• Too many things are different!• In order to test the fertilizer correctly, both plants should have
been placed in the sunny window and watered every day.• The only difference should be that one plant is watered with
plain water and one plant is watered with the fertilizer water.

Results
• Observe the experiment and organize the results.
• This is the data, or facts and information, collected during your experiment.
• Summarize and record data in an organized fashion.
• Use charts, graphs, and pictures.• No explanations, only observations.

Graphs
• Provide information in pictures.• Organize the data so it can be analyzed.• Make it easier to quickly understand
relationships in the data.
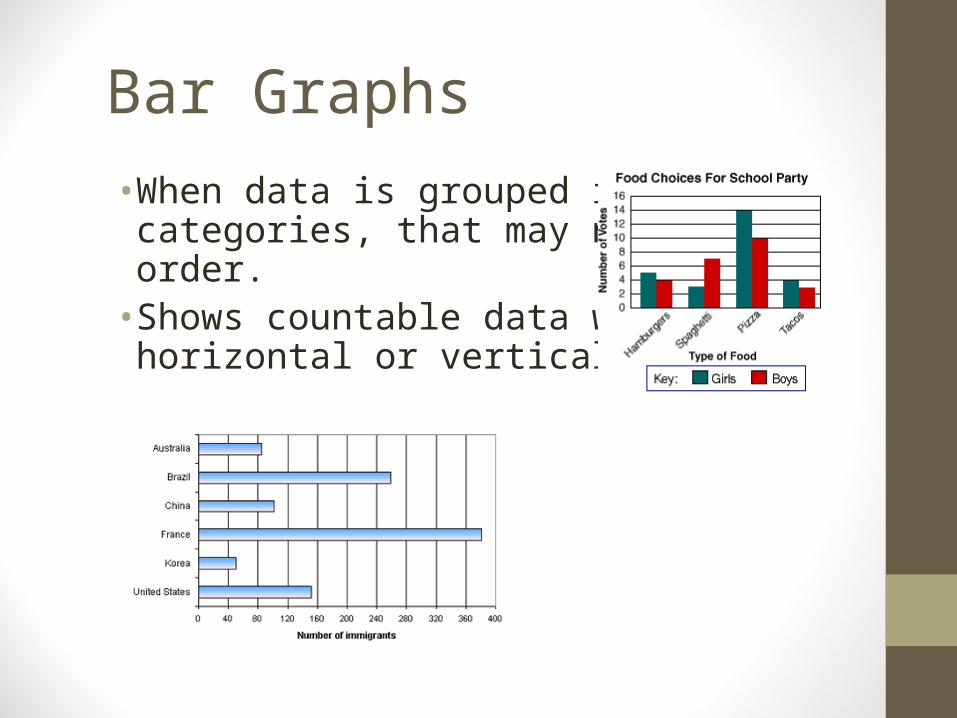
Bar Graphs
• When data is grouped in categories, that may not be in order.
• Shows countable data with horizontal or vertical bars.

Circle or Pie Graphs • Compares parts to the whole.• Shows how the parts of data are related to the whole and to
each other.

Line Graphs
• Show patterns of ordered data over time.• Shows how data will change over time.

Conclusion• A statement of how the results of your experiment relate to your
hypothesis. Answer to your problem.• Repeat your original hypothesis. Do the results support your
hypothesis?• Explanations from analyzing and reviewing your data.• Think logically and provide evidence for your conclusion. No meaning
without evidence.• Did the experiment go as planned? Were there any unplanned
variables?• How does your experiment relate to real life?
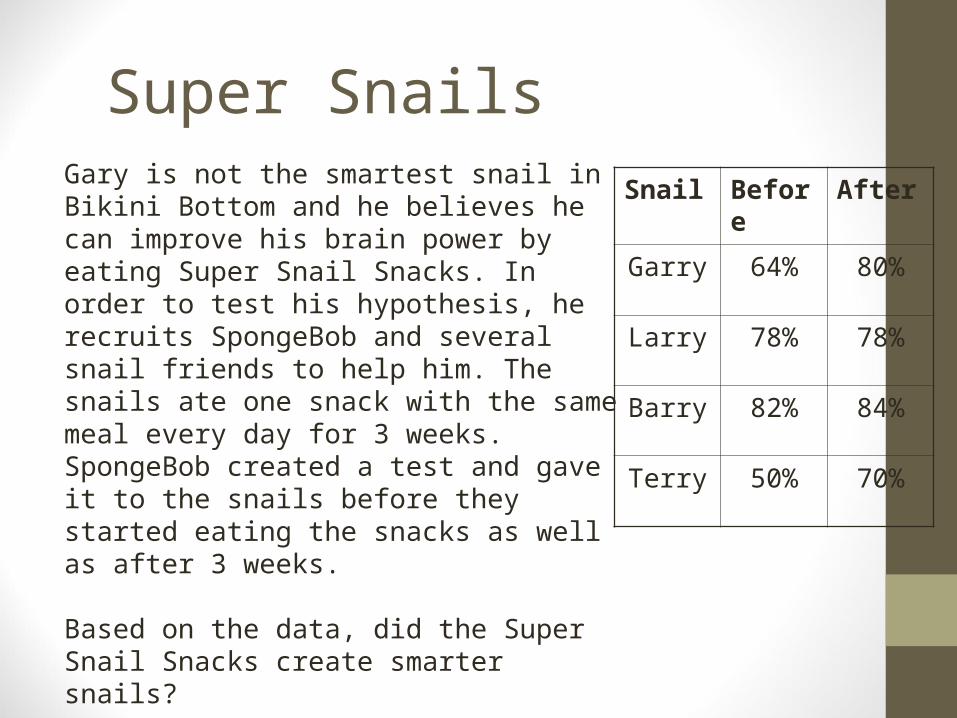
Super SnailsGary is not the smartest snail in Bikini Bottom and he believes he can improve his brain power by eating Super Snail Snacks. In order to test his hypothesis, he recruits SpongeBob and several snail friends to help him. The snails ate one snack with the same meal every day for 3 weeks. SpongeBob created a test and gave it to the snails before they started eating the snacks as well as after 3 weeks.
Based on the data, did the Super Snail Snacks create smarter snails?
Snail Before After
Garry 64% 80%
Larry 78% 78%
Barry 82% 84%
Terry 50% 70%
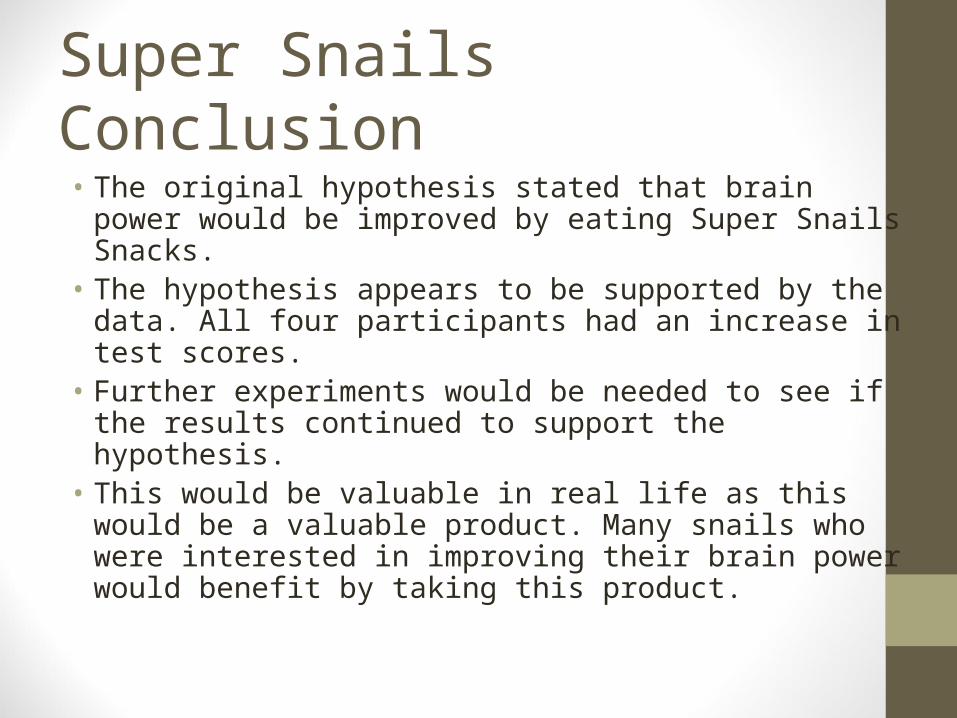
Super Snails Conclusion• The original hypothesis stated that brain power would be improved
by eating Super Snails Snacks. • The hypothesis appears to be supported by the data. All four
participants had an increase in test scores.• Further experiments would be needed to see if the results continued
to support the hypothesis.• This would be valuable in real life as this would be a valuable
product. Many snails who were interested in improving their brain power would benefit by taking this product.