THE ROLE OF POLICIES AND INSTITUTIONS FOR GOOD LABOUR MARKET PERFORMANCE IBM Chair, Labour Market...
52
THE ROLE OF POLICIES AND INSTITUTIONS FOR GOOD LABOUR MARKET PERFORMANCE IBM Chair, Labour Market Course 20-24 November, Milan Stefano Scarpetta Deputy Director for Employment, Labour and Social Affairs [email protected]
-
Upload
logan-webster -
Category
Documents
-
view
213 -
download
0
Transcript of THE ROLE OF POLICIES AND INSTITUTIONS FOR GOOD LABOUR MARKET PERFORMANCE IBM Chair, Labour Market...

THE ROLE OF POLICIES AND
INSTITUTIONS FOR GOOD LABOUR
MARKET PERFORMANCE
IBM Chair, Labour Market Course 20-24 November, Milan
Stefano ScarpettaDeputy Director for Employment, Labour and Social Affairs

Stefano Scarpetta, IBM Chair, Labour Market Course
• Lecture 1 (Tuesday): Economic growth and labour market – Economic growth across countries and over time– The role of labour market for promoting economic growth and the distribution of its
benefits– From an aggregate to a sectoral and firm-level perspective: the importance of labour
reallocation for productivity and output growth
• Lecture 2 (Wednesday): The role of policies and institutions for structural labour market outcomes
– Key policy and institutions affecting labour market outcomes– A model and an empirical analysis to assess the role of policy and institutions for LM
outcomes and their interactions
• Lecture 3 (Thursday): The role of structural policies and institutions for labour market resilience and resource allocation
– The role of policy and institutions for LM resilience– From a static to dynamics analysis of the labour market: job and worker flows,, effects
on productivity and workers
2
Overview of the course

Stefano Scarpetta, IBM Chair, Labour Market Course
• Familiarise students with the role of policies and institutions for good labour market performance over the business cycle
• Show how simple descriptive statistics and econometric analysis can be used to provide evidence-based policy assessments
• Show what can be learnt from making cross-country comparisons
3
Course objectives

Stefano Scarpetta, IBM Chair, Labour Market Course
• Born out of the Organisation for European Economic Cooperation (OEEC) which was set up after WWII to coordinate the Marshall plan
• Transformed into Organisation for Economic Cooperation and Development (OECD) in 1961 to promote policies for development (16 EUR, CAN + USA)
• Provides a forum in which governments work together to share experiences and seek solutions to common problems– Benchmarking (construction of comparable data), analysis &
policy advice
4
What is the OECD?

Stefano Scarpetta, IBM Chair, Labour Market Course
• Currently 34 full member countries, incl. CHL, MEX & TUR– Russia in accession process
• Enhanced engagement with major emerging economies: – BRA, CHN, IDN & IND
• Working relationships with over 70 developing and transition economies
• Policies to promote economic (“green growth”); boost employment ; raise living standards (“better lives initiative”); maintain financial stability; econ. dev. in other countries
5
From “rich-men’s club” to organisation with increasingly global reach

6
Lecture 1: Economic growth and the labour market– Economic growth across
countries and over time– The role of labour market for
promoting economic growth and the distribution of its benefits
– The role of labour reallocation for productivity and output growth
Stefano Scarpetta, IBM Chair, Labour Market Course

Stefano Scarpetta, IBM Chair, Labour Market Course 7
• Large cross-country differences in income per capita and output per worker
• Globally, these differences tend to persist over time (even though subsets of countries did converge)
• Overall cross-country dispersion or inequality has increased over time
• Distribution tends to be bi-modal or even tri-modal• But the dispersion has actually declined if
population size is taken into account (China, India)
Stylized facts

Stefano Scarpetta, IBM Chair, Labour Market Course 8
• Differences in incomes p.c. reflect starting conditions and, especially, differences in GDP p.c. growth rateso Very small differences in growth rates for long periods of time
can have dramatic implications for income p.c. levelso In fact economic historians agree that most of current differences
in levels depend on differences in growth rates over past 2 centuries
o And despite large differences in starting conditions after the 2nd WW sustained growth rates have allowed convergence in levels for most founding OECD countries and even for some non-OECD African and Asian countries
• Still, globally there are large cross-country differences in growth rates, and globally these have tended to become larger
Stylized facts

9
• Given cross-country differences in income levels and growth rates key issue is that of convergenceo Are growth patterns such that there is
convergence in income p.c. levels?o If so, is this a generalised phenomenon or is
it limited to clubs of countries?
• Useful concepts here are absolute, conditional and club convergence
Stefano Scarpetta, IBM Chair, Labour Market Course
Stylized facts
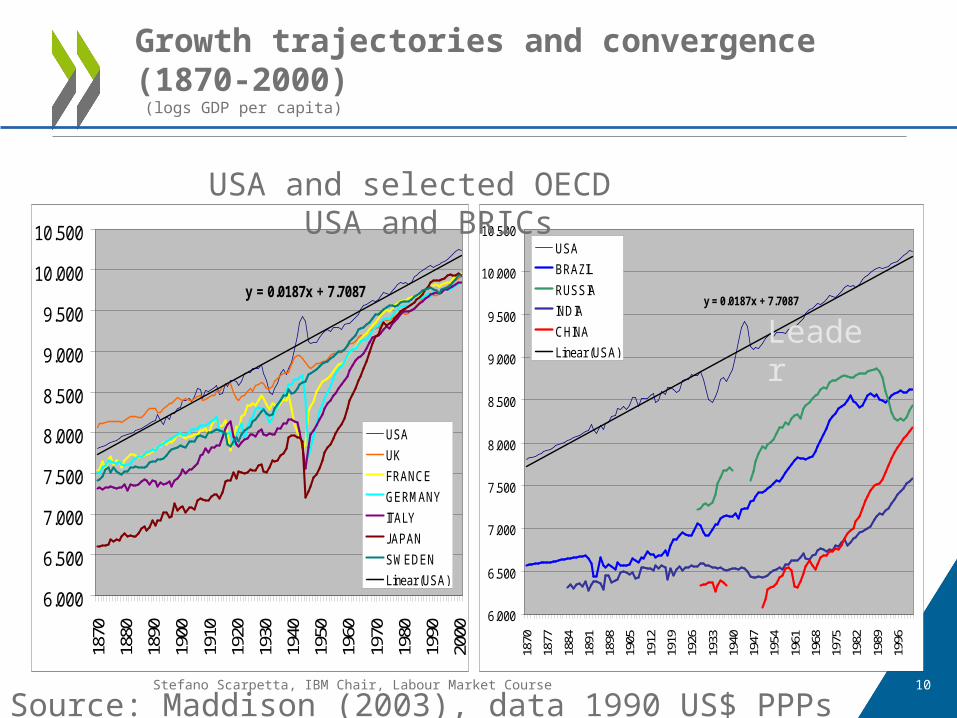
Stefano Scarpetta, IBM Chair, Labour Market Course 10
Growth trajectories and convergence (1870-2000) (logs GDP per capita)
y = 0.0187x + 7.7087
6.000
6.500
7.000
7.500
8.000
8.500
9.000
9.500
10.000
10.500
1870
1880
1890
1900
1910
1920
1930
1940
1950
1960
1970
1980
1990
2000
USA
UK
FRANCE
GERMANY
ITALY
JAPAN
SWEDEN
Linear (USA)
y = 0.0187x + 7.7087
6.000
6.500
7.000
7.500
8.000
8.500
9.000
9.500
10.000
10.500
1870
1877
1884
1891
1898
1905
1912
1919
1926
1933
1940
1947
1954
1961
1968
1975
1982
1989
1996
USA
BRAZIL
RUSSIA
INDIA
CHINA
Linear (USA)
USA and selected OECD USA and BRICs
Leader
Source: Maddison (2003), data 1990 US$ PPPs

11
Convergence patterns and clubs (1962-2008)
Stefano Scarpetta, IBM Chair, Labour Market Course
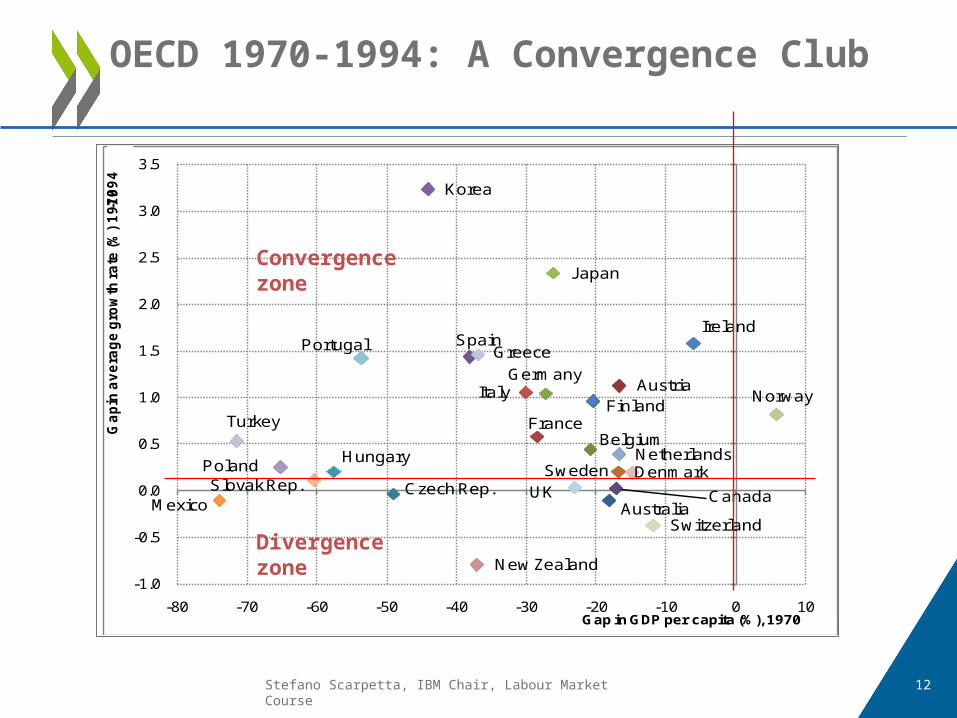
12Stefano Scarpetta, IBM Chair, Labour Market Course
OECD 1970-1994: A Convergence Club
Australia
Austria
Belgium
CanadaCzech Rep.Denmark
FinlandFrance
Germany
Greece
Hungary
Ireland
Italy
Japan
Korea
Mexico
Netherlands
New Zealand
Norway
Poland
Portugal
Slovak Rep.
Spain
Sweden
Switzerland
Turkey
UK
-1.0
-0.5
0.0
0.5
1.0
1.5
2.0
2.5
3.0
3.5
-80 -70 -60 -50 -40 -30 -20 -10 0 10Gap in GDP per capita (%), 1970
Ga
pin
av
era
ge
gro
wth
ra
te (%
) 1
97
0-1
99
4
Convergence zone
Divergence zone

13Stefano Scarpetta, IBM Chair, Labour Market Course
OECD convergence 1995-2006
Australia
Austria
Belgium
Canada
Czech Republic
Denmark
Finland
France
Germany
Greece
Hungary
Iceland
Ireland
Italy Japan
Korea
Mexico
NetherlandsNew Zealand
Norway
Poland
Portugal
Slovak Rep.
Spain Sweden
Switzerland
Turkey
UK
-1.5
-0.5
0.5
1.5
2.5
3.5
-80 -70 -60 -50 -40 -30 -20 -10 0 10Gap in GDP per capita (%), 1994
Ga
pin
av
era
ge
gro
wth
ra
te (%
) 1
99
5-2
00
6
Divergence zone
Convergence zone

14
GDP per capita
Labour productivity(output per hour worked)
Labour utilisation(hours worked per capita)
GDP per capita
Labour productivity(output per hour worked)
Labour utilisation(hours worked per capita)
Capital deepening (capital per
hour worked)
Multi -factorproductivity
Quality of capital
(vintage
and asset
composition )
Quality of labour
(skill mix )
Pure technicalprogress
GDP per capita
Labour productivity(output per hour worked)
Labour utilisation(hours worked per capita)
Hours workedper worker
Capital deepening (capital per
hour worked)
Multi -factorproductivity
Structural unemployment
rate
Labourforce
participation
Quality of capital
(vintage
and asset
composition )
Quality of labour
(skill mix )
Pure
technicalprogress
Employment rate
Determinants of GDP p.c. An overview
Stefano Scarpetta, IBM Chair, Labour Market Course
Industries Industries
Firms Firms
Allocation process

Stefano Scarpetta, IBM Chair, Labour Market Course 15
Growth decompositions
Simple decompositions of GDP p.c. (GDPpc):
Can also be expressed relative to benchmark country (0) :
pop. Active x part. force Lab. x rate) unempl. -(1 x p.w. Hours x prod.Hourly )1(
pop. Active x particip. forceLabour x rate Empl. x p.w. Hours x prod.Hourly
pop. Active x rate Employment x p.w. Hours x prod.Hourly
nutilisatioLabour ty x productiviHourly
6415
6415
6415
6415
6415
6415
Pop
Pop
Pop
LFu
E
H
H
GDPGDPpc
Pop
Pop
Pop
LF
LF
E
E
H
H
GDPGDPpc
Pop
Pop
Pop
E
E
H
H
GDPGDPpc
LULPHPop
H
H
GDP
Pop
GDPGDPpc
1GDPpc
GDPpc0
(1LPH
LPH0
) (1LU
LU0
)(LPH
LPH0
)

Stefano Scarpetta, IBM Chair, Labour Market Course 16
Growth decompositions
• Decomposition are mechanical but help to e.g.:– highlight proximate sources of cross-
country differences in GDP (productivity, hours worked, unemployment, participation and demographics)
– perform simple projections/simulations of future GDP scenarios (e.g. economic baseline for models), with assumptions/projections for each of the elements

Stefano Scarpetta, IBM Chair, Labour Market Course 17
Cross-country differences in GDP per capita GDP and productivity levels in US$ PPP, 2007Percentage gaps with respect to United States
Gap in GDP per capita = Gap in labour utilisation+Gap in GDP per hour worked

Stefano Scarpetta, IBM Chair, Labour Market Course 18
Simple growth decomposition
• A similar simple decomposition can of course be done for GDPpc growth rates (denoted with a hat):
where the cross term(s) can usually be ignored (and, hence, the ln operator can be used to derive growth rates).
• The next figures show that the main driver of
growth is labour productivity.
LULPHLULPHLULPHGDPpc

19
Growth in GDP per capita = Growth in labour utilisation
Stefano Scarpetta, IBM Chair, Labour Market Course
+Growth in GDP per hour worked
What drives cross-country differences in GDP per capita growth ?Total economy, percentage change at annual rate, 1997-2007

Stefano Scarpetta, IBM Chair, Labour Market Course
• In 2007, the ER reached record high (67%) and the UR stood at a 25 year low (5.6%). – A supportive macro-economic environment– Structural reforms in product and labour
markets– Increased labour force participation of women
and older workers
• By 2007, the key policy priority had shifted from combating UR to removing barriers to LFP – Limit the adverse consequences of population
ageing– Alleviate skill shortages
20
Labour market performance before the crisis
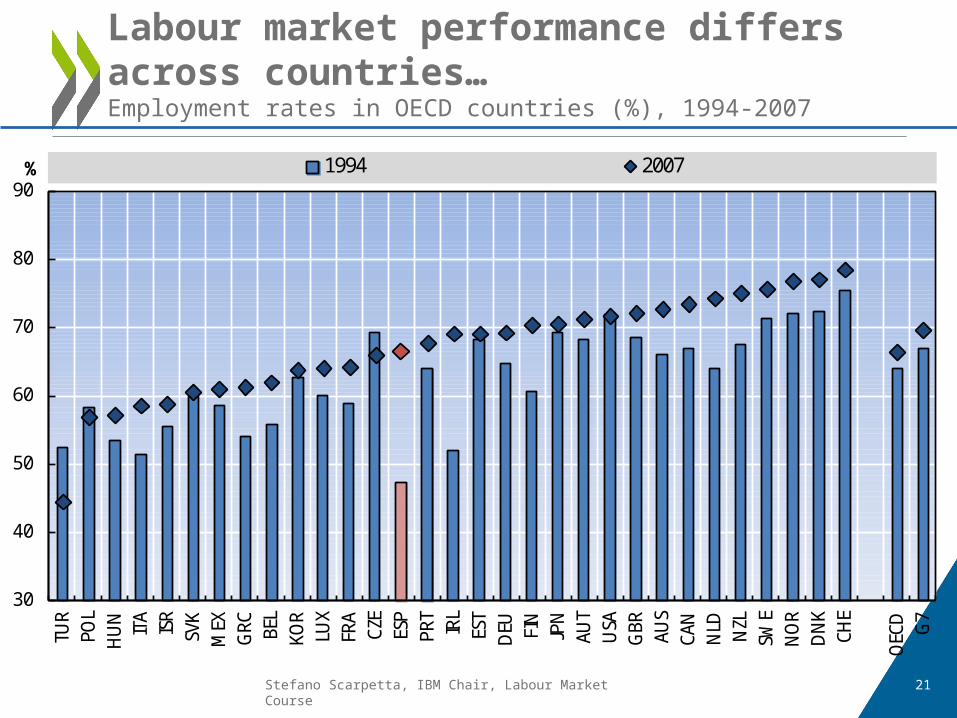
Stefano Scarpetta, IBM Chair, Labour Market Course 21
Labour market performance differs across countries…Employment rates in OECD countries (%), 1994-2007
30
40
50
60
70
80
90
TUR
POL
HU
NIT
AIS
RSV
KM
EXG
RC BEL
KOR
LUX
FRA
CZE
ESP
PRT
IRL
EST
DEU FI
NJP
NAU
TU
SAG
BR AUS
CAN
NLD NZL
SWE
NO
RD
NK
CHE
OEC
D G7
% 1994 2007

Stefano Scarpetta, IBM Chair, Labour Market Course 22
Large hike in unemployment rates, 2007 Q4 to 2011 Q3
Unemployment rate before the crisis, at its peak and its latest value* in percentage of total labour force, quarterly data
Countries are shown in ascending order by the unemployment rate at its peak.* Trough (peak) dates are defined as the start of the longest spell of consecutive increase (decrease) of the quarterly OECD harmonised unemployment rates since 2006 Q1. Source: OECD calculations based on OECD Main Economic Indicators Database.
Norway
Korea
Netherl
ands
Switzerla
ndAus
triaJa
pan
Luxe
mbourg
Austra
lia
Mexico
New Zea
land
Denmark
Czech
Rep.Isr
ael
German
y
Sloven
ia
United
Kingdo
m
Belgium
Canad
a
Icelan
dIta
ly
Finlan
d
Sweden
Poland
United
States
France
Chile
Hunga
ry
Portug
al
Turkey
Irelan
d
Slovak
Rep.
Greece
Estonia
Spain
OECD G7
Euro ar
eaEU-27
0
2
4
6
8
10
12
14
16
18
20
22
24Pre-cris trough Peak Latest

Stefano Scarpetta, IBM Chair, Labour Market Course 23
Youth have been hit especially hard during the crisisYouth (15-24/16-24) unemployment rate before the crisis, at its peak and its latest value* in percentage of youth
labour force, quarterly data
Countries are shown in ascending order by the youth unemployment rate at its peak.* Trough (peak) dates are defined as the start of the longest spell of consecutive increase (decrease) of the quarterly OECD harmonised unemployment rates since 2006 Q1. Source: OECD calculations based on the Short-term indicators from Eurostat and national labour force surveys.
0
5
10
15
20
25
30
35
40
45
50
55Pre-crisis trough Peak Latest
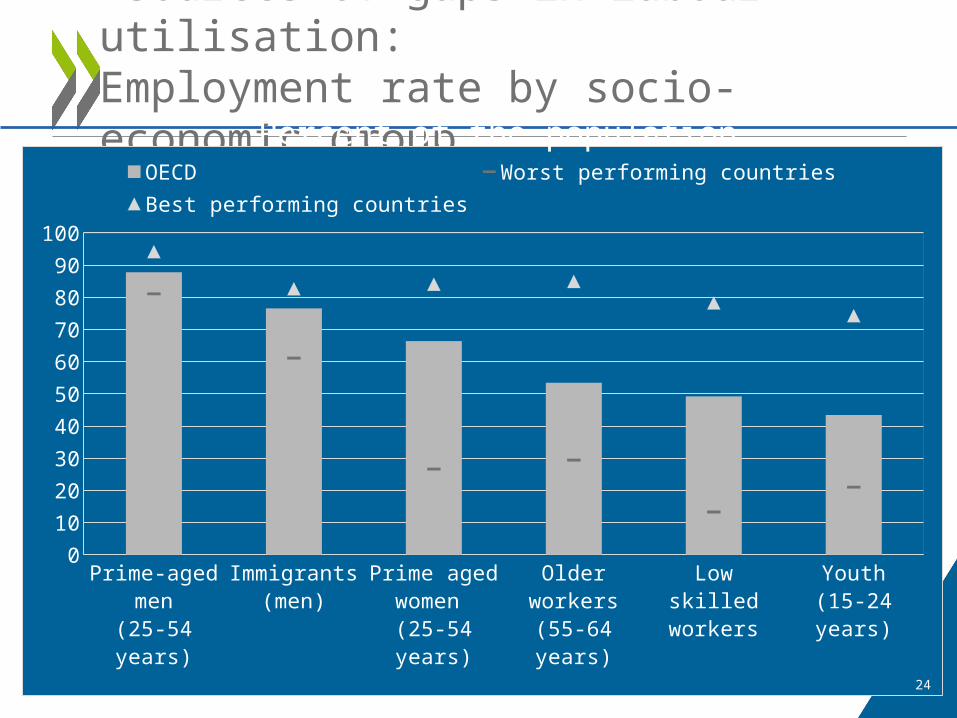
24
Sources of gaps in labour utilisation: Employment rate by socio-economic group
Stefano Scarpetta, IBM Chair, Labour Market Course
Prime-aged men
(25-54 years)
Immigrants(men)
Prime aged women (25-54 years)
Older workers(55-64 years)
Low skilled workers
Youth(15-24 years)
0
10
20
30
40
50
60
70
80
90
100
OECD Worst performing countriesBest performing countries
Percent of the population

30Stefano Scarpetta, IBM Chair, Labour Market CourseSource : OECD, Education at a glance, 2007.
Educational attainment, upper-secondary education in 2005
Percentage of population aged 25-34 and 45-54
0
10
20
30
40
50
60
70
80
90
100
25-34 45-54
Significant differences in the level of human capital across countries and over time

31Stefano Scarpetta, IBM Chair, Labour Market Course
Human capital plays a significant role in boosting labour productivity…
Growth in GDP per person employedContribution to growth in GDP per person employed from changes in1:
Hourly GDP per efficient unit of labourHours workedHuman Capital
1. This is based on a simple quantitative decomposition: growth in GDP per person employed = (labour productivity adjusted for hours and human capital) + ( growth in average hours worked) + (human capital adjustment).
-2 -1 0 1 2 3 4 5
New Zealand
Netherlands
Canada
France
Germany
Italy
United Kingdom
United States
Australia
Denmark
Portugal
Norway
Sweden
Finland
Ireland
Per cent

32Stefano Scarpetta, IBM Chair, Labour Market Course
…but skill-biased employment rates Percentage point change of the share of individuals with higher educational levels1 in total
1. Higher education levels refer to ISCED codes 5, 6 and 7.2. 1991-2000.
Aus
Aut
Bel Can
Dnk
Fin
Fra
Irl
Ita
Nld Nzl
Nor
Prt
Esp
Swe
Che
Tur2
Gbr
Usa
Deu2
0
3
6
9
12
15
0 3 6 9 12 15
Employment
Working-age population

Stefano Scarpetta, IBM Chair, Labour Market Course 33
Heterogeneity of productivity developments and resource reallocation
• Aggregate productivity levels mask large differences in productivity levels across industries and, within industries, across firms.
• Similarly, aggregate productivity growth reflects widely heterogeneous developments in productivity at the industry and firm level as well as reallocation of resources across them.
Differences in heterogeneity and reallocation processes contribute to explain cross-country differences in productivity growth.

Stefano Scarpetta, IBM Chair, Labour Market Course 34
Heterogeneity and reallocationSector-level decompositions of aggregate productivity growth
• Two related questions are of interest:– How much does each sector (or group
of sectors) contribute to aggregate productivity growth?
– What are the relative contributions of within sector growth and changes in sector composition to aggregate productivity growth?

Stefano Scarpetta, IBM Chair, Labour Market Course 35
Heterogeneity and reallocation Sector-level decompositions of aggregate productivity growth
Shift-share decomposition• Changes in aggregate labour productivity
reflect changes in productivity within each sector of the economy and shifts in its sectoral composition.
• Therefore, aggregate productivity growth can be accounted for in terms of sectoral contributions and intersectoral reallocation of resources.
• Such accounting can be done using so-called shift-share analysis.

Stefano Scarpetta, IBM Chair, Labour Market Course 36
Shift-share decomposition• Suppose you want to decompose changes in an
aggregate variable X relative to its level in a base year X0 into the two components (within each sector k and between sectors).
• We start from the identity:
• where sk is the share of sector k (measured in terms of employment in the case of labour productivity).
Heterogeneity and reallocationSector-level decompositions of aggregate productivity growth
)( 000kk
kkk XsXsXX

Stefano Scarpetta, IBM Chair, Labour Market Course 37
Shift-share decomposition
• Adding and subtracting the sums of each of the cross-products
, and the own product ,
we get the shift share decomposition:
where – ΔX accounts for the within sector change,
– Δs accounts for the shift in sectoral composition (between effect) and
– the last is an interaction term, which can be interpreted loosely as an indicator of covariance: if it is positive, within and between effects act in the same direction.
Heterogeneity and reallocationSector-level decompositions of aggregate productivity growth
XssXkkkk
kkkk
kkkk
k XXssXsssXXXX ))(()()( 0000000
k
kk Xs0 k
kk Xs 0 k
kk Xs 00

Stefano Scarpetta, IBM Chair, Labour Market Course 38
Shift-share decomposition• In growth terms, if X is productivity (i.e. Y/L) one divides both
sides by X0 to obtain:
• where y is the sectoral share of output in aggregate output Y and s is the sectoral share of labour in aggregate labour input L.
• Here the first term provides the within sector contribution to aggregate productivity growth and the second term indicates that the contribution of sectoral shifts depends on the ratio of sectoral to average productivity.
• Most of the changes in productivity over the periods considered originate in within industry efficiency improvements. But between effects can be important in some countries.
Heterogeneity and reallocationSector-level decompositions of aggregate productivity growth
kkk
kk
kk
kkk
k XssX
XssyXX ˆ)()(ˆˆ 00
000

Stefano Scarpetta, IBM Chair, Labour Market Course 39
Shift and Share, all industries, 1994-2004
-0.4
-0.2
0
0.2
0.4
0.6
0.8
1
1.2
1.4
1.6Within Between Cross

Stefano Scarpetta, IBM Chair, Labour Market Course 40
Shift and Share, services industries, 1994-2004
-1
-0.5
0
0.5
1
1.5
2Within Between Cross

Stefano Scarpetta, IBM Chair, Labour Market Course 42
• There is a growing evidence that the population of firms undergo significant changes over time, both through resource reallocation between existing firms and the process of firm entry and exit.
• The study of productivity, the role of within-firm productivity growth vs. the productivity growth induced by the reallocation of resources has been the focus of much recent research (see, e.g., Olley and Pakes (1996), Griliches and Regev (1995) and Foster, Haltiwanger and Krizan (2001,2002) Bartelsman, Haltiwanger, and Scarpetta (2004), Syverson (2004), Foster, Haltiwanger and Syverson (2008)).
• The impact of changing patterns of international trade on an economy is increasingly viewed through these lenses, with evolving trade relations changing the market structure and mix of businesses (e.g. Helpman, Melitz, and Yeaple, 2004).
• Substantial churning of firms, along with the reallocation of labor across continuing firms, implies that workers and firms incur in significant search and other adjustment costs (see, e.g., Mortensen and Pissarides, 1999; and Caballero and Hammour, 2000).
– As such, the efficiency of an economy in dealing with such reallocation is important not only for the productivity dynamics of the economy, but also for the dynamics of the labor market and in particular of unemployment.
• For all of these reasons, firm-level dynamics appear to be crucial for the relative success all market economies
Heterogeneity and reallocationwithin-industry heterogeneity and aggregate productivity growth

Stefano Scarpetta, IBM Chair, Labour Market Course 43
Firms heterogeneity: stylized facts
1. Size and growth: The probability of survival tends to increase with firm size; but, conditional on survival, the proportional rate of growth of a firm is decreasing in size (see Evans 1987a, 1987b; Dunne et al. 1988, 1989).
2. The firm life cycle: For any given size of firm, the proportional rate of growth is smaller the older the firm, but its survival probability is greater (see Foster et al. 2001; and International Journal of Industrial Organization, 1995).
3. Shakeouts: The number of producers in a given market tends first to rise to a peak, and later to fall to some lower level. (Klepper and Graddy, 1990; Klepper and Simons, 1993; Geroski, 1995).
4. Churning: There is a high pace of the reallocation of outputs and inputs across businesses (e.g. Geroski, 1995, Ahn, 2000 and Davis and Haltiwanger, 1999 for surveys of the literature).
5. Reallocation and Productivity: In well‑developed market economies, the evidence is overwhelming that the pattern of reallocation is productivity enhancing. (see e.g. Olley and Pakes, 1996, Griliches and Regev, 1995, and Foster, Haltiwanger and Krizan, 2001, 2002).

Stefano Scarpetta, IBM Chair, Labour Market Course 44
Theoretical models of firm heterogeneity
Several theories have been developed to explain these observed patterns of firm dynamics survival and growth. They generally relate to the process of ‘creative destruction’ (usually ascribed to Joseph Schumpeter).
– 1) and 2) are consistent with the passive learning models (Jovanovic, 1982): new entrants do not know their potential profitability. Learning leads new firms to expand, contract or exit the market. Cabral (1995 and 2003) assumes that firms must incur a sunk cost in building production capacity. Since small entrants have a higher probability of exit than large firms, it is optimal for them to invest more gradually, and thus experience higher growth rates if successful, than larger entrants.
– Shakeouts (3) is consistent with Jovanovic and MacDonald (1994) who argue that over time a new technology emerges which offers low unit costs but higher level of output per firm. The transition to the new technology involves a shakeout of first generation firms.
– Churning (4) is consistent with active learning models (Ericson and Pakes, 1995): here firms explore actively and invests to enhance profitability under competitive pressure; they grow if successful, shrink or exit if unsuccessful.

Stefano Scarpetta, IBM Chair, Labour Market Course 46
Productivity dispersion across firms in ICT-producing
France
Electrical and optical equipment Telecommunications
The figures present the distribution of labour productivity in each industry and year between the 5th and 95th percentiles. The upper bound of the grey bar represent the 75th percentile, the lower bound the 25th percentile and the line in the middle of each grey bar being the median. Labour productivity is measured as value added per worker in 100 thousands of 1995 Euros. Source: Authors’ calculations from AMADEUS database.
Much of the increase in dispersion comes from top performers.
25th %ile
75th %ile
95th %ile
5th %ile
Wide firm heterogeneity within industries (2)

Stefano Scarpetta, IBM Chair, Labour Market Course 47
• Average productivity levels/growth in the aggregate and in each industry depend on the dispersion of productivity levels/growth across incumbents and firms entering and exiting markets.
• That is:– efficiency levels/improvements within each firm,– allocation/reallocation of resources across firms with different
efficiency levels/growth– entry/exit of firms with different efficiency levels/growth
• There are several ways to decompose average productivity levels/growth into these different static and dynamic elements.
• Methods are similar to, albeit more complicated than, those used in shift-share analysis.
Heterogeneity and reallocationFirm-level decompositions of aggregate productivity
48Stefano Scarpetta, IBM Chair, Labour Market Course
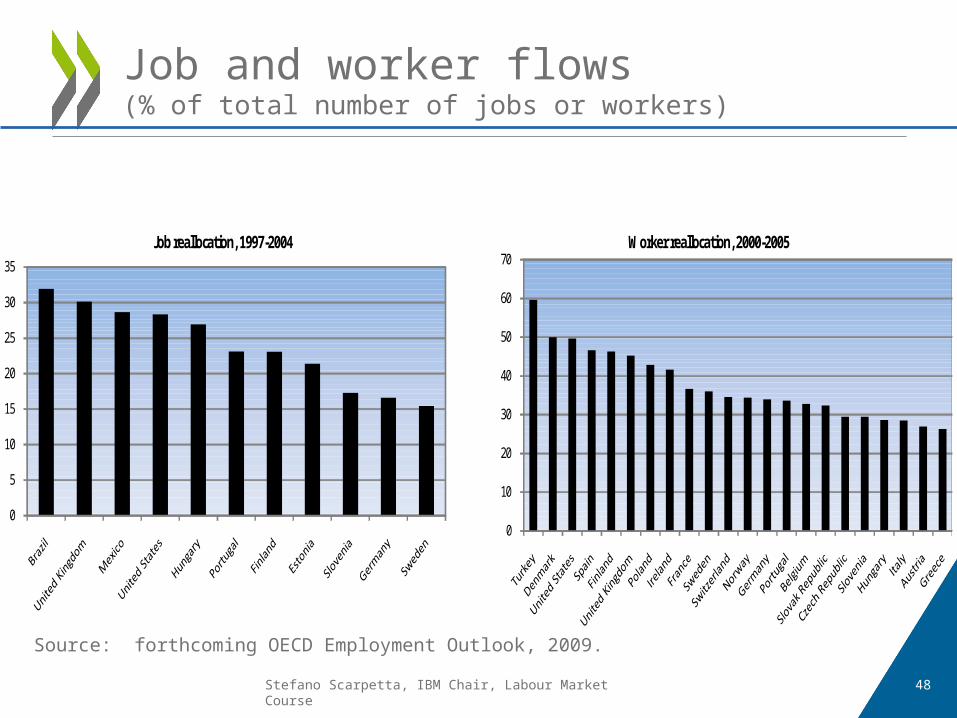
Job and worker flows(% of total number of jobs or workers)
Job reallocation, 1997-2004 Worker reallocation, 2000-2005
0
5
10
15
20
25
30
35
0
10
20
30
40
50
60
70
Source: forthcoming OECD Employment Outlook, 2009.

Stefano Scarpetta, IBM Chair, Labour Market Course 49
• Focusing on the reallocation channel, two interesting questions arise when comparing cross-country productivity performances:– Static efficiency of resource allocation. Is
resource allocation correlated with firm productivity? Have the most efficient firms the largest shares of the market?
– Dynamic efficiency of resource allocation. Do resources move efficiently across heterogeneous firms? Do better firms grow faster?
Heterogeneity and reallocationFirm-level decompositions of aggregate productivity

Stefano Scarpetta, IBM Chair, Labour Market Course 50
• The static efficiency issue can be addressed using a decomposition of productivity proposed by Olley and Pakes (2004):
where P is productivity and θ is firm’s market share
Heterogeneity and reallocationFirm-level decompositions of aggregate productivity
i i
iiii
ii PppNPP ))(()/1(__
Simple Average Allocative Efficiency

Stefano Scarpetta, IBM Chair, Labour Market Course 51
Differences in allocative efficiency, especially in services
0%
5%
10%
15%
20%
25%
30%
35%
40%
45%
FIN BEL PRT FRA ESP ITA SWE GBR
Manufacturing Services
ki
ki
P
OP
Contribution of resource allocation to sectoral MFP levels (Based on Olley-Pakes productivity decomposition)

Stefano Scarpetta, IBM Chair, Labour Market Course 52
Evolution of allocative efficiency during the transition -- Eastern Europe, manufacturing(weighted averages of industry level cross terms from OP decomposition)
-0.2 -0.1 0 0.1 0.2 0.3 0.4 0.5
00-01
95-96
98-99
95-96
98-99
95-96
00-01
95-96
92-93
00-01
95-96
Est
onia
Latv
iaR
oman
iaS
love
nia
Hun
gary
cros
s-te
rm o
f OP
dec
ompo
sitio
nA digression: evolution of OP cross term in transition economies

Stefano Scarpetta, IBM Chair, Labour Market Course 53
• Focusing on the between/reallocation channel, two interesting questions arise when comparing cross-country productivity performances:– Static efficiency of resource allocation. Is
resource allocation correlated with firm productivity? Have the most efficient firms the largest shares of the market?
– Dynamic efficiency of resource allocation. Do resources move efficiently across heterogeneous firms? Do better firms grow faster?
Heterogeneity and reallocationFirm-level decompositions of aggregate productivity

Stefano Scarpetta, IBM Chair, Labour Market Course-3
-2.5
-2
-1.5
-1
-0.5
0
0.5
1
1.5
2
1 2 3 4 1 2 3 4 1 2 3 4 1 2 3 4
ESP FRA ITA GBR 54
Different Abilities of Countries to Channel Resources towards More Productive Firms
Least productive
Most productive
Average
Grow
ing fasterG
rowing slow
er
Growth of real value added by productivity quartiles
(relative to average of country/sector/year group)
ESP FRA ITA GBR

Stefano Scarpetta, IBM Chair, Labour Market Course 55
The decomposition of productivity growth
• Foster, Haltiwanger and Krizan (2001): in this decomposition, each
term is weighted by beginning of the period market shares as follows:
• the first term is the within component; the second is the between component, the third term is the cross component, while fourth and fifth are the entry and exit component, respectively.
)()(
)(
ktkitXi
kitktitNi
it
Ciititkt
Cikititit
Cikit
t
PpPp
pPppP

Stefano Scarpetta, IBM Chair, Labour Market Course 56
Within-firm productivity growth makes the bulk of overall productivity growth
-0.5
0.0
0.5
1.0
1.5
Argentina: 1995-2001. Chi le: 1985-1999. Colombia: 1987-1998. Es tonia: 2000-2001.Finland: 2000-2002. France: 1990-1995. West Germany : 2000-2002. Korea: 1988 & 1993.Latv ia: 2001-2002. Netherlands : 1992-2001. Portugal: 1991-1994. Slovenia: 1997-2001.Taiwan: 1986, 1991 & 1996. UK: 2000-2001. USA: 1992 & 1997.Exc luding Braz il and Venezuela.
Labor Productivity - Five-Year Differencing, Real Gross OutputFHK Decomposition Shares - Manufacturing
Within Between Cross
Entry Ex it Firm Turnover(i )

Stefano Scarpetta, IBM Chair, Labour Market Course 57
… but technology matters
-1.5
-1
-.5
0
.5
1
Chile: 1983-1999. Es tonia: 1998-2001.Latv ia: 1999-2002. Romania: 1998-1999.
Labor Productivity - Five-Year Differencing, Real Gross OutputFHK Decomposition Shares - Low Tech Industries
Within BetweenCross Entry
Exit

Stefano Scarpetta, IBM Chair, Labour Market Course 58
… but technology matters
-.5
0
.5
1
1.5
Argentin
aChile
Colombia
Es tonia
Finla
nd
France
Korea
Latvia
Netherla
nds
Slovenia
Taiwan UK
USA
Argentina: 1993-2001. Chi le: 1983-1999.Colombia: 1985-1998. Es tonia: 1998-2001. Indones ia: 1993-1995. Latv ia: 1999-2002.Romania: 1998-1999. Slovenia: 1995-2001.
Labor Productivity - Five-Year Differencing, Real Gross Output
FHK Decomposit ion SharesMedium Low, Medium High and High Tech Industries
Within Between
Cross EntryExit

Stefano Scarpetta, IBM Chair, Labour Market Course 59
• The main conclusions from this firm-level analysis are:– Within-firm efficiency improvements have been the main driver of
productivity growth in most OECD countries– Aggregate improvements due to reallocation of resources across
sectors and, within each of them across firms have played an important role especially in most dynamic industries, such as ICT-related ones
• Each of these channels of productivity improvements operates in different ways:– Within-firm effects are driven by elimination of slack, technology
adoption and innovation.– Between firm effects are driven by the ability to allocate resources
(i.e. labour and capital) to the most efficient firms or industries– Turnover effects depend on the ability of new firms to enter
markets and experiment as well as on the ability of the economy to get rid of inefficient firms
Heterogeneity and reallocationFirm-level decompositions of aggregate productivity