The Role of Energy in Development...
19
THE ROLE OF ENERGY IN DEVELOPMENT i THE ROLE OF ENERGY IN DEVELOPMENT
Transcript of The Role of Energy in Development...

THE ROLE OF ENERGY IN DEVELOPMENT i
THE ROLE OF ENERGY IN DEVELOPMENT
THE ROLE OF ENERGY IN DEVELOPMENT ii
CONTENTS
Executive Summary ............................................................................................... 3
The Role of Energy in Development .................................................................... 5 Introduction .......................................................................................................................................... 5 Energy and Economic Development ............................................................................................... 5 Investing in People............................................................................................................................... 7 Security and Governance.................................................................................................................10 Conclusion...........................................................................................................................................13
Annex1................................................................................................................... 14
Endnotes ................................................................................................................ 17
COVER PHOTOS
Photo: IDER/ Luis Massilon Youth learn how to install solar panels to power a computer center in the rural community of São João, Brazil.
THE ROLE OF ENERGY IN DEVELOPMENT 3
EXECUTIVE SUMMARY
ccess to modern energy,1 especially in the lower income developing countries, is an important factor for achieving key aspects of the Millennium Development Goals and supporting the U.S. development and security agenda. Through review of the relevant literature and a first-order statistical
analysis of existing data on energy access, human welfare and economic growth, this paper presents key correlations that demonstrate the role of modern energy access in human and macroeconomic development.2 Linkages between energy and security and between energy and governance are more qualitative and indirect, but analyses and studies to date indicate that these relationships are also positive and significant.
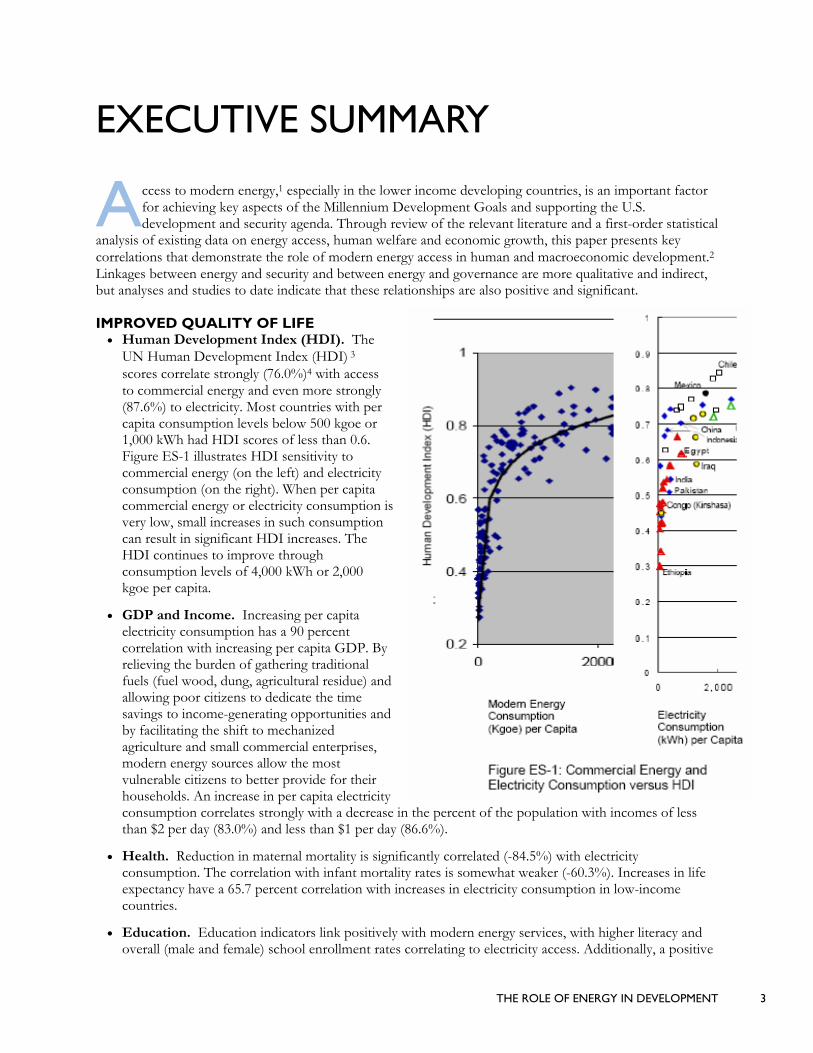
IMPROVED QUALITY OF LIFE • Human Development Index (HDI). The
UN Human Development Index (HDI) 3 scores correlate strongly (76.0%)4 with access to commercial energy and even more strongly (87.6%) to electricity. Most countries with per capita consumption levels below 500 kgoe or 1,000 kWh had HDI scores of less than 0.6. Figure ES-1 illustrates HDI sensitivity to commercial energy (on the left) and electricity consumption (on the right). When per capita commercial energy or electricity consumption is very low, small increases in such consumption can result in significant HDI increases. The HDI continues to improve through consumption levels of 4,000 kWh or 2,000 kgoe per capita.
• GDP and Income. Increasing per capita electricity consumption has a 90 percent correlation with increasing per capita GDP. By relieving the burden of gathering traditional fuels (fuel wood, dung, agricultural residue) and allowing poor citizens to dedicate the time savings to income-generating opportunities and by facilitating the shift to mechanized agriculture and small commercial enterprises, modern energy sources allow the most vulnerable citizens to better provide for their households. An increase in per capita electricity consumption correlates strongly with a decrease in the percent of the population with incomes of less than $2 per day (83.0%) and less than $1 per day (86.6%).
• Health. Reduction in maternal mortality is significantly correlated (-84.5%) with electricity consumption. The correlation with infant mortality rates is somewhat weaker (-60.3%). Increases in life expectancy have a 65.7 percent correlation with increases in electricity consumption in low-income countries.
• Education. Education indicators link positively with modern energy services, with higher literacy and overall (male and female) school enrollment rates correlating to electricity access. Additionally, a positive
A

THE ROLE OF ENERGY IN DEVELOPMENT 4
correlation (65%) occurs between primary education enrollment and completion rates for girls and increases in per capita electricity consumption. The correlation is strongest in low-income developing countries.
MACROECONOMIC DEVELOPMENT • Export diversification has been found to correlate positively with infrastructure development in Africa.
Additional analyses of economic growth in Bolivia, Colombia, Mexico, and Venezuela demonstrated that a 10 percent increase in infrastructure stocks was associated with a 1.5 percent increase in GDP.
• In the agriculture sector, increasing value added per worker is tied to both electricity access (83.4%) and commercial energy use (80.8%). Because agricultural production and processing are often the largest employers in rural areas, this relationship has important implications for lifting the world’s rural poor beyond subsistence farming and out of poverty.
• Extending electricity access to previously un-served and under-served areas facilitates development of cottage industries and generates employment that may help mitigate rural-urban migration. Bangladesh’s rural electrification program increased the total number of rural industrial consumers by 3,200 percent (from only 23 in 1983 to 73,827 in 2002) while the average number of industrial connections per cooperative rose by 550 percent (from 2 in 1983 to 1,102 in 2002).
GOVERNANCE AND SECURITY The International Energy Agency (IEA) estimates that a $10/barrel oil-price increase results in an average loss in GDP of 0.8 percent in the oil-importing developing economies of Asia. A World Bank/ Energy Sector Management Assistance Program (ESMAP) study5 showed that the GDP of the lowest income net oil-importing countries were the most vulnerable to significant increases in oil prices. Table ES-1 summarizes the effect of 33 percent and 72 percent oil-price increases on GDP—2003 to 2004 and 2003 to 2005, respectively—and indicates that declines in GDP could range from 1 to 3 percent depending on the specific circumstances of the countries’ economies. The study also showed a strong correlation between the external debt ratio and the net oil-import/GDP ratio, indicating that the most indebted countries are also those with economies that are most vulnerable to rises in oil price (oil vulnerability).
Table ES-1: Impact of Higher Oil Prices on Net Oil-Importing Countries Grouped by Per Capita Income as a Percentage of GDP (2003 base)
Energy sector reform often introduces civic participation, transparency, and accountability to developing-country citizens. By promoting public discussion, creating mechanisms for consumer input, and establishing sector regulation characterized by transparency and political independence, energy sector reform introduces the concepts of governance and civic participation.
Collectively, the correlations between modern energy and human welfare, balanced and sustained economic growth, governance and security demonstrate the need for critical attention to energy access for developing economies and their citizens. The analyses presented in this paper clearly demonstrate the essential role of modern energy in supporting the U.S. Director of Foreign Assistance’s objective of “peaceful societies where healthy and well-educated people are free to provide for themselves and their families.”6

THE ROLE OF ENERGY IN DEVELOPMENT 5
THE ROLE OF ENERGY IN DEVELOPMENT INTRODUCTION This paper discusses links between modern energy access and use and improvements in human welfare, economic growth, good governance, and global security. The analyses presented herein are based primarily on a review of the available literature and a first-order cross-sectional correlation analysis of published data on modern energy access and use and key development indicators. The correlation analysis does not attempt to prove causality but, rather, the predominance of statistically significant relationships between modern energy access and use and human welfare and economic growth. The analyses of governance and security are qualitative rather than quantitative and are based on literature review and observations.
Data for the statistical analysis was primarily drawn from publications of the World Bank (WB), United Nations (UN), Energy Information Administration (EIA) and International Energy Agency (IEA). The development indicators selected for the statistical analysis, listed in Annex 1, fall into two broad categories: human welfare and economic growth. Examples of human welfare indicators include life expectancy, infant and maternal mortality rates, child immunization coverage, HIV infection rates, literacy rates and education completion data. Examples of economic growth indicators include per capita Gross Domestic Product (GDP) and Gross National Income (GNI), agriculture value added, labor productivity, percent of the population below the poverty gap (income of <$2/day) and rates of unemployment. The combination of both human welfare and economic growth is best represented by the UN’s Human Development Index (HDI). The links of modern energy access and use to the HDI are also assessed. A summary of the resulting quantitative and qualitative analysis is presented below.
ENERGY AND ECONOMIC DEVELOPMENT Growth of GDP per capita correlates strongly (89.9%) with increasing electricity use (Figure 1). The correlation between commercial energy use and GDP per capita is only slightly lower (88%), and both correlations are strongest for middle-income countries.7 While some variability exists in the links between GDP and energy/electricity use (due to varying energy intensities, reliance on imported energy or stage of economic development), the fact remains that increases in energy use are needed to fuel a portion of GDP growth.8,9 Analysis of electrification in Sri Lanka, for example, determined that every additional megawatt-hour10 in electricity supply was found to increase economic output by $1,000 to $1,500.11
Log(Electric power consumption (kWh per Capita))
4.54.03.53.02.52.01.51.0
LOG
(GD
P p
er c
apita
, PP
P (c
onst
ant 2
0000
Inte
rnat
iona
l $)) 5.0
4.5
4.0
3.5
3.0
2.5
Figure 1: GDP Per Capita and Electricity Consumption
THE ROLE OF ENERGY IN DEVELOPMENT 6
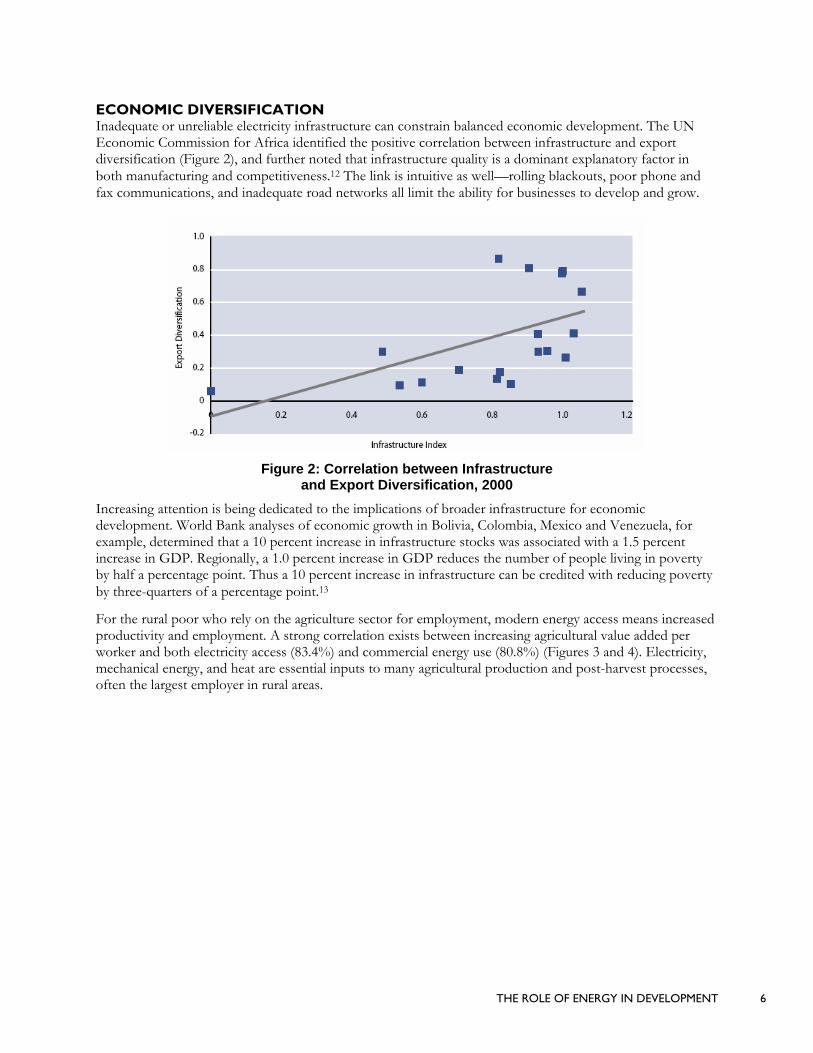
ECONOMIC DIVERSIFICATION Inadequate or unreliable electricity infrastructure can constrain balanced economic development. The UN Economic Commission for Africa identified the positive correlation between infrastructure and export diversification (Figure 2), and further noted that infrastructure quality is a dominant explanatory factor in both manufacturing and competitiveness.12 The link is intuitive as well—rolling blackouts, poor phone and fax communications, and inadequate road networks all limit the ability for businesses to develop and grow.
Figure 2: Correlation between Infrastructure
and Export Diversification, 2000 Increasing attention is being dedicated to the implications of broader infrastructure for economic development. World Bank analyses of economic growth in Bolivia, Colombia, Mexico and Venezuela, for example, determined that a 10 percent increase in infrastructure stocks was associated with a 1.5 percent increase in GDP. Regionally, a 1.0 percent increase in GDP reduces the number of people living in poverty by half a percentage point. Thus a 10 percent increase in infrastructure can be credited with reducing poverty by three-quarters of a percentage point.13
For the rural poor who rely on the agriculture sector for employment, modern energy access means increased productivity and employment. A strong correlation exists between increasing agricultural value added per worker and both electricity access (83.4%) and commercial energy use (80.8%) (Figures 3 and 4). Electricity, mechanical energy, and heat are essential inputs to many agricultural production and post-harvest processes, often the largest employer in rural areas.

THE ROLE OF ENERGY IN DEVELOPMENT 7 Log(Electric power consumption (kWh per Capita))
4.03.53.02.52.01.5
LOG
(Pov
erty
gap
at $
2 a
day
(PP
P) (
%))
2.0
1.5
1.0
.5
0.0
-.5
Figure 5: Poverty Gap ($2/Day) and Electricity Consumption
EMPLOYMENT AND INCOME GENERATION The effects of access to modern energy are conveyed beyond the agriculture sector, into commercial and industrial enterprises, resulting in increased employment and income. Bangladesh’s rural electrification program has had broad, demonstrable economic and social impacts. Over the past 25 years, the total number of rural industrial consumers has increased by 3,200 percent (from only 23 in 1983 to 73,827 in 2002) while the average number of industrial connections per cooperative rose by 550 percent (from 2 in 1983 to 1,102 in 2002). During the period 1997 to 2002 alone,
• employment rose by 50 percent,
• volume of output (number of units produced) increased by 200 percent, and
• growth in industrial value increased by 300 percent from 1997 to 2002.14
In stark contrast, output in non-electrified industries was stagnant over the same period. As of June 2004, 67 rural electric supply cooperatives (PBS) were operating and providing service to 5.2 million consumers; and there were 11 PBS with positive cumulative margins and annual margins exceeding 10% of their construction budgets, three of whom had margins in excess of 100% of their construction budget.
INVESTING IN PEOPLE Access to modern energy is essential to moving the world’s poor out of dire poverty. Increasing per capita electricity consumption has a strong correlation (-83.0%) with reductions in the percent of the population with incomes of less
Log(Energy use (kg of oil equivalent))
4.54.03.53.02.52.0Log(
Agr
icul
ture
val
ue a
dded
per
wor
ker [
cons
tant
200
0 U
S$])
5.0
4.5
4.0
3.5
3.0
2.5
2.0
Figure 4: Agriculture Value Added and Energy Consumption
Log(Electric power consumption (kWh per Capita)) 4.54.03.53.02.52.0 1.51.0Lo
g(A
gric
ultu
re v
alue
add
ed p
er w
orke
r [co
nsta
nt 2
000
US
$])
5.0
4.5
4.0
3.5
3.0
2.5
2.0
Figure 3: Agriculture Value Added and Electricity Consumption
“The distribution pattern of industries by size and type indicates that the spread of rural electrification has not only diversified the industry, but also facilitated the growth of medium scale and large industries contributing to employment generation in the rural areas, while the non-electrified industries are more concentrated within small and cottage industries and confined within a narrow industrial base.”
– Analysis of USAID’s rural electrification program in Bangladesh
THE ROLE OF ENERGY IN DEVELOPMENT 8
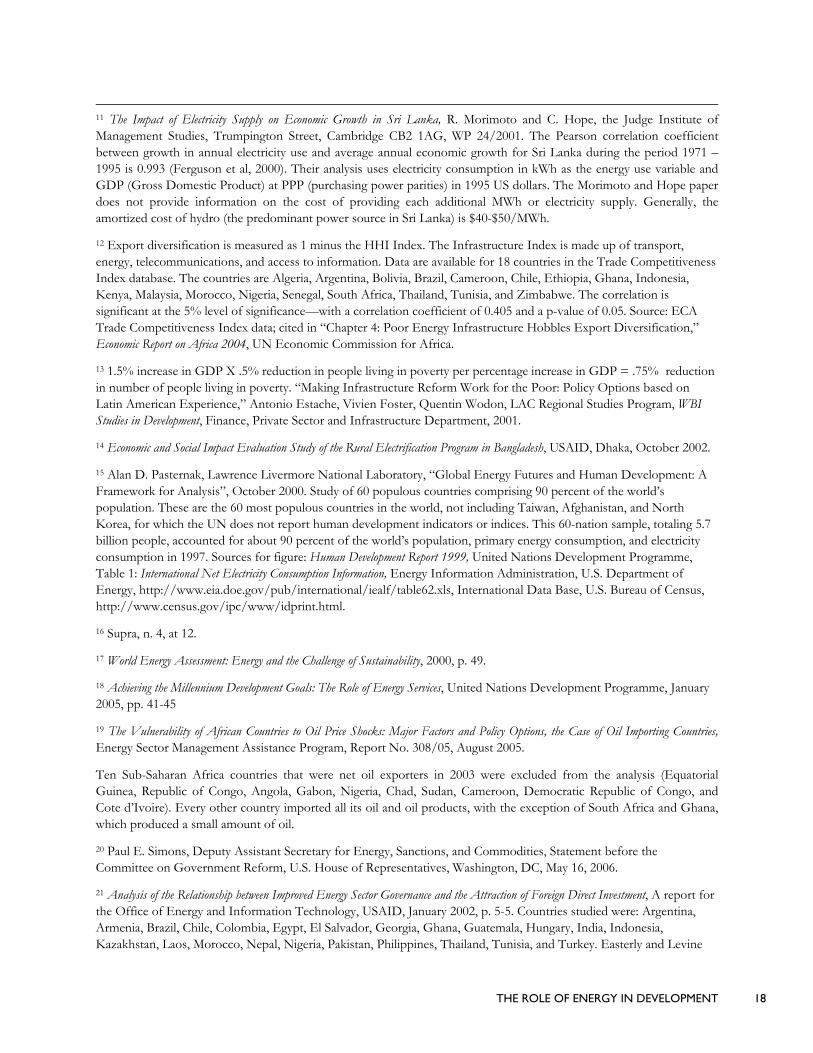
Figure 7: Lawrence Livermore National Lab Analysis of HDI and Electricity Consumption
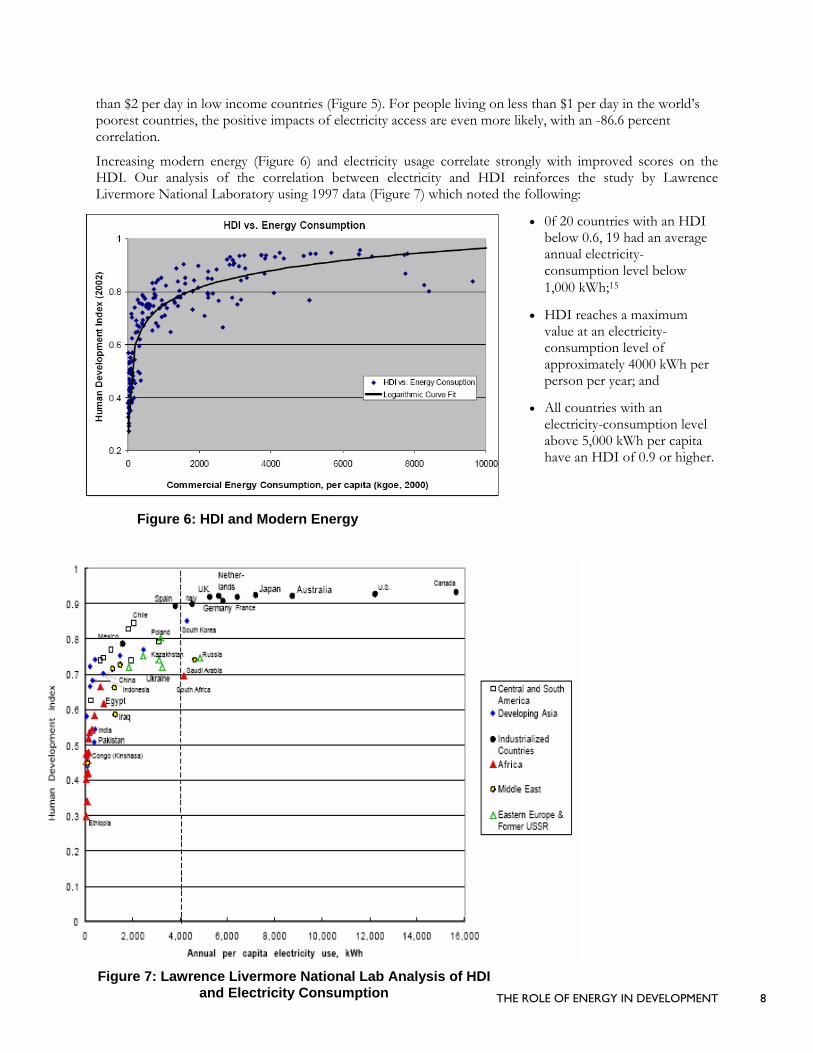
than $2 per day in low income countries (Figure 5). For people living on less than $1 per day in the world’s poorest countries, the positive impacts of electricity access are even more likely, with an -86.6 percent correlation. Increasing modern energy (Figure 6) and electricity usage correlate strongly with improved scores on the HDI. Our analysis of the correlation between electricity and HDI reinforces the study by Lawrence Livermore National Laboratory using 1997 data (Figure 7) which noted the following:
• 0f 20 countries with an HDI below 0.6, 19 had an average annual electricity-consumption level below 1,000 kWh;15
• HDI reaches a maximum value at an electricity-consumption level of approximately 4000 kWh per person per year; and
• All countries with an electricity-consumption level above 5,000 kWh per capita have an HDI of 0.9 or higher.
Figure 6: HDI and Modern Energy

THE ROLE OF ENERGY IN DEVELOPMENT 9
HEALTH Critical indicators of health improve when access to modern energy is provided. Increased life expectancy has a 72 percent correlation with access to electricity; the correlation is strongest for the lowest-income countries (Figure 8). Our analysis found that this correlation does not have a gender-differentiated relationship, being equally beneficial to both males and females.
Access to electricity leads to significant reductions in maternal mortality (see Figure 9), with a correlation of -84.5 percent. Also significant is the correlation between electricity use and infant mortality; the correlation is strongest in countries with electricity per capita use below 1000 kWh/capita, at -69 percent. In the Philippines, studies show that, after controlling for income and other demographic factors, women with access to electricity have a 17 percent higher probability of having a doctor-assisted birth than those without electricity.16
Nearly two billion people in developing countries are exposed to air pollution inside their homes from burning fuelwood, crop residue, or dung with inefficient and poorly ventilated cookstoves. The World Health Organization recently concluded that indoor air pollution is the fourth largest health risk in the world’s poorest countries and, every year, an estimated 2 million people die from illnesses linked to the air pollution caused by household cooking and heating practices. The vast majority of these deaths have been among women and children under the age of five. Where tradition impedes the replacement of traditional fuels with electricity, culturally appropriate interventions can still deliver considerable health benefits. In Kenya, more than 16,000 improved, fuel-efficient cookstoves have been shown to reduce indoor smoke by 60 percent, contributing to a 65 percent reduction in acute respiratory infections among mothers and a 70 percent reduction of conjunctivitis among children under five.17
EDUCATION The linkage between education and access to modern energy services is multifaceted. Electricity usage is associated with higher levels of adult literacy and overall enrollment rates. Easing the burden of physical labor and the time required for rural agriculture can lead to specific educational and health benefits, particularly for women and children. Figures 10 and 11 depict the global correlation between electricity use and girl-to-boy primary-level enrollment (64.5%), as well as primary completion (65.4%). Both correlations are strongest in countries with an average consumption less than 1000 kWh/year, (66.6% and 67.1%, respectively).
Log(Electric power consumption (kWh per Capita))
4.54.03.5 3.02.52.01.51.0
Log(
Rep
orte
d M
ater
nal M
orta
lity)
2.0
1.8
1.6
1.4
1.2
1.0
.8
.6
.4
.2
0.0
-.2
Figure 9: Maternal Mortality and Electricity Consumption
Log(Electric power consumption (kWh per Capita))
4.54.03.53.02.52.0 1.51.0
Log(
Life
exp
ecta
ncy
at b
irth,
tota
l)
2.0
1.9
1.8
1.7
1.6
1.5
Figure 8: Life Expectancy and Electricity Consumption

THE ROLE OF ENERGY IN DEVELOPMENT 10
Anecdotally, programs designed to improve access to energy can result in a wide range of positive impacts. For example, a project in Mali, that provided women with modern fuels as well as mechanical assists for household work, demonstrated benefits far beyond reduced physical labor. Agricultural productivity increased and the women’s families had access to more food, with positive impacts on their health. In addition to income benefits, time savings of an average of 2.5 hours per day resulted. This time savings led to improved school attendance (the ratio of girls to boys in primary school improved and the dropout rate declined) and increased attention to medical care (higher number of prenatal visits to health clinics).18
SECURITY AND GOVERNANCE Energy links with security and good governance are less direct and are drawn from less data-intensive, more qualitative studies. As links between energy poverty and political instability attract increasing attention and that area of study progresses, more quantitative correlations may be possible. In the area of governance, as well, inferences are drawn from limited, largely qualitative assessments.
NATIONAL SECURITY A nation’s security relies on a matrix of factors where the role of energy is not primary. Rather, the absence of secure energy supplies most often moves energy into the security-analysis equation. At the macro level, a lack of financial and energy reserves makes developing economies less able to tolerate energy supply interruptions and more vulnerable to the whims of supplying states. The twin goals of diversity and security of supply are important not only for the United States and other G-8 countries, but also for developing and transforming states. When Russia cut off gas supplies to Ukraine this past winter, the world confronted the stark implications of supply vulnerability, and the United States witnessed the vulnerability of a strategic developing economy to energy blackmail.
Reliance on imported oil is associated with economic vulnerability and increased national indebtedness in studies by the IEA and the World Bank’s ESMAP. IEA estimates that a $10/barrel oil-price increase results in an average loss in GDP of 0.8 percent in the oil-importing developing economies of Asia. ESMAP analysis of the impact of the increase in oil prices in the period 2003 to 2005 on the poor countries of sub-Saharan Africa determined that “the recent price rises have weighed on the sub-Saharan African net oil-importing countries severely, being equivalent to a cumulative loss of GDP of around 3.5 percent over the last two years.”
Log(Energy use (kg of oil equivalent))
4.54.03.5 3.0 2.5 2.0
Log(
Girl
s to
boy
s ra
tio, p
rimar
y le
vel e
nrol
lmen
t)
.0
0.0
-.0
-.0
-.1
-.1
Figure 10: Girl-to-Boy Ratio (Primary-level Enrollment) and Electricity Consumption
Figure 11: Education (Girls’ Primary Completion Rate)
and Energy Consumption
Log(Energy use (kg of oil equivalent))
4.54.03.5 3.02.52.0
Log(
Edu
catio
n, p
rimar
y co
mpl
etio
n ra
te, g
irls)
.9
.8
.7
.6
.5

THE ROLE OF ENERGY IN DEVELOPMENT 11
Figure 12: External Debt to GDP versus Oil Vulnerability (2003)
With the exception of sub-Saharan Africa’s oil exporters, the region’s economies are characterized by virtually complete reliance on imported oil and very high dependence on oil fuel. The same report identified a squared correlation (the proportion of variance in X that can be accounted for by knowing Y) of 54 percent between the external debt ratio and the net oil-import ratio (Figure 12), “indicating that the countries which are most indebted are also those which have the highest vulnerability to oil price rises.”19
Table 1 summarizes the effect of 33 percent and 72 percent oil-price increases on GDP—2003 to 2004 and 2003 to 2005, respectively. GDP reductions of 1 to 3 percent result, depending on oil vulnerability and per capital income of the individual countries. If the lower total energy intensity and oil intensity—which currently mitigate some of the effects of price increases—rise as the countries develop further, the impacts of future price increases may, in fact, be exacerbated.
Table 1: Impact of Higher Oil Prices on Net Oil-Importing Countries Grouped by Per Capita Income as a Percentage of GDP (2003 base)
At the opposite end of the spectrum, some states have rich endowments of oil and gas. However, those resources do not guarantee economic development and, in many cases, have created increased insecurity and conflict (e.g., Nigeria, Sudan). Those states with significant energy poverty despite domestic oil and gas endowments pose particular concern for U.S. security:
The lack of transparency into the energy deals by many of these nations only sustains cronyism, which stifles the rule of law and efforts for genuine reform…. A focus on transparency and good governance will also limit the ability of those in energy-producing states who recycle our energy dollars to finance terrorist organizations.20
Instability can also arise from energy-poverty-induced migration. Diminishing stocks of traditional wood and biomass fuels can prompt internal rural-to-urban migration or migration across international frontiers that exacerbate competition and conflict over scarce resources. Nepal poses a stark example of a situation where population stress and a deteriorating biomass and forest resource base are critical factors leading to a rural Maoist rebellion—and a direct correlation exists between areas without electricity and those where the Maoists are strongest. Energy poverty leads ultimately to deteriorating economic and social conditions and fragile or failed states that can offer safe havens for groups with the potential to threaten U.S. national security.

THE ROLE OF ENERGY IN DEVELOPMENT 12
Energy Reform and Governance …viable energy sector reforms can strengthen democracy, not only by enhancing prosperity and therefore stability, but also by providing an example to other economic sectors of the importance of the fundamental underpinnings of liberal democracy, including the rule of law and effective public involvement.
—The Nexus between Energy Sector Reform and Democracy and Governance
SUPPORT FOR JUST AND DEMOCRATIC GOVERNANCE As governments struggle to meet increasing energy demands with limited public funds, they often seek private investment to build power plants, pipelines, and distribution system for gasoline, propane, and other liquid fuels. This need to attract private investment, in turn, often prompts energy sector reform to assure investors that their investments will be protected. Independent regulatory regimes, price transparency and strengthened commercial laws are often introduced, bringing with them an environment of improved governance and greater public participation. A 2002 USAID study of six major aspects of reform (including legislative and regulatory framework conducive to investment, independence of the regulator and level of competition) in 24 countries found that significantly higher rates of economic growth were associated with improved governance, while improved energy sector governance had a clear and strong correlation with the foreign direct investment critical to economic growth.21
However, the focus on investor protection has tended to neglect the protection of the public interest. Because many of the countries undertaking energy sector reform are also democracies or evolving toward democracy (e.g. post-Suharto Indonesia; post-Soviet Georgia), civil society organizations operating in a new environment of freedoms have sought to influence the shape of reform.
Consensus in a democracy requires preconditions that pertain to the public’s ability to influence the adoption of laws and the appointment of officials and also to its ability to influence tariffs, investments and environmental impacts of day-to-day decision making in the reformed energy sector. Civil society organizations are becoming increasingly able to articulate demands for transparent and accountable energy institutions, and to seek out legal and civic channels for submitting these claims. These efforts have been inextricably linked to a more general outcry against corrupt state institutions and to a broader push for democratic processes to be implemented in practice as well as in law. The lack of legitimacy of sector events associated with reform has resulted in significant reversals. Recent examples include:
• Generation: Non-transparent contracting procedures in India and Indonesia generated Power Purchase Agreements that placed a disproportionate burden of risk on public sector institutions. These contracts proved to be unsustainable and were ultimately abrogated, resulting in costly litigation and tense diplomatic relations.
• Distribution: Consumers in New Delhi tolerated tariff increases associated with the privatization of two public utilities. Two tariff increases later, unimproved – and in some cases, worsening – services resulted in protracted street protests in the summer of 2005.
• Legislation: Public concern over the ability to hold private companies accountable resulted in the overturning of Indonesia’s Electricity Law of 2002, which sought to provide the enabling legal environment for privatization.
The need for energy sector reform to include mechanisms of transparency and accountability, and for the public to be involved in shaping the reforms, emerges as an inescapable lesson from reform failures in recent years. Energy sector reform must also be designed to draw upon lessons from democratic governance, particularly lessons in effective public interaction, in the creation of checks and balances against abuse of authority, in transparency and in accountability. Countries must find ways to harmonize unpopular but necessary aspects of energy sector reform and seek to ensure that energy policy is serving the needs of the public. The success of energy sector reform is enhanced when the public perceives it as legitimately arrived at and implemented with an ongoing concern for fairness and justice.22 In return, successful energy sector reform offers broad support to democracy, both through the stability that comes with robust economic growth and through “creating opportunities for participation, accountability and transparency that advance the larger transformation process toward more democratic governance.” 23

THE ROLE OF ENERGY IN DEVELOPMENT 13
CONCLUSION Throughout the analyses presented, correlations are drawn between electricity and energy use and components of the HDI, indicators associated with the Millennium Development Goals (MDG) and other measures of human welfare, economic growth and development. Across the areas on which the UN community has set goals (Table 2), access to modern energy has been linked to improvement in one or more MDG indicators. The correlations between electricity and energy use and these indicators collectively convey a clear message: Commercial energy access and use contribute to the growth of developing economies and improved quality of life for their citizens, and likely reinforce movements toward more peaceful democratic societies.
Table 2: A Snapshot of Energy’s Linkages to the Millennium Development Goals MDG Energy Linkages
1 Eradicate extreme poverty and hunger
Employment generation, increased industrial development, agricultural processing, refrigeration and transport of crops
2 Achieve universal primary education
Lighting, television, and communications can help improve the delivery of education services and attract teachers to isolated rural areas. Relieve physical labor so young girls have time to attend school.
3 Promote gender equality and empower women
Women are responsible for most household cooking and water-boiling activities. This takes time away from other productive activities as well as from educational and social participation.
4 Reduce child mortality Diseases and illnesses resulting from unboiled water and indoor air pollution from traditional fuels and stoves directly contribute to infant and child disease and mortality.
5 Improve maternal health Women are disproportionately affected by indoor air pollution and water- and food-borne illnesses. Daily drudgery and physical burden of fuel collection and transport contribute to poor maternal health conditions, especially in rural areas.
6 Combat HIV/AIDS, malaria, and other diseases
Electricity for communication can spread important public health information. Health care facilities require illumination, refrigeration, sterilization, to deliver health services.
7 Ensure environmental sustainability
Cleaner energy systems and improved energy efficiency are needed to address all detrimental effects of energy production, distribution and consumption. National and local policies are needed to ensure the mitigation of environmental impacts associated with the use of fossil and non-sustainable fuel supplies.
8 Develop a global partnership for development
Partnerships are essential for increasing energy access and supply to help meet the MDGs.
Source: Adapted from Energizing the Millennium Development Goals: A Guide to Energy’s Role in Reducing Poverty. United Nations Development Programme, 2005.
An investment in appropriate energy development bears fruit in both national economic development and individual economic security. Growing economies depend on secure energy supplies; energy-deficient economies seek out the necessary resources to fuel their development, and many strategic relationships are built on a foundation of energy trade. Secure energy supplies and basic infrastructure provide the framework for economic transformation. Access to modern energy services propels industrial development and supports commercial development. Energy supports the backbone of transportation and communications infrastructure that frames economic development and supports the functioning of government. Thus, energy can help in the process of building and sustaining democratic, well-governed states that are also capable of responding to the needs of their people.

THE ROLE OF ENERGY IN DEVELOPMENT 14
ANNEX1
* Purchasing Power Parity is defined as the numbers of units of a country’s currency needed to buy in the country the same amounts of goods and services as, say, one US dollar would buy in the United States. They are computed on the basis of data collected in benchmark surveys, which are undertaken usually every five years but sometimes even longer.24
Using LogValue
Using ActualValue
Agriculture value added per worker 75.9% 39.1% Agriculture, value added (% of GDP) -57.8% -62.7% GDP per capita (constant 2000 US$) 71.0% 56.3% GDP per capita, PPP (constant 2000 international $) 73.3% 63.3% GNI per capita, Atlas method (current US$) 72.5% 56.7% GNI per capita, PPP (current international $) 73.7% 63.6% Female adults with HIV (% of population ages 15-49 with HIV) -65.0% -72.6% Prevalence of HIV, total (% of population ages 15-49) -73.5% -44.4% Immunization, measles (% of children ages 12-23 months) 64.9% 67.8% Poverty gap at $2 a day (Purchasing Power Parity) (%)* -73.3% -88.6% Poverty gap at $1 a day (Purchasing Power Parity) (%) -83.9% -72.3% Long-term unemployment (% of total unemployment) 77.4% 90.5% Life expectancy at birth, female (years) 83.6% 86.0% Life expectancy at birth, total (years) 82.5% 84.6% Urban population (% of total) 69.2% 69.3% Energy Intensity (Total Primary Energy Consumption Per $ of GDP) 61.1% 55.7% Education, primary completion rate, boys 73.0% 74.4% Education, primary completion rate, girls 73.7% 76.4% Girls to boys ratio, primary level enrollment 55.3% 55.6% Children under five mortality rate per 1,000 live births -55.9% -56.9% Infant mortality rate (per 1,000 live births) (Richest/Poorest 20%) -65.4% -66.3% Reported Maternal Mortality -83.9% -88.0% Adjusted Maternal Mortality -82.8% -85.6% Literacy rate, adult female (% of females ages 15 and above) 67.0% 71.2% Literacy rate, adult male (% of males ages 15 and above) 69.3% 72.6% Literacy rate, adult total (% of people ages 15 and above) 69.3% 72.9% Literacy rate, youth female (% of females ages 15-24) 65.7% 69.8% Literacy rate, youth male (% of males ages 15-24) 69.5% 72.7% Literacy rate, youth total (% of people ages 15-24) 68.3% 71.8% Log(HDI) 86.7% . Actual(HDI) 89.4% 89.4%
Correlation of Electricity Access (% of Population) to Selected Indicators

THE ROLE OF ENERGY IN DEVELOPMENT 15
Metric All High Medium LowAgriculture value added per worker 83.4% 48.5% 46.3% 46.6%Agriculture, value added (% of GDP) -74.7% -12.6% -63.3% -18.8%GDP per capita (constant 2000 US$) 86.7% 55.1% 60.2% 17.2%GDP per capita, PPP 89.9% 43.1% 74.5% 32.0%GNI per capita, Atlas method 87.8% 51.7% 66.9% 21.1%GNI per capita, PPP 90.1% 45.5% 74.8% 33.4%Prevalence of HIV, total (% of population ages 15-49) -51.9% -14.6% 0.3% -70.3%Immunization, measles (% of children ages 12-23 months) 61.5% 15.4% 34.4% 62.5%Poverty gap at $2 a day (PPP) (%) -76.8% . -52.3% -83.0%Poverty gap at $1 a day (PPP) (%) -81.4% . -48.4% -86.6%Long-term unemployment (% of total unemployment) -9.9% -36.7% 67.6% .Unemployment, total (% of total labor force) -21.2% -29.8% 23.4% 64.7%Life expectancy at birth, female (years) 72.6% -2.2% 18.3% 66.7%Life expectancy at birth, total (years) 72.4% 3.7% 13.6% 65.7%Urban population (% of total) 72.6% 30.4% 42.0% 56.0%Energy Intensity (Total Primary Energy Consumption Per $ of GDP) 6.8% 31.5% 46.5% 78.5%Education, primary completion rate, girls 65.4% -35.1% 25.9% 70.1%Girls to boys ratio, primary level enrolment 64.5% 35.2% 13.3% 58.6%Women to men parity index, as ratio of literacy rates, aged 15-24 60.8% 43.5% 24.3% 46.9%Infant mortality rate (per 1,000 live births) (Richest/Poorest 20%) -60.3% . 8.8% -39.5%Reported Maternal Mortality -84.5% 6.8% -68.5% -81.7%Adjusted Maternal Mortality -85.1% -3.0% -62.4% -85.0%Literacy rate, adult female (% of females ages 15 and above) 68.5% -49.3% 36.2% 69.6%Literacy rate, adult male (% of males ages 15 and above) 65.5% -18.1% 40.0% 66.5%Literacy rate, adult total (% of people ages 15 and above) 69.0% -31.1% 40.4% 69.7%Literacy rate, youth female (% of females ages 15-24) 69.0% -6.1% 41.6% 66.7%Literacy rate, youth male (% of males ages 15-24) 69.5% 18.9% 55.0% 63.3%Literacy rate, youth total (% of people ages 15-24) 70.2% 11.0% 48.8% 66.6%HDI 87.6% 29.8% 55.4% 76.7%
Income Per Capita Ranking**
Correlations of Electric Power Consumption (kWh per Capita) to Selected Indicators
** Income ranking based on Work Bank definition using 2003 GNI per capita: Low- $765; Medium $766 to $9,385 or less; High >$9,386
*Data for 2003 - All Values Converted to Log Prior To Analysis

THE ROLE OF ENERGY IN DEVELOPMENT 16
Correlations of Energy Use (kg of oil equivalent per Capita) to Selected Indicators Income Per Capita Ranking*
Metric All High Medium Low Agriculture value added per worker 80.8% 51.0% 34.9% 49.8%
Agriculture, value added (% of GDP) -
77.5%-
11.5% -72.5% -4.7%GDP per capita (constant 2000 US$) 86.7% 42.0% 61.4% 21.2%GDP per capita, PPP 88.0% 32.2% 73.2% 20.5%GNI per capita, Atlas method 87.4% 36.2% 68.2% 18.8%GNI per capita, PPP 87.8% 32.3% 72.7% 20.2%
Poverty gap at $2 a day (PPP) (%) -
65.2% . -55.2% 10.5%Urban population (% of total) 70.6% 36.0% 42.8% 63.2%
Reported Maternal Mortality -
80.2% 22.4% -58.8%-
82.1%
Adjusted Maternal Mortality -
78.5% 20.3% -50.4%-
82.0%HDI 76.0% 6.8% 46.4% 69.8%*Data for 2003 - All Values Converted to Log Prior To Analysis ** Income ranking based on Work Bank definition using 2003 GNI per capita: Low- $765; Medium $766 to $9,385 or less; High >$9,386

THE ROLE OF ENERGY IN DEVELOPMENT 17
ENDNOTES 1 Modern energy (also referred to as commercial energy) is widely defined to include electricity and processed gaseous, liquid and solid fuels. An important characteristic of modern energy is that it can be converted efficiently to provide energy services such as lighting, heating, cooling, refrigeration, mechanical power, communications, etc. In contrast, traditional fuels are generally gathered (rather that bought) and include non-sustainable fuel wood, charcoal, agricultural residues and animal dung. Traditional fuels are primarily used for cooking, heating and in some cases lighting.
2 The data used in this analysis are from publications of the World Bank, agencies of United Nations (UN), Energy Information Administration (EIA), and International Energy Agency (IEA).
3 The Human Development Index (HDI) is comprised of a number of indicators tracked by the UN that collectively represent quality of life. Criteria include life expectancy, educational attainment, and adjusted real income. Figure 2 shows that there are no countries with an HDI above 0.8 that have per capita levels of electricity use below 1,000 kWh/person-year. For countries with per capita energy consumption below 100 kWh/person/year, the HDI is between 0.3 and 0.6 for all but a few countries with HDIs between 0.6 and 0.7.
4 The Pearson correlation coefficient is a measure of how well a linear equation describes the relation between two variables X and Y. The coefficient ranges from −1 to +1. A value of +1 shows that a linear equation describes the relationship perfectly and positively, with all data points lying on the same line and with Y increasing with X. A score of −1 shows that all data points lie on a single line but that Y increases as X decreases. A value of 0 shows that a linear model is inappropriate—that there is no linear relationship between the variables.
5 The Vulnerability of African Countries to Oil Price Shocks: Major Factors and Policy Options – The Case of Oil Importing Countries, Robert Bacon and Adib Mattar, Report 308/05, Energy Sector Management Assistance Program, The World Bank, August 2005.
6 Ambassador Tobias, Director of Foreign Assistance, Address to USAID Staff, April 3, 2006.
7 Income ranking based on World Bank definition, using 2003 GNI per capita. Low income indicates GNI per capita of $765 or less; middle income indicates GNI per capita of $766-$9,835; high income indicates GNI per capita greater than $9,385.
Note: This is a log-log plot of per capita electric power consumption vs. GDP (in $PPP). In a log-log plot, the x- and y-axis numbers 0, 1, 2, 3, 4 … correspond to 1, 10, 100, 1,000, 10,000…
8 International Energy Outlook 2005, US Energy Information Administration.
9 Modern energy access, however, is not a guarantee for poverty reduction or economic development. The quality, reliability, and affordability of electricity and fuel services all impact the degree to which individuals, enterprises, and communities can make use of the energy to which they have access. Capacity building, institutional support, and technical assistance must accompany energy access provision so that developing country citizens, businesses, and economies can capture all of the benefits of modern energy supply. Initiatives to improve/reform energy sector structure and operation, to tailor technologies employed to the targeted population, and to ensure the financial viability of energy delivery systems and access to economically vulnerable populations ensure that the full benefit of access to commercial energy is realized.
10 Enough power to meet the annual consumption needs of about 1,100 homes. A generator with capacity of one megawatt produces one-megawatt hour (MWh) when it runs consistently for one hour. Thus, if it runs consistently for a year (24 hours x 365 days) it produces 8,760 MWh (8,760,000 kWh) in a year.
THE ROLE OF ENERGY IN DEVELOPMENT 18
11 The Impact of Electricity Supply on Economic Growth in Sri Lanka, R. Morimoto and C. Hope, the Judge Institute of Management Studies, Trumpington Street, Cambridge CB2 1AG, WP 24/2001. The Pearson correlation coefficient between growth in annual electricity use and average annual economic growth for Sri Lanka during the period 1971 – 1995 is 0.993 (Ferguson et al, 2000). Their analysis uses electricity consumption in kWh as the energy use variable and GDP (Gross Domestic Product) at PPP (purchasing power parities) in 1995 US dollars. The Morimoto and Hope paper does not provide information on the cost of providing each additional MWh or electricity supply. Generally, the amortized cost of hydro (the predominant power source in Sri Lanka) is $40-$50/MWh.
12 Export diversification is measured as 1 minus the HHI Index. The Infrastructure Index is made up of transport, energy, telecommunications, and access to information. Data are available for 18 countries in the Trade Competitiveness Index database. The countries are Algeria, Argentina, Bolivia, Brazil, Cameroon, Chile, Ethiopia, Ghana, Indonesia, Kenya, Malaysia, Morocco, Nigeria, Senegal, South Africa, Thailand, Tunisia, and Zimbabwe. The correlation is significant at the 5% level of significance—with a correlation coefficient of 0.405 and a p-value of 0.05. Source: ECA Trade Competitiveness Index data; cited in “Chapter 4: Poor Energy Infrastructure Hobbles Export Diversification,” Economic Report on Africa 2004, UN Economic Commission for Africa.
13 1.5% increase in GDP X .5% reduction in people living in poverty per percentage increase in GDP = .75% reduction in number of people living in poverty. “Making Infrastructure Reform Work for the Poor: Policy Options based on Latin American Experience,” Antonio Estache, Vivien Foster, Quentin Wodon, LAC Regional Studies Program, WBI Studies in Development, Finance, Private Sector and Infrastructure Department, 2001.
14 Economic and Social Impact Evaluation Study of the Rural Electrification Program in Bangladesh, USAID, Dhaka, October 2002.
15 Alan D. Pasternak, Lawrence Livermore National Laboratory, “Global Energy Futures and Human Development: A Framework for Analysis”, October 2000. Study of 60 populous countries comprising 90 percent of the world’s population. These are the 60 most populous countries in the world, not including Taiwan, Afghanistan, and North Korea, for which the UN does not report human development indicators or indices. This 60-nation sample, totaling 5.7 billion people, accounted for about 90 percent of the world’s population, primary energy consumption, and electricity consumption in 1997. Sources for figure: Human Development Report 1999, United Nations Development Programme, Table 1: International Net Electricity Consumption Information, Energy Information Administration, U.S. Department of Energy, http://www.eia.doe.gov/pub/international/iealf/table62.xls, International Data Base, U.S. Bureau of Census, http://www.census.gov/ipc/www/idprint.html.
16 Supra, n. 4, at 12.
17 World Energy Assessment: Energy and the Challenge of Sustainability, 2000, p. 49.
18 Achieving the Millennium Development Goals: The Role of Energy Services, United Nations Development Programme, January 2005, pp. 41-45
19 The Vulnerability of African Countries to Oil Price Shocks: Major Factors and Policy Options, the Case of Oil Importing Countries, Energy Sector Management Assistance Program, Report No. 308/05, August 2005.
Ten Sub-Saharan Africa countries that were net oil exporters in 2003 were excluded from the analysis (Equatorial Guinea, Republic of Congo, Angola, Gabon, Nigeria, Chad, Sudan, Cameroon, Democratic Republic of Congo, and Cote d’Ivoire). Every other country imported all its oil and oil products, with the exception of South Africa and Ghana, which produced a small amount of oil.
20 Paul E. Simons, Deputy Assistant Secretary for Energy, Sanctions, and Commodities, Statement before the Committee on Government Reform, U.S. House of Representatives, Washington, DC, May 16, 2006.
21 Analysis of the Relationship between Improved Energy Sector Governance and the Attraction of Foreign Direct Investment, A report for the Office of Energy and Information Technology, USAID, January 2002, p. 5-5. Countries studied were: Argentina, Armenia, Brazil, Chile, Colombia, Egypt, El Salvador, Georgia, Ghana, Guatemala, Hungary, India, Indonesia, Kazakhstan, Laos, Morocco, Nepal, Nigeria, Pakistan, Philippines, Thailand, Tunisia, and Turkey. Easterly and Levine

THE ROLE OF ENERGY IN DEVELOPMENT 19
(2002) found that the quality of institutions, endowments, and policies has a significant influence on economic development (in terms of GDP per capita). While country endowments and macroeconomic policies were not found to have a significant effect on development country endowments do have an indirect effect through their influence on the quality of institutions.
22 For example, “The people we (public officials) serve are citizens as well as consumers, and they are entitled to public utility services that address their needs and concerns as citizens, not just their pocketbook concerns as ratepayers. As citizens, we share common concerns about the health of the environment, the well-being of our neighbors, the security of the nation, and the needs of future generations.” Richard Cowart, “Restructuring and the Public Good,” The Electricity Journal, April 1997, p. 53.
See also Daniel Yergin and Joseph Stanislaw, The Commanding Heights, The Battle between Government and the Marketplace That is Remaking the World, Simon and Schuster, New York, 1998, “The economic tests are eminently measurable....The second set of tests cannot be expressed in figures, but it is no less powerful. It goes to the basic values by which people judge the world, the system in which they live, and their own lot....How widely shared is the success? Is the system fair and just? Or does it disproportionately benefit the rich and the avaricious at the expense of the hardworking of more modest circumstances? Does it treat people decently, and does it include the disenfranchised and the disadvantaged? Are there equity, fair play and opportunity?”, p. 383.
23 Derick W. Brinkerhoff, Democratic Governance and Sectoral Policy Reform: Linkages, Complementarities, and Synergies, Monograph No. 5, Implementing Policy Change Project (Washington, DC. U.S. Agency for International Development 1998), p. 13.
24 Statistically, Purchasing Power Parity (PPP) calculations are expenditure-weighted averages of relative prices of a vast number of goods and services on which people spend their incomes. By eliminating price differences, PPPs yield comparisons based on real quantities1 of goods and services. As the PPPs are adjusted over time (between surveys) by relative rates of inflation, they also track movements in real quantities over time. “Purchasing Power Parity”, Committee for Development Policy, Seventh Session, 14-18 March 2005, Note by the Secretariat, http://www.g24.org/PPPNote.pdf