Sustainable Energy Scenarios and the Role of Renewable Energy
22
Sustainable Energy Scenarios and the Role of Renewable Energy Renewable Energy: From Analysis to Action A workshop hosted by Ryan Katofsky, Matthew Stanberry & Lisa Frantzis Navigant Consulting, Inc. A workshop hosted by IEA Renewable Energy Working Party & IEA Renewable Energy Technology Deployment Implementing Agreement 15‐ ‐ ‐16 March 2011 OECD Conference Center 2, rue André Pascal 75016 Paris
Transcript of Sustainable Energy Scenarios and the Role of Renewable Energy

Sustainable Energy Scenarios and the Role of Renewable Energy
Renewable Energy: From Analysis to ActionA workshop hosted by
Ryan Katofsky, Matthew Stanberry & Lisa Frantzis
Navigant Consulting, Inc.
A workshop hosted byIEA Renewable Energy Working Party &
IEA Renewable Energy Technology Deployment Implementing Agreement
15‐‐‐‐16 March 2011OECD Conference Center
2, rue André Pascal75016 Paris

Since 2007, RETD has been examining the role of RE and climate change in global energy system modeling.
Overview of RETD Activities
Expert input & peer review
• WEO 2008, 2009 & 2010
• ETP 2008 & 2010
Independent scenario modeling and analysis
• Aggressive climate action (400ppm CO2-eq)
• Initial integration of security issues
• Climate change adaptation & fossil fuel dependence20
30
40
50
60
70
Th
ou
san
d T
Wh
/ye
ar
Electricity Generation in the RETD
ACES Scenario
Renewable
Nuclear
Gas & Oil-CCS
Coal-CCS
Gas & Oil-no CCS
Coal-no CCS
www.iea-retd.org1
• Climate change adaptation & fossil fuel dependence
Moving from analysis to action
• Strategies to accelerate near-term RE deployment
0
10
2010 2020 2030 2040 2050 2060
0
50
100
150
200
250
20102011201220132014201520162017201820192020

The evolving energy system has made modeling more complex, yet more important than ever.
RETD Scenarios – Project Rationale
Historical Modeling Focus Current Modeling Topics
• Energy supply & demand
• Climate change mitigation
• Energy security
• How to achieve price stability
• Large-scale, slowly changing technologies
• Traditional business
• Rising role of RE & DG
• Potential for disruptive change
www.iea-retd.org2
• Traditional business models/economic analysis
• Energy system modeled in isolation
• New business models
• Comprehensive costs & benefits of energy system transformation

The IEA’s work on energy system modeling has evolved significantly in the last three years.
RETD Scenarios – Perspectives on WEO and ETP
Critical Issue Key Progress Made Remaining Concerns & Needs
Scenario • Better scenario definitions • Scenarios with deeper GHG cutsScenarioFraming
• Better scenario definitions
• Full modeling of 450ppm scenario
• Scenarios with deeper GHG cuts
• Explicit consideration of security
Transparency• Better dissemination of detailed
results for all scenarios and technology assumptions
• Presentation of energy system costs is incomplete
• Key message (that climate change mitigation is a “bargain”) is not clear enough
Role of RE• More robust assessment of role
of RE
• Results still underestimate likely REcontribution
www.iea-retd.org3
Role of REof RE
contribution
• Fossil fuel technology costs too low
Modeling full costs and benefits
• Need for action on GHG reduction is clearly articulated
• Specific benefits are increasingly covered in WEO and ETP discussion (but not modeled)
• Emphasis is still on “cost” of mitigation and assumed GDP loss.
• Need models capable of quantifying all costs & benefits for a complete economic picture

The WEO 2010 wind projections appear conservative, even for the 450 Scenario.
120Actual Annual Additions (GWEC)
BTM Forecast (March 2010)
RETD Scenarios – Perspectives on WEO and ETP
20
40
60
80
100
GW
pe
r ye
ar
BTM Forecast (March 2010)
WEO 2010, 450 Scenario
WEO 2010, New Policies Scenario
www.iea-retd.org4
0
20
2002
2003
Notes:• BTM Consult is a leading market research firm with a strong track record of accurate wind market forecasts.• New Policies Scenario estimated from Figure 7.8• 450 Scenario from Table 14.1

The WEO 2010 PV projections suggest markets will be below current levels at least through 2020.
RETD Scenarios – Perspectives on WEO and ETP
80
90
Actual Annual Additions
20
30
40
50
60
70
80
GW
pe
r ye
ar
Navigant - Accelerated
Navigant - Conservative
WEO 2010, 450 Scenario
WEO 2010, New Policies Scenario
www.iea-retd.org5
0
10
20
2002
2003
2004
2005
2006
2007
2008
2009
2010
2011
2012
2013
2014
2015
2016
2017
2018
2019
2020
2021
2022
2023
2024
2025
2026
2027
2028
2029
2030
2031
2032
2033
2034
2035
Notes:• Navigant data are corrected using a DC-AC conversion efficiency of 82%• WEO 2010 New Policies Scenario estimated from Figure 7.8.• WEO 2010 450 Scenario estimated from Table 14.1.
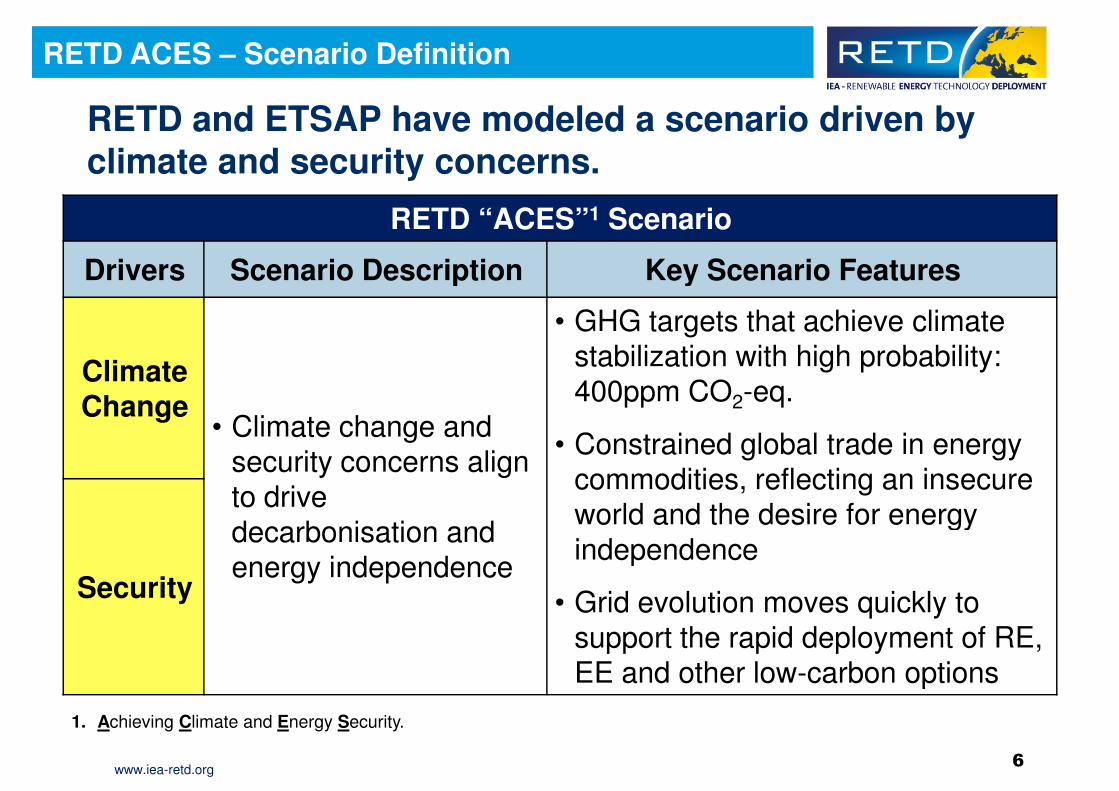
RETD and ETSAP have modeled a scenario driven by climate and security concerns.
RETD ACES – Scenario Definition
RETD “ACES”1 Scenario
Drivers Scenario Description Key Scenario FeaturesDrivers Scenario Description Key Scenario Features
Climate Change
• Climate change and security concerns align to drive decarbonisation and
• GHG targets that achieve climate stabilization with high probability: 400ppm CO2-eq.
• Constrained global trade in energy commodities, reflecting an insecure world and the desire for energy
www.iea-retd.org6
decarbonisation and energy independence
world and the desire for energy independence
• Grid evolution moves quickly to support the rapid deployment of RE, EE and other low-carbon options
Security
1. Achieving Climate and Energy Security.

In the RETD ACES scenario, GHG concentrations peak around 2030.
� Entire system is CO2 free by about 2060
RETD ACES – Emissions
49040
Energy & Non-Energy GHG
Emissions in the RETD ACES Scenarioby about 2060
� Energy system CO2
reductions (incl. Bio-CCS)
� Decreased emissions from land use change
� Reforestation N2O 470
475
480
485
490
15
20
25
30
35
40
Pa
rts
Pe
r M
illi
on
CO
2 E
qu
iva
len
t
Gig
ato
nn
es
CO
2 E
qu
iva
len
t
488 CO2-eq
www.iea-retd.org
� CH4 and N2O emissions are consistent with aggressive, published scenarios
7
CO2CH4
455
460
465
0
5
10
15
2010 2020 2030 2040 2050 2060
Pa
rts
Pe
r M
illi
on
CO
2 E
qu
iva
len
t
Gig
ato
nn
es
CO
2 E
qu
iva
len
t

By 2060, RE produces 70% of all electricity.
� Electricity is virtually decarbonized by 2030.
RETD ACES – Electricity
70
Electricity Generation in the RETD
ACES Scenario
Renewabledecarbonized by 2030.
� CCS’s technological uncertainty is a critical issue, given its role (incl. biomass-CCS).
� Rapid electricity decarbonization
30
40
50
60
Th
ou
san
d T
Wh
/ye
ar
Renewable
Nuclear
Gas & Oil-CCS
Coal-CCS
Gas & Oil-no CCS
Coal-no CCS
www.iea-retd.org
decarbonization promotes increased share in buildings, industry and transport.
8
0
10
20
2010 2020 2030 2040 2050 2060
Th
ou
san
d T
Wh
/ye
ar

RETD ACES – Transportation Fuels
The transportation fuel mix changes more slowly, but petroleum use is cut >50% by 2050.
120
Transportation Final Energy Demand in the RETD ACES Scenario
40
60
80
100
120
PJ
/yr
in the RETD ACES Scenario
Oil Products
Coal (direct use)
Natural Gas (direct use)
Electricity
Hydrogen
Second Generation Biofuels
First Generation Biofuels
www.iea-retd.org 9
0
20
2010 2020 2030 2040 2050 2060
First Generation Biofuels
Rising efficiency helps keep total transport energy demand growth to a minimum.

Achieving 400 ppm CO2-eq is feasible but requires immediate and significant action.
� RE becomes the dominant energy source after 2030
RETD ACES – Key Results
� A strong shift to more electricity use is key, incl. transport
� Enabling technologies (e.g., Smart Grid, CCS) are critical
� Uncertainty regarding them must be better understood.
� Biomass utilization is at the upper end of its technical potential
www.iea-retd.org
potential
� Incremental net present value cost is less than 1% of cumulative global GDP through 2060.
� Models need additional improvements
10

The direct net costs of climate change mitigation are small to negative.
Conclusions – Energy Modelling Economics
Incremental Investments and Savings over “Reference” Scenarios ($ trillion)
Scenario TimeframeIncremental Incremental
Net Costs (Savings)Scenario TimeframeIncremental Investments
Incremental Savings
Net Costs (Savings)
WEO 2009 450
2010-2030 $10.5 $17.1• ($6.6) undiscounted• ($0.45) at 10% disc. rate
WEO 2010450
2010-2035 $18 Not provided • Not provided
ETP 2010 Blue MAP
2010-2050 $46 $112• ($66) undiscounted• ($8) at 10% disc. rate
www.iea-retd.org11
RETD ACES
2010-2060 • $14 net costs at 5% discount rate
Some points of comparison:• Total annual global GDP: ~$60 trillion• Total annual US military spending: ~$660 billion• Estimated annual US environmental & health costs of fossil fuel use: $120-350 billion

RETD is examining climate adaptation and fossil fuel dependence costs to complete the economic picture.
� Current global energy system models:
RETD Research – Complete Cost/Benefit Information
� Current global energy system models:
� Underestimate RE benefits (and therefore the market)
� Overestimate the net costs of GHG reductions
� Global economic models used to examine climate adaptation and damage costs oversimplify the modeling of the energy sector.
www.iea-retd.org
� RETD would therefore like to see “externalities” better incorporated into detailed energy system models.
12

Climate change adaptation & damage, and fossil fuel dependence cover many elements.
Fossil Fuel Dependence Costs
• Wealth transfer
Adaptation & Damage Costs
• Sectoral impacts (e.g., forestry,
RETD Research – Complete Cost/Benefit Information
• Wealth transfer
• Above market prices (producers have market power)
• Economic losses from price shocks
• Price volatility
• Sectoral impacts (e.g., forestry, agriculture, tourism)
• Water supply
• Infrastructure hardening (coastal protection, energy)
• Ecosystem impacts
www.iea-retd.org13
• Military expenditures
• Health & environmental impacts
• Extreme weather events
• Human health
• Potential conflicts and human migration

The complete economic picture shows the cost of NOT modernizing the energy system is tremendous.
RETD Research – Complete Cost/Benefit Information
$24
$ t
rill
ion
(u
nd
isc
ou
nte
d)
Potential avoided fossil fuel dependence costs
from U.S. alone
Indicative Costs and Benefits of GHG Mitigation: 20-year Estimates
$4
$8
$12
$16
$20
$ t
rill
ion
(u
nd
isc
ou
nte
d)
Net savingsfrom GHG mitigation Potential avoided
adaptation costs
from U.S. alonePotential avoided
residual damages costs
www.iea-retd.org14
• Mitigation costs include lifetime energy cost savings of investments made for 2010-2030.• Adaptation costs are based on annual estimates for the 2030 timeframe but are likely significant underestimates.• U.S. fossil fuel dependence costs are for military, non-climate environmental/health, and general macroeconomic costs.
$0Global GHG Mitigation
(WEO 2009 450)Global Climate Change
AdaptationGlobal Climate Change
Residual DamagesU.S. Fossil Fuel
Dependence
$ t
rill
ion
(u
nd
isc
ou
nte
d)
Mitigation costs (positive number indicated net savings)
Low end of cost range
High end of cost range

There is still a lot to do on climate change adaptation.
� Different studies not easily compared
Insufficient info leads to high uncertainty in estimates
RETD Research – Climate Change Adaptation
� Insufficient info leads to high uncertainty in estimates
� Disagreement on appropriate discount rates
� Often not quantified are:
� Mining, manufacturing, retail, & tourism sectors
� Catastrophic events (low-probability/high-impact)
www.iea-retd.org
� Violent conflict and migration
� Impacts beyond 2100
� Existing estimates may underestimate impacts by 2-8x.
15

Fossil fuel dependence cost estimates also have large gaps.
� Quantification of price volatility impacts
RETD Research – Fossil Fuel Dependence
� Quantification of price volatility impacts
� Most studies cover only selected elements, regions, or countries
� Limited work on coal and natural gas dependence
� Coal environmental and health impacts may exceed the market value of the coal produced.
www.iea-retd.org
value of the coal produced.
� Actual oil price increases have exceeded those analyzed
16

Analysis of the relative economics of scenarios must include a complete set of costs and benefits.
� Adaptation, damages and fossil fuel dependence costs are significant, underappreciated and underestimated.
Conclusions – Adaptation & Fossil Fuel Dependence
are significant, underappreciated and underestimated.
� Combined, they are likely on the order of $1 trillion/yr
� Mitigation investments can easily be “paid for” by reduced adaptation, damages and reduced fossil fuel dependence
� There is a lot more work to be done to fully quantify
www.iea-retd.org
� There is a lot more work to be done to fully quantify these costs and find a way to incorporate them into
� Energy system modeling
� Decision-making
� Policy development
17

There is a need to accelerate RE deployment.
� Despite the compelling opportunity, RE deployment is not happening fast enough.
Conclusions – From Analysis to Action
� Numerous barriers are preventing more rapid RE deployment
� There is a need to do something significant in the near term (next 5 years) to dramatically accelerate RE deployment.
www.iea-retd.org
� The RETD is developing such a strategy.
18

Notice
RETD NoticeThe RETD is comprised of ten countries: Canada, Denmark, France, Germany, Ireland, Italy, Japan, the Netherlands, Norway, and the United Kingdom. Hans Jørgen Koch, Deputy State Secretary, Ministry of Climate and Energy, Danish Energy Agency, serves as Chair of the RETD.
The RETD Implementing Agreement is one of a number of Implementing Agreements on renewable energy under The RETD Implementing Agreement is one of a number of Implementing Agreements on renewable energy under the framework of the International Energy Agency (IEA). The creation of the RETD Implementing Agreement was announced at the International Renewable Energy Conference in Bonn, 2004.
The IEA Implementing Agreement functions within a framework created by the IEA. Views, findings and publications of the RETD do not necessarily represent the views or policies of the IEA Secretariat or all of its individual member countries.
Navigant Consulting NoticeThis report was prepared by Navigant Consulting, Inc. for the exclusive use of The Renewable Energy Technology Deployment Implementing Agreement - whom supported this effort. The work presented in this report represents our best efforts and judgments based on the information available at the time this report was prepared. Navigant
www.iea-retd.org20
our best efforts and judgments based on the information available at the time this report was prepared. Navigant Consulting, Inc. is not responsible for the reader’s use of, or reliance upon, the report, nor any decisions based on the report.
NAVIGANT CONSULTING, INC. MAKES NO REPRESENTATIONS OR WARRANTIES, EXPRESSED OR IMPLIED.
Readers of the report are advised that they assume all liabilities incurred by them, or third parties, as a result of their reliance on the report, or the data, information, findings and opinions contained in the report.

Historically, BTM forecasts have mostly underestimated actual wind capacity additions.
70
80
RETD Scenarios – Perspectives on WEO and ETP
30
40
50
60
70
GW
pe
r ye
ar
Actual wind power additions
BTM Forecasts
www.iea-retd.org21
0
10
20
2002 2003 2004 2005 2006 2007 2008 2009 2010 2011 2012 2013 2014
BTM Forecasts