The Road Home Week 18 Situation & Pipeline Report and Pipeline Reports...Weekly Situation & Pipeline...
20
The Road Home Week 18 Situation & Pipeline Report November 8, 2006
Transcript of The Road Home Week 18 Situation & Pipeline Report and Pipeline Reports...Weekly Situation & Pipeline...
The Road Home Week 18 Situation & Pipeline
Report
November 8, 2006
Weekly Situation & Pipeline Report Week 18
October 31 – November 6, 2006
i
Table of Contents
EXECUTIVE SUMMARY ................................................................................................... 2
State Assistance Required .................................................................................................. 2
Deliverables ....................................................................................................................... 2
HOMEOWNER PROGRAM ................................................................................................ 3
Housing Assistance Center Activity .................................................................................. 5
Award Calculation Activity ............................................................................................... 5
Data Verification Activity.................................................................................................. 5
Home Evaluations (Home Inspection) Activity ................................................................. 5
Call Center Activity ........................................................................................................... 6
Mailroom/Data Entry Activity ........................................................................................... 6
Housing Assistance Center Appointment Activity ............................................................ 7
Supporting Function Activity ............................................................................................ 9
SMALL RENTAL PROGRAM .......................................................................................... 10
HAZARD MITIGATION GRANT PROGRAM (HMGP) ................................................. 11
PROGRAM SUPPORT STATUS ....................................................................................... 11
LOGISTICS, FACILITIES, & SECURITY .................................................................... 11
HUMAN RESOURCES .................................................................................................. 11
POLICY & PLANS ......................................................................................................... 11
TRAINING ...................................................................................................................... 12
EXTERNAL AFFAIRS ................................................................................................... 12
Community Outreach ................................................................................................... 12
Communications .......................................................................................................... 12
Public Information ....................................................................................................... 12
MIS .................................................................................................................................. 13
ANTI-FRAUD, WASTE, AND ABUSE ........................................................................ 13
QUALITY ASSURANCE AND CONTROL ................................................................. 13
COMPLIANCE................................................................................................................ 14
SPECIAL NEEDS TEAM ............................................................................................... 14
APPENDIX A ...................................................................................................................... 15
APPENDIX B ...................................................................................................................... 17
APPENDIX C ...................................................................................................................... 18
GLOSSARY ........................................................................................................................ 19

Weekly Situation & Pipeline Report Week 18
October 31 – November 6, 2006
2
EXECUTIVE SUMMARY
The Road Home Program continues to make progress toward serving the residents of
Louisiana.
The Homeowner Assistance Program saw 3,051 applicants this week; averaging 436 per
day for all Centers. The Program closed three previously scheduled Homeowners (from
last week) this week on awards totaling $202,488 ($67,496 average award). The three
additional closings bring the total to 20 Homeowner closings.
The Homeowner program also added capacity to existing Centers by hiring 62 additional
advisors. The Evaluations Team issued 2,705 work orders for home inspections and
conducted 1,924 inspections for the period. In addition, the data entry team completed the
backlog of paper applications and entered them into the grants software.
The Rental Assistance Program continued to recruit staff and refine Program designs. The
Program began gathering requirements for the Property Owner application process and
construction of the implementation and risk assessment plans. The Program requires
additional input from OCD to proceed with final design of the program. The notice of
funds available for Round 1 for Program funding is estimated to be February 15.
The Hazard Mitigation Grant Program also continued to refine Program designs and recruit
staff. In addition, GOHSEP submitted the HMGP Acquisition application to FEMA and
the Individual Mitigation Measures (IMM) application is scheduled for delivery to OCD
November 9th
. Individual Mitigation Measures training has begun with the integration of
mitigation measures into evaluator training.
Quality Assurance compiled survey data representing approximately 25% of applicants
seen from around the State and found that 93% of respondents rated their overall
experience with The Road Home Program as good or excellent. Also, The Road Home
signed the Houston Center building lease this week and hired 19 additional staff for the
Center, which is scheduled to begin operation November 15th
.
State Assistance Required
Policy and Plans: Waiting to hear back from OCD on finalizing the amendments to
the action plan for Homeowner
Rental: Require first of recommended four meetings with OCD to resolve program
issues and approve decision checklist
Deliverables
Del. ID Deliverables Date
00002 Cash Flow Projection and Financial Dashboard 11/6/2006
00025 Combined Weekly & Pipeline Report 10/31/2006
00028 Additional Housing Assistance Center and Mobile Unit Plan 11/1/2006
00029 Anti-Fraud, Waste and Abuse Policies and Procedures 11/1/2006
00030 Automated Scheduling Software online and operational 11/3/2006

Weekly Situation & Pipeline Report Week 18
October 31 – November 6, 2006
3
HOMEOWNER PROGRAM
APPOINTMENT
LETTERS SENT
APPOINTMENTS
COMPLETED
51,886 60,557 8,671
25,162 34,300 9,138
16,370 19,356 2,986
ONLINE IN SYSTEM 38,741 40,197 1,456
MAIL IN SYSTEM 22,803 38,474 15,671
PHONE IN SYSTEM 0 24 24
TOTAL IN SYSTEM 61,544 78,695 17,151
RECEIVEDRECEIVED 77,28177,281 78,69578,695 1,4141,414
APPOINTMENTS
SCHEDULED
AP
PL
ICA
TIO
NS
AP
PO
INT
ME
NT
S
CUMULATIVE
As of 10/30
CUMULATIVE
As of 11/06 INC/ (DEC)
HOMEOWNER
PROCESS
APPS IN SYSTEMAPPS IN SYSTEM 61,54461,544 78,69578,695 17,15117,151
BACK LOG 15,737 0 (15,737)
Figure 1: Homeowner Assistance Program Pipeline- Applicant Input
- The numbers represented
are cumulative
- The 15,671 pieces of mail in
the system represented in
the figure are an indication
of pieces processed through
the backlog
- Backlog is zero; the
mailroom is entering
current mail receipts
- The Road Home expects to
surpass 25,000
appointments completed
next week
- 2, 986 of the 3,051
appointments held for the
current period were
completed, which allows the
applicant to enter into the
evaluation/verification/calc
ulation process
See the Glossary for explanation of
terms

Weekly Situation & Pipeline Report Week 18
October 31 – November 6, 2006
4
OPTIONS
LETTERS SENT189 1,043 854
17 20 3CLOSED
CA
LC
UL
AT
ION
SC
LO
SIN
GS
APPLICATIONS IN
VERIFICATION16,370 19,356 2,986
675 1,721 1,046BENEFITS
CALCULATED
TOTAL TOTAL $34.5 million$34.5 million $110.3 million$110.3 million $75.8 m$75.8 m
AVERAGEAVERAGE $57,760$57,760 $67,908$67,908
TOTAL TOTAL $756,000$756,000 $959,000$959,000 $203,000$203,000
AVERAGE $44,481 $47,934
OPTIONS
SELECTED82 88 6
CUMULATIVE
As of 10/30
CUMULATIVE
As of 11/06 INCREASE
HOMEOWNER
PROCESS
OPTIONS
LETTERS SENT189 1,043 854
17 20 3CLOSED
CA
LC
UL
AT
ION
SC
LO
SIN
GS
APPLICATIONS IN
VERIFICATION16,370 19,356 2,986
675 1,721 1,046BENEFITS
CALCULATED
TOTAL TOTAL $34.5 million$34.5 million $110.3 million$110.3 million $75.8 m$75.8 m
AVERAGEAVERAGE $57,760$57,760 $67,908$67,908
TOTAL TOTAL $756,000$756,000 $959,000$959,000 $203,000$203,000
AVERAGE $44,481 $47,934
OPTIONS
SELECTED82 88 6
CUMULATIVE
As of 10/30
CUMULATIVE
As of 11/06 INCREASE
HOMEOWNER
PROCESS
Figure 2: Homeowner Assistance Program Pipeline- Applicant Processing
- The total number of benefits
calculated (1,721) represents
preliminary and final
calculation award benefit;
verification is still required
on most applicants
- The $110.3M and $67,908
average award represents
maximum benefit if ALL
applicants select Option 1 –
rebuild in place
- The award calculation
includes available elevation
grant amounts, but does not
include affordable loan
amounts
- All closed applicants have
selected Option 1
- Applicants’ initial options
selection are in Appendix A
See the Glossary for explanation of
terms

Weekly Situation & Pipeline Report Week 18
October 31 – November 6, 2006
5
Housing Assistance Center Activity
Appointment activity at the 10 Housing Assistance Centers increased 4% from the
prior reporting week.
o There were 3,051 appointments held (2,986 of the held appointments were
completed); cumulatively, 19,356 Homeowner appointments are complete
Completed three (3) rescheduled closings; total Homeowner closings - 20
The number of calculated awards has increased by 1,046; total awards calculated -
1,721:
o 1,043 total options letters mailed (three awards under additional review)
o 258 are scheduled for mailing
Award Calculation Activity
Calculated 1,721 awards totaling $110.3M ($67,908 average); using Option 1 to
calculate maximum benefit including available elevation grant amounts
Determined 24.3% of applicants reporting income and parish are low to moderate
income (less than 80% Area Median Income). Table 1 shows the break down and
relative percentage
Table 1: Applicants <80% Area Median Income *
Applicants Providing Income and Parish
Applicants Not Providing Parish
Applicants not Providing Income
or $0 Income
Applicants <80% Area
Median Income
Applicants <80% Area
Median Income (Percent)*
38,580 4,792 23,222 9,367 24.3%
*Applicants that do not provide parish or income data cannot be calculated with respect to Area Median
Income and are not included in the 24.3% figure (9,367/38,580)
** Information in this Table is as of November 4, 2006
Data Verification Activity
Assisted with three homeowner closings
During verification of applicant data, delivered 1,557 Real Estate Solution (RES)
matches; 6,555 Flood determinations; 3,973 Automated Valuation Model (AVM)
matches; 59 Broker Price Opinion (BPO) matches
Installed biometric solution software at the Data Center (thumb scan software); due
to begin testing this week
Home Evaluations (Home Inspection) Activity
Table 2: Home Evaluation Team Metrics
ACTIVITY Prior Total
10/09 – 10/15
10/16 – 10/22
10/23 – 10/29
10/30 – 11/5
11/6 – 11/12
Current Total
Four Week
Average
Work Orders Submitted by Housing Advisor
7,056 3,079 3,223 2,546 2,705 18,609 2,888

Weekly Situation & Pipeline Report Week 18
October 31 – November 6, 2006
6
ACTIVITY Prior Total
10/09 – 10/15
10/16 – 10/22
10/23 – 10/29
10/30 – 11/5
11/6 – 11/12
Current Total
Four Week
Average
Work Orders Dispatched*
7,008 2,736 3,386 2,478 2,734 18,342 2,834
Evaluations Completed
2,430 1,609 1,309 1,723 1,924 8,995 1,641
*Work order submitted by advisors are processed in batch, which accounts for the difference between
submitted and batched work orders
Completed 1,924 home inspections this period
Completed automated verification data flow for Shaw and initiated Providence data
deliveries (expected completion November 7)
Working through prioritized CAD records (821 remaining of 1,143 original
records); processed approximately 3,000 Shaw CAD records through automated QC
tool and making progress to QC Providence records
Initiated priority-based dispatching of work orders
Call Center Activity
Table 3: Call Center Metrics
ACTIVITY Prior Total
10/09 – 10/15
10/16 – 10/22
10/23 – 10/29
10/30 – 11/5
11/6- 11/12
Current Total
Four Week Average
Calls 116,773 17,359 15,115 11,294 16,292 176,833 15,015
Applications Requested
21,820 812 1,012 756 507
24,907 772
Online Application Assists
489 224 193 144 159
1,209 180
Hardcopy Application Assists
414 142 128 71 74
829 104
Phone Applications N/A N/A N/A N/A 24 24 24
Spanish Calls 86 58 61 59 68 332 62
Vietnamese Calls 14 17 31 13 23 98 21
Appointments Scheduled by Phone
6,850 7,533 6,729 4,050 9,178
34,340 6,873
Began ‘soft-launch’ of phone applicants during the period and took 24 applications
over the phone; planning full-scale launch on 11/8
Mailroom/Data Entry Activity
Table 4: Mailroom/Data Entry Metrics
ACTIVITY Prior Total*
10/09 – 10/15
10/16 -10/22
10/23 – 10/29
10/30 – 11/05
11/6-11/12 Total
Four Week
Average
New paper applications received through mailroom
30,346 2,399 2,212 1,942 1,575 38,474 2,032
New paper applications entered into batch files for entry into eGrantsPlus
7,322 3,093 6,762 11,505 9,792 38,474 7,781

Weekly Situation & Pipeline Report Week 18
October 31 – November 6, 2006
7
ACTIVITY Prior Total*
10/09 – 10/15
10/16 -10/22
10/23 – 10/29
10/30 – 11/05
11/6-11/12 Total
Four Week
Average
New paper applications remaining to be entered into eGrantsPlus
24,665 23,971 19,421 9,859 0 N/A N/A
Data-entry back-log complete and staff entering current weeks inbound mail
Mail volume (inbound) has dropped off significantly to 1,575 pieces this week,
which is down from 8,742 the week of September 11th
Total mail (i.e., new, non-duplicate applications) received to date is 38,474. Note:
this number has been adjusted to reflect actual counts of earlier estimates for
weeks prior to the opening of the data entry center
Total mail processed for entry into eGrantsPlus is 38,474. Mail processing has
steadily increased from 960 applications per week to a high of 11,505
Cumulative Metrics
123
8605
17347
23334
27074
3034632745
3495736899
38474
17177
28682
38474
8605
17347
2237423332 23024 22330
8217
0
10415
7322
3742
9600
00123
17780
-5000
0
5000
10000
15000
20000
25000
30000
35000
40000
45000
28
-Au
g
4-S
ep
11
-Se
p
18
-Se
p
25
-Se
p
2-O
ct
9-O
ct
16
-Oct
23
-Oct
30
-Oct
Vo
lum
es
Inbound Mail Processed Applications Backlog
Figure 3: Mailroom/Data Entry Trends
Housing Assistance Center Appointment Activity
Appointments were up this week from the previous week as the Program continues to take
appointments by telephone and from potential applicants by walking into the Centers.
Tables 5 and 6 show the appointment activity for the Centers by day and by week,
respectively.
Table 5: Housing Assistance Center Appointments by Day
ACTIVITY Mon 10/30
Tues 10/31
Wed 11/1
Thurs 11/2
Fri 11/3
Sat 11/4
Sun 11/5
Total Four Week
Average
Appointments Held 281 592 492 613 671 348 54 3,051 436

Weekly Situation & Pipeline Report Week 18
October 31 – November 6, 2006
8
Table 6: Housing Assistance Center Appointments by Week
ACTIVITY Prior Total
10/09 – 10/15
10/16 – 10/22
10/23 – 10/29
10/30 – 11/5
11/6-11/12
Current Total
Four Week
Average
Appointments Held 7,487 3,085 3,153 2,924 3,051 19,700 3,053
Weekly total demonstrates a 4% increase over the previous week, but still down
from a weekly high of 3,153
Figure 4 shows the number of appointments scheduled and actual appointments held by
Center. The percentage for each Center represents the number of scheduled appointments
that were actually held.
367
38
825
413
1009
95
280
360
54
91
312
29
666
369
894
88
244
326
45
78
85%
76%
81%
89%
89%
93%
87%
91%
83%
86%
0 200 400 600 800 1000 1200
Calcasieu
Cameron
E. Baton Rouge
Jefferson
New Orleans
Plaquemine
St. Bernard
St. Tammany
Terrebonne
Vermilion
Ho
us
ing
As
sis
tan
ce
Ce
nte
r
Applications
# of Appts Scheduled # of Actual Appts Percent
Figure 4: Appointments Scheduled and Held by Center

Weekly Situation & Pipeline Report Week 18
October 31 – November 6, 2006
9
Figure 5 shows the trend of scheduled v. held appointments over the last seven weeks.
Scheduled (Planned) v. Held (Actual) Appointments
3532
3051
340135063571
2453
1158
1183
2924
2275
31533082
1236
1147
481477353489
17836
0
500
1000
1500
2000
2500
3000
3500
4000
9/2
5/0
6
10
/2/0
6
10
/9/0
6
10
/16
/06
10
/23
/06
10
/30
/06
11
/6/0
6
Week Ending
Ap
po
intm
en
ts
Planned Actual Difference
Figure 5: Weekly Scheduled and Held Appointments.
481 applicants canceled appointments, changed appointments, or did not show
Table 7 shows the “next available” appointment date by Center, and indicates relative
immediate availability in the East Baton Rouge Center.
Table 7: Center Appointment Availability
# Center Name Next Available Appointment 1 East Baton Rouge November 9, 2006 2 Orleans November 15, 2006 3 Calcasieu November 9, 2006 4 Jefferson November 21, 2006 5 St. Bernard November 11, 2006 6 St. Tammany November 15, 2006 7 Cameron November 17, 2006 8 Plaquemines November 17, 2006 9 Terrebonne November 11, 2006 10 Vermilion November 15, 2006
The Road Home made significant adjustment to the way appointments were
scheduled during the last period by providing times of availability with designated
hours and allowing the applicant to choose from available times. The significant
result is that all Centers now have availability in November
Applicants currently scheduled for future appointments will be given the
opportunity to reschedule for earlier appointments

Weekly Situation & Pipeline Report Week 18
October 31 – November 6, 2006
10
Supporting Function Activity
Quality Assurance: 93% of applicants surveyed from across the State rated their
overall experience with The Road Home Program as good or excellent; 5%
satisfactory; 2% poor or very poor (surveys are voluntary)
Human Resources: Additional Human Resource activity to add capacity to
existing and future Centers is progressing. In recent weeks, 62 new advisors were
added to existing Centers and 19 additional personnel for the Houston Center
Table 8 shows the breakdown of applicants by race as reported by the applicant. Nineteen
percent designated their race as Black, 21% as White, and 57% chose not to designate race.
Table 8: Applicant Race and Ethnicity as Reported by Applicant
Race Total Applications
American Indian/Alaska Native 120
American Indian/Alaska Native and White 133
American Indian/Alaskan Native/Black-African American 167
Asian 563
Asian and White 64
Black/African American 15,302
Black/African American and White 371
Native Hawaiian/Other Pacific Islander 45
Other Multi-Racial 800
White 16,325
Race not Provided by Applicant 44,805
Total 78,695
RENTAL PROPERTY REPAIR PROGRAM
Began detailed requirements gathering for development of the Property Owner
Application process
Started collaborative development of Implementation Plan and Risk Assessment
with OCD/ICF/Housing Development Software (HDS)
Completed high level of review of the Rental Property Repair Program with HDS
o Numerous program issues related to the Property Owner Application
process remain unresolved including new issues that were uncovered during
the HDS requirements gathering sessions
o HDS cannot complete the full requirements analysis, provide development
timeline, or begin the development process for the Property Owner
Application until the major program issues identified in the item above are
resolved
Completed a draft of the scoring characteristic matrix and forwarded it to
representatives of the LRA and OCD for comment/suggestion

Weekly Situation & Pipeline Report Week 18
October 31 – November 6, 2006
11
Determined estimate for Notice of Funds Available Round 1 with a date of
February 15
HAZARD MITIGATION GRANT PROGRAM (HMGP)
Submitted the Acquisition HMGP application (GOHSEP to FEMA) on Thursday,
November 2nd
Continued work on the Individual Mitigation Measures (IMM) HMGP application
which has changes to the payment process for delivery to OCD on November 9th
Continued staffing for the Program to fill Regional Coordinator, Evaluation
Liaison, and Grant Manager positions
Completed evaluator information fact sheet regarding the Individual Mitigation
Measures for use in Evaluator Training
Began a study and white paper of viable alternative uses of HMGP funds to address
the possibility of lower participation in acquisitions than projected; coordinated
with other Road Home functional areas, OCD, LRA, and the GOHSEP mitigation
strategy teams
PROGRAM SUPPORT STATUS
LOGISTICS, FACILITIES, & SECURITY
Submitted Houston and New Orleans Housing Assistance Centers and Mobile
Engagement Plan to OCD for review and approval
Signed lease for the Houston facility
Ordered all furniture and IT hardware for Houston Homeowner Assistance Center
Conducted site surveys for second New Orleans Homeowner Assistance Center
HUMAN RESOURCES
Hired 62 staff for existing Centers and hired 19 staff for the Houston Center;
current advisor level is 271
Continued hiring efforts to staff Center to 100% - 320 advisors for existing Centers
and continued recruiting for the Rental Program (recruiting 70 people)
Worked with the Principal Chief of the United Houma Nation to arrange a
workshop to recruit Native American candidates for Road Home
POLICY & PLANS
Continued to revise Homeowner Policy to incorporate new expedited process
Continued to draft Homeowner monitoring plan (will go to OCD on 11/8)
Worked on Programmatic Agreement for state historic requirements
Continued to revise Home Evaluator training to incorporate additional
environmental and historic requirements
Finalized Homeowner documents for closings (Grant agreement, covenants, etc.)
Began reviewing all policies, procedures, and activities for compliance with CDBG

Weekly Situation & Pipeline Report Week 18
October 31 – November 6, 2006
12
TRAINING
Conducted Homeowner Program training for new hires in Kenner, LA on Oct. 31-
Nov. 2; 78 attendees
Developed “just-in-time” training on the Income Verification process for delivery
by Housing Assistance Center staff on Nov. 2
Continued development of the revised training for Home Evaluators
Continued development of the web-based training for Housing Assistance Center
staff
EXTERNAL AFFAIRS
Community Outreach Table 8: Community Outreach Metrics
Meeting Type Events
Week 10/24-10/30
People Reached Week 10/24-
10/30
Events To-Date
People Reached To-Date
Community 8 98 110 10,945
Faith Based 3 17 15 872
Business 2 26 7 254
Governmental 5 38 35 1,687
Case Managers 1 15 29 578
TOTALS 19 194 196 14,336
Met with several local government organizations, ecclesiastical leaders and local
community groups throughout southern Louisiana to provide updates and
information about the Program in an effort to increase participation, including
Elementary Schools, Catholic Social Services, Cameron Aging Council, People for
Hurricane Relief, etc.
Conducted workshop for SWLA legislative staffers, Terrebonne/Lafourche
legislative staffers,
Communications
Developed press release on phone applications and appointments, Houston Center
opening, and disbursement clarification
Updated and distributed latest Frequently Asked Questions
Continued development of a Small Rental Communications and Rebuilding
Registry communications timeline
Produced Homeowner and Verification process flow charts
Submitted communications strategy for Houston Housing Assistance Center and
Mobile teams
Public Information
Continued information campaign to disseminate Program information and correct
errant information through media outlets, including the Times Picayune, WWL-TV,
New York Times, WTUL-AM , The Community Gumbo Show, and New Orleans
Publishing Group
Weekly Situation & Pipeline Report Week 18
October 31 – November 6, 2006
13
Continued planning media availability
Worked with the Homeowner Program, State and federal Departments of Justice on
a fraud PSA film (East Baton Rouge Center)
MIS
Continued testing of the integrated eGrantsPlus calculator with ‘side-by-side’
testing of the manual process and automated process and preparing to ‘go-live’
Worked with Rental and HMGP program to determine requirements for software
and hardware; installed single family software for Rental Program for testing
Selected Business Objects as the Program reporting tool
Completed installation of thumb scan software in the Data Center
ANTI-FRAUD, WASTE, AND ABUSE
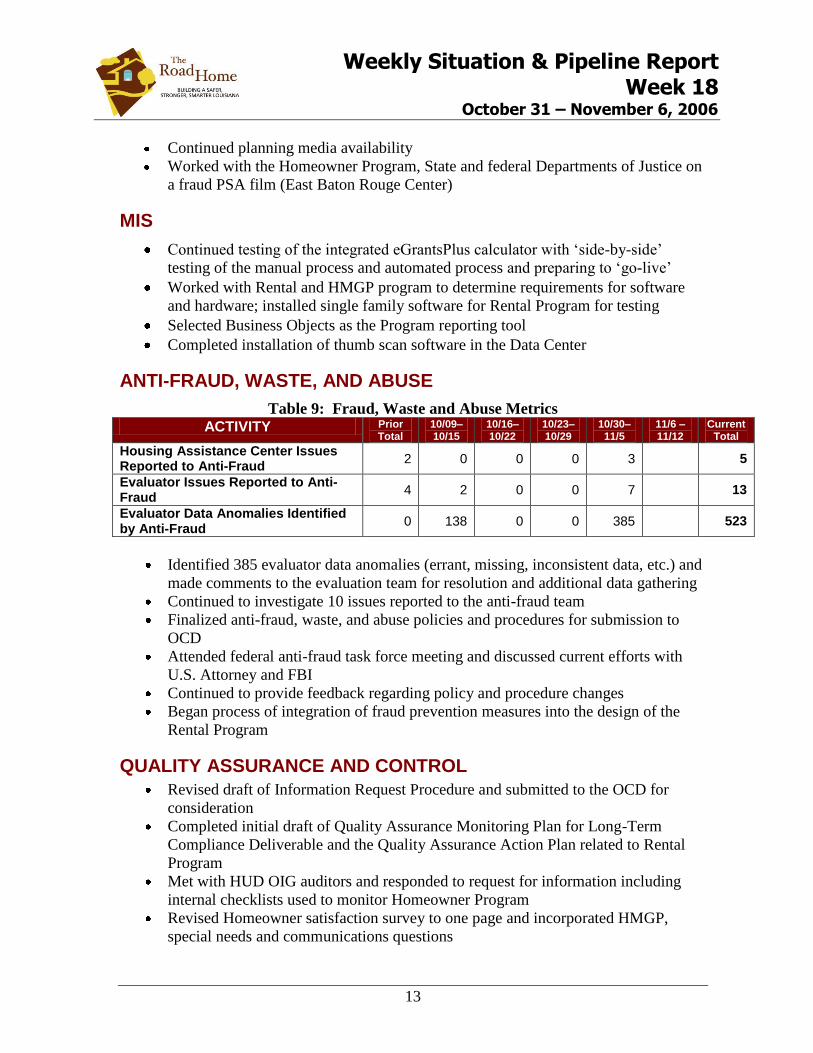
Table 9: Fraud, Waste and Abuse Metrics ACTIVITY Prior
Total 10/09– 10/15
10/16– 10/22
10/23– 10/29
10/30– 11/5
11/6 – 11/12
Current Total
Housing Assistance Center Issues Reported to Anti-Fraud
2 0 0 0 3 5
Evaluator Issues Reported to Anti-Fraud
4 2 0 0 7 13
Evaluator Data Anomalies Identified by Anti-Fraud
0 138 0 0 385 523
Identified 385 evaluator data anomalies (errant, missing, inconsistent data, etc.) and
made comments to the evaluation team for resolution and additional data gathering
Continued to investigate 10 issues reported to the anti-fraud team
Finalized anti-fraud, waste, and abuse policies and procedures for submission to
OCD
Attended federal anti-fraud task force meeting and discussed current efforts with
U.S. Attorney and FBI
Continued to provide feedback regarding policy and procedure changes
Began process of integration of fraud prevention measures into the design of the
Rental Program
QUALITY ASSURANCE AND CONTROL
Revised draft of Information Request Procedure and submitted to the OCD for
consideration
Completed initial draft of Quality Assurance Monitoring Plan for Long-Term
Compliance Deliverable and the Quality Assurance Action Plan related to Rental
Program
Met with HUD OIG auditors and responded to request for information including
internal checklists used to monitor Homeowner Program
Revised Homeowner satisfaction survey to one page and incorporated HMGP,
special needs and communications questions

Weekly Situation & Pipeline Report Week 18
October 31 – November 6, 2006
14
COMPLIANCE
Worked with other Road Home team members to finalize policies
Met and worked with Rental Program participants to ensure compliance with
applicable laws during Program design
Worked with HUD Auditors to provide additional info and set up interviews
Continued working with KMPG to develop Anti-Fraud and internal controls to
prevent and detect Fraud, Waste, and Abuse within the Road Home Program
SPECIAL NEEDS TEAM
Continued to develop special needs liaison and training for The Road Home
programs – especially within the Call Center and Housing Assistance Centers
Continued to work within the Programs to ensure accessibility and special needs
integration within the design of emerging programs and the existing Homeowner
Program
Met with several community groups to address special needs of potential applicants
Devised and revised Special Needs plan for the Program

Weekly Situation & Pipeline Report Week 18
October 31 – November 6, 2006
15
APPENDIX A
Initial Option Elections of Applicants, by Parish of Damaged Residence
Note: Parish information and option choices are as reported on applications received from homeowners and may change once
validation by The Road Home Program is completed and families consider benefit amounts for each possible option.
PARISH Keep Your
Home Sell, but Stay in
Louisiana Sell, and Move
out of Louisiana Undecided
Information Not Available
Total
ACADIA 42 5 - 6 - 53
ALLEN 72 5 - 10 2 89
ASCENSION 28 11 1 1 2 43
ASSUMPTION 31 3 - 5 - 39
BEAUREGARD 154 22 - 21 7 204
CALCASIEU 2,513 289 8 425 139 3,374
CAMERON 535 168 10 376 76 1,165
EAST BATON ROUGE 105 6 1 10 3 125
EAST FELICIANA 13 - - 4 2 19
EVANGELINE 8 1 1 1 1 12
IBERIA 443 47 2 85 27 604
IBERVILLE 23 4 - 7 - 34
JEFFERSON 6,975 363 53 541 266 8,198
JEFFERSON DAVIS 193 19 - 36 16 264
LAFAYETTE 27 2 - 10 8 47
LAFOURCHE 117 17 1 18 6 159
LIVINGSTON 61 11 - 15 4 91
ORLEANS 22,296 2,938 537 3,976 955 30,702
PLAQUEMINES 911 428 27 645 163 2,174

Weekly Situation & Pipeline Report Week 18
October 31 – November 6, 2006
16
Initial Option Elections of Applicants, by Parish of Damaged
Residence (Continued)
PARISH Keep Your
Home Sell, but Stay in
Louisiana Sell, and Move
out of Louisiana Undecided
Information Not Available
Total
POINTE COUPEE 5 - - 3 1 9
SABINE 5 2 - 2 - 9
SAINT BERNARD 3,452 3,216 316 1,806 240 9,030
SAINT CHARLES 172 9 - 22 22 225
SAINT HELENA 55 4 2 12 2 75
SAINT JAMES 21 1 - 3 - 25
SAINT LANDRY 42 6 - 6 1 55
SAINT MARTIN 29 3 - 9 2 43
SAINT MARY 81 8 - 15 7 111
SAINT TAMMANY 4,115 401 53 465 143 5,177
ST JOHN THE BAPTIST 171 5 3 18 5 202
TANGIPAHOA 190 16 1 36 14 257
TERREBONNE 564 110 4 115 21 814
VERMILION 771 116 1 164 52 1,104
VERNON 15 2 - - 2 19
WASHINGTON 288 10 - 27 15 340
WEST BATON ROUGE 4 - - - - 4
WEST FELICIANA - - - - - -
No Parish Provided by Applicant 3,713 797 105 895 7,962 13,472
Non-Presidentially Declared Disaster Area Parishes 227 31 4 46 20 328
Total 48,467 9,076 1,130 9,836 10,186 78,695

Weekly Situation & Pipeline Report Week 18
October 31 – November 6, 2006
17
APPENDIX B

Weekly Situation & Pipeline Report Week 18
October 31 – November 6, 2006
18
APPENDIX C
Weekly Situation & Pipeline Report Week 18
October 31 – November 6, 2006
19
GLOSSARY
Pipeline Diagram Terms (Figures 1 and 2)
APPLICATIONS
Online in System represents the cumulative number of applications in the system for
applications submitted online.
Mail in System represents the cumulative number of applications in the system for hard copy
applications submitted via mail.
Phone in System represents the cumulative number of applications in the system for applications
taken over the phone.
Total in System represents the cumulative number of applications in the system for applications
submitted online, via mail, and over the phone.
Back Log represents the current number of hard copy applications awaiting data entry into the
system.
Received represents the cumulative number of applications received whether entered into the
system or awaiting data entry.
APPOINTMENTS
Appointment Letters Sent represents the cumulative number of letters sent to applicants asking
them to call and schedule an appointment. Not all applicants will receive appointment letters
because they may be ineligible or may have already scheduled their appointment over the phone.
Appointment letters are sent in batches twice a week.
Appointments Scheduled represents the cumulative number of appointments scheduled to date.
Appointments Completed represents the cumulative number of appointments completed at
Housing Assistance Centers where advisors submitted the applicants’ completed applications.
CALCULATIONS
Applications in Verification represents the cumulative number of applicants whose application
data is being verified to determine eligibility and basis for calculation of benefits.
Benefits Calculated represents the cumulative number of applications for which eligibility has
been determined and benefits have been calculated for the various possible options.
CLOSINGS
Options Letters Sent represents the cumulative number of applicants who have been sent a
benefit options letter noting their respective benefit options.
Options Selected represents the cumulative number of applicants who have replied to the options
letter and selected their benefit option.
Closed represents the cumulative number of applicants who have gone through the closing
process and whose funds have been disbursed.