Respiratory System Chapter 13. Upper Respiratory Tract Lower Respiratory Tract.
The Respiratory
System

RESPIRATORY SYSTEM
Primary functions
Major functional events
Pulmonary ventilation
Diffusion of O2 & CO2 between
alveoli & blood
Transport of O2 & CO2 in
blood and body fluids
Regulation of ventilation
2

Respiratory Gasses
What essential function does O2 serve?
How is CO2 produced and why do we need to
get rid of it?
3

True or false: The oxygen you breathe in gets
converted into carbon dioxide that you then
breathe out.
A) True
B) False
4

Review of Respiratory Structures
Upper vs. lower respiratory tracts
Thoracic cavity
Diaphragm
See Fig. 37-8
5

Review of Respiratory Structures
Respiratory tree
Trachea
Bronchi
Bronchioles
Alveolar sacs
Alveoli
See Fig. 37-8 6

Review of Respiratory Structures
Structural characteristics
Cartilage
Cilia
Mucus glands
Smooth muscle
See Fig. 37-8
7

Review of Respiratory Structures
Respiratory membrane
Blood-air barrier
Epithelial characteristics
Type I cells
Type II cells
Produce surfactant
See Fig. 37-8 8
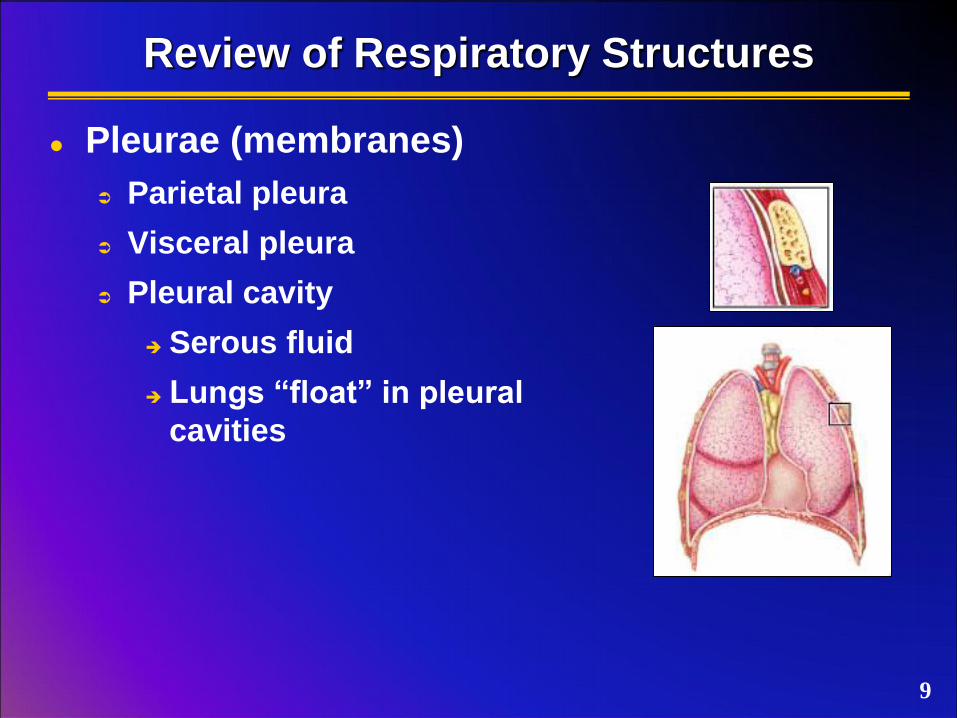
Review of Respiratory Structures
Pleurae (membranes)
Parietal pleura
Visceral pleura
Pleural cavity
Serous fluid
Lungs “float” in pleural
cavities
9

Fluids in the respiratory system have all of
these functions except…
A) Reducing friction of lung against chest wall
B) Reducing surface tension in the lung
C) Allowing gasses to diffuse across
epithelium
D) Transporting metabolic fuels to body
tissues
10
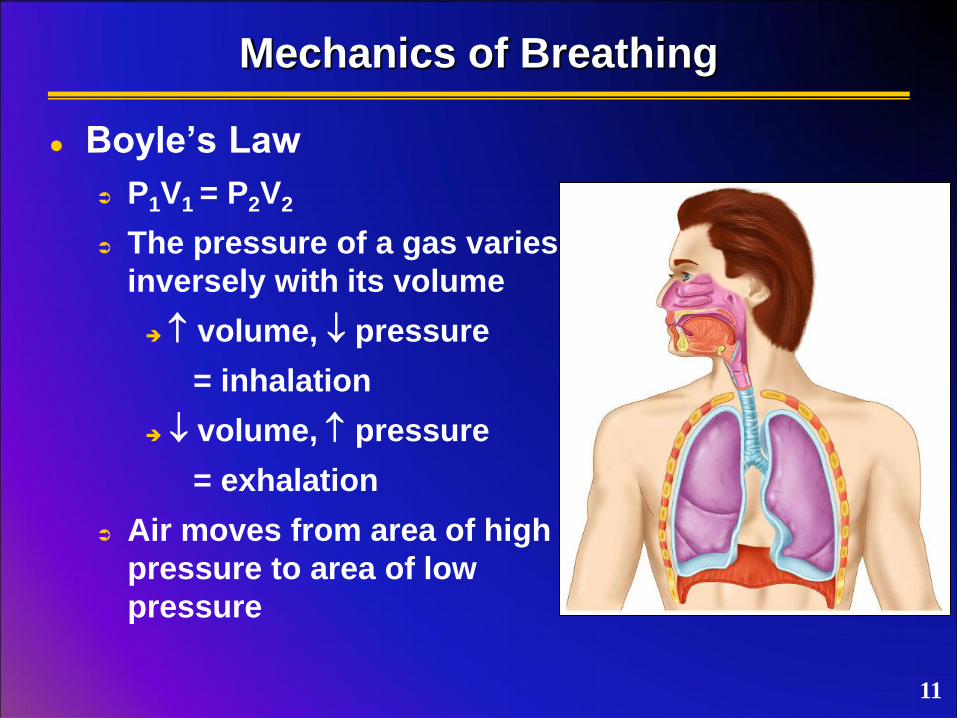
Mechanics of Breathing
Boyle’s Law
P1V1 = P2V2
The pressure of a gas varies
inversely with its volume
volume, pressure
= inhalation
volume, pressure
= exhalation
Air moves from area of high
pressure to area of low
pressure
11

Mechanics of Breathing
Muscular events during inspiration
Diaphragm contracts & flattens inferiorly
External intercostals contract & elevate rib cage
thoracic volume
Fig. 37-1 12
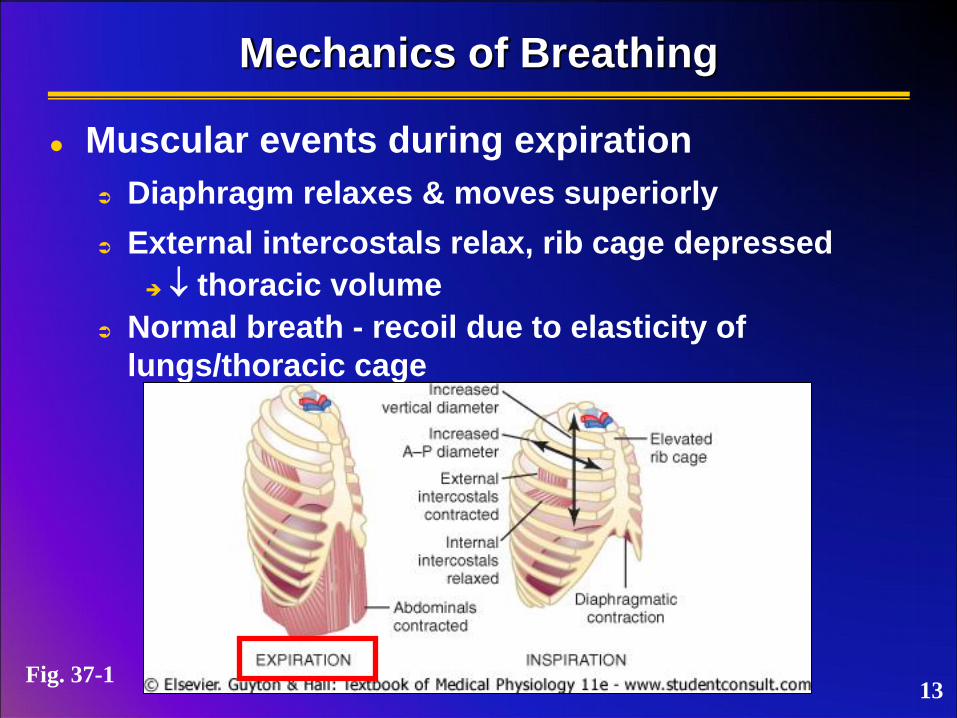
Mechanics of Breathing
Muscular events during expiration
Diaphragm relaxes & moves superiorly
External intercostals relax, rib cage depressed
thoracic volume
Normal breath - recoil due to elasticity of
lungs/thoracic cage
13 Fig. 37-1
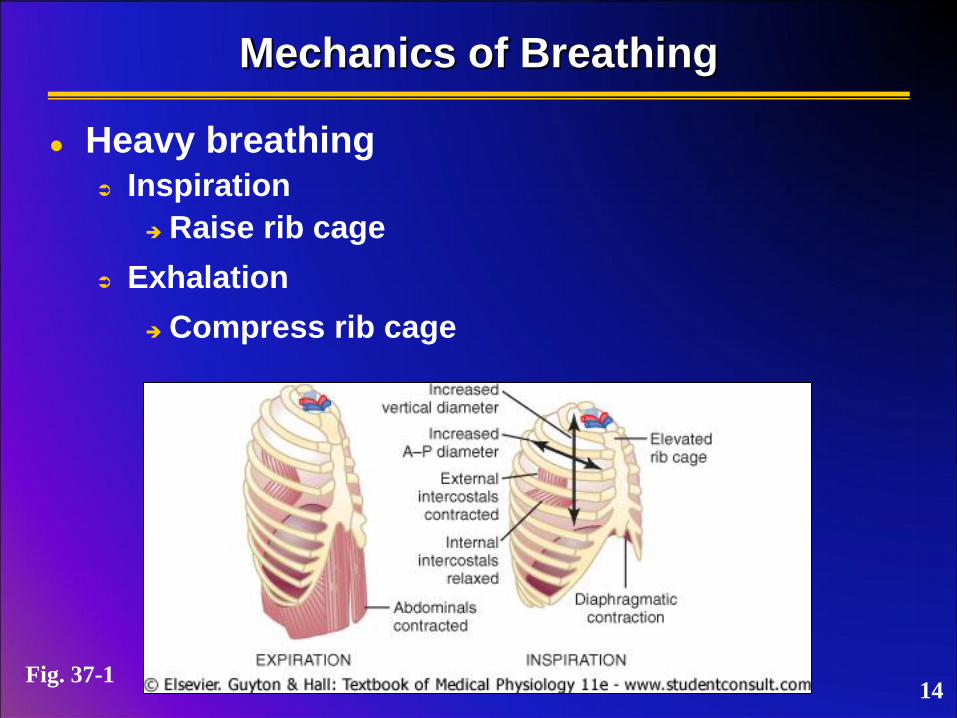
Mechanics of Breathing
Heavy breathing Inspiration
Raise rib cage
Exhalation
Compress rib cage
14 Fig. 37-1

Mechanics of Breathing
Thoracic pressures
Intrapulmonary pressure (alveolar pressure)
Pressure within alveoli
Equalizes with atmospheric pressure
15

Mechanics of Breathing
Thoracic pressures
Intrapulmonary pressure (alveolar pressure)
Intrapleural pressure
Pressure of fluid within pleural cavity
< alveolar pressure
Low pressure created by fluid draining into
lymphatic capillaries
Fluid/pressure causes visceral pleura to “stick” to
parietal pleura
as thoracic cavity expands, lungs expand
Elasticity of lungs causes recoil, aids expiration
Equalization with alveolar pressure = collapse 16

Mechanics of Breathing
Thoracic pressures
Intrapulmonary pressure (alveolar pressure)
Intrapleural pressure
Transpulmonary pressure
Difference between intrapulmonary and
intrapleural pressures
Represents the elastic forces of the lungs
17

Thoracic Pressures
Fig. 37-1 18

Environmental pressure equalizes with which of
the following pressures?
A) Transpulmonary pressure
B) Pleural pressure
C) Alveolar pressure
D) All of the above
19

Lung Compliance
Relationship of lung expansion and
transpulmonary pressure
Every 1 cm H2O increase in transpulmonary
pressure results in 200 ml expansion in lung
volume
Characteristics determined by elastic forces
of lungs
Elasticity of lung tissue
Surface tension within alveoli
20

Lung Compliance
Tissue elasticity
High percentage of elastic fibers in connective
tissue of lungs
Elastin & collagen
Stretched during expansion then recoil
21

Lung Compliance
Alveolar surface tension
Alveolar surfaces covered with fluid
Forms water-air surface
Increases rate of gas diffusion
Creates tension between water molecules
Cohesive forces of water
Surface tension
Surfactants decrease surface tension
Interfere with water cohesion
Degree of recoil reduced
22

Lung Compliance
Factors reducing lung compliance
Reduced tissue elasticity
Reduced surface tension
Increased airway resistance
Mucus buildup
Bronchial constriction
23
Lung compliance is affected by all of the
following except…
A) Alveolar surface tension
B) Elastic forces of lungs
C) Airway resistance
D) Size of alveoli
24

Pulmonary Volumes
Tidal volume (VT)
Normal
inspiration/expiration
~ 0.5 L
Inspiratory reserve
volume (IRV)
Air forceably inspired
beyond VT
~ 3 L
Fig. 37-6
25

Pulmonary Volumes
Expiratory reserve volume
(ERV)
Air forcibly expired beyond VT
~ 1.1 L
Residual volume (RV)
Air that cannot be
forcibly expired
~ 1.2 L
26
Fig. 37-6

Pulmonary Capacities
Inspiratory capacity (IC)
Max. air inspired after normal
expiration
TV + IRV
~ 3.5 L
Functional residual
capacity (FRC)
Air remaining in lungs
after normal expiration
ERV + RV
~ 2.3 L
27
Fig. 37-6

Pulmonary Capacities
Vital capacity (VC)
Max. air inspired after normal
expiration
IRV + TV + ERV
~ 4.6 L
Total lung capacity
(TLC)
VC + RV
~ 5.8 L
28
Fig. 37-6

Other Respiratory Measurements
Minute respiratory volume
Amount of air moved into respiratory passages
each minute
TV (ml) x respiratory rate (bpm)
Dead space
Air filling respiratory passages but not reaching
gas exchange areas
~ 0.15 L
29

The amount of air remaining in your lungs after
a normal expiration is the…
A) Expiratory reserve volume
B) Functional residual capacity
C) Total lung capacity
D) Residual volume
30

Determining Respiratory Volumes
Functional residual capacity (He dilution
method)
Fill spirometer with known vol of air + known vol
of He
Expire normally then breathe from spirometer
Air remaining in lungs = FRC
[He] diluted by FRC gasses
Calculate degree of dilution
31
Fig. 37-6

Determining Respiratory Volumes
Residual volume and total lung capacity
Use FRC value
RV = FRC - ERV
TLC = FRC + IC or VC + RV
32
Fig. 37-6
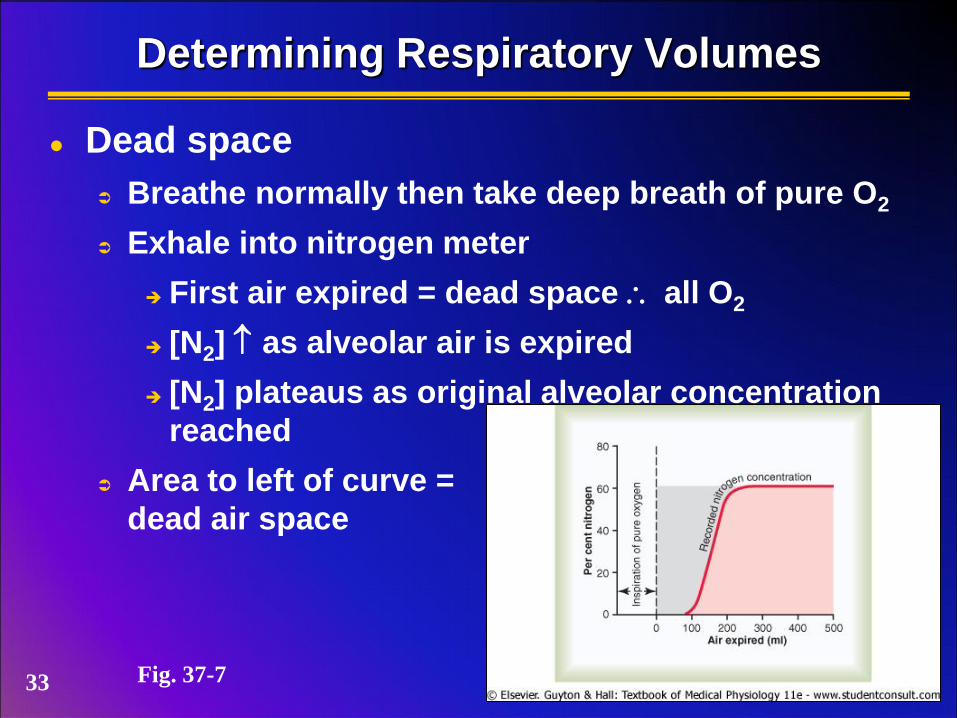
Determining Respiratory Volumes
Dead space
Breathe normally then take deep breath of pure O2
Exhale into nitrogen meter
First air expired = dead space all O2
[N2] as alveolar air is expired
[N2] plateaus as original alveolar concentration
reached
Area to left of curve =
dead air space
Fig. 37-7 33
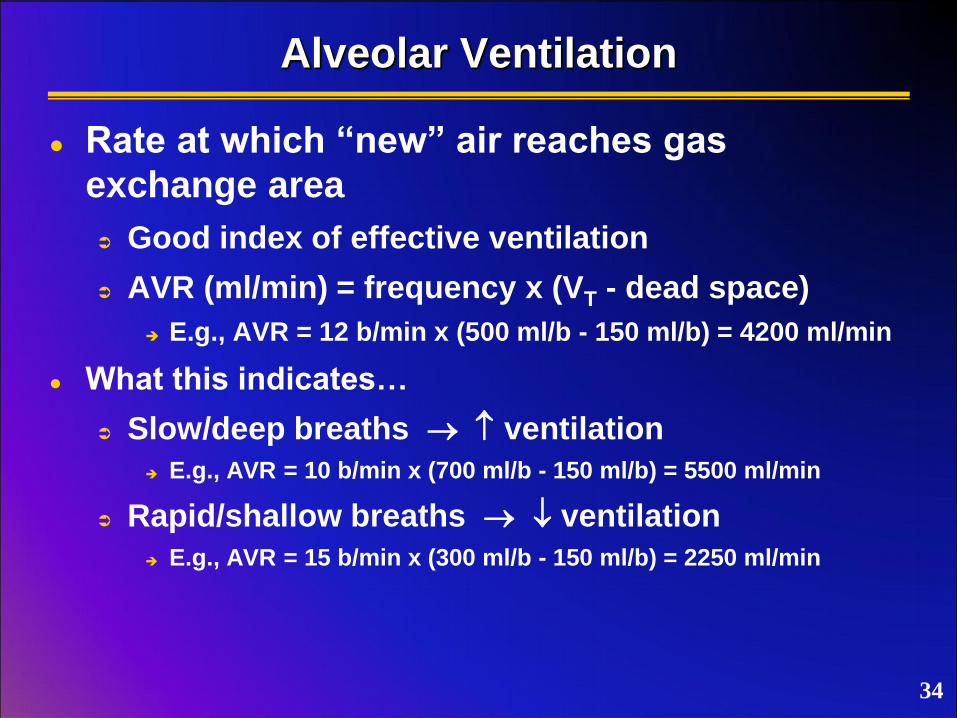
Alveolar Ventilation
Rate at which “new” air reaches gas
exchange area
Good index of effective ventilation
AVR (ml/min) = frequency x (VT - dead space)
E.g., AVR = 12 b/min x (500 ml/b - 150 ml/b) = 4200 ml/min
What this indicates…
Slow/deep breaths ventilation
E.g., AVR = 10 b/min x (700 ml/b - 150 ml/b) = 5500 ml/min
Rapid/shallow breaths ventilation
E.g., AVR = 15 b/min x (300 ml/b - 150 ml/b) = 2250 ml/min
34

If you want to increase the amount of new air in
the lungs, you should…
A) Breathe more quickly
B) Breathe more deeply
35

Gas Exchange Across Respiratory Membranes
Dalton’s Law of Partial Pressures
Total gas pressure = sum of partial pressures of
gasses within the mixture
36

Gas Exchange Across Respiratory Membranes
Partial pressure of atmospheric gasses (sea level)
mmHg %
N2 597.0 78.62
O2 159.0 20.84
CO2 0.3 0.04
H2O 3.7 0.50
Total 760.0 100.00
See Table 39-1 37
Gas Exchange Across Respiratory Membranes
Henry’s Law
When a gas mixture is in contact with a liquid,
each gas will dissolve in proportion to its partial
pressure and relative to its solubility in the liquid
conc. of dissolved gas partial pressure = solubility coefficient solubility, more gas can dissolve without
building up excess partial pressure
38

Gas Exchange Across Respiratory Membranes
Solubility coefficients of important respiratory gasses
PO2 0.024
PCO2 0.570
PCO 0.018
PN2 0.012
PHe 0.008
39

Gas Exchange Across Respiratory Membranes
Diffusion coefficient
Relative rates at which different gasses at same
pressure levels will diffuse
Depends on molecular weight of the gas & solubility
O2 1.0
CO2 20.3
CO 0.81
N2 0.53
He 0.95
40
Gas Exchange Across Respiratory Membranes
Diffusing capacity
Volume of gas that will diffuse through the
membrane each minute at a partial pressure
difference of 1 mmHg
41

Diffusing Capacity
O2 (at rest)
~ 21 ml/min/mmHg
Pressure difference across membrane ~ 11 mmHg
O2 diffusion = 11 x 21 = 230 ml/min (same as
use rate)
Fig. 39-10 42

Diffusing Capacity
O2 (during exercise)
~ 65 ml/min/mmHg (max)
~ 3x increase due to…
Increased pulmonary
circulation (dilation)
Increases diffusing
capacity
Increased ventilation-
perfusion ratio
Fig. 39-10 43

Diffusing Capacity
CO2
~ 400-450 ml/min/mmHg (at rest)
Theoretical
~20x O2
Pressure difference across
membrane > 1 mmHg
Less pressure difference
but higher solubility &
diffusion coefficients
Fig. 39-10
44
The diffusing capacity of a membrane for a
particular gas depends on all of these except:
A) diffusion coefficient of the gas
B) pressure difference of the gas across
membrane
C) thickness of membrane
D) absolute concentration of the gas in the
blood
45

Alveolar Air
Composition differs from atmosphere
Humidified
Continual diffusion of CO2 into alveoli
Continual diffusion of O2 into blood
See Table 39-1 46

Alveolar Air
Only partially replaced
FRC ~2.3 L, only ~350 ml “fresh” air enters alveoli
Takes multiple breaths (16+) to completely replace
Slow replacement important to prevent sudden
changes in gas concentration in the blood
Fig. 39-2 47

Alveolar air is replaced slowly, over the course
of ~16 breaths, because…
A) the volume of air breathed in is small in
relation to dead space
B) the volume of air breathed in is small in
relation to the functional reserve capacity
C) the old air prevents new air from coming
into the lung well
D) the speed of air intake is insufficient to
push old air out
48

Factors Influencing Rate of Diffusion Through Membrane
Membrane thickness
Averages ~0.6 m
thickness (i.e., edema), diffusion
Fig. 39-9 Fig. 39-8 49

Factors Influencing Rate of Diffusion Through Membrane
Membrane thickness
Averages ~0.6 m
thickness (i.e., edema), diffusion
Surface area
~60-70 m2
Partial pressure gradients
Gas solubilities
50

Diffusion of O2 & CO2 Across the Respiratory & Cellular Membranes
Fig. 40-1 & 3 Fig. 40-6 & 5
O2 CO2
51

Systemic PO2
Fig. 40-2
52

Carbon dioxide moves from alveolar capillaries
into alveoli because…
A) Concentration of oxygen is higher in
alveoli than in the blood
B) Partial pressure of carbon dioxide is higher
in alveoli than in the blood
C) Concentration of carbon dioxide is higher
in blood than in alveoli
D) Partial pressure of carbon dioxide is higher
in blood than in alveoli
53

Ventilation-Perfusion Coupling
Synchronization of blood flow with gas
concentrations
Function
Redirect blood to where it is most needed for gas
exchange
54
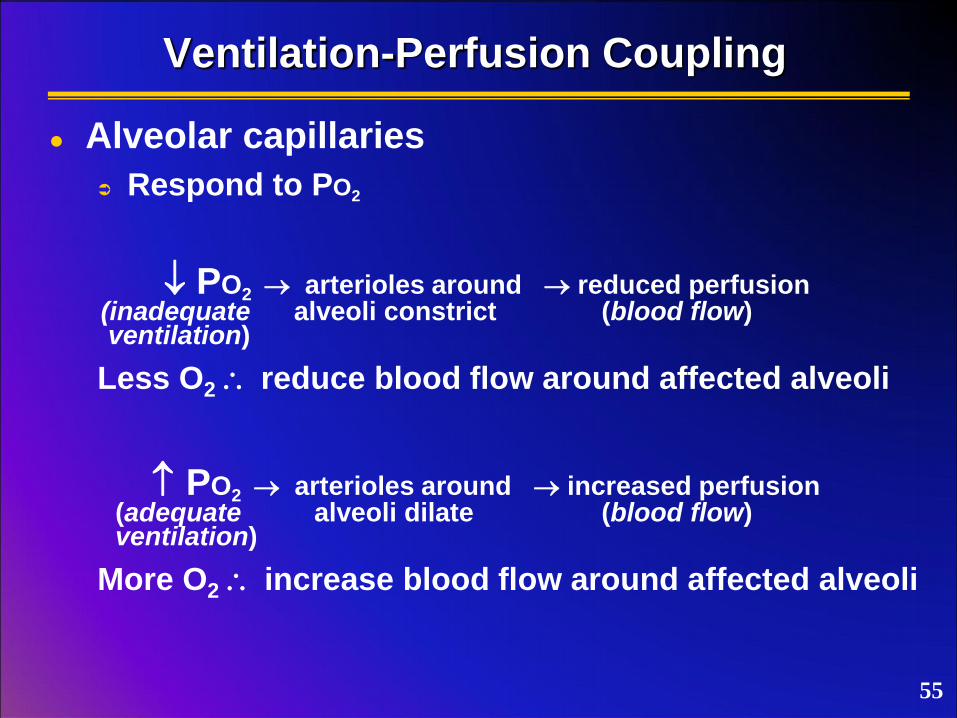
Ventilation-Perfusion Coupling
Alveolar capillaries
Respond to PO2
PO2 arterioles around reduced perfusion (inadequate alveoli constrict (blood flow) ventilation)
Less O2 reduce blood flow around affected alveoli
PO2 arterioles around increased perfusion (adequate alveoli dilate (blood flow) ventilation)
More O2 increase blood flow around affected alveoli
55

Ventilation-Perfusion Coupling
Bronchioles
Respond to PCO2
Alveoli Bronchioles
PCO2 Dilate (increase expiration volume)
PCO2 Constrict
56

Ventilation-Perfusion Ratio
Reflects respiratory exchange when alveolar
ventilation (VA) and blood flow (Q) are
imbalanced
V-P ratio = VA/Q
VA = alveolar ventilation, Q = blood flow
ratio compared to normal
Adequate blood flow but poor ventilation
Alveolus [O2/CO2] equilibrates with pulmonary
capillary blood
Blood shunted away from affected capillaries
(physiologic shunt)
Reduced oxygenation of pulmonary venous
blood 57
Ventilation-Perfusion Ratio
Reflects respiratory exchange when alveolar
ventilation (VA) and blood flow (Q) are
imbalanced
ratio compared to normal
Adequate ventilation but poor blood flow
Alveolus [O2/CO2] equilibrates with inspired air
Physiologic dead space (wasted ventilation)
58

Ventilation-perfusion coupling imbalances may
result in…
A) Increased physiological dead space
B) Wasting of energy due to unnecessary
ventilation
C) Poor oxygenation of blood
D) All of the above
59

Transport of O2 in Blood
Bound to hemoglobin
~97%
Dissolved in plasma
~3%
60

Hemoglobin (Hgb)
Hemoglobin
Tetramer
Globin polypeptides
& chains most
common
1 heme / chain
Heme group
Porphyrin ring with Fe
core
Pigment
See Fig. 32-6
61

Hemoglobin (Hgb)
O2 binding
1 O2 / heme group
4 heme groups / Hgb ( 4 O2 / Hgb)
62

O2 binding & pigment development
Causes conformational change in heme group
Oxyhemoglobin (HgbO2) = bright red
Deoxyhemoglobin (HHgb) = dark red
lungs
HHgb + O2 HgbO2 + H+
tissues
Hemoglobin (Hgb)
63

Hemoglobin (Hgb)
O2 binding & Hgb saturation
1st O2 binds
Partial saturation
Conformational change increases uptake of
additional O2
Remaining 3 O2 bind
Full saturation
64
Oxygen binds to…
A) The alpha chain of hemoglobin
B) The beta chain of hemoglobin
C) The heme portion of hemoglobin
D) All of the above
65
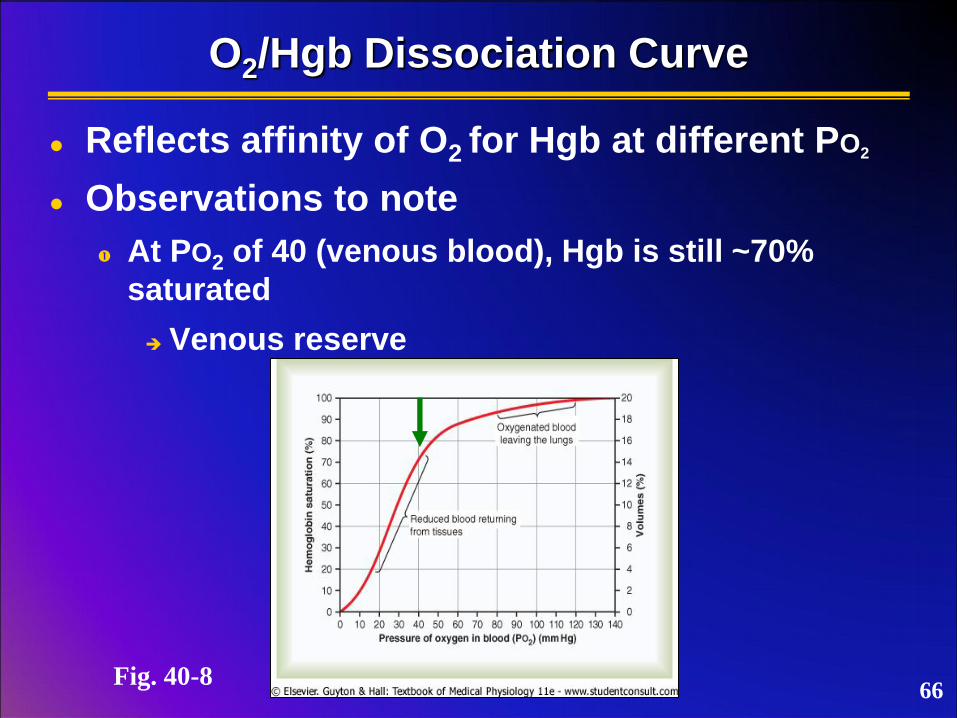
O2/Hgb Dissociation Curve
Reflects affinity of O2 for Hgb at different PO2
Observations to note
At PO2 of 40 (venous blood), Hgb is still ~70%
saturated
Venous reserve
Fig. 40-8 66

O2/Hgb Dissociation Curve
Reflects affinity of O2 for Hgb at different PO2
Observations to note
Decreased alveolar PO2 can still allow adequate O2
binding ( elevation)
67 Fig. 40-8

O2/Hgb Dissociation Curve
Changes in metabolic factors can shift curve
& affect O2 loading/unloading
Shift to right → increase O2 unloading
Shift curve to left → increase O2 loading
68 Fig. 40-8
unloading
loading
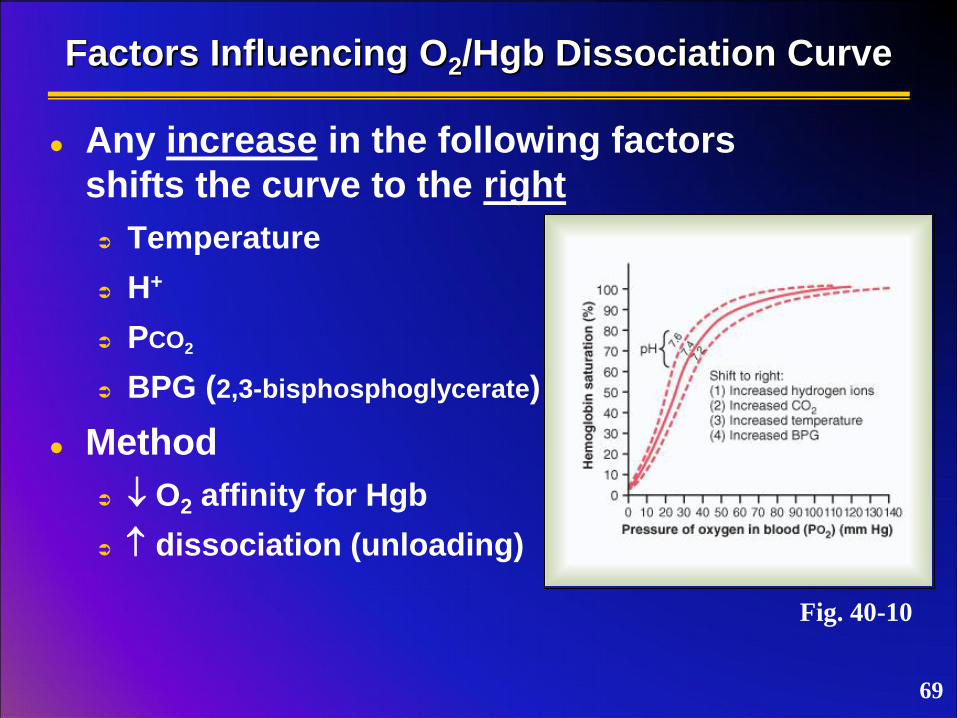
Factors Influencing O2/Hgb Dissociation Curve
Any increase in the following factors
shifts the curve to the right
Temperature
H+
PCO2
BPG (2,3-bisphosphoglycerate)
Method
O2 affinity for Hgb
dissociation (unloading)
Fig. 40-10
69
Oxygen can be offloaded more easily when…
A) Carbon dioxide partial pressure is
increased
B) Blood is more alkaline
C) Body temperature falls
D) All of the above
70

Transport of CO2 in Blood
Dissolved in plasma
~7-10%
Bound to Hgb
~20-30%
Carbaminohemoglobin (HgbCO2)
Binds to globin doesn’t compete with O2
binding sites on heme
Binds most rapidly to HHgb than HgbO2
71

Transport of CO2 in Blood
Dissolved in plasma
~7-10%
Bound to Hgb
~20-30%
As bicarbonate ions in plasma
~60-70%
carbonic anhydrase
CO2 + H2O H2CO3 HCO3- + H+
carbonic acid bicarbonate
72

Bicarbonate Buffering System
Dissociation of carbonic acid (H+)
RBC
H+ + Hgb HHgb
Buffering
Weakens HgbO2 enhances O2 unloading
See Fig. 40-13 73
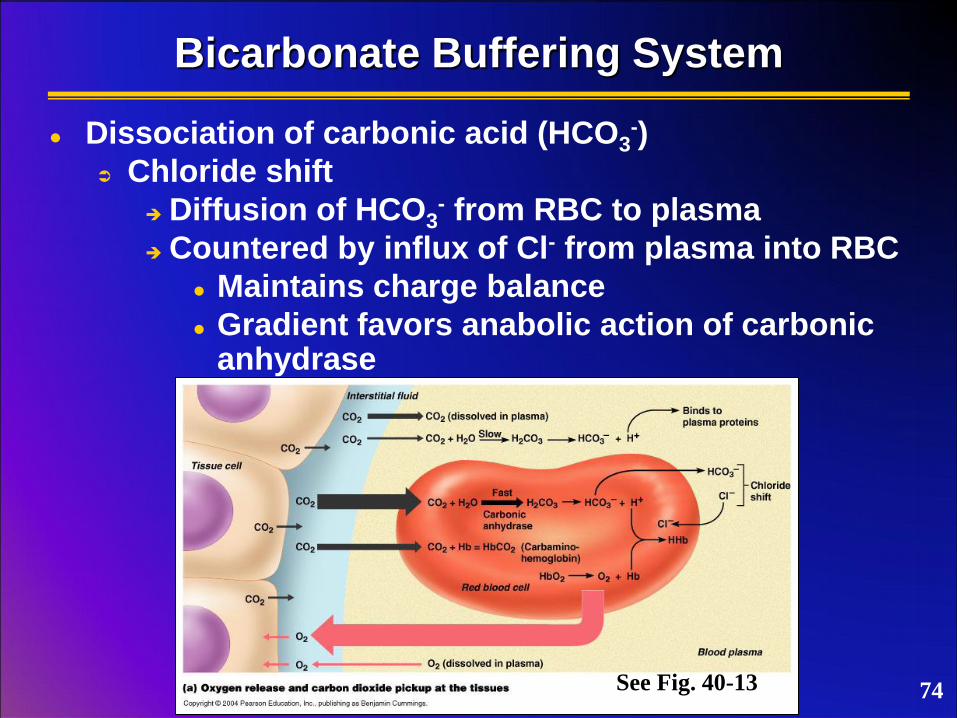
Bicarbonate Buffering System
Dissociation of carbonic acid (HCO3-)
Chloride shift
Diffusion of HCO3- from RBC to plasma
Countered by influx of Cl- from plasma into RBC
Maintains charge balance
Gradient favors anabolic action of carbonic anhydrase
See Fig. 40-13 74

Bicarbonate Buffering System
CO2 transport to lungs
PCO2 in blood
See Fig. 40-13
75

True or false: Carbonic anhydrase may catalyze
opposite reactions depending on conditions.
A) True
B) False
76

Bohr Effect
Effect of changes in pH and CO2 on the unloading / loading of O2 with hemoglobin Tissues
Uptake of CO2…
carbonic acid ( H+)
O2-Hb curve shifts right
O2 affinity for Hgb ( O2 unloading)
77

Bohr Effect
Effect of changes in pH and CO2 on the unloading / loading of O2 with hemoglobin Lungs
Removal of CO2…
carbonic acid ( H+)
O2-Hb curve shifts left
O2 affinity for Hgb ( O2 loading)
78

Haldane Effect
Effect of O2/Hgb binding on the displacement & uptake of CO2
Lungs
HgbO2 formation (O2 loading) releases H+
tendency of Hgb to form HgbCO2
Drives catabolic action of carbonic anhydrase (CO2 formation)
79

Haldane Effect
Effect of O2/Hgb binding in the displacement & uptake of CO2
Tissues
HgbO2 dissociation (O2 unloading) frees Hgb
Favors HHgb & HgbCO2 formation
H+ utilization drives anabolic action of carbonic anhydrase
80

The ability of protons to influence O2 loading to
hemoglobin is the…
A) Haldane effect
B) Bohr effect
81
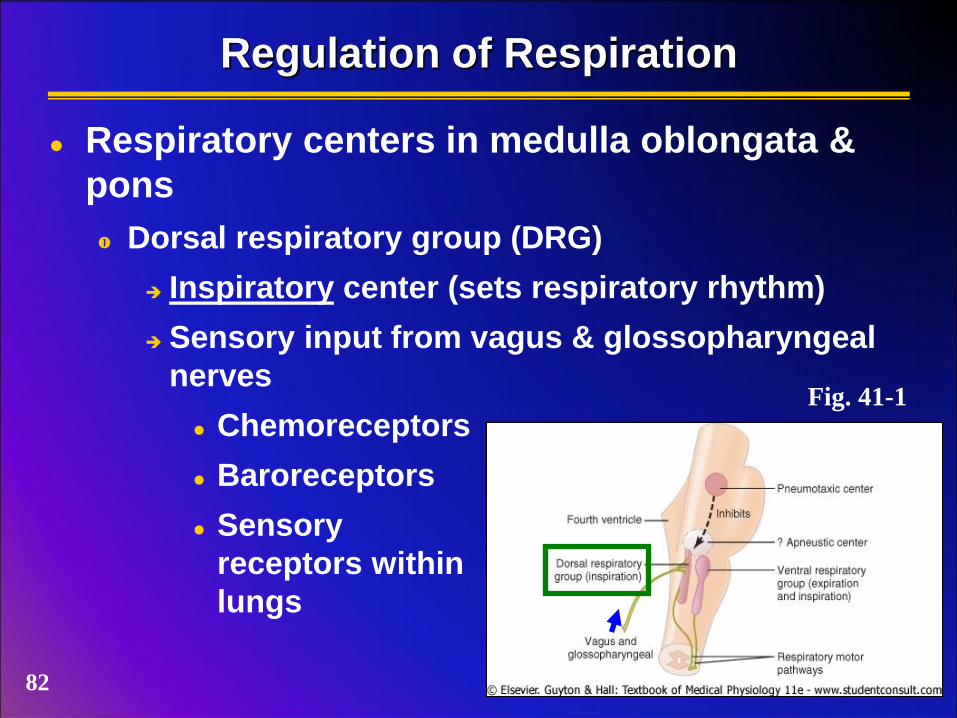
Regulation of Respiration
Respiratory centers in medulla oblongata &
pons
Dorsal respiratory group (DRG)
Inspiratory center (sets respiratory rhythm)
Sensory input from vagus & glossopharyngeal
nerves
Chemoreceptors
Baroreceptors
Sensory
receptors within
lungs
Fig. 41-1
82
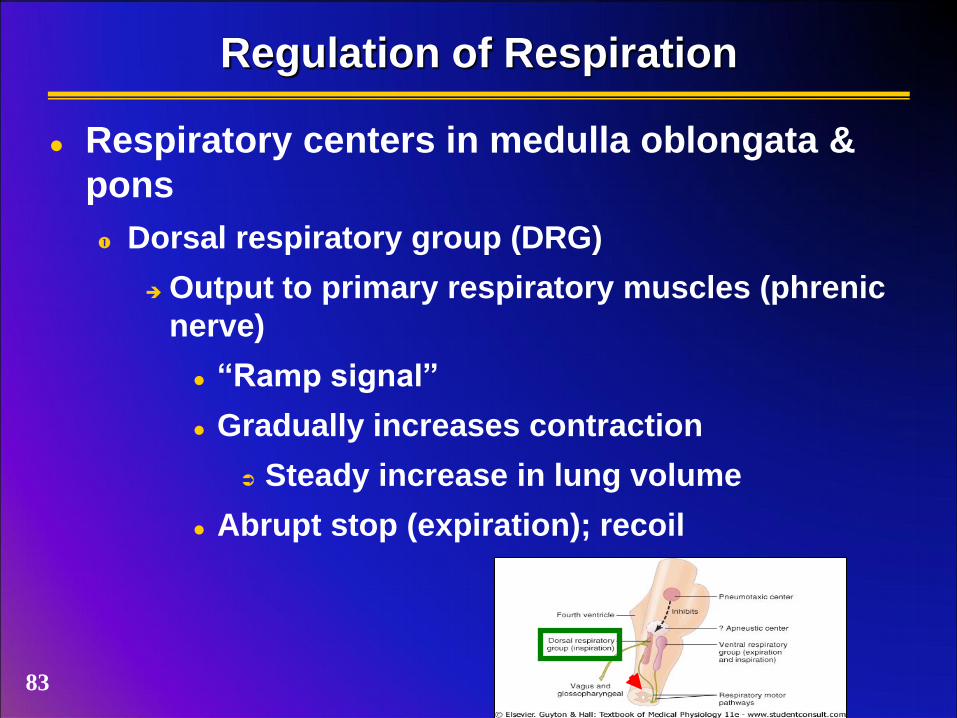
Regulation of Respiration
Respiratory centers in medulla oblongata &
pons
Dorsal respiratory group (DRG)
Output to primary respiratory muscles (phrenic
nerve)
“Ramp signal”
Gradually increases contraction
Steady increase in lung volume
Abrupt stop (expiration); recoil
83
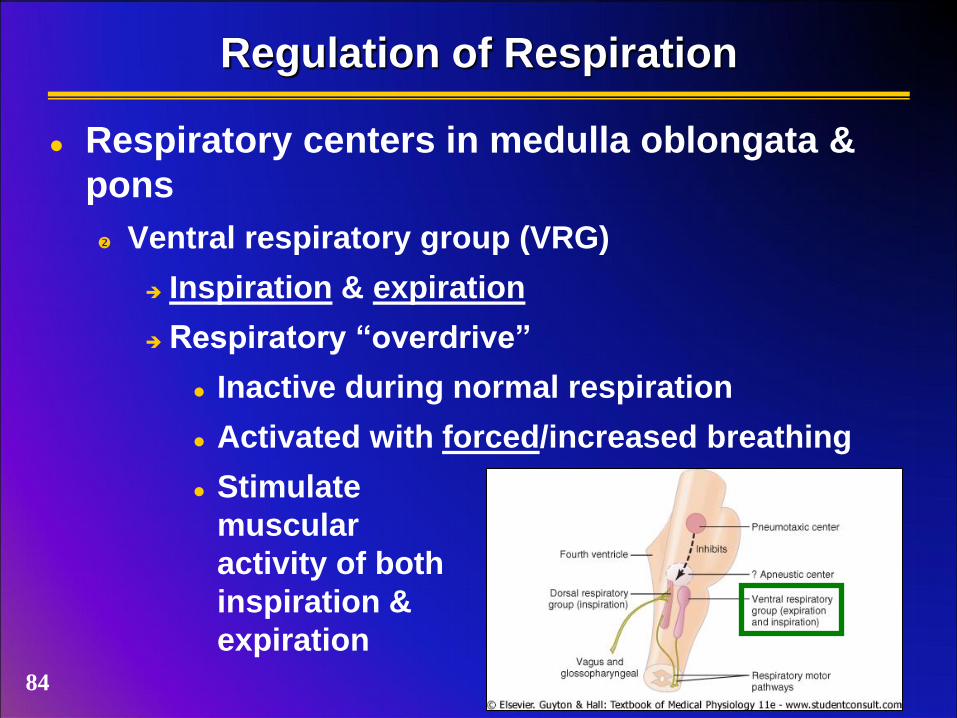
Regulation of Respiration
Respiratory centers in medulla oblongata &
pons
Ventral respiratory group (VRG)
Inspiration & expiration
Respiratory “overdrive”
Inactive during normal respiration
Activated with forced/increased breathing
Stimulate
muscular
activity of both
inspiration &
expiration
84
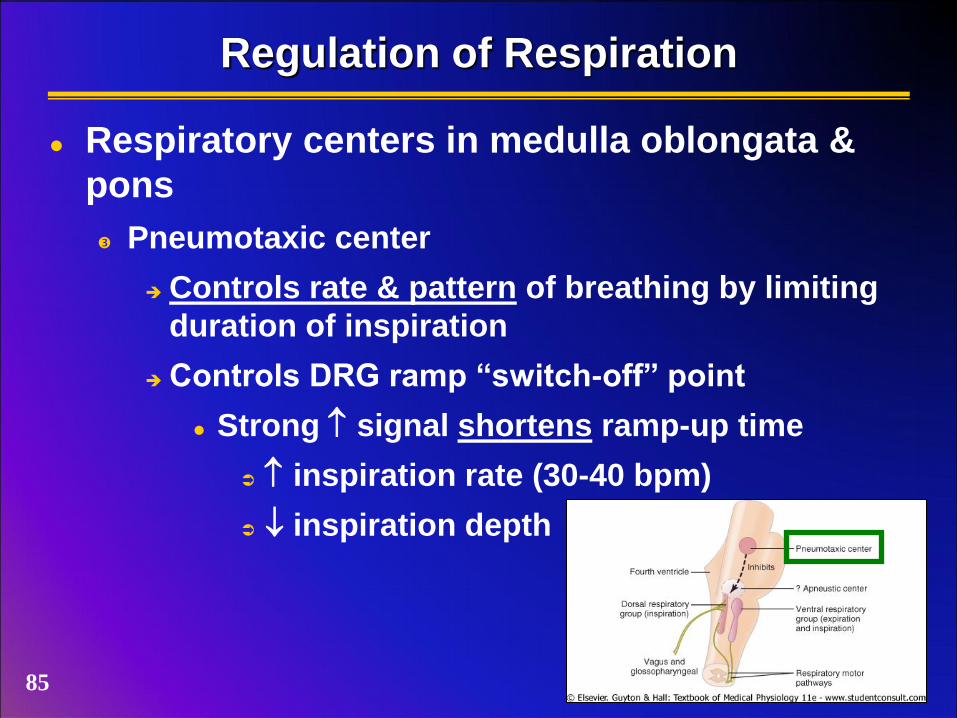
Regulation of Respiration
Respiratory centers in medulla oblongata &
pons
Pneumotaxic center
Controls rate & pattern of breathing by limiting
duration of inspiration
Controls DRG ramp “switch-off” point
Strong signal shortens ramp-up time
inspiration rate (30-40 bpm)
inspiration depth
85
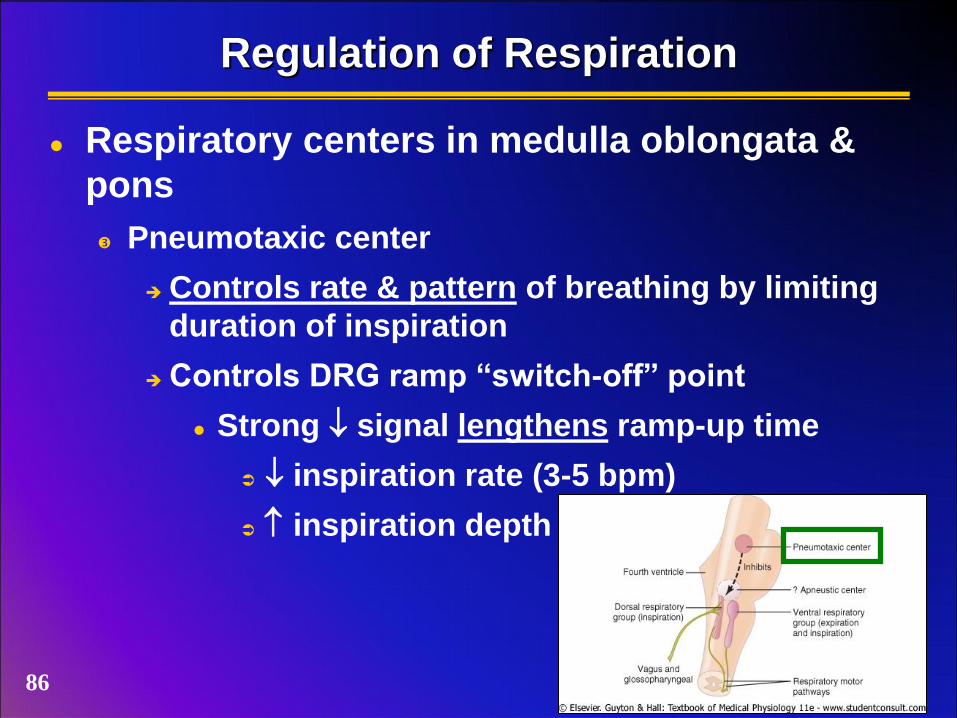
Regulation of Respiration
Respiratory centers in medulla oblongata &
pons
Pneumotaxic center
Controls rate & pattern of breathing by limiting
duration of inspiration
Controls DRG ramp “switch-off” point
Strong signal lengthens ramp-up time
inspiration rate (3-5 bpm)
inspiration depth
86

Hering-Breuer Inflation Reflex
Response of lung inflation to limit respiration
Functions to protect against excess stretch
Inflation of lungs increases output signal from
baroreceptors
Increased stimulus (vagal afferents) inhibits DRG
Terminates inspiration (ramp-off)
Sensory receptors within lungs
Deflation of lungs decreases output signal from
baroreceptors
Decreased stimulus (vagal afferents), DRG not
inhibited
Begins ramp-up 87
Which center in the medulla is primarily
responsible for setting respiratory rate?
A) Dorsal respiratory group
B) Pneumotaxic center
C) Ventral respiratory group
D) All of the above
88

Chemical Control of Respiration
Goal of respiration
Maintain O2, CO2, H+ concentrations in blood &
tissues
Control of respiration
Response to changes in O2, CO2, H+ concentrations
CO2 & H+ act centrally on respiratory centers
O2 input from peripheral locations
89

CO2, Blood pH and Regulation of Breathing
Fig. 41-3 90

CO2, H+ & Respiratory Control
Chemosensitive area of respiratory center
blood [CO2] provides indirect stimulation
CO2 diffuses into chemosensitive area
Reacts with H2O in tissues
blood PCO2 tissue PCO2 H+
Effect
ventilation
91 Fig. 41-2
CO2, Blood pH and Regulation of Breathing
Carbonic acid-bicarbonate buffering system
CO2 + H2O H2CO3 HCO3- + H+
pH drives equilibrium
pH ( H+)
Drives equation left
Rapid / deep breathing
Releases more CO2 raises pH (removes free H+)
pH ( H+)
Drives equation right
Slow / shallow breathing
Retains more CO2 lowers pH (increases free H+)
92

O2 & Respiratory Control
Peripheral chemoreceptors
Stimulated by arterial PO2
Lesser extent by CO2 & H+
Primarily carotid & aortic bodies
Carotid bodies
Afferents (Hering’s glossopharyngeal)
Synapse at DRG
Aortic bodies
Afferents (vagus)
Synapse at DRG
Fig. 41-4 93
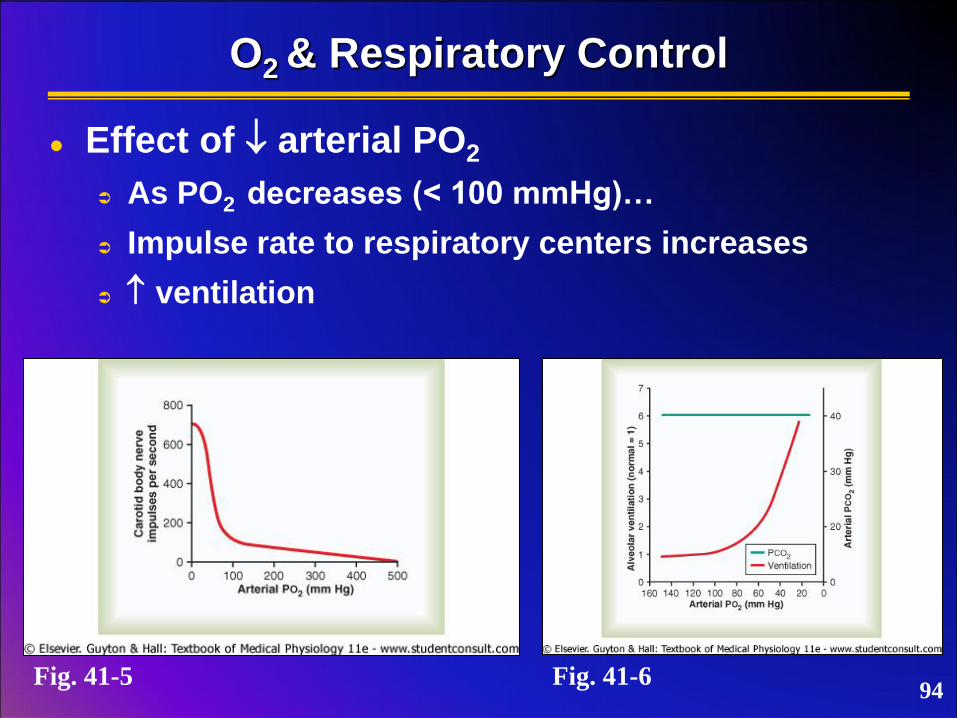
O2 & Respiratory Control
Effect of arterial PO2
As PO2 decreases (< 100 mmHg)…
Impulse rate to respiratory centers increases
ventilation
Fig. 41-5 Fig. 41-6 94

True or false: Oxygen drives breathing rate
more than carbon dioxide.
A) True
B) False
95

Respiratory Insufficiency
Hypoxia
Inadequate delivery of O2 to tissues
Cyanosis
Skin, mucosa, nail beds turn “blue”
Depressed mental activity (may lead to coma)
Reduced muscle activity
Cell death
96
Respiratory Insufficiency
Asthma
Hypersensitivity (allergy) to airborne substances
Reaction
Immune response
Release of leukotrienes, bradykinin, histamine,
etc.
Localized edema (walls of bronchioles)
Smooth muscle spasm (bronchioles)
Increased airway resistance (decreased
ventilation)
Expiration difficulty
May cause dyspnea 97

Respiratory Insufficiency
Asthma
Common treatments
Bronchodilators
Simulate sympathetic response (bronchiole
dilation)
Immediate relief
Corticosteroid aerosols
Long term therapy
Reduce frequency / intensity of attacks
98

Respiratory Insufficiency
Effect of CO
Competes with O2 for heme sites on Hb
~250x affinity for Hb
At PCO of 0.4 mmHg in alveoli, competes equally
with O2 for Hb
Treatment
PO2 (pure O2)
Greater pressure differential displaces CO
PCO2
Increase ventilation
99

True or false: Oxygen drives breathing rate
more than carbon dioxide.
A) True
B) False
100