THE RESEARCH ON THE IMPACT - Economics & · PDF fileAlgita Miečinskienė, Indrė Lapinskaitė...
18
Algita Miečinskienė, Indrė Lapinskaitė ISSN 2071-789X RECENT ISSUES IN ECONOMIC DEVELOPMENT Economics & Sociology, Vol. 7, No 4, 2014 71 Algita Miečinskienė, Department of Financial Engineering, Faculty of Business Management, Vilnius Gediminas Technical University, Vilnius, Lithuania, E-mail: [email protected] THE RESEARCH ON THE IMPACT OF THE CHANGES OF COMMODITY PRICE LEVEL IN THE WORLD COMMODITY EXCHANGES ON VARIATION OF GENERAL PRICE LEVEL Indrė Lapinskaitė, Department of Financial Engineering, Faculty of Business Management, Vilnius Gediminas Technical University, Vilnius, Lithuania, E-mail: [email protected] ABSTRACT. The purpose of the paper is to investigate the influence of changes of commodity price level in the world commodity exchanges on variation of general price level index in Lithuania. Object of the research is commodity price level in the world commodity exchanges. The methodology applied is following: study of the recent scientific literature, collection and analysis of statistical data, correlation regression analysis. The conclusion can be made that variation of general price level in Lithuania depends on changes of commodity prices in world commodity exchanges, mostly from the prices of aluminium, cocoa, coal and oil. Regression function made with analysed commodities is adequate to real situation and chosen variables X explain the 64% of inflation variability and 36% are explained by other factors. The results show that the determinate regression function could be practically used to forecast the dependence of inflation rate on the particular factors. Received: June, 2014 1st Revision: September, 2014 Accepted: November, 2014 DOI: 10.14254/2071- 789X.2014/7-4/5 JEL Classification: E31 Keywords: general price level, inflation, commodity price, commodity exchange, market, Lithuania. Introduction For many years modern economies is facing significant problem of overall increasing general price level. During which the value of monetary unit falls and decreases its purchasing power – so called inflation appears. Inflation affects not only the area of prices, but directly and indirectly it touches the various areas of economic and social life, causing many negative consequences for country„s economic development. Commodity prices are volatile as well as most of commodity exchanges are volatile and dynamic. It affects the domain of specific fields, such as agricultural economics. For many financial institutions worldwide commodity trading has become an important mean to gain profit. Commodities nowadays are an important component of many investors' portfolios. One of the most influential factors affecting inflation rate is the price of production costs, from which mainly depends the final price of goods and services in a market. Therefore Miečinskienė, A., Lapinskaitė, I. (2014), The Research on the Impact of the Changes of Commodity Price Level in the World Commodity Exchanges on Variation of General Price Level, Economics and Sociology, Vol. 7, No 4, pp. 71-88. DOI: 10.14254/2071-789X.2014/7-4/5
Transcript of THE RESEARCH ON THE IMPACT - Economics & · PDF fileAlgita Miečinskienė, Indrė Lapinskaitė...
Algita Miečinskienė, Indrė Lapinskaitė
ISSN 2071-789X
RECENT ISSUES IN ECONOMIC DEVELOPMENT
Economics & Sociology, Vol. 7, No 4, 2014
71
Algita Miečinskienė, Department of Financial Engineering, Faculty of Business Management, Vilnius Gediminas Technical University, Vilnius, Lithuania, E-mail: [email protected]
THE RESEARCH ON THE IMPACT OF THE CHANGES OF COMMODITY
PRICE LEVEL IN THE WORLD COMMODITY EXCHANGES
ON VARIATION OF GENERAL PRICE LEVEL
Indrė Lapinskaitė, Department of Financial Engineering, Faculty of Business Management, Vilnius Gediminas Technical University, Vilnius, Lithuania, E-mail: [email protected]
ABSTRACT. The purpose of the paper is to investigate the influence of changes of commodity price level in the world commodity exchanges on variation of general price level index in Lithuania. Object of the research is commodity price level in the world commodity exchanges. The methodology applied is following: study of the recent scientific literature, collection and analysis of statistical data, correlation regression analysis. The conclusion can be made that variation of general price level in Lithuania depends on changes of commodity prices in world commodity exchanges, mostly from the prices of aluminium, cocoa, coal and oil. Regression function made with analysed commodities is adequate to real situation and chosen variables X explain the 64% of inflation variability and 36% are explained by other factors. The results show that the determinate regression function could be practically used to forecast the dependence of inflation rate on the particular factors.
Received: June, 2014 1st Revision: September, 2014 Accepted: November, 2014 DOI: 10.14254/2071-789X.2014/7-4/5
JEL Classification: E31 Keywords: general price level, inflation, commodity price, commodity exchange, market, Lithuania.
Introduction
For many years modern economies is facing significant problem of overall increasing
general price level. During which the value of monetary unit falls and decreases its
purchasing power – so called inflation appears. Inflation affects not only the area of prices,
but directly and indirectly it touches the various areas of economic and social life, causing
many negative consequences for country„s economic development.
Commodity prices are volatile as well as most of commodity exchanges are volatile
and dynamic. It affects the domain of specific fields, such as agricultural economics. For
many financial institutions worldwide commodity trading has become an important mean to
gain profit. Commodities nowadays are an important component of many investors'
portfolios.
One of the most influential factors affecting inflation rate is the price of production
costs, from which mainly depends the final price of goods and services in a market. Therefore
Miečinskienė, A., Lapinskaitė, I. (2014), The Research on the Impact of the Changes of Commodity Price Level in the World Commodity Exchanges on Variation of General Price Level, Economics and Sociology, Vol. 7, No 4, pp. 71-88. DOI: 10.14254/2071-789X.2014/7-4/5

Algita Miečinskienė, Indrė Lapinskaitė
ISSN 2071-789X
RECENT ISSUES IN ECONOMIC DEVELOPMENT
Economics & Sociology, Vol. 7, No 4, 2014
72
the price changes of the most important commodities in the world„s commodity exchange
markets influence the price of local producers or imported production. This paper analyses the
influence of price changes of commodities to general price level in Lithuania. The aim of the
research is to analyze the variation of general price level in Lithuania and changes the prices
of commodities in the world„s commodity exchange markets, identify the influence of the
price changes of commodities on variations of general price level as inflation„s parameter. In
order to achieve the aim correlation regression analysis was used. It allows to set the relation
and establish the connection between price changes of commodities and general price level.
1. Inflation and factors conditioning it
Relative prices changes, income and assets are repartitioned among the different
people and groups, indexes of national production and employment depart form the average
during the inflation period. In such situation some are winners, some are losers. But these
factors have an influence on the whole economy. The costs of inflation depend not only on its
rate, but also on the expectation factor. When inflation is expected people may prepare better,
and impact will be less painful (Snieška, 2006). It is important to notice that increase of prices
of one product or several groups of products is not evaluated as inflation. Scientific and
technological development and demand fluctuations allow the prices to increase and decrease.
At the other hand change of prices of particular groups of products can be named as increase
of price level. That is why the inflation and the change of price level are adequate terms when
it comes to the growth of general price level. Some economists emphasize that the inflation is
not onetime, but long term change of price level.
Inflation and tax system operate similarly – they take somebody‟s asset and give it to
others meaning the re-distribution of assets and income. If possible to forecast the rate of
inflation and to readjust the prices and wages in accordance with it no problems will arise.
High inflation can destabilize or even destroy countries economy (Snieška, 2006). Significant
economic, social and political problems arise when it is difficult to forecast price level
change. It‟s connected with the distribution of assets and income among different subjects in
the economy. This re-distribution is spontaneous and touches despite the age and financial
position. Therefore it is sometimes emphasized that inflation (deflation) has no social
consciousness (Snieška, 2006; Gerdesmeier, 2009). But usually the inflation and deflation has
the influence on the poorest groups of society, as they have limited possibilities to protect
themselves. So, the price stability helps to maintain the cohesion of the society (Gerdesmeier,
2009). Conferment and maintenance of deflation or high inflation according to Duisenberg
(Ghoshray, 2014) is equal to maintenance of offence against the society.
The definition of inflation is not very profound. Nausėda (1994) defined that the
concept of inflation reflects rising prices in the national economy. Inflation is understood as a
decrease of the purchasing power of monetary unit, which can be measured as the price level
index. According to Malliaris (2006) inflation is broadly defined as the process of
continuously rising prices. Since there are several ways to measure the rate of price increases
therefore there are also different measures of inflation. Currently, the most commonly used
monthly measure of inflation is the percentage change in the consumer price index (hereinafter
– CPI) and the most common quarterly measure is the percentage change in the gross
domestic product implicit price deflator
The price level index is the index characterizing the state of price during the particular
period, in particular place. The price level can be individual, average or general. The
individual price level indicates instantaneous price of the product, the average level shows the
average price of product, group of products, in particular territory, submarket, of group of
consumers. The general price level measures the total price of “shopping basket“. This basket

Algita Miečinskienė, Indrė Lapinskaitė
ISSN 2071-789X
RECENT ISSUES IN ECONOMIC DEVELOPMENT
Economics & Sociology, Vol. 7, No 4, 2014
73
contains a broad range of products which are typically consumed by a representative
household (Miečinskienė & Ževžikova, 2008). A price index is a numerical measure designed
to help to compare how the prices of “shopping basket” differ between time periods or
geographical locations. Inflation is an increase in the general level of prices or a rise in the
prices of a “shopping basket“.
There are many factors influencing price level changes. Governmental regulations and
control of prices one of them. The governmental intervention is different in various countries,
but some directions of typical regulation can be marked. One of them is price fixing (Pranulis
et al., 1999). The influence of government on prices should be systemic and balanced,
because prices allow the market to adjust supply and demand. The state intervention into the
pricing breaks the market prices system formation. The regulation determines some economic
outcomes that negatively influence business companies, citizens and the whole economy
(Simanavičienė, 2002). The changes in commodity prices, as one of the most important inputs
in a production, affect the price of final goods.
2. Interaction between commodity prices and inflation
The role of commodity prices as precursors of inflation has been addressed extensively
in the literature, with varying results. A long list of studies has shown that changes in the
Commodity Research Bureau index and other commodity price indexes led aggregate
inflation in the 1970s and the first part of the 1980s. At the same time, studies by Garner
(1995) and Bloomberg and Harris (1995) find that some commodity prices have not been
reliable leading indicators of inflation since about the mid-1980s (Furlong & Ingenit, 1996).
Commodity prices are argued to be leading indicators of inflation through two basic
channels. One is that they respond more quickly to general economic shocks, such as an
increase in demand. The second is that some changes in commodity prices reflect
idiosyncratic shocks, such as a flood that decimates the supply of certain agricultural
products, which are subsequently passed through to over all prices. Depending on the type of
the shock, the observed link between commodity prices and inflation would be expected to be
different. Moreover, changes over time in the mix of shocks in the economy could affect the
stability of a bivariate link between commodity prices and inflation (Furlong & Ingenit,
1996).
Ghoshray et al. (2014) in their work pointed out that given the fact that many
developing countries are dependent on commodity prices as their main source of income, the
issue of trends in commodity prices in relation to manufactures has been of great interest in
the trade and development economics literature and a strand of theoretical research argues that
commodity prices should be stationary, due to the biological nature of production, storage and
arbitrage. The price movements of commodities as well were analysed by Dudzinski (2010).
Cashin et al. (2002) analysed empirical evidence that has generated several stylized
facts about real commodity prices: they are often dominated by long periods of doldrums
punctuated by sharp upward spikes (Deaton & Laroque, 1992); they have a tendency to trend
down in the long run (Grilli & Yang, 1988); shocks to commodity prices tend to persist for
several years at a time (Cashin et al., 1999); and unrelated commodity prices move together
(Pindyck & Rotemberg, 1990). Several of these stylized facts have been summarized by
Deaton (1999).
Commodity prices have recently re-surfaced in discussions of the inflationary outlook
for western economies. The popular view seems to be that changes in commodity prices are a
consequence of developments occurring solely in the relevant commodity market. Prompted
perhaps by the recognition that recent experiences of steep commodity price increases have
occurred alongside, or in the wake of, a relatively “easy” stance of monetary policy in

Algita Miečinskienė, Indrė Lapinskaitė
ISSN 2071-789X
RECENT ISSUES IN ECONOMIC DEVELOPMENT
Economics & Sociology, Vol. 7, No 4, 2014
74
advanced industrial economies, there has, however, been a resurgent interest in the argument
that monetary conditions account for changes in commodity prices (Browne & Cronin, 2010).
Furlong & Ingenito (1996) examine the empirical relationship between changes in
commodity prices and inflation. Their results indicate that there is a link between inflation
and commodity prices, but this link has changed considerably over time. Specifically,
commodity prices were statistically robust leading indicators of inflation during the 1970s and
early 1980s but they have been poor stand-alone indicators of inflation since the early 1980s.
Awokuse & Yang (2003) also examine the usefulness of the behaviour of commodity prices
in formulating monetary policy and conclude that commodity prices signal the future
direction of the economy. Mahdavi & Zhou (1997) distinguish between commodity prices and
gold prices as leading indicators of inflation (Malliaris, 2006).
The most direct link often cited is that between inflation and commodity prices. More
specifically, commodity price increases can lead to periods of inflation, the latter reflected in
changes in the producer and CPI. For manufactures and processors, higher commodity prices
lead to lower corporate profits, higher unemployment and result in less consumer spending. In
an overheated economy, increased futures trading activity on the part of speculators can
amplify already rising commodity prices (Kyrtsou & Labys, 2006).
Another commonly cited relationship is that between commodity price increases and
inflation. Inflation can be caused by consumer‟s, producer‟s and investor‟s expectations of the
future. “In an overheated economy, increased futures trading activity on the part of
speculators can amplify already rising commodity prices” (Kyrtsou & Labys, 2006). In this
case, if speculators expect demand for a good to rise, the price for that good will amplifies the
increase in demand, thus leading to higher consumer prices. In the precious metals industry,
for example, if there is an increase in commodity production due to speculation such that
production exceeds commodity demand, there will be a surplus causing exports to rise and
imports to fall (Kyrtsou & Labys, 2006).
Akram (2009) found that real commodity prices increase in response to interest rate
shocks that lower interest rates. Moreover, commodity prices specifically oil prices and prices
of industrial raw materials tend to display overshooting behaviour in response to such interest
rate shocks, while food prices and metal prices tend to respond gradually.
The commodity price–inflation connection is important for at least two reasons. First,
commodities are frequently touted as inflation hedges, which can be used to motivate
commodity investments. For example, Gorton & Rouwenhorst (2006) argue that an index of
commodity futures is linked with consumer price inflation, implying that commodity
investments protect real purchasing power of market participants, while Bloomberg & Harris
(1995) and Verheyen (2010) do not support a positive relation. Secondly, if commodity prices
precede general inflation in the economy they can be utilized by monetary authorities in
policy decisions. This argument is motivated by the understanding that commodity prices are
determined in efficient auction markets and should quickly reflect all available supply and
demand shocks in the economy. Furthermore, commodities tend to be important inputs in
production and thus, increases in their costs could precede inflationary pressures, see Garner
(1989) and Marquis & Cunningham (1990) among others (Ciner, 2011).
3. The analysis of dynamics of commodity prices and inflation
Commodities are inputs in the production of other goods or services. In this paper the
products grown on earth: grains; products extracted from the earth: minerals, oil, natural gas
are characterized as commodity. All of these products are at the first stage of the consumption
process, and without additional processing cannot usefully be used right away.

Algita Miečinskienė, Indrė Lapinskaitė
ISSN 2071-789X
RECENT ISSUES IN ECONOMIC DEVELOPMENT
Economics & Sociology, Vol. 7, No 4, 2014
75
As the quantity of commodity areas and resources in the world is different, for their
trade the global markets for raw materials – world commodity exchanges are formed.
Commodity exchanges are located in all continents (excluding Antarctica), and the largest are
based in the United States. One of the most popular commodity exchanges are: New York
Mercantile Exchange, London Metal Exchange, Australian Securities Exchange, Tokyo
Commodity Exchange and Dalian Commodity Exchange in China.
In this paper to analyse the changes of general price level the period of the year 2000-
2013 was chosen. As it was mention before commodity prices in global commodity
exchanges are constantly changing. For example, from January 2007 to July 2008, the price of
oil per barrel has risen more than twice (see Index, 2014l), what caused not only the increase
of costs for usage of the transport, agricultural machinery, but in general making significant
impact on the global economy.
Twelve types of commodity are chosen to analyse in this paper: nutritional raw
materials – cocoa, coffee, sugar, corn; energy raw materials – oil, natural gas, and coal; metal
raw material – copper and aluminum; material raw materials: cotton and wool.
Cocoa is the main composite element of chocolate and the price (see Figure 1) of
cocoa is mainly affected by the global demand for chocolate as well as by the supply of these
products.
Figure 1. The dynamics of cocoa and coffee prices in the period 2000-2013
Source: compiled from Index (2014a); Index (2014b).
In terms of increasing chocolate consumption, the price of cocoa for the period 2002-
2009 increased by 200%. Current period shows slow increase in cocoa prices after sharp
decrease in 2012. The price of cocoa decreased around 30% during 2012 and reached price
level as was in 2005. Cocoa prices are influenced by oil and gasoline prices because a lot of
fuel is used to irrigate their plantations, harvest, process and transport. Consequently, oil and
gasoline prices fall in late 2008 – early 2009 reduced the prices of cocoa (Meat, 2014).
Coffee prices have fallen sharply from 6 USD per kilo in 2011 till 4,1 USD per kilo in
2012 as a result of increased production (see Figure 1). Yahoo (2014a) cited International
Coffee Organization that coffee prices continue to fall as a result of increased supply. Coffee
demand in producing nations grew by 3,3% while demand in emerging markets fell by 2%
(ICO, 2014). If the trend of the coffee and cocoa prices remain, presumable that in the in the
coming years, the price of coffee will become lower as the price of cocoa again, what was
observed in a period of 2004-2009.
Sugar is one of the oldest and most popular raw materials on the global market. Sugar
trade mostly in London and New York exchanges. 2006/2007 sugar prices fall from 38 to 21
cents/kg – at that time the highest price of sugar of the last 25 years, what helped to increase
the sugar plantations and supply, causing the influence of prices decrease (Money, 2006).
0
1
2
3
4
5
6
7
2000 2001 2002 2003 2004 2005 2006 2007 2008 2009 2010 2011 2012 2013
Pri
ce, U
SD p
er
kilo
Cocoa
Coffee
Algita Miečinskienė, Indrė Lapinskaitė
ISSN 2071-789X
RECENT ISSUES IN ECONOMIC DEVELOPMENT
Economics & Sociology, Vol. 7, No 4, 2014
76
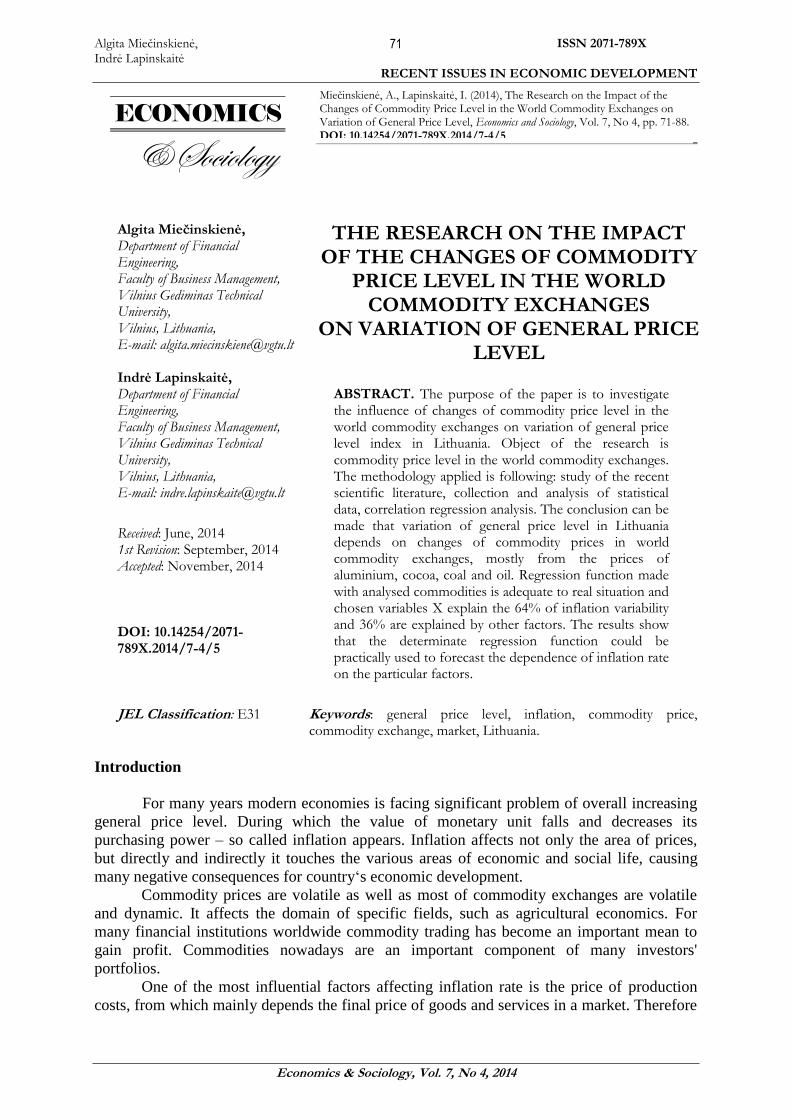
From 2007 to 2011 the price of sugar increased 3 times (see Figure 2). Bloomberg (2014)
forecasts that the global sugar surplus will fall 70% next season as consumption rises “quite
strongly” and production begins to decline after three years of lower prices. World sugar
supply will exceed demand by 1,6 million metric tons in the 2014-2015 season. That
compares with a surplus of 5,5 million tons in 2013-2014 (Bloomberg, 2014).
Figure 2. The dynamics of sugar prices in the period 2000-2013
Source: compiled from Index (2014c).
Prices of corn (see Figure 3) have evolved along with the whole grain market. At
about the same time that ethanol production was ramping up in the United States, so did food
prices around the world. With government support in the form of tax credits and grants
boosting demand, and oil prices on the rise, acreage that might have been allocated for food
was sowed with corn slated for ethanol (Chemically, 2008). In 2011 corn prices climbed into
record territory. Corn prices fall on expectations for strong crop in 2012/2013. So the situation
was presented by ABCnews (2014) „Corn prices settling lower for the fourth day as
expectations build for a plentiful harvest. Corn dropped 7 cents, nearly 2%, to settle at 4.58
USD for a bushel, its lowest settlement price since Feb. 27, according to FactSet“.
Figure 3. The dynamics of corn prices in the period 2000-2013
Source: compiled from Index (2014e).
Cotton and wool price dynamics till the year of 2007 showed much greater
discrepancy than corn prices (see Figure 4).
0
10
20
30
40
50
60
70
2000 2001 2002 2003 2004 2005 2006 2007 2008 2009 2010 2011 2012 2013
Pri
ce, U
SD c
en
ts p
er
kilo
Sugar

Algita Miečinskienė, Indrė Lapinskaitė
ISSN 2071-789X
RECENT ISSUES IN ECONOMIC DEVELOPMENT
Economics & Sociology, Vol. 7, No 4, 2014
77
Figure 4. The dynamics of cotton and wool prices in the period 2000-2013
Source: compiled from Index (2014f); Index (2014g).
The growth of cotton prices in a period of 2002-2003 was mainly influenced by
China„s active behaviour in the market, which is the largest cotton producer in the world.
Since China has been increasing amounts of imported cotton, the legitimate concern to other
market participants that global cotton stocks running low has raised, resulting the rise of the
raw materials prices (Rural, 2010). Since 2009 till 2011 the cotton prices were increases
constantly. Demand for U.S. cotton is picking up, adding to concerns about the availability of
supplies of the fiber. The U.S. exports more cotton than any other country in the world. Its
biggest customers are in Asia, where mills spin the U.S. fiber into thread and yarn to make
textiles (The Wall, 2010). The price of cotton was dropped by 42% in 2012 (see Figure 4).
This was driven by traders‟ worries that slower economic growth can reduce consumers'
demand for clothes and other goods made from the fiber (Yahoo, 2014b). Cotton futures
prices stated to increase in 2013 (see Figure 4) on concerns about the size and quality of the
crops in the world's top three producers. In the Wall Street Journal (2013) was explained as
following. The U.S. has been suffering from similarly adverse weather. The U.S. Department
of Agriculture in 2013 is projecting the smallest U.S. cotton crop since the 2009-2010 season,
so any additional demand for exports could squeeze prices higher (The Wall, 2013).
Wool price fluctuations were more notable as of cotton (see Figure 4). From the
beginning of the year 2000 first quarter, when the price of kilogram of wool was 2.8 USD,
over the decade the price of wool has increased up to 8.2 USD, that is 195%. In 2007 strong
interest from China, Europe and India has contributed to the rise; with the Eastern Market
Indicator finishing at 915 cents per kilogram clean (ABC, 2007). In the wake of the slow-
down in the global economy, escalating costs and a stronger currency, wool prices dropped
sharply at the opening sale of the 2008/09 season, and Cape Wools‟ Merino indicator closed
down 9.6% on the closing sale of the previous season at R55.51/kg (clean) (Wool, 2008). But
in 2009 with lower volumes of wool coming forward, buyers had to be very active to fulfil
orders for export and scouring and continued strong demand from Chinese buyers kept the
price of fine crossbred fleece and shears trending up (Wool, 2010). In a period 2010/2012
prices reached new highs at the wool sale and slow downturn of wool prices we can see in
2013.
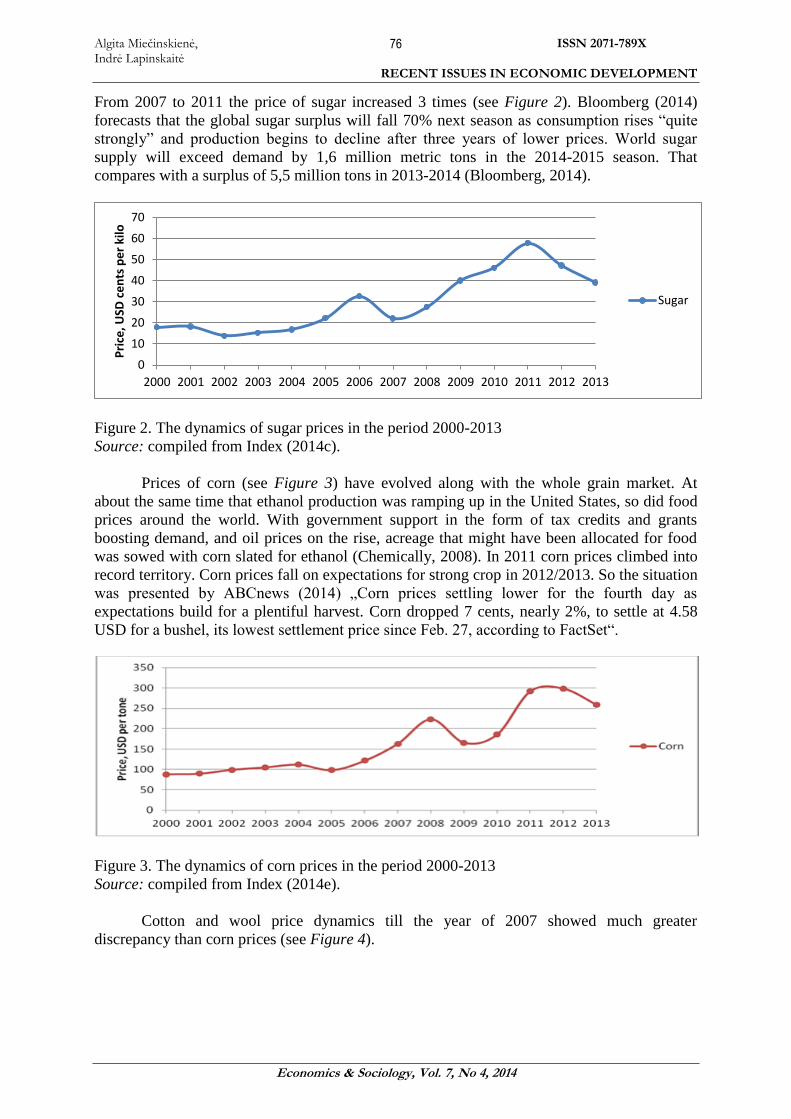
The price of aluminum is directly related to transport and construction industry,
demand of cars, trucks as well as growing demand of residential and business areas. After
hitting a high of 2.6 USD per kilo in 2008, aluminum prices have dropped over 40% from
their peak (see Figure 5).
0
2
4
6
8
10
12
14
2000 2001 2002 2003 2004 2005 2006 2007 2008 2009 2010 2011 2012 2013
Pri
ce, U
SD p
er
kilo
Cotton
Wool
Algita Miečinskienė, Indrė Lapinskaitė
ISSN 2071-789X
RECENT ISSUES IN ECONOMIC DEVELOPMENT
Economics & Sociology, Vol. 7, No 4, 2014
78
Figure 5. The dynamics of aluminum prices in the period 2000-2013
Source: compiled from Index (2014h).
The wave of price fluctuations during the period 2009-2013 with second price peak in
2011 and followed decrease during 2012/2013 can be clearly recognized. Aluminum is an
industrial base metal which is almost universally essential in the production of consumer
goods. Thus, the global economic downturn is one of the main factors in the price pullback.
Demand for aluminum mill products from the transportation, packaging, and construction
industries has fallen by a third since the worldwide recession began. Another force that has
contributed to the sharp decline in aluminum prices (perhaps even more than sinking demand)
is overproduction, which has led to a significant supply/demand imbalance (Koyfman, 2009).
The prices for copper were changing similar as the prices of aluminum, however as a
larger amplitude. In a period 2000-2008 the price of copper increased more than 3 times –
from 1814 USD till 6963 USD per tonne (see Figure 6). It is most closely related to the
overall economic development. Copper is needed by expanding the urban public transport
infrastructure, electric power plants, as well as manufacturing facilities, residential and
business buildings. At the end of 2008 the price of copper has fall. Declining global economic
growth was one negative macroeconomic influence governing future price direction (Reuters,
2008). From 2009 the price for copper rose on more signs that China's economy is regaining
strength. China is the world's biggest buyer of the industrial metal, so traders tend to buy
copper contracts on signs the country's economy is growing. Concerns over China's economy
have been the main reason copper prices have slumped 7% in 2013 (ABC, 2014) (see
Figure 6).
Figure 6. The dynamics of copper prices in the period 2000-2013
Source: compiled from Index (2014i).
Natural gas is one of the most important energy commodities the last decade has
witnessed significant price hikes (see Figure 7). Natural gas prices are mainly driven
0
500
1000
1500
2000
2500
3000
2000 2001 2002 2003 2004 2005 2006 2007 2008 2009 2010 2011 2012 2013
Pri
ce, U
SD p
er
ton
e
Aluminum
0
2000
4000
6000
8000
10000
2000 2001 2002 2003 2004 2005 2006 2007 2008 2009 2010 2011 2012 2013
Pri
ce, U
SD p
er
ton
e
Copper

Algita Miečinskienė, Indrė Lapinskaitė
ISSN 2071-789X
RECENT ISSUES IN ECONOMIC DEVELOPMENT
Economics & Sociology, Vol. 7, No 4, 2014
79
by supply and demand fundamentals, but natural gas prices may also be linked to the price
of crude oil and/or petroleum products. Natural gas is one of the most unpredictable and the
most difficult to forecast commodity, the price could double or drop in half in just a few
months (Why, 2010). Looking at the price dynamics of all the commodities‟ analysing in this
research, only the price of natural gas in 2013 was lower than it was in 2000.
Figure 7. The dynamics of natural gas prices in the period 2000-2013
Source: compiled from Index (2014j).
Coal prices during the period of 2000-2007 have doubled (see Figure 8). The highest
growth rate is captured in 2007/2008, when coal prices during one and a half years increased
by more than two times. In 2009 the overall fall in prices of energy commodities occurred
particularly in coal market, where starting 2008 the third quarter to 2009 to the first quarter,
the price of coal has fallen from 136 dollars to 77 USD per ton (see Figure 8). Thermal coal
prices are likely to fall in 2014 as mining output increases in an already oversupplied market
while demand in emerging markets drops. Prices of coal, the top fuel used to generate
electricity in the world, have halved from a peak in 2011 and are down almost 70% from their
all-time highs in 2008 (Reuters, 2014).
Figure 8. The dynamics of coal prices in the period 2000-2013
Source: compiled from Index (2014k).
The most popular and best value energy source, crude oil prices grew steadily until the
second quarter of 2008, when oil prices reached a record – 97 USD per barrel (see Figure 9).
0
2
4
6
8
10
2000 2001 2002 2003 2004 2005 2006 2007 2008 2009 2010 2011 2012 2013Pri
ce, U
SD p
er
mm
BTU
Natural gas
0
50
100
150
2000 2001 2002 2003 2004 2005 2006 2007 2008 2009 2010 2011 2012 2013
Pri
ce, U
SD p
er
ton
e
Coal
Algita Miečinskienė, Indrė Lapinskaitė
ISSN 2071-789X
RECENT ISSUES IN ECONOMIC DEVELOPMENT
Economics & Sociology, Vol. 7, No 4, 2014
80
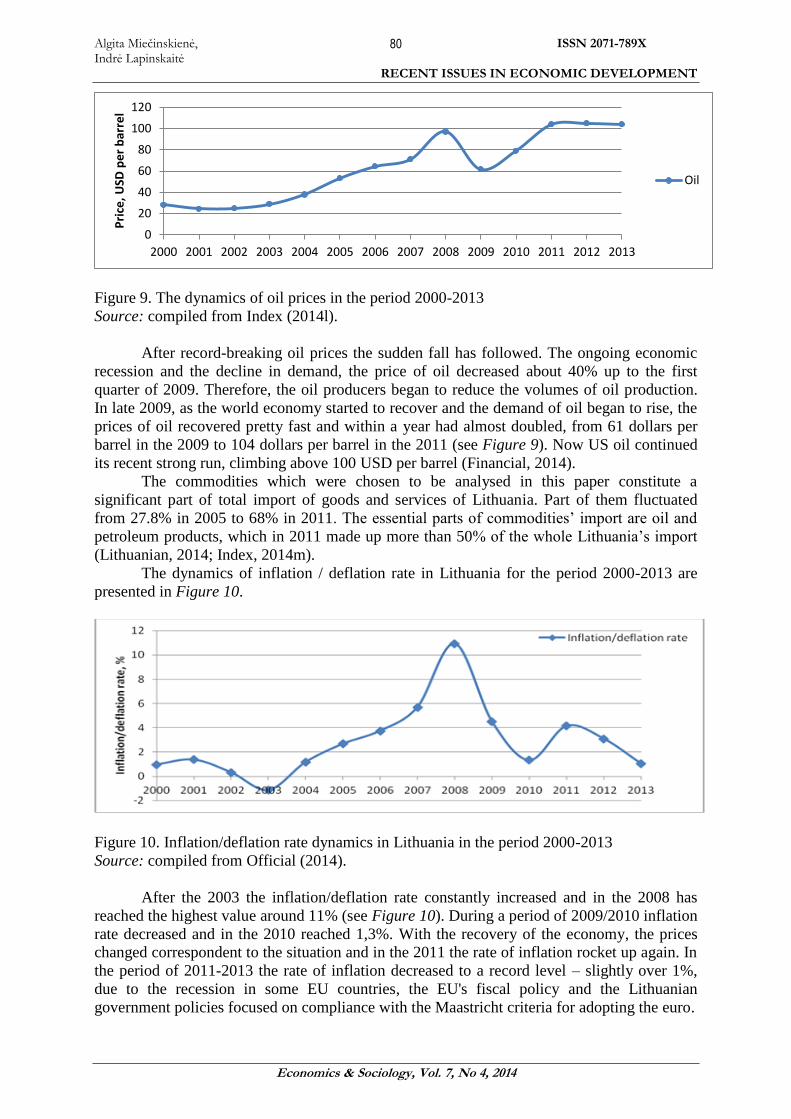
Figure 9. The dynamics of oil prices in the period 2000-2013
Source: compiled from Index (2014l).
After record-breaking oil prices the sudden fall has followed. The ongoing economic
recession and the decline in demand, the price of oil decreased about 40% up to the first
quarter of 2009. Therefore, the oil producers began to reduce the volumes of oil production.
In late 2009, as the world economy started to recover and the demand of oil began to rise, the
prices of oil recovered pretty fast and within a year had almost doubled, from 61 dollars per
barrel in the 2009 to 104 dollars per barrel in the 2011 (see Figure 9). Now US oil continued
its recent strong run, climbing above 100 USD per barrel (Financial, 2014).
The commodities which were chosen to be analysed in this paper constitute a
significant part of total import of goods and services of Lithuania. Part of them fluctuated
from 27.8% in 2005 to 68% in 2011. The essential parts of commodities‟ import are oil and
petroleum products, which in 2011 made up more than 50% of the whole Lithuania‟s import
(Lithuanian, 2014; Index, 2014m).
The dynamics of inflation / deflation rate in Lithuania for the period 2000-2013 are
presented in Figure 10.
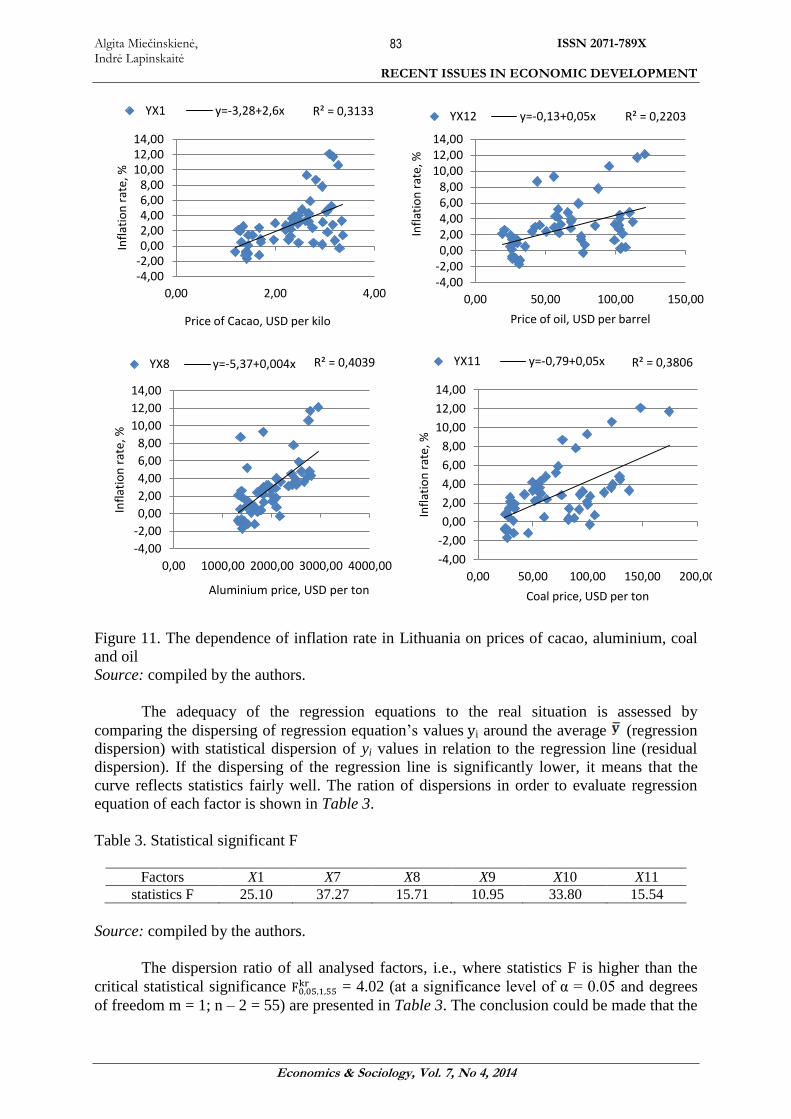
Figure 10. Inflation/deflation rate dynamics in Lithuania in the period 2000-2013
Source: compiled from Official (2014).
After the 2003 the inflation/deflation rate constantly increased and in the 2008 has
reached the highest value around 11% (see Figure 10). During a period of 2009/2010 inflation
rate decreased and in the 2010 reached 1,3%. With the recovery of the economy, the prices
changed correspondent to the situation and in the 2011 the rate of inflation rocket up again. In
the period of 2011-2013 the rate of inflation decreased to a record level – slightly over 1%,
due to the recession in some EU countries, the EU's fiscal policy and the Lithuanian
government policies focused on compliance with the Maastricht criteria for adopting the euro.
0
20
40
60
80
100
120
2000 2001 2002 2003 2004 2005 2006 2007 2008 2009 2010 2011 2012 2013
Pri
ce, U
SD p
er
bar
rel
Oil

Algita Miečinskienė, Indrė Lapinskaitė
ISSN 2071-789X
RECENT ISSUES IN ECONOMIC DEVELOPMENT
Economics & Sociology, Vol. 7, No 4, 2014
81
Summarizing the analysis of dynamic of commodity prices in a period of 2000-2013,
it can be assumed that the prices of commodities are very sensitive to the changes of market
conditions. In addition, the prices of mostly all analysed commodities grew from 100% to
more than 300% in the period of 2000-2013. It was determined that only the price of natural
gas in 2013 was lower than it was in 2000. The significant changes of commodity prices in
world commodity exchanges could have an impact for prices changes of final goods and
services in Lithuania. The research of the dependence and the results of it are presented in the
next chapter.
4. The evaluation of Impact of Commodity Prices Changes to General Price Level in
Lithuania
As it was mentioned in the beginning, the aim of this paper is to investigate if the
influence of changes of commodity price level in the world commodity exchanges makes
significant impact on the Lithuanian general price level fluctuations. If the following findings
show that the influence is significant, the dependency expression will be found. To identify
the influence of changes of commodity price level on general price level a correlation
regression analysis will be used. Will be identified the dependence between Y (the rate of
inflation in Lithuania) and selected factors:
X1 (price of cocoa, USD per kilo); X2 (price of cafe, USD per kilo);
X3 (price of sugar, USD cents per kilo); X4 (price of corn, USD per ton );
X5 (price of cotton, USD cents per kilo); X6 (price of wool, USD cents per kilo);
X7 (price of aluminum, USD per ton); X8 (price of copper, USD per ton);
X9 (price of natural gas, USD per mmBTU); X10 (price of coal, USD per ton);
X11 (price of oil, USD per barrel).
The quarterly data used for research in period 2000-2013. All calculations were done
using Microsoft Excel program. The calculated numerical characteristics of all selected
factors are presented in the Table 1.
Table 1. Numerical characteristics
Y X1 X2 X3 X4 X5
Sum 159.90 133.31 144.64 1700.67 9415.41 9265.61
Mean 2.81 2.34 2.54 29.84 165.18 162.55
Variance 9.70 0.45 2.07 205.82 5823.34 4728.23
Standard deviation 3.11 0.67 1.44 14.35 76.31 68.76
X6 X7 X8 X9 X10 X11
Sum 40755.27 110926.53 290703.57 304.38 4032.90 3639.11
Mean 715.00 1946.08 5100.06 5.34 70.75 63.84
Variance 88354.07 221995.05 7545899.38 4.56 1426.32 1008.38
Standard deviation 297.24 471.16 2746.98 2.14 37.77 31.76
Source: compiled by the authors.
From the Table 1 it is seen that the average of inflation in Lithuania of the previous 14
years is 2.81%, and the standard deviation, that is to say the dispersion of inflation, in period
of 2000-2013 is even higher than its mean – 3.11. The standard deviation of all commodity
prices was lower than their arithmetic means, what indicates that the fluctuations of
commodity prices during the period was lower than the changes of inflation rate in Lithuania.

Algita Miečinskienė, Indrė Lapinskaitė
ISSN 2071-789X
RECENT ISSUES IN ECONOMIC DEVELOPMENT
Economics & Sociology, Vol. 7, No 4, 2014
82
It should be noted that the minimum dispersion between the analysed factors has the
price of cafe (X2) which‟s standard deviation accounts for about one-fourth of the average.
The investigation of mathematical relationship between CPI and commodity prices. In
order to measure the degree to which variable Y (inflation) is linearly related with every X
(selected factors) correlation analysis is used. The analysis is carried out by two steps: the
coefficient of correlation is calculated; its significance is assessed. The calculated coefficients
of correlation presented in Table 2. The significance of the correlation coefficients is
determined from t-statistic. Critical value t (tkr = 2,00) is found using a statistical function
TINV, at the level of significance – 0,05 and degrees of freedom – 55 (i.e., 57-2). When
tkr < t, then the coefficient of correlation is significant and a stochastic dependence exists. The
t statistics values are presented in Table 2.
Table 2. The coefficients of correlation and t statistics values
X1 X2 X3 X4 X5 X6 X7 X8 X9 X10 X11
Coefficients of
correlation 0.56 0.18 0.19 0.37 0.10 0.12 0.64 0.47 0.41 0.62 0.47
Statistics t 5.01 1.33 1.42 3.00 0.73 0.88 6.11 3.96 3.31 5.81 3.94
t critical 2.00 2.00 2.00 2.00 2.00 2.00 2.00 2.00 2.00 2.00 2.00
Source: compiled by the authors.
As it is seen from Table 2, some of the coefficients of correlation calculated from
selected factors did not show a statistical relationship between them and inflation in
Lithuania. This should be said about the relationship between the prices of cafe (X2), sugar
(X3), cotton (X5), wool (X6) and inflation (Y). The impact on inflation in Lithuania during the
period had the changes of cocoa (X1), aluminum (X7), coal (X10), copper (X8), oil (X11) and
gas (X9) prices. And moderate positive relationship between Y and listed X is determined.
The determination of relationship between inflation and individual commodity prices.
After identifying that Y and some selected variables X factors are linearly relates, the
analytical expression and the form of stochastic relationship using simple liner regression
analysis are sought. The general form of the equation of regression line is following:
(1)
Using EXCEL statistical functions, the coefficients of regression line can be calculated
using the INTERCEPT (coefficient a0) and SLOPE (coefficient a1) functions. Once these
factors are found, respectively having one or the other commodity price, the dependence of
inflation rate on the particular factor can be predicted. In figures bellow (see Figure 11) the
results of regression analysis are presented.
Algita Miečinskienė, Indrė Lapinskaitė
ISSN 2071-789X
RECENT ISSUES IN ECONOMIC DEVELOPMENT
Economics & Sociology, Vol. 7, No 4, 2014
83
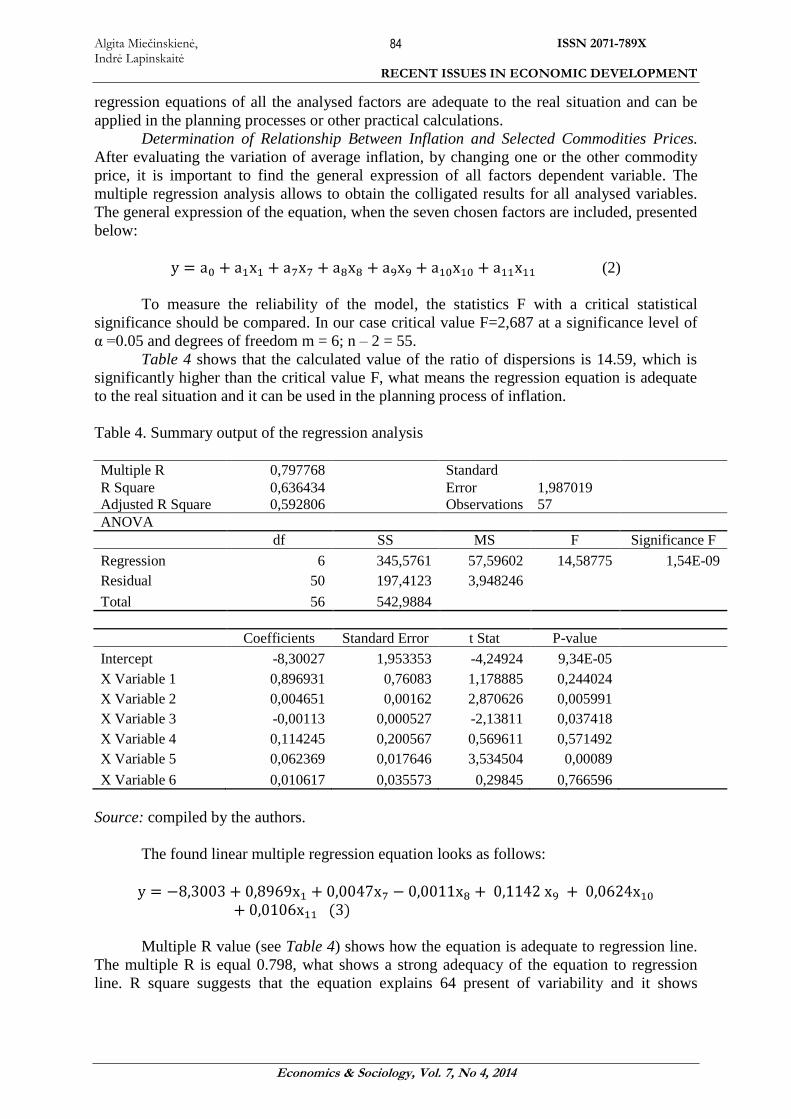
Figure 11. The dependence of inflation rate in Lithuania on prices of cacao, aluminium, coal
and oil
Source: compiled by the authors.
The adequacy of the regression equations to the real situation is assessed by
comparing the dispersing of regression equation‟s values i around the average (regression
dispersion) with statistical dispersion of yi values in relation to the regression line (residual
dispersion). If the dispersing of the regression line is significantly lower, it means that the
curve reflects statistics fairly well. The ration of dispersions in order to evaluate regression
equation of each factor is shown in Table 3.
Table 3. Statistical significant F
Factors X1 X7 X8 X9 X10 X11
statistics F 25.10 37.27 15.71 10.95 33.80 15.54
Source: compiled by the authors.
The dispersion ratio of all analysed factors, i.e., where statistics F is higher than the
critical statistical significance = 4.02 (at a significance level of α = 0.05 and degrees
of freedom m = 1; n – 2 = 55) are presented in Table 3. The conclusion could be made that the
R² = 0,3133
-4,00-2,000,002,004,006,008,00
10,0012,0014,00
0,00 2,00 4,00
Infl
atio
n r
ate
, %
Price of Cacao, USD per kilo
YX1 y=-3,28+2,6x R² = 0,2203
-4,00-2,000,002,004,006,008,00
10,0012,0014,00
0,00 50,00 100,00 150,00
Infl
atio
n r
ate,
%
Price of oil, USD per barrel
YX12 y=-0,13+0,05x
R² = 0,4039
-4,00
-2,00
0,00
2,00
4,00
6,00
8,00
10,00
12,00
14,00
0,00 1000,00 2000,00 3000,00 4000,00
Infl
atio
n r
ate,
%
Aluminium price, USD per ton
YX8 y=-5,37+0,004x R² = 0,3806
-4,00
-2,00
0,00
2,00
4,00
6,00
8,00
10,00
12,00
14,00
0,00 50,00 100,00 150,00 200,00
Infl
atio
n r
ate,
%
Coal price, USD per ton
YX11 y=-0,79+0,05x
Algita Miečinskienė, Indrė Lapinskaitė
ISSN 2071-789X
RECENT ISSUES IN ECONOMIC DEVELOPMENT
Economics & Sociology, Vol. 7, No 4, 2014
84
regression equations of all the analysed factors are adequate to the real situation and can be
applied in the planning processes or other practical calculations.
Determination of Relationship Between Inflation and Selected Commodities Prices.
After evaluating the variation of average inflation, by changing one or the other commodity
price, it is important to find the general expression of all factors dependent variable. The
multiple regression analysis allows to obtain the colligated results for all analysed variables.
The general expression of the equation, when the seven chosen factors are included, presented
below:
(2)
To measure the reliability of the model, the statistics F with a critical statistical
significance should be compared. In our case critical value F=2,687 at a significance level of
α =0.05 and degrees of freedom m = 6; n – 2 = 55.
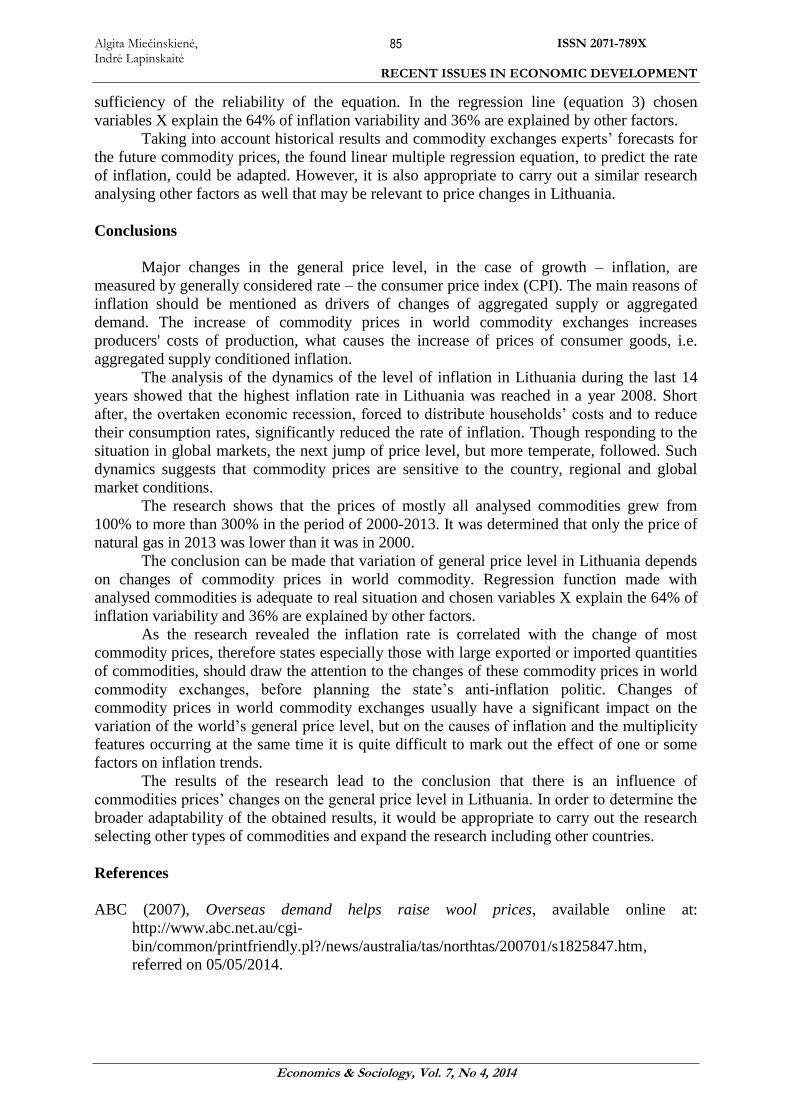
Table 4 shows that the calculated value of the ratio of dispersions is 14.59, which is
significantly higher than the critical value F, what means the regression equation is adequate
to the real situation and it can be used in the planning process of inflation.
Table 4. Summary output of the regression analysis
Multiple R 0,797768 Standard
R Square 0,636434 Error 1,987019
Adjusted R Square 0,592806 Observations 57
ANOVA
df SS MS F Significance F
Regression 6 345,5761 57,59602 14,58775 1,54E-09
Residual 50 197,4123 3,948246
Total 56 542,9884
Coefficients Standard Error t Stat P-value
Intercept -8,30027 1,953353 -4,24924 9,34E-05
X Variable 1 0,896931 0,76083 1,178885 0,244024
X Variable 2 0,004651 0,00162 2,870626 0,005991
X Variable 3 -0,00113 0,000527 -2,13811 0,037418
X Variable 4 0,114245 0,200567 0,569611 0,571492
X Variable 5 0,062369 0,017646 3,534504 0,00089
X Variable 6 0,010617 0,035573 0,29845 0,766596
Source: compiled by the authors.
The found linear multiple regression equation looks as follows:
Multiple R value (see Table 4) shows how the equation is adequate to regression line.
The multiple R is equal 0.798, what shows a strong adequacy of the equation to regression
line. R square suggests that the equation explains 64 present of variability and it shows
Algita Miečinskienė, Indrė Lapinskaitė
ISSN 2071-789X
RECENT ISSUES IN ECONOMIC DEVELOPMENT
Economics & Sociology, Vol. 7, No 4, 2014
85
sufficiency of the reliability of the equation. In the regression line (equation 3) chosen
variables X explain the 64% of inflation variability and 36% are explained by other factors.
Taking into account historical results and commodity exchanges experts‟ forecasts for
the future commodity prices, the found linear multiple regression equation, to predict the rate
of inflation, could be adapted. However, it is also appropriate to carry out a similar research
analysing other factors as well that may be relevant to price changes in Lithuania.
Conclusions
Major changes in the general price level, in the case of growth – inflation, are
measured by generally considered rate – the consumer price index (CPI). The main reasons of
inflation should be mentioned as drivers of changes of aggregated supply or aggregated
demand. The increase of commodity prices in world commodity exchanges increases
producers' costs of production, what causes the increase of prices of consumer goods, i.e.
aggregated supply conditioned inflation.
The analysis of the dynamics of the level of inflation in Lithuania during the last 14
years showed that the highest inflation rate in Lithuania was reached in a year 2008. Short
after, the overtaken economic recession, forced to distribute households‟ costs and to reduce
their consumption rates, significantly reduced the rate of inflation. Though responding to the
situation in global markets, the next jump of price level, but more temperate, followed. Such
dynamics suggests that commodity prices are sensitive to the country, regional and global
market conditions.
The research shows that the prices of mostly all analysed commodities grew from
100% to more than 300% in the period of 2000-2013. It was determined that only the price of
natural gas in 2013 was lower than it was in 2000.
The conclusion can be made that variation of general price level in Lithuania depends
on changes of commodity prices in world commodity. Regression function made with
analysed commodities is adequate to real situation and chosen variables X explain the 64% of
inflation variability and 36% are explained by other factors.
As the research revealed the inflation rate is correlated with the change of most
commodity prices, therefore states especially those with large exported or imported quantities
of commodities, should draw the attention to the changes of these commodity prices in world
commodity exchanges, before planning the state‟s anti-inflation politic. Changes of
commodity prices in world commodity exchanges usually have a significant impact on the
variation of the world‟s general price level, but on the causes of inflation and the multiplicity
features occurring at the same time it is quite difficult to mark out the effect of one or some
factors on inflation trends.
The results of the research lead to the conclusion that there is an influence of
commodities prices‟ changes on the general price level in Lithuania. In order to determine the
broader adaptability of the obtained results, it would be appropriate to carry out the research
selecting other types of commodities and expand the research including other countries.
References
ABC (2007), Overseas demand helps raise wool prices, available online at:
http://www.abc.net.au/cgi-
bin/common/printfriendly.pl?/news/australia/tas/northtas/200701/s1825847.htm,
referred on 05/05/2014.
Algita Miečinskienė, Indrė Lapinskaitė
ISSN 2071-789X
RECENT ISSUES IN ECONOMIC DEVELOPMENT
Economics & Sociology, Vol. 7, No 4, 2014
86
ABC news (2014), Report on China's economy lifts copper prices, available online at:
http://abcnews.go.com/Business/wireStory/report-chinas-economy-lifts-copper-prices-
23962726, referred on 02/06/2014.
Akram, Q. F. (2009), Commodity prices, interest rates and the dollar, Energy Economics,
Vol. 31, No 6, pp. 838-851.
Awokuse, T. and J. Yang (2003), The Informational Role of Commodity Prices in
Formulating Monetary Policy: A Reexamination, Economics Letters, Elsevier, Vol. 79,
No 2, pp. 219-224.
Bloomberg (2014), Global Sugar Surplus Seen by Green Pool Falling 70% in 2014-15,
available online at: http://www.bloomberg.com/news/2014-02-06/global-sugar-surplus-
seen-by-green-pool-falling-70-in-2014-15.html, referred on 25/05/2014.
Bloomberg, S. B., Harris, E. S. (1995), The commodity-consumer prices connection: fact or
fable? Fed Reserve Bank N.Y. Econ. Rev., pp. 21-38.
Browne, F., Cronin, D. (2010), Commodity prices, money and inflation, Journal of
Economics and Business, Vol. 62, No 4, pp. 331-345.
Cashin, P., Liang, H., McDermott, J. C. (1999), How Persistent Are Shocks to World
Commodity Prices? IMF Working paper WP/99/80 and forthcoming IMF Staff Papers,
pp. 1-54.
Cashin, P., McDermott, C. J., Scott, A. (2002), Booms and Slumps in World Commodity
Prices, Journal of Development Economics, Vol. 69, pp. 277-296.
Ciner, C. (2011), Commodity prices and inflation: Testing in the frequency domain, Research
in International Business and Finance, Vol. 25, No. 3, pp. 229-237.
Cotton futures reach five-year high (2010), Rural News, available online at:
http://www.abc.net.au/rural/news/stories/s969351.htm, referred on 28/05/2014.
Deaton, A., Laroque, G. (1992), On the Behaviour of commodity prices, Review of Economic
Studies, Vol. 59, pp. 1-25.
Deaton, A. (1999), Commodity prices and growth in Africa, The Journal of Economic
Perspectives, Vol. 13, No. 3, pp. 23–40.
Dudzinski, J. (2010), Financial investors in international raw materials and food markets and
price movements of those commodities, Economics and Sociology, Vol. 3, No. 1,
pp. 25-33.
Financial Times (2014), US oil Price Hits 2014 High Above 100$, available online at:
http://www.ft.com/cms/s/0/5bb450f6-9281-11e3-9e43-
00144feab7de.html#axzz33qo5pU85, referred on 05/06/2014.
Furlong, F., Ingenito, R. (1996), Commodity prices and inflation. Fed. Reserve Bank San
Francisco Econ. Rev., Vol. 2, pp. 27–46.
Garner, A. C. (1989), Commodity prices: policy target or information variables? Journal of
Money, Credit and Banking, Vol. 21, No. 4, pp. 508–514.
Gerdesmeier, D. (2009), Stability of Prices: Why is that importantly for you? Europe Central
Bank. Frankfurt am Main.
Ghoshray, A., Kejriwal, M. and Wohar, M. E. (2014), Breaks, trends and unit roots in
commodity prices: a robust investigation, Studies in Nonlinear Dynamics &
Econometrics, Vol. 18, No. 1, pp. 23–40.
Gorton, G., Rouwenhorst, K. G. (2006), Facts and fantasies about commodity futures,
Finance Analysts, Vol. 62, pp. 47–68.
Grilli, E., Yang, M. C. (1988), Primary commodity prices, manufactured goods prices and the
terms of trade in developing countries, World Bank Economic Review, Vol. 2, pp. 1-47.
Index Mundi (1014a), Coffee, Other Mild Arabicas, available online at:
http://www.indexmundi.com/commodities/?commodity=other-mild-arabicas-
coffee&months=60, referred on 04/06/2014.
Algita Miečinskienė, Indrė Lapinskaitė
ISSN 2071-789X
RECENT ISSUES IN ECONOMIC DEVELOPMENT
Economics & Sociology, Vol. 7, No 4, 2014
87
Index Mundi (1014b), Cocoa beans, available online at:
http://www.indexmundi.com/commodities/?commodity=cocoa-beans&months=60,
referred on 04/06/2014.
Index Mundi (1014c), Sugar, available online at:
http://www.indexmundi.com/commodities/?commodity=sugar&months=60, referred on
04/06/2014.
Index Mundi (1014e), Maize (corn), available online at:
http://www.indexmundi.com/commodities/?commodity=corn&months=60, referred on
04/06/2014.
Index Mundi (1014f), Cotton, available online at:
http://www.indexmundi.com/commodities/?commodity=cotton&months=60, referred
on 04/06/2014.
Index Mundi (1014g), Wool, available online at:
http://www.indexmundi.com/commodities/?commodity=coarse-wool&months=60,
referred on 04/06/2014.
Index Mundi (1014h), Aluminum, available online at:
http://www.indexmundi.com/commodities/?commodity=aluminum&months=60,
referred on 04/06/2014.
Index Mundi (1014i), Copper, available online at:
http://www.indexmundi.com/commodities/?commodity=copper&months=60, referred
on 04/06/2014.
Index Mundi (1014j), Natural Gas, available online at:
http://www.indexmundi.com/commodities/?commodity=natural-gas&months=60,
referred on 04/06/2014.
Index Mundi (1014k), Coal, available online at:
http://www.indexmundi.com/commodities/?commodity=coal-australian&months=60,
referred on 04/06/2014.
Index Mundi (1014l), Crude Oil (petroleum), available online at:
http://www.indexmundi.com/commodities/?commodity=crude-oil&months=60, referred
on 04/06/2014.
Index Mundi (1014m), Lithuania Imports – commodities, available online at:
http://www.indexmundi.com/lithuania/imports_commodities.html, referred on
17/10/2014.
International coffee organization (2014), Historical Data, available online at:
http://www.ico.org/new_historical.asp, referred on 25/05/2014.
Koyfman, A. (2009), Aluminum Price Outlook, available online at:
http://www.wealthdaily.com/articles/aluminum-price-outlook/2111, referred on
29/05/2014.
Kyrtsou, C., Labys, W. C. (2006), Evidence for chaotic dependence between US inflation and
commodity prices, Journal of Macroeconomics, Vol. 28, No. 1, pp. 256-266.
Lithuanian Economic Review 2014 (2014), available online at:
https://www.lb.lt/lithuanian_economic_review_may_2014#page=15, referred on
14/10/2014.
Mahdavi, S., Zhou, S. (1997), Gold and Commodity Prices as Leading Indicators of Inflation:
Tests of Long-Run Relationship and Predictive Performance, Journal of Economics and
Business, Vol. 49, pp. 475-489.
Malliaris, A. G. (2006), US inflation and commodity prices: Analytical and empirical Issues,
Journal of Macroeconomics, Vol. 28, No. 1, pp. 267-271.
Marquis, M. H., Cunningham, S. R. (1990), Is there a role for commodity prices in the design of
monetary policy? Some empirical evidence, Southern Economy, Vol. 57, pp. 169-209.

Algita Miečinskienė, Indrė Lapinskaitė
ISSN 2071-789X
RECENT ISSUES IN ECONOMIC DEVELOPMENT
Economics & Sociology, Vol. 7, No 4, 2014
88
Meat trade news Daily (2014), Vietnam – Farmers chop down coffee plants as coffee prices
drop, available online at:
http://www.meattradenewsdaily.co.uk/news/100310/vietnam___farmers_chop_down_c
offee_plants_as_coffee_prices_drop.aspx, referred on 23/05/2014.
Miečinskienė, A., Ževžikova, O. (2008), Price level changes of the key consumption product
groups, in 5th international scientific conference "Business and management‟ 2008":
selected papers. Vilnius, Lithuania, pp. 199-205.
Nausėda, G. (1994), Pajamų politika ir ekonomikos stabilizavimas. Vilnius: Alma Litera.
Official Statistics Portal (2014), CPI-based consumer price changes, available online at:
http://osp.stat.gov.lt/en/temines-lenteles38, referred on 25/05/2014.
Pindyck, R. S., Rotemberg, J. J. (1990), The Excess Co-Movement of Commodity Prices,
Economic Journal, Vol. 100, pp. 1173-1187.
Pranulis, V. et al. (1999), Marketingas, Vilnius: Eugrimas.
Reuters (2008), Copper price volatility seen high in 2008/09 – CPM, available online at:
http://www.reuters.com/article/2008/05/10/copper-conference-
idUSN1065788520080510, referred on 02/06/2014.
Reuters (2014), Thermal coal prices to drop further on oversupply, weak demand, available
online at: http://in.reuters.com/article/2014/03/20/energy-coal-prices-
idINL6N0MH30Y20140320, referred on 02/06/2014.
Simanavičienė, Ž. (2002), Verslo priežiūros institucijos. Kaunas: Technologija.
Snieška, V. et al. (2006), Makroekonomika: Vadovėlis aukštųjų mokyklų studentams, Kaunas,
Technologija.
Spring Flooding Brings Highest Corn Prices Ever (2008), Chemically Green, available online
at: http://chemicallygreen.com/high-corn-prices.
The Wall Street Journal (2010), Cotton Tale: Apparel Prices Set to Rise, available online at:
http://online.wsj.com/news/articles/SB100014240527487049120045752525000190323
46, referred on 05/05/2014.
The Wall Street Journal (2013), Cotton Price Rises on Crop Size, Quality Concerns, available
online at:
http://online.wsj.com/news/articles/SB100014240527023047958045791015412797315
08, referred on 05/05/2014.
Verheyen, F. (2010), Monetary policy, commodity prices and inflation: Empirical evidence
from the US, Ruhr Economic Papers #216, available online at:
https://www.econstor.eu/dspace/bitstream/10419/45303/1/655732020.pdf.
Why Do Natural Gas Rates Change? (2010), Public Service Commission of Wisconsin,
available online at: http://psc.wi.gov/consumerinfo/faq%27s/gas/gasPriceChanges.htm,
referred on 28/05/2014.
Wool prices continue to rise (2010), The National Business, available online at:
http://www.nbr.co.nz/article/wool-prices-continue-rise-118028, referred on 28/05/2014.
Wool prices drop sharply at opening sale (2008), Fibre2fashion, available online at:
http://www.fibre2fashion.com/news/fashion-
news/newsdetails.aspx?news_id=61885&page=1.
Yahoo finance (2014a), Coffee Prices Continue to Fall as a Result of Increased Supply – ICO
Raises 2011/2012 Production Estimate, available online at:
http://finance.yahoo.com/news/coffee-prices-continue-fall-result-012529258.html,
referred on 25/05/2014.
Yahoo finance (2014b), Cotton prices drop on tepid demand, supply glut, available online at:
http://finance.yahoo.com/news/cotton-prices-drop-tepid-demand-194412500.html,
referred on 25/05/2014.