Evaluating the Relative Importance of Influencing Factors ...

The relative importance ofimprovement routines for
implementing lean practicesWilfred H. Knol
Institute for Management Research, Radboud University,Nijmegen, The Netherlands and
Faculty of Technology, HAN University of Applied Sciences,Arnhem, The Netherlands
Jannes SlompFaculty of Technology, Hogeschool van Arnhem en Nijmegen,
Arnhem, The Netherlands, andRoel L.J. Schouteten and Kristina Lauche
Institute for Management Research, Radboud University,Nijmegen, The Netherlands
AbstractPurpose – This paper examines whether and when improvement routines are critical for implementing leanpractices in small- and medium-sized manufacturing enterprises (SMEs). Improvement routines such as“employees initiate and carry through improvement activities” are generally seen as an important means toachieve the full benefit of structural lean interventions. Womack and Jones (2003) suggest that theseimprovement routines should be developed as the company becomes more experienced in lean. The purposeof this paper is to explore the relative importance of individual improvement routines at various degrees oflean practice implementation.Design/methodology/approach – A Between-Case Comparison Analysis (Dul and Hak, 2012) and aNecessary Condition Analysis (Dul, 2016) were performed on self-assessment data from 241 respondents at38 Dutch manufacturing SMEs.Findings – The importance of improvement routines depended on the degree of lean practice implementation.Lean practices could be implemented to some extend without developing specific improvement routines, yet certainroutines were necessary for more advanced implementations of lean. These routines relate to employees conductingshared improvement activities and in the most advanced cases to aligning different improvement activities.Originality/value –These findings question existing lean implementation models that neglect improvementroutines and indicate the need to integrate improvement routines into every lean transformation for itto be sustainable.Keywords Operational performance, Organizational learning, Necessary Condition Analysis,SMEs manufacturingPaper type Research paper
1. IntroductionAs small- and medium-sized manufacturing enterprises (manufacturing SMEs) seek toincrease their operational performance in terms of quality, delivery and costs (Slack et al.,2010), they can turn to lean management, which is known to increase operationalperformance (Womack and Jones, 2003). Lean practices are a set of methods, procedures,
International Journal of Operations& Production ManagementVol. 39 No. 2, 2019pp. 214-237Emerald Publishing Limited0144-3577DOI 10.1108/IJOPM-01-2018-0010
Received 11 January 2018Revised 24 July 2018Accepted 16 August 2018
The current issue and full text archive of this journal is available on Emerald Insight at:www.emeraldinsight.com/0144-3577.htm
© Wilfred H. Knol, Jannes Slomp, Roel L.J. Schouteten and Kristina Lauche. Published by EmeraldPublishing Limited. This article is published under the Creative Commons Attribution (CC BY 4.0) licence.Anyone may reproduce, distribute, translate and create derivative works of this article (for both commercialand non-commercial purposes), subject to full attribution to the original publication and authors. The fullterms of this licence may be seen at http://creativecommons.org/licences/by/4.0/legalcode
214
IJOPM39,2

techniques and tools aimed at continuously creating customer value and reducing productlead time (Shah and Ward, 2007). To implement lean practices, certain improvementroutines have been found necessary. Improvement routines are referred to as learnedpatterns of behaviour that enable high levels of sustained involvement (Bessant and Caffyn,1997). However, manufacturing SMEs find it difficult to develop these improvement routines(McGovern et al., 2017; Shah and Ward, 2003; White et al., 1999). To provide guidance forSMEs in this development, this study explores the relative importance of individualimprovement routines at various degrees of lean practice implementation for increasingoperational performance in manufacturing SMEs.
Lean management consists of a variety of aspects, covering shop floor tools, leanpractices, improvement cycles, problem-solving routines, improvement Kata and coachingKata, leader standard work, generic principles and strategic lean thinking (Bicheno andHolweg, 2016; Deming, 1993; Hines et al., 2004; Liker, 2004; Rother, 2010; Shah and Ward,2003; Womack, 2013). This study focusses on lean practices that are directly linked tooperational performance. Examples of lean practices are “addressing equipment downtimethrough total productive maintenance”, “facilitating pull production through a limit onwork-in-progress” and “creating continuous flow of value-added activities” (Shah andWard,2007). Based on survey data from 1,757 large, medium and small US manufacturing firms,Shah and Ward (2003) found that the synergistic effect of all lean practices were associatedwith better operational performance. When products are produced in a single-piece flow andvalue-added activities follow each other continuously, operational performance increases(Shah and Ward, 2003; Womack and Jones, 2003).
To successfully implement lean practices, organisations need to continuously improvetheir processes (Bessant et al., 2001; Spear and Bowen, 1999; Womack and Jones, 2003).Continuous improvement is a dynamic organisational capability that involves specificemployees conducting improvement activities (Anand et al., 2009; Boer et al., 2000; Rother,2010; Zollo and Winter, 2002). This dynamic capability consists of “a particular bundle ofroutines which can help an organisation improve what it currently does” (Bessant et al., 2001,p. 68). Improvement routines, therefore, form the backbone of continuous improvement.Examples of improvement routines are “employees initiate and carry through improvements”and “employees use appropriate techniques to improve” (Bessant et al., 2001).
The order of Womack and Jones’ (2003) five widely acknowledged principles of leanmanagement: identifying value, streamlining the value stream, establishing flow, pull andaiming for perfection suggests that in order to create a lean organisation, it is essential toimplement lean practices to some extent (establishing flow and pull) before developingroutines to improve them (aiming for perfection). According to Womack and Jones (2003,p. 269), “[…] there is a critical transition as you move your organisation through the leantransformation, a point when managers must become coaches rather than tyrants andemployees become proactive. This transition is the key to a self-sustaining organisation”.This transition suggests that improvement routines should be developed as a companybecomes a more experienced lean practitioner.
Yet manufacturing SMEs struggle to develop improvement routines and implement leanpractices (McGovern et al., 2017; Shah and Ward, 2003; White et al., 1999). SMEs areimportant as, on a worldwide average, they contribute 42 per cent to a country’s grossdomestic product and provide work for 54 per cent of a country’s labour force. Largeenterprises also depend on entire networks of suppliers, most of which are SMEs (Ayyagariet al., 2007). Part of the difficulty SMEs have with improvement routines lies in their intrinsiccharacteristics and features. According to Gelinas and Bigras (2004), SME managers have alow propensity to delegate and consult, preventing employees from developingimprovement routines. Furthermore, SMEs often only plan in the short term, resulting ina mismatch between daily operating routines and long-term improvement routines.
215
Implementinglean practices
An inherent lack of resources like time, money and expertise makes it even more difficult forSMEs to hire consultants, take training courses and perform activities to developimprovement routines (Middel et al., 2007; Welsh and White, 1981). These SME-specificcharacteristics often hinder the development of improvement routines, resulting in anunsustainable and, hence, unsuccessful lean practice implementation approach.
Previous research suggests that the importance of improvement routines differs atvarious degrees of lean practice implementation (Bessant et al., 2001; Womack and Jones,2003). Importance means that improvement routines become necessary to activate furtherimprovements. The increasing importance of improvement routines during a lean journeyimplies that the importance of each particular improvement routine also evolves. Therefore,the aim of this study is to explore the relative importance of individual improvementroutines at various degrees of lean practice implementation for increasing operationalperformance in manufacturing SMEs. The paper concludes with propositions aboutindividual improvement routines in relation to lean practices and operational performance.
This knowledge will help manufacturing SME managers who are trying to create leanorganisations to identify the most relevant improvement routines for their degree of leanpractice implementation. This study questions lean implementation models that ignoreimprovement routines and strongly supports the notion that improvement routines arerelevant for every lean transformation, yet different routines are crucial for different levelsof maturity.
2. Improvement routines for implementing lean practices and increasingoperational performance in manufacturing SMEsThis section explains the link between organisational learning and continuous improvementand summarises the literature on the relationships between aggregate improvementroutines with lean practices and operational performance, before delving deeper into theimportance of individual improvement routines. Given the scarcity of literature on thissubject, research in large enterprises is described before elaborating on their specific role inSMEs. As previous research has shown a link between lean practices and operationalperformance (Shah and Ward, 2003; Womack and Jones, 2003), research on the link betweenroutines and lean practices as well as operational performance is described. As the aim is toexplore the relative importance of individual improvement routines, consistency wasimportant and, therefore, only papers that studied improvement routines as identified byBessant and Caffyn (1997) or Bessant et al. (2001) were considered.
2.1 Organisational learning as a core of continuous improvementOrganisations strive to increase their operational performance by establishing suitableoperating practices and by continuously learning how these practices can be improved.Of interest to this study are the lean practices developed by Shah and Ward (2007).To improve these lean practices, organisations must develop their dynamic capabilities(Zollo and Winter, 2002). Dynamic capability is defined as “a learned and stable pattern ofcollective activity through which the organisation systematically generates and modifies itsoperating routines in pursuit of improved effectiveness” (Zollo and Winter, 2002, p. 340).According to Fiol and Lyles (1985), dynamic capabilities are developed throughorganisational learning, which means “improving actions through better knowledge andunderstanding” (p. 803). In the context of this study, organisational learning occurs inlearning cycles or improvement cycles, like “plan-do-study-act” or “define-measure-analyse-improve-control” (Bessant et al., 1996; Deming, 1993). So, to improve lean practices andincrease operational performance, organisations need to understand their operating routinesand articulate the need to improve them.
216
IJOPM39,2
2.2 Aggregate improvement routines for lean practices and operational performanceAccording to Womack and Jones (2003), improvement routines grow in importance duringthe implementation of lean practices. This transition has been substantiated by many otherstudies. Savolainen (1999) studied three Finnish manufacturers that started to implementlean, which in turn led to the development of continuous improvement routines. The fourways of improvement described by Berger (1997) (individual, expert task-force, organic andwide-focus improvement) indicate that as groups of people are involved and improvement isintegrated with ordinary tasks, implementing lean practices mutually reinforces thedevelopment of sustained improvement routines. Similarly, the four typologies reported byRijnders and Boer (2004) (novices, sprinters, exercisers and stayers) indicate that a clearfocus on practical concepts as well as presence of an improvement structure mutuallyenacted wider comprehension of improvement as well as learning. De Jager et al. (2004)found that developing continuous improvement routines led to the implementation of leanpractices which, in turn, reinforced the improvement routines and led to improvedoperational performance. These findings indicate that there is a strong interaction betweenimprovement routines and lean practices.
In a decade-long research programme on continuous improvement in over 70 companies,Bessant et al. (2001) developed the notion of improvement routines further and suggestedthat different routines might be important at various levels of improvement. Kaltoft et al.(2004) suggest that next to management initiatives, developing improvement routines earlyin the improvement process may be the best way to implement lean practices. Kim et al.(2014) found that enterprises with mature improvement programmes equally combinemanagement-initiated and employee-initiated improvement activities. Thus, organisationscould start implementing lean practices without the presence of improvement routines,while different routines may be of varying importance as they continue to implement lean.This research will explore the relative importance of individual improvement routines givenvarious degrees of lean practice implementation for increasing operational performance.
2.3 Importance of individual improvement routinesThere are several different improvement routines ( for an overview see Appendix 1 –improvement routines) yet the findings on which of these are most important for implementinglean practices are mixed. One case study and three survey studies were reviewed.
Based on interviews conducted at three large South African mines, de Jager et al. (2004)found that “strategy deployment behaviour” was considered the most important routine forbeginning to improve operational performance; managers said that creating a common goalwas the first necessity to show the urgency for the proposed change. Two other importantroutines were mentioned: “understanding improvement behaviour” (behaviour changes whenpeople understand and believe in the reason for change) and “improvement leadership”(managers trust their employees and recognise their contribution to improvement).
Dabhilkar and Bengtsson (2004) conducted a survey on improvement routines in 127Swedish manufacturing firms. Their regression analysis showed that “systematic andstrategic improvement” had the strongest link with operational performance. This was acluster of several routines: “employees understand and share the idea of improvement”,“employees proactively participate in improvement” and “improvement activities are linkedto the strategy”. Three other important routines were: “customer and supplier involvement”(the organisation can extend their improvement activity across organisational borders),“idea management and reward systems” (idea management systems are used and employeecontributions are rewarded) and “strategic knowledge deployment” (employees learn andthen develop, capture and share that knowledge).
In a later study using survey data from 452 European and Australian manufacturingcompanies, Dabhilkar et al. (2007) remarkably found no significant differences in the relative
217
Implementinglean practices
importance of improvement routines for operational performance, neither within nor acrosscountries. A possible explanation is that they analysed this relationship using a regularregression. This supposes that the increased presence of improvement routines is directly linkedto higher operational performance. However, the general assumption is that improvementroutines are a necessary condition but no guarantee for implementing lean practices.
Finally, using survey data from 543 manufacturers in ten countries in Asia, Australia andEurope, Jørgensen et al. (2006) found that the ability to “strategically manage the developmentof improvement” had the strongest correlation with operational performance. This means thatemployees assess and prioritise improvements against the organisational strategy andmonitor whether improvements affect this strategy. Two other important routines were “theability to learn” and “the ability to improve across organisational boundaries”.
So far these findings are inconclusive. The fact that systematic strategy deployment wasfound repeatedly might be due to size: larger organisations generally require morealignment. The question remains which order of routines is critical for the context of SMEs.
2.4 Individual improvement routines in manufacturing SMEsOnly a few studies were found that specifically describe improvement routines and leanpractices in manufacturing SMEs. For instance, in an extensive literature review of 209research papers on lean manufacturing, Bhamu and Singh Sangwan (2014) found that thesuccess of lean in manufacturing SMEs largely depends on cultural practices. They onlyidentified one study (Meiling et al., 2012) that investigated the relationship betweenimprovement routines and lean practices in SMEs. That study looked at two Swedish casestudies and found that the SME-specific characteristics “leading the way” and “getting theimprovement habit” were extremely important to creating organisational change in thoseSMEs and that an SME-specific challenge – “lack of focus” – prevented one company fromobtaining sustainable improvements. Singh and Singh (2015) conducted an extensiveliterature review on continuous improvement but found no other papers on improvementroutines and lean practices specifically targeting SMEs.
More recently, Matthews et al. (2017) found that the more effective employees at six UKmanufacturing SMEs were “willing and able” to perceive new ways of working andparticipated in a “shared problem-solving” approach, helping them align with and build onthe work of peers. This seems to be in line with SMEs specifically, as they transferinformation informally and responsibility is less precisely divided (Gelinas and Bigras,2004). Furthermore, they found that in these more effective cases “managers supported andled improvement activities” and that “organisational learning” was achieved by sharingpersonal knowledge using formal procedures. The former is specific to SMEs but the lattercounters our understanding, as SMEs tend to be informal and unstructured (Gelinas andBigras, 2004). These formal procedures might be a key to sustaining improvement efforts inmanufacturing SMEs. However, these cases were “mature improvers”, as they already hadan accredited ISO 9000 quality management system and other formal and external auditprocedures. The authors concluded that improvement activities can result in organisationallearning, which eventually leads to increased operational performance.
To summarise, the research so far has shown that the importance of improvementroutines changes depending on the degree of lean practice implementation, yet it does notidentify which routines are important in which situation. Papers that do focus on individualimportance show that in large enterprises and SMEs combined, systematic strategydeployment is the most important routine for increasing performance. In SMEs specifically,management support and leadership, as well as shared problem-solving, are the mostimportant improvement routines for implementing lean practices and increasing operationalperformance. Furthermore, embedding improvements into formal procedures might sustainresults in generally informal manufacturing SMEs.
218
IJOPM39,2
Though the studies described above (Dabhilkar et al., 2007; Dabhilkar and Bengtsson,2004; de Jager et al., 2004; Jørgensen et al., 2006) note the importance of using differentimprovement routines, only a few focus on SMEs (Matthews et al., 2017; Meiling et al., 2012).None of them relate this importance to the degree of lean practice implementation oroperational performance, or analyse their data using the assumed necessary perspective.This paper, therefore, explores the relative importance in which individual improvementroutines are necessary to implement various degrees of lean practices in SMEs.
3. MethodsThis section describes the sample and measures and how a Between-Case ComparisonAnalysis (BCCA) (Dul and Hak, 2012) and a Necessary Condition Analysis (Dul, 2016)were conducted.
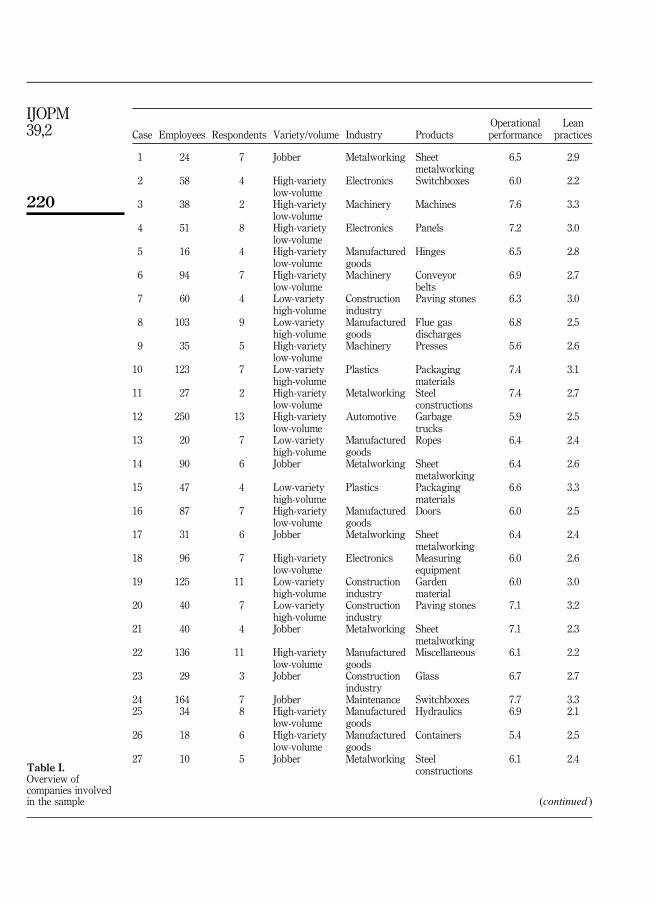
3.1 Sample and data collectionA total of 38 manufacturing SMEs were recruited through the network of (the HAN Lean-QRMCenter) in the Netherlands (see Table I for details). Manufacturing was defined using theclassification of economic activities in the European Community (commonly referred to asNACE) as “Level 1, Group C: Manufacturers” (European Commission, 2010). SMEs were definedas companies that employ 10–250 employees (European Commission, 2005).
To overcome single respondent bias (Bowman and Ambrosini, 1997), multiple respondentswith relevant knowledge were asked to participate in each case. The production manager wasalways involved, complemented by the owner/director, general manager, managers of differentcells, or managers from different departments like marketing, sales, R&D, engineering and/orlogistics and/or team leaders.
Respondents filled in the questionnaires individually during a joint session with all therespondents. To ensure that they all had the same understanding of the concepts surveyed,the concepts were explained – both orally and in writing – before they filled in thequestionnaires. This helped to overcome idiosyncratic variation and increased constructvalidity for multiple respondents. Respondents for each case varied from two to thirteen,depending on the number of employees (over 6 on average, 241 in total).
3.2 MeasuresImprovement routines were measured using Bessant et al.’s (2001) 35-item questionnaire, afurther development of the earlier version (Bessant and Caffyn, 1997), that is commonlyused in other studies (like de Jager et al., 2004; Jørgensen et al., 2006; Singh and Singh, 2015).It measures eight improvement routines: (i) understanding improvement, (ii) getting theimprovement habit, (iii) focussing improvement, (iv) leading the way, (v) aligningimprovement, (vi) shared problem-solving, (vii) improvement of improvement and (viii) thelearning organisation. Since Bessant et al. (2001) do not propose a scale, a five-point Likertscale was used. With multiple questions per item, five points are sufficient to overcomemeasurement error (Finstad, 2010). The scale ranged from (1) “no presence” to (2) “somepresence”, (3) “moderate presence”, (4) “extensive presence” and (5) “full presence”.
Lean practice implementation was measured using a questionnaire developed byShah and Ward (2007), which has become a standard for measuring this construct(like Hofer et al., 2012; Marodin and Saurin, 2013; Vinodh and Balaji, 2011).The questionnaire consists of 41 questions, covering ten lean practices: (i) productivemaintenance, (ii) controlled processes, (iii) pull, (iv) flow, (v) low setup, (vi) supplier feedback,(vii) JIT delivery, (viii) developing suppliers, (ix) involved customers and (x) involvedemployees. Since practice (x), involved employees, significantly overlaps with improvementroutines, it was left out of the construct. As for Shah and Ward (2007), a five-point Likert
219
Implementinglean practices
Case Employees Respondents Variety/volume Industry ProductsOperationalperformance
Leanpractices
1 24 7 Jobber Metalworking Sheetmetalworking
6.5 2.9
2 58 4 High-varietylow-volume
Electronics Switchboxes 6.0 2.2
3 38 2 High-varietylow-volume
Machinery Machines 7.6 3.3
4 51 8 High-varietylow-volume
Electronics Panels 7.2 3.0
5 16 4 High-varietylow-volume
Manufacturedgoods
Hinges 6.5 2.8
6 94 7 High-varietylow-volume
Machinery Conveyorbelts
6.9 2.7
7 60 4 Low-varietyhigh-volume
Constructionindustry
Paving stones 6.3 3.0
8 103 9 Low-varietyhigh-volume
Manufacturedgoods
Flue gasdischarges
6.8 2.5
9 35 5 High-varietylow-volume
Machinery Presses 5.6 2.6
10 123 7 Low-varietyhigh-volume
Plastics Packagingmaterials
7.4 3.1
11 27 2 High-varietylow-volume
Metalworking Steelconstructions
7.4 2.7
12 250 13 High-varietylow-volume
Automotive Garbagetrucks
5.9 2.5
13 20 7 Low-varietyhigh-volume
Manufacturedgoods
Ropes 6.4 2.4
14 90 6 Jobber Metalworking Sheetmetalworking
6.4 2.6
15 47 4 Low-varietyhigh-volume
Plastics Packagingmaterials
6.6 3.3
16 87 7 High-varietylow-volume
Manufacturedgoods
Doors 6.0 2.5
17 31 6 Jobber Metalworking Sheetmetalworking
6.4 2.4
18 96 7 High-varietylow-volume
Electronics Measuringequipment
6.0 2.6
19 125 11 Low-varietyhigh-volume
Constructionindustry
Gardenmaterial
6.0 3.0
20 40 7 Low-varietyhigh-volume
Constructionindustry
Paving stones 7.1 3.2
21 40 4 Jobber Metalworking Sheetmetalworking
7.1 2.3
22 136 11 High-varietylow-volume
Manufacturedgoods
Miscellaneous 6.1 2.2
23 29 3 Jobber Constructionindustry
Glass 6.7 2.7
24 164 7 Jobber Maintenance Switchboxes 7.7 3.325 34 8 High-variety
low-volumeManufacturedgoods
Hydraulics 6.9 2.1
26 18 6 High-varietylow-volume
Manufacturedgoods
Containers 5.4 2.5
27 10 5 Jobber Metalworking Steelconstructions
6.1 2.4
(continued )
Table I.Overview ofcompanies involvedin the sample
220
IJOPM39,2
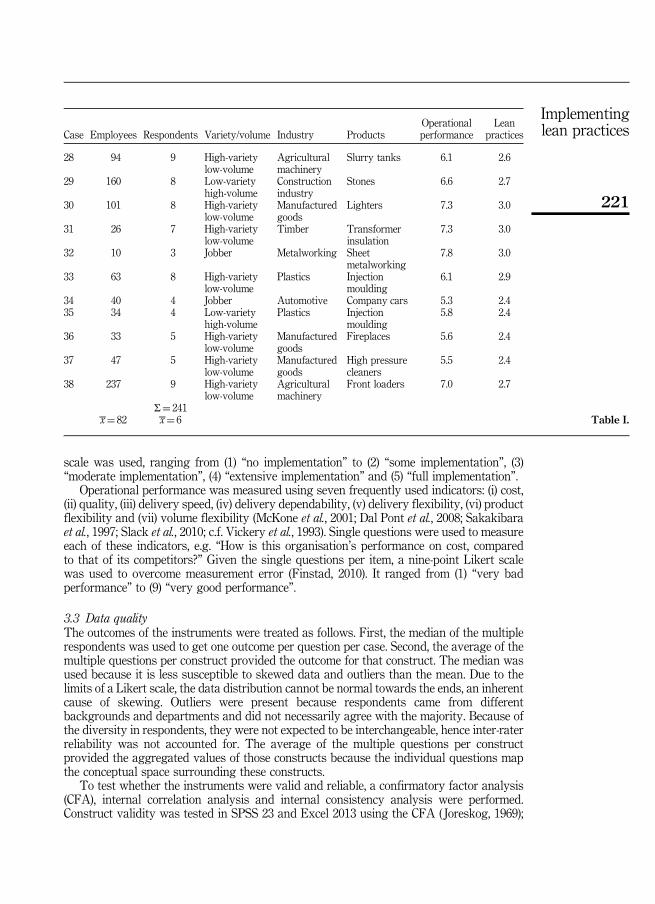
scale was used, ranging from (1) “no implementation” to (2) “some implementation”, (3)“moderate implementation”, (4) “extensive implementation” and (5) “full implementation”.
Operational performance was measured using seven frequently used indicators: (i) cost,(ii) quality, (iii) delivery speed, (iv) delivery dependability, (v) delivery flexibility, (vi) productflexibility and (vii) volume flexibility (McKone et al., 2001; Dal Pont et al., 2008; Sakakibaraet al., 1997; Slack et al., 2010; c.f. Vickery et al., 1993). Single questions were used to measureeach of these indicators, e.g. “How is this organisation’s performance on cost, comparedto that of its competitors?” Given the single questions per item, a nine-point Likert scalewas used to overcome measurement error (Finstad, 2010). It ranged from (1) “very badperformance” to (9) “very good performance”.
3.3 Data qualityThe outcomes of the instruments were treated as follows. First, the median of the multiplerespondents was used to get one outcome per question per case. Second, the average of themultiple questions per construct provided the outcome for that construct. The median wasused because it is less susceptible to skewed data and outliers than the mean. Due to thelimits of a Likert scale, the data distribution cannot be normal towards the ends, an inherentcause of skewing. Outliers were present because respondents came from differentbackgrounds and departments and did not necessarily agree with the majority. Because ofthe diversity in respondents, they were not expected to be interchangeable, hence inter-raterreliability was not accounted for. The average of the multiple questions per constructprovided the aggregated values of those constructs because the individual questions mapthe conceptual space surrounding these constructs.
To test whether the instruments were valid and reliable, a confirmatory factor analysis(CFA), internal correlation analysis and internal consistency analysis were performed.Construct validity was tested in SPSS 23 and Excel 2013 using the CFA ( Joreskog, 1969);
Case Employees Respondents Variety/volume Industry ProductsOperationalperformance
Leanpractices
28 94 9 High-varietylow-volume
Agriculturalmachinery
Slurry tanks 6.1 2.6
29 160 8 Low-varietyhigh-volume
Constructionindustry
Stones 6.6 2.7
30 101 8 High-varietylow-volume
Manufacturedgoods
Lighters 7.3 3.0
31 26 7 High-varietylow-volume
Timber Transformerinsulation
7.3 3.0
32 10 3 Jobber Metalworking Sheetmetalworking
7.8 3.0
33 63 8 High-varietylow-volume
Plastics Injectionmoulding
6.1 2.9
34 40 4 Jobber Automotive Company cars 5.3 2.435 34 4 Low-variety
high-volumePlastics Injection
moulding5.8 2.4
36 33 5 High-varietylow-volume
Manufacturedgoods
Fireplaces 5.6 2.4
37 47 5 High-varietylow-volume
Manufacturedgoods
High pressurecleaners
5.5 2.4
38 237 9 High-varietylow-volume
Agriculturalmachinery
Front loaders 7.0 2.7
Σ¼ 241x̅¼ 82 x̅¼ 6 Table I.
221
Implementinglean practices
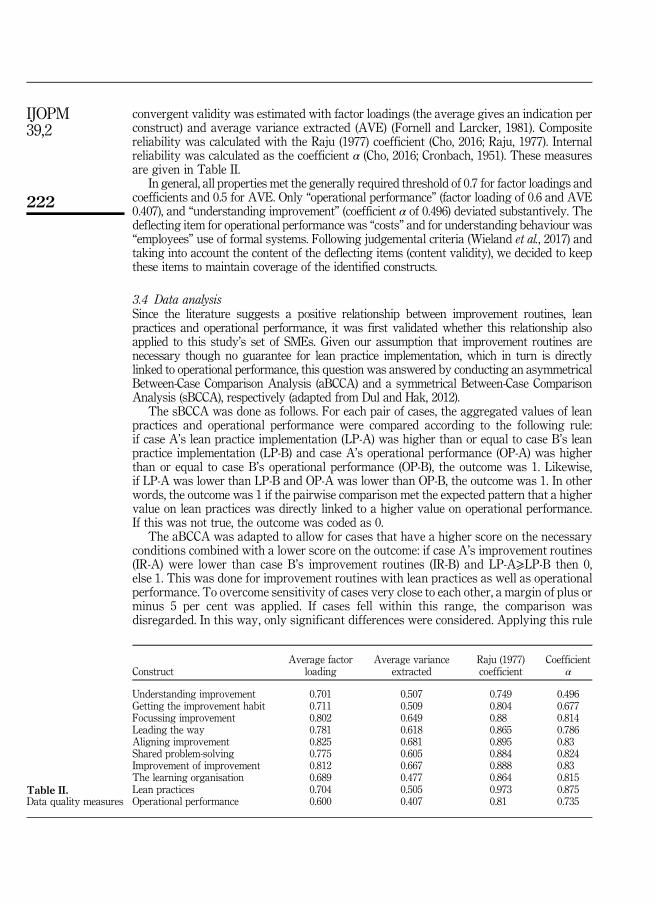
convergent validity was estimated with factor loadings (the average gives an indication perconstruct) and average variance extracted (AVE) (Fornell and Larcker, 1981). Compositereliability was calculated with the Raju (1977) coefficient (Cho, 2016; Raju, 1977). Internalreliability was calculated as the coefficient α (Cho, 2016; Cronbach, 1951). These measuresare given in Table II.
In general, all properties met the generally required threshold of 0.7 for factor loadings andcoefficients and 0.5 for AVE. Only “operational performance” (factor loading of 0.6 and AVE0.407), and “understanding improvement” (coefficient α of 0.496) deviated substantively. Thedeflecting item for operational performance was “costs” and for understanding behaviour was“employees” use of formal systems. Following judgemental criteria (Wieland et al., 2017) andtaking into account the content of the deflecting items (content validity), we decided to keepthese items to maintain coverage of the identified constructs.
3.4 Data analysisSince the literature suggests a positive relationship between improvement routines, leanpractices and operational performance, it was first validated whether this relationship alsoapplied to this study’s set of SMEs. Given our assumption that improvement routines arenecessary though no guarantee for lean practice implementation, which in turn is directlylinked to operational performance, this question was answered by conducting an asymmetricalBetween-Case Comparison Analysis (aBCCA) and a symmetrical Between-Case ComparisonAnalysis (sBCCA), respectively (adapted from Dul and Hak, 2012).
The sBCCA was done as follows. For each pair of cases, the aggregated values of leanpractices and operational performance were compared according to the following rule:if case A’s lean practice implementation (LP-A) was higher than or equal to case B’s leanpractice implementation (LP-B) and case A’s operational performance (OP-A) was higherthan or equal to case B’s operational performance (OP-B), the outcome was 1. Likewise,if LP-A was lower than LP-B and OP-A was lower than OP-B, the outcome was 1. In otherwords, the outcome was 1 if the pairwise comparison met the expected pattern that a highervalue on lean practices was directly linked to a higher value on operational performance.If this was not true, the outcome was coded as 0.
The aBCCA was adapted to allow for cases that have a higher score on the necessaryconditions combined with a lower score on the outcome: if case A’s improvement routines(IR-A) were lower than case B’s improvement routines (IR-B) and LP-A⩾LP-B then 0,else 1. This was done for improvement routines with lean practices as well as operationalperformance. To overcome sensitivity of cases very close to each other, a margin of plus orminus 5 per cent was applied. If cases fell within this range, the comparison wasdisregarded. In this way, only significant differences were considered. Applying this rule
ConstructAverage factor
loadingAverage variance
extractedRaju (1977)coefficient
Coefficientα
Understanding improvement 0.701 0.507 0.749 0.496Getting the improvement habit 0.711 0.509 0.804 0.677Focussing improvement 0.802 0.649 0.88 0.814Leading the way 0.781 0.618 0.865 0.786Aligning improvement 0.825 0.681 0.895 0.83Shared problem-solving 0.775 0.605 0.884 0.824Improvement of improvement 0.812 0.667 0.888 0.83The learning organisation 0.689 0.477 0.864 0.815Lean practices 0.704 0.505 0.973 0.875Operational performance 0.600 0.407 0.81 0.735
Table II.Data quality measures
222
IJOPM39,2

to each pairwise comparison (n2/2−n/2¼ 382/2−38/2¼ 703 pairwise comparisons in total)produces an overall score between 0 per cent (none of the pairwise comparisons meet thiscondition) and 100 per cent (all of the pairwise comparisons meet this condition).This indicates the strength of the relationship between improvement routines and leanpractices in manufacturing SMEs. An outcome of 50 per cent would indicate that therewas no relationship.
To tests for mediation, the traditional approach (Baron and Kenny, 1986; Preacher andHayes, 2008) was followed while again using the BCCAs rather than regular multipleregression analyses. For mediation to show, the relationship between improvement routinesand operational performance should be stronger when lean practices are high than whenlean practices are low.
To identify the order in which improvement routines were important at various degreesof lean practice implementation, a Necessary Condition Analysis (NCA) (Dul, 2016) wasperformed. In contrast to regular regression analyses that study variables in a probabilisticrelationship to each other, an NCA allows the study of variables that are necessary but noguarantee for a certain outcome (e.g. improvement routines are necessary but no guaranteefor lean practice implementation).
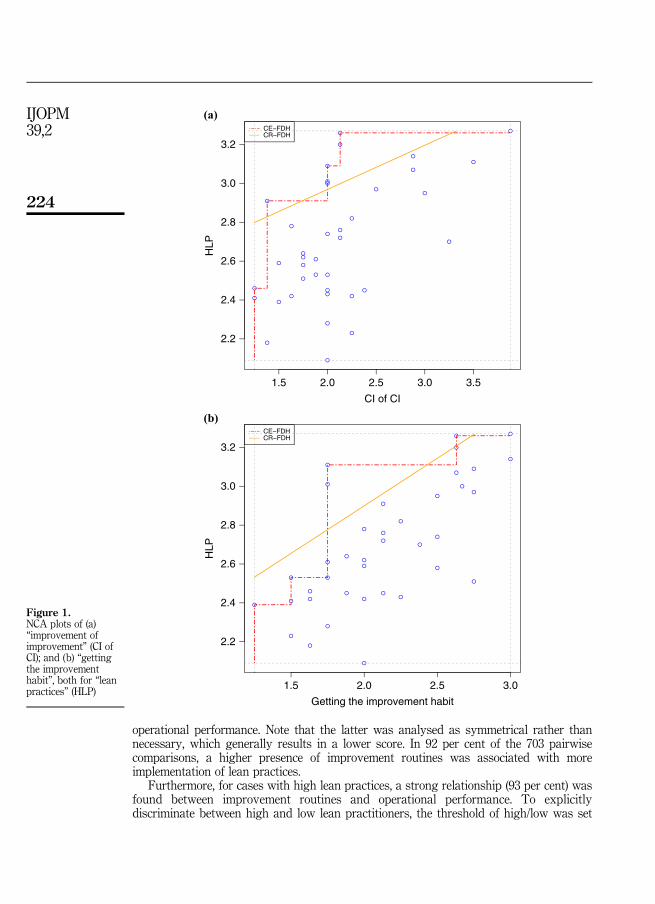
An NCA starts by drawing a ceiling line through the upper-left observations of an x–yplot. This line separates the “empty space” and the “full space” of the data set (Goertz et al.,2012) and indicates the degree to which lean practices ( y-axis) could be implemented withoutthe presence of improvement routines (x-axis). See, for example, Figure 1; the broken line is aceiling envelopment line and the solid line is a ceiling regression line, where the x are two ofeight improvement routines (“improvement of improvement” and “getting the improvementhabit”, respectively) and y is the implementation of lean practices. These ceiling linesindicate the minimum presence of a given improvement routine to be able to implement acertain degree of lean practices. Listing the outcomes of the regression equations of allimprovement routines in a bottleneck table identified a minimum extent of eachimprovement routine’s presence for every degree of lean practice implementation.
This analysis method follows other examples of NCA application, such as Sousa andda Silveira (2017), who found necessary degrees of services in the process of servitisation, andVan Der Valk et al. (2016), who determined the criticality of contracts and trusts for supplierrelations. All findings were discussed in two two-hour sessions with about 50 manufacturingSMEmanagers and about 30 lean consultants, respectively (communicative validation). Thesediscussions helped to refine the interpretation of the findings.
4. FindingsThe findings confirm that lean practices mediated the relationship between improvementroutines and operational performance in this study’s set of manufacturing SMEs, andthat individual improvement routines were not equally required for the implementation oflean practices.
4.1 Lean practices mediated between improvement routines and operational performanceThe literature notes a positive relationship between improvement routines, lean practicesand operational performance. To see if this relationship also applied to this study’s set ofmanufacturing SMEs, BCCAs (adapted from Dul and Hak, 2012) were performed. Theresulting scores are presented in Figure 2 and suggest that lean practices mediated therelationship between improvement routines and operational performance. First, a strongrelationship (92 per cent) was found between (i) improvement routines necessary for leanpractices (50 per cent would indicate no relationship). Second, a moderate relationship(83 per cent) was found between (ii) improvement routines necessary for operationalperformance, as well as a moderate relationship (74 per cent) between (iii) lean practices and
223
Implementinglean practices
operational performance. Note that the latter was analysed as symmetrical rather thannecessary, which generally results in a lower score. In 92 per cent of the 703 pairwisecomparisons, a higher presence of improvement routines was associated with moreimplementation of lean practices.
Furthermore, for cases with high lean practices, a strong relationship (93 per cent) wasfound between improvement routines and operational performance. To explicitlydiscriminate between high and low lean practitioners, the threshold of high/low was set
1.5 2.0 2.5 3.0 3.5
1.5 2.0 2.5 3.0
2.2
2.4
2.6
2.8
3.0
3.2
CI of CI
Getting the improvement habit
HLP
2.2
2.4
2.6
2.8
3.0
3.2
HLP
CE−FDHCR−FDH
CE−FDHCR−FDH
(a)
(b)
Figure 1.NCA plots of (a)“improvement ofimprovement” (CI ofCI); and (b) “gettingthe improvementhabit”, both for “leanpractices” (HLP)
224
IJOPM39,2
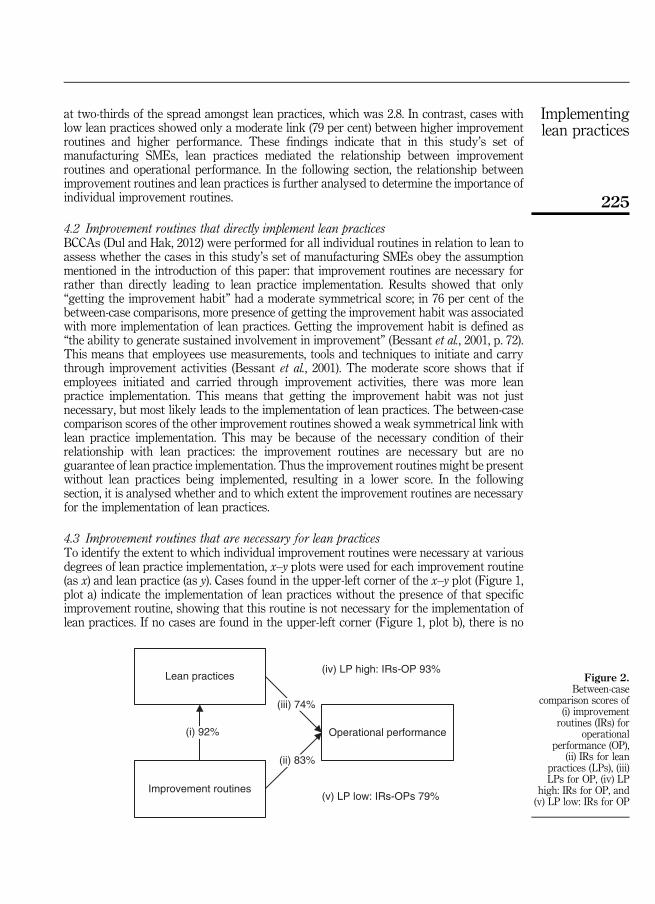
at two-thirds of the spread amongst lean practices, which was 2.8. In contrast, cases withlow lean practices showed only a moderate link (79 per cent) between higher improvementroutines and higher performance. These findings indicate that in this study’s set ofmanufacturing SMEs, lean practices mediated the relationship between improvementroutines and operational performance. In the following section, the relationship betweenimprovement routines and lean practices is further analysed to determine the importance ofindividual improvement routines.
4.2 Improvement routines that directly implement lean practicesBCCAs (Dul and Hak, 2012) were performed for all individual routines in relation to lean toassess whether the cases in this study’s set of manufacturing SMEs obey the assumptionmentioned in the introduction of this paper: that improvement routines are necessary forrather than directly leading to lean practice implementation. Results showed that only“getting the improvement habit” had a moderate symmetrical score; in 76 per cent of thebetween-case comparisons, more presence of getting the improvement habit was associatedwith more implementation of lean practices. Getting the improvement habit is defined as“the ability to generate sustained involvement in improvement” (Bessant et al., 2001, p. 72).This means that employees use measurements, tools and techniques to initiate and carrythrough improvement activities (Bessant et al., 2001). The moderate score shows that ifemployees initiated and carried through improvement activities, there was more leanpractice implementation. This means that getting the improvement habit was not justnecessary, but most likely leads to the implementation of lean practices. The between-casecomparison scores of the other improvement routines showed a weak symmetrical link withlean practice implementation. This may be because of the necessary condition of theirrelationship with lean practices: the improvement routines are necessary but are noguarantee of lean practice implementation. Thus the improvement routines might be presentwithout lean practices being implemented, resulting in a lower score. In the followingsection, it is analysed whether and to which extent the improvement routines are necessaryfor the implementation of lean practices.
4.3 Improvement routines that are necessary for lean practicesTo identify the extent to which individual improvement routines were necessary at variousdegrees of lean practice implementation, x–y plots were used for each improvement routine(as x) and lean practice (as y). Cases found in the upper-left corner of the x–y plot (Figure 1,plot a) indicate the implementation of lean practices without the presence of that specificimprovement routine, showing that this routine is not necessary for the implementation oflean practices. If no cases are found in the upper-left corner (Figure 1, plot b), there is no
(iv) LP high: IRs-OP 93%
(v) LP low: IRs-OPs 79%
Lean practices
(i) 92% Operational performance
(iii) 74%
Improvement routines
(ii) 83%
Figure 2.Between-case
comparison scores of(i) improvementroutines (IRs) for
operationalperformance (OP),
(ii) IRs for leanpractices (LPs), (iii)LPs for OP, (iv) LP
high: IRs for OP, and(v) LP low: IRs for OP
225
Implementinglean practices
implementation of lean practices without the presence of improvement routines, suggestingthat that routine is necessary for lean. Analysis of all the plots shows cases positioned in theupper-left corners for: “the learning organisation”, “leading the way” and “improvement ofimprovement”. This demonstrates that not all of the eight improvement routines arerequired for the degree of lean practices measured.
To determine the order in which individual improvement routines were necessaryfor various extents of lean practices, ceiling lines were drawn to indicate the degree towhich lean practices ( y-axis) were implemented without the presence of improvementroutines (x-axis). The ceiling line could either envelop the upper-left observations with apiecewise-linear convex line (a ceiling envelopment line, CE-FDH hence known as CE line),or it could regress as a trend line through the upper-left observations of the data set (ceilingregression line, CR-FDH hence known as CR line) (Dul, 2016). Dul (2016) recommends usinga CE line for a discrete data set and a CR line for a continuous data set.
The data in this study were gathered using a discrete scale. Then the median was foundfrom multiple respondents and analysed using a continuous scale. Both CE lines and CRlines were drawn automatically using the R 3.3.1 software with the NCA 2.0 package. Bothlines are shown in Figure 1; the CE lines are represented by the broken line; the CR lines arerepresented by the solid line. To determine the validity of the ceiling lines, the accuracy andeffect sizes were calculated (Appendix 2 – Accuracy and effect size); both were foundsufficient to use the CR lines in the NCA.
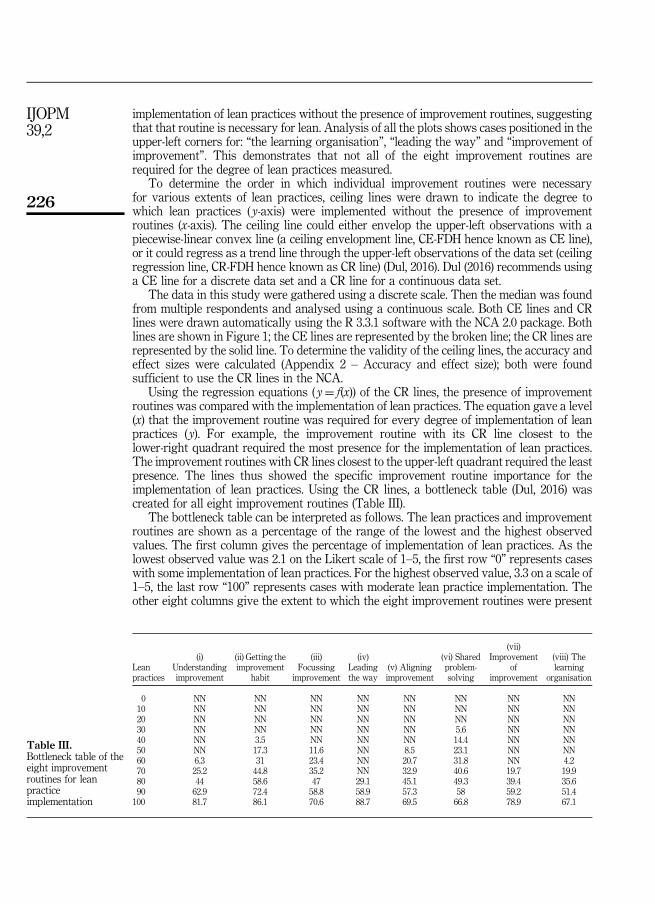
Using the regression equations ( y¼ f(x)) of the CR lines, the presence of improvementroutines was compared with the implementation of lean practices. The equation gave a level(x) that the improvement routine was required for every degree of implementation of leanpractices ( y). For example, the improvement routine with its CR line closest to thelower-right quadrant required the most presence for the implementation of lean practices.The improvement routines with CR lines closest to the upper-left quadrant required the leastpresence. The lines thus showed the specific improvement routine importance for theimplementation of lean practices. Using the CR lines, a bottleneck table (Dul, 2016) wascreated for all eight improvement routines (Table III).
The bottleneck table can be interpreted as follows. The lean practices and improvementroutines are shown as a percentage of the range of the lowest and the highest observedvalues. The first column gives the percentage of implementation of lean practices. As thelowest observed value was 2.1 on the Likert scale of 1–5, the first row “0” represents caseswith some implementation of lean practices. For the highest observed value, 3.3 on a scale of1–5, the last row “100” represents cases with moderate lean practice implementation. Theother eight columns give the extent to which the eight improvement routines were present
Leanpractices
(i)Understandingimprovement
(ii) Getting theimprovement
habit
(iii)Focussing
improvement
(iv)Leadingthe way
(v) Aligningimprovement
(vi) Sharedproblem-solving
(vii)Improvement
ofimprovement
(viii) Thelearning
organisation
0 NN NN NN NN NN NN NN NN10 NN NN NN NN NN NN NN NN20 NN NN NN NN NN NN NN NN30 NN NN NN NN NN 5.6 NN NN40 NN 3.5 NN NN NN 14.4 NN NN50 NN 17.3 11.6 NN 8.5 23.1 NN NN60 6.3 31 23.4 NN 20.7 31.8 NN 4.270 25.2 44.8 35.2 NN 32.9 40.6 19.7 19.980 44 58.6 47 29.1 45.1 49.3 39.4 35.690 62.9 72.4 58.8 58.9 57.3 58 59.2 51.4
100 81.7 86.1 70.6 88.7 69.5 66.8 78.9 67.1
Table III.Bottleneck table of theeight improvementroutines for leanpracticeimplementation
226
IJOPM39,2
(percentage of the range of the values). The lowest observed value was 1.0 on a Likert scaleof 1–5 and the highest observed value was 4.5 on a Likert scale of 1–5, therefore “NN” standsfor not necessary and “100” stands for the full presence of the improvement routine. Sincethe data do not cover the entire Likert scale of lean practices (1–5) or improvement routines(1–5), NN in the very first row means that there are no data to show what percentage isrequired to start with lean. NN and the numbers in the remainder of the table represent no,some, moderate, extensive and full presence of the improvement routines. This bottlenecktable indicates the degree to which individual improvement routines are necessary forvarious degrees of lean practice implementation in this study’s set of manufacturing SMEs.
Using the bottleneck table, the order in which improvement routines were necessary forthe implementation of lean practices was identified. As NN stands for not necessary or0 per cent, the table shows that in this set of manufacturing SMEs, some implementation oflean practices (up to 30 per cent¼Level 2 of the five-point Likert scale) could be realisedwithout developing existing improvement routines. As Figure 1 shows, there are manycases on the left side of both figures, meaning those cases had some degree of lean practiceimplementation without the additional presence of improvement routines. The presence ofimprovement routines only became important from row 30 per cent onwards, meaning thatin this set of manufacturing SMEs, developing certain existing improvement routines onlybecame important when some implementation of lean practices had occurred. The firstgroup of improvement routines that were required for lean practice implementation were (vi)“shared problem-solving” (row 30 per cent) and (ii) “getting the improvement habit” (row40 per cent). As lean implementation increased, (iii) “focussing improvement” and (v)“aligning improvement” (both row 50 per cent) were also required.
At the other end of the spectrum, the last three rows (80–100 per cent) indicate that formore advanced lean practitioners (level 3 of the five-point Likert scale), all improvementroutines were present to some extent (at least 29.1 per cent or level 2 of the five-point Likertscale). The extent per routine is again given by the percentage; the higher the percentage,the more that routine was required for more advanced lean practitioners. The most attentionwas required for (iv) leading the way and (ii) getting the improvement habit, and (i)understanding improvement and (vii) improvement of improvement.
These results indicate that improvement routine criticality differs for various degrees oflean practice implementation. Furthermore, this bottleneck table suggests that in this study’sset of manufacturing SMEs, “getting the improvement habit”was required for some as well asmore advanced implementation of lean practices. It also shows that “leading the way”,“understanding improvement” and “improvement of improvement” were not required forsome implementation of lean practices, while they were most important for more advancedlean practitioners. This bottleneck table thus suggests the order in which improvementroutines are required to implement lean practices and increase operational performance.
5. Propositions on different improvement routines for various degrees oflean practicesThe aim of this study was to explore the relative importance of individual improvementroutines at various degrees of lean practice implementation for increasing operationalperformance in manufacturing SMEs. A data set from manufacturing SMEs was analysedusing BCCA and NCA.
5.1 Improvement routines more important for more advanced lean practiceimplementationThis study confirmed that in this set of manufacturing SMEs, lean practices mediated therelationship between improvement routines and operational performance and found that in
227
Implementinglean practices

cases of more advanced lean implementation more improvement routines were required forhigher operational performance than in cases with only some lean practice implementation.For some lean practice implementation, managers themselves were able to implement abasic structure of lean, without paying any special attention to improvement routines.For more advanced lean organisations, employees participated in improvement activitieswhile managers could continue to create a lean organisation.
These findings confirm Womack and Jones’ (2003) notion about the critical transition whenmanagers should become coaches and employees should become proactive. They replicateRahman and Bullock’s (2005) finding of a mediating effect of lean practices betweenimprovement routines and operational performance. However, in contrast to Rahman andBullock’s findings, the NCA confirms that this is a necessary relationship rather than a linear one.
For SME managers, this means that they can initiate lean practice implementationthemselves, yet to further develop the implementation of lean practices, they must pass onthe baton and enable and support their employees to identify, work on and learn fromimprovements while they themselves continue to work on overarching requirements. Thisstudy, therefore, proposes that in manufacturing SMEs:
P1. Lean practices can be partially implemented without developing improvementroutines, yet more advanced implementation of lean practices requires at least somepresence of improvement routines.
5.2 “Getting the improvement habit” most likely leads to lean practicesRegarding individual improvement routines, the BCCAs suggest that only the “getting theimprovement habit” routine had a linear relationship with and indicated a move towardsthe implementation of lean practices. Getting the improvement habit means thatemployees initiate and carry through improvement activities using measurement, toolsand techniques. If employees made improvements in this way, lean practices were mostlikely to be implemented.
This contrasts with de Jager et al. (2004), who found that managers saw “focussingimprovement” as most important. We believe that this difference is mainly related to thesample, since SMEs usually have no specialised department dedicated to neither leanimplementation nor funds to hire consultants and it is, therefore, more important in SMEsthat employees carry out and learn from improvements than in larger enterprises. Thisfinding is in line with those of Dabhilkar and Bengtsson (2004), who showed that itemscorresponding to the improvement habit had the strongest link with actual improvements.This finding is also in line with those of Knol et al. (2018), who showed that facilitatingactual shop floor improvement activities was most critical to implementing lean practices.
For SME managers, this means that their scarce resources are best spent on helpingemployees conduct improvement activities, especially if they aim to further develop theirlean practice implementation, rather than on things like developing a shared improvementstrategy. This study proposes that in manufacturing SMEs:
P2. If employees initiate and carry through improvement activities based onmeasurements,tools and techniques, it is more likely that lean practices will be implemented.
5.3 Improvement routines for further implementation of lean practicesTo start implementing lean practices, in this study’s set of manufacturing SMEs no specialattention for improvement routines appeared necessary. However, a number ofimprovement routines were required to move beyond some initial lean practiceimplementation. The first two were “getting the improvement habit” and “sharedproblem-solving”. Getting the improvement habit was already discussed, there is a linear
228
IJOPM39,2
relationship between this routine and the implementation of lean, making it important forboth some and more advanced lean practice implementation.
But moving beyond initial implementation of lean practices also requires sharedproblem-solving. This means that employees demonstrate a holistic and customer-centricview of improvement by cooperating with various hierarchical levels and across internaldepartments as well as with outside agencies (e.g. customers, suppliers). This finding is inline with Knol et al. (2018), who argue that manufacturing SMEs need first to facilitateinternal integration. Only when progressing should they integrate suppliers and customers.This is also in line with de Jager et al. (2004), Dabhilkar and Bengtsson (2004) and Jørgensenet al. (2006), who found that cross-functional improvements were among the most importantroutines. SME managers that want to go beyond some implementation of lean practices firsthave to involve their own employees. Only then do they need to involve their suppliers andcustomers in improvement projects. This is because, in the long run, it is the employees thatlearn from each other to initiate and carry through improvements. If employees do notinitiate measurement-based improvements and do not have a holistic customer-centric viewto improve, it is difficult to develop a lean organisation.
The next set of improvement routines is required for further implementation of leanpractices were “aligning improvement” and “focussing improvement”. Aligning improvementrefers to the improvement system being designed and continuously amended to fit within thecurrent organisational structure and infrastructure. It seems to be difficult to continuouslyimprove without the presence of a compatible improvement system. If the improvement systemis not aligned with the organisational context, improvements will be frustrated and theireffects, if any, will quickly fade. However, this improvement system is no guarantee for theimplementation of lean practices, as some cases reported the presence of alignment, but werenot lean. Alignment itself does not improve anything; improvement activities are still needed.
Dabhilkar and Bengtsson (2004) found no direct link between alignment andperformance. Rather than increasing operational performance directly, alignment is anenabler to continuously improve towards a lean organisation. This finding is in line with deJager et al. (2004), who noted that manufacturing managers considered alignment to be animportant improvement routine. SME managers have to ensure that employees work with asuitable improvement system so that they are facilitated when conducting improvementprojects to create a lean organisation.
The results also suggest that “focussing improvement” was required to move beyondsome implementation of lean practices. This refers to employees’ ability to use theorganisation’s strategic goals and objectives to assess and prioritise improvements, andtheir ability to monitor the impact of improvements on these goals and objectives. This is inline with findings by de Jager et al. (2004), Dabhilkar and Bengtsson (2004) and Jørgensenet al. (2006), who all deemed focussing improvement to be (among) the most important of theeight improvement routines. Though it might be difficult for SME managers who are oftencaught up in daily firefighting, aligning improvements with each other and with theoverarching business strategy is needed when managing something as challenging as atransition towards lean. In summary, this study proposes that in manufacturing SMEs:
P3. Some initial implementation of lean practices can only exist if: (a) there areemployee-initiated improvements, (b) the implementation is conducted across levelsand across departments, (c) it uses a proper improvement system and (d) it is in linewith the organisational strategy. The presence of the other routines is not yet required.
5.4 Improvement routines for more advanced lean practitionersSubstantial development of four improvement routines was important for the mostadvanced lean cases in this set of manufacturing SMEs: “getting the improvement habit”,
229
Implementinglean practices
“leading the way”, “understanding improvement” and “improvement of improvement”.“Getting the improvement habit” was already discussed.
“Leading the way” only seems important for more advanced lean practitioners. It refersto managers recognising employees’ contributions to improvement and supportingemployee experiments. This is in line with de Jager et al. (2004) and Dabhilkar andBengtsson (2004), who found that “leading the way” was important to increasingperformance. It is also in line with Knol et al. (2018), who note that the need for leadershipincreases as the number of improvement projects grows. When organisations are moreadvanced in their lean journey, they are often already running different improvementactivities, probably continuously. If so, SME managers have to overcome their intrinsicneed to stay in control. Instead, they need to empower more employees to create acompany-wide structure of experimentation and learning, while they focus on the overallcreation of a lean organisation.
“Understanding improvement” is one of the least important routines for someimplementation of lean practices, but it becomes more important when employees initiateimprovement activities. This means that employees from all levels demonstrate a sharedbelief in the value of incremental employee contribution and demonstrate that whensomething goes wrong, their natural reaction is to look for reasons why rather than toblame individuals. Understanding improvement enabled employees to initiate andcontinue their own improvement activities. This is in line with de Jager et al. (2004) andJørgensen et al. (2006) who found that manufacturing managers believe understanding,articulating and demonstrating improvement are important. SME managers need to knowthat a lean organisation cannot be fully developed by only a few key actors in top andmiddle management, nor by lower-level employees who are not ingrained in theimprovement philosophy.
The final routine necessary for more advanced lean cases is “improvement ofimprovement”. This refers to the continuous monitoring and review of the improvementsystem in relation to the organisation as a whole, leading to its amendment or regeneration.Strategic development of the improvement system does not directly improve products orprocesses, especially in cases with limited lean practice implementation. However, in moreadvanced cases it seems important to facilitate the improvement culture.
This contrasts with Dabhilkar and Bengtsson (2004), who found no link betweenimprovement of improvement and operational performance. Their findings were based onnovel improvement practitioners; this study also reports that improvement of improvementis not yet necessary in these cases.
Our finding supports those of Jørgensen et al. (2006) who indicated that in 543manufacturers from ten European, Asian and Australian countries, improvement ofimprovement was considered the third most important improvement routine. SME managersthat want to improve the structure of lean also have to develop, learn about and improve theirimprovement system to do so. This study proposes that in manufacturing SMEs:
P4. Advanced implementation of lean practices can only exist if there is extensive presenceof: (a) employee-initiated improvements, (b) employee understanding, (c) managementinvolvement and support and (d) adjustment of the improvement system.
5.5 Non-necessary improvement routines for lean practicesThe results further suggest that in this study’s set of manufacturing SMEs, one routine – “alearning organisation” – was less required than the others. In the definition used here, alearning organisation refers to using a formal knowledge management system throughwhich employees at all levels articulate, consolidate and share their learning. This findingcontrasts with those of de Jager et al. (2004) and Jørgensen et al. (2006), who report that
230
IJOPM39,2
managers view a learning organisation as important. For SMEs, however, this routine mayappear more important than it actually is – Dabhilkar and Bengtsson (2004) also found thatit only explained a very limited portion of variance in relation to improvement.
It seems that formal structures of a learning organisation may contribute to betterimprovement activities in the long term, helping organisations to become lean rather thanincreasing operational performance directly. In SMEs in particular, lines of communicationare short and learning is often more informal. This paper, therefore, argues in line withMatthews et al. (2017) that a formalised system for managing knowledge is likely to be moreimportant for larger organisations. This study’s sample did not allow for comparison withlarge enterprises, leaving the question of the importance of a learning organisation for largerenterprises open for future research.
In conclusion, SME managers are advised that having a formal learning organisation onits own does not improve processes. Other routines are more important for conductingimprovement activities, namely developing an improvement culture and transitioning into alean organisation. This study, therefore, proposes that in manufacturing SMEs:
P5. Some implementation of lean practices as well as more advanced forms can existwithout formal articulation, consolidation and sharing of learning.
In general, and in line with the five lean principles described byWomack and Jones (2003), thisstudy found that manufacturing SME managers can, to some extent, initiate and implementlean practices themselves. However, to reap the full benefits of lean and to continuouslyincrease operational performance, managers have to also focus on improvement routines,namely on stimulating their employees to initiate improvement, fostering their understandingand improving the system as such. Sustaining a stable pattern of improvement efforts helpsdevelop organisational learning, enabling the continuous improvement of their lean practicesand increasing their operational performance.
5.6 Theoretical contributionsThese insights into the importance of improvement routines and their relationship withlean contribute to the existing literature in four ways. First, using quantitative data, thisstudy confirms the findings of earlier studies (Bessant et al., 2001; Womack and Jones,2003) that improvement routine importance depends on an organisation’s position in theirlean journey. Second, this study suggests the order in which improvement routines haveto be developed and provides propositions for further research using longitudinal studiesand/or larger samples. Third, this study shows that a stable pattern of improvementactivities adds to the development of organisational learning and an organisation’sdynamic capability. And fourth, using an NCA, this study also makes a methodologicalcontribution, as it allows to analyse relationships in the field of operations managementmore specifically. The majority of methods use either statistical correlation or casestudies. Using the ceiling lines and bottleneck table, NCA enables an investigation of thevarying degrees of necessity for different conditions, linked to varying degrees of aparticular outcome. This method thus gives a deeper understanding of how managementpractices affect organisational performance.
5.7 Practical implicationsThese new insights into the relative value of improvement routines can help manufacturingSME managers in two ways. First, they help managers pursue those improvement routinesthat are most suitable for their position in the lean journey. If the organisation has onlydeveloped lean practices to a limited degree, managers should lead employees to takeinitiative by introducing improvement activities themselves. If the organisation is more
231
Implementinglean practices
advanced in lean, managers should focus their attention on creating consistency in thedifferent projects and develop a more mature improvement structure.
Second, understanding the order in which improvement routines are important todevelop a lean organisation helps managers deploy their resources more effectively.If certain routines are sufficiently present, resources can be spent on the remainingbottleneck routines. This sustains resource efficiency and increases the possibility that thevalue streams are developed, thereby increasing operational performance.
6. Recommendations for future researchThis study was based on a Dutch sample and small set of cases, which does not allow forgeneralisation to other contexts and types of companies. Although Dabhilkar et al. (2007)found no national differences amongst the relationships between improvement routines andoperational performance, this study took a novel approach. Future research should replicatethis approach and study improvement routines as necessary conditions in differentcountries and industries, and/or use suitable samples to test the propositions developed inthis study. This should preferably be done using longitudinal data to provide more insightsinto the interrelationships between individual improvement routines. In addition toreplication studies, more in-depth studies should be conducted on the importance ofimprovement routines to better understand the underlying reasons for their relativeimportance and their dynamic relationship with lean.
Regarding the NCA method, other exciting opportunities for future research emerge.This study used linear ceiling lines to show the relationship between improvement routinesand lean practices. This could be further refined using discontinuous or exponentialfunctions. Furthermore, traditional analyses for mediation do not allow for relationships tobe asymmetrical, so further development of this approach is required. The NCA approachcould also be used to investigate other relationships to provide further improvement focusfor increasing operational performance.
References
Anand, G., Ward, P.T., Tatikonda, M.V. and Schilling, D.A. (2009), “Dynamic capabilities throughcontinuous improvement infrastructure”, Journal of Operations Management, Vol. 27 No. 6,pp. 444-461.
Ayyagari, M., Beck, T. and Demirguc-Kunt, A. (2007), “Small and medium enterprises across theglobe”, Small Business Economics, Vol. 29 No. 4, pp. 415-434.
Baron, R.M. and Kenny, D.A. (1986), “The moderator–mediator variable distinction in socialpsychological research: conceptual, strategic, and statistical considerations”, Journal ofPersonality and Social Psychology, Vol. 51 No. 6, pp. 1173-1182.
Berger, A. (1997), “Continuous improvement and Kaizen: standardization and organizational designs”,Integrated Manufacturing Systems, Vol. 8 No. 2, pp. 110-117.
Bessant, J. and Caffyn, S. (1997), “High involvement innovation through continuous improvement”,International Journal of Technology Management, Vol. 14 No. 1, pp. 7-28.
Bessant, J., Caffyn, S. and Gallagher, M. (2001), “An evolutionary model of continuous improvementbehaviour”, Technovation, Vol. 21 No. 2, pp. 67-77.
Bessant, J., Caffyn, S. and Gilbert, J. (1996), “Learning to manage innovation”, Technology Analysis &Strategic Management, Vol. 8 No. 1, pp. 59-70.
Bhamu, J. and Singh Sangwan, K. (2014), “Lean manufacturing: literature review and research issues”,International Journal of Operations & Production Management, Vol. 34 No. 7, pp. 876-940.
Bicheno, J. and Holweg, M. (2016), The Lean Toolbox, 5th ed., Picsie Books, Buckingham.
232
IJOPM39,2
Boer, H., Berger, A., Chapman, R. and Gertsen, F. (2000), CI Changes: From Suggestion Box toOrganisational Learning, Continuous Improvement in Europe and Australia, AshgatePublishing Ltd, Aldershot.
Bowman, C. and Ambrosini, V. (1997), “Using single respondents in strategy research”, British Journalof Management, Vol. 8 No. 2, pp. 119-131.
Cho, E. (2016), “Making reliability reliable: a systematic approach to reliability coefficients”,Organizational Research Methods, Vol. 19 No. 4, pp. 651-682.
Cronbach, L.J. (1951), “Coefficient alpha and the internal structure of tests”, Psychometrika, Vol. 16No. 3, pp. 297-334.
Dabhilkar, M. and Bengtsson, L. (2004), “Continuous improvements in Sweden: results of the 2ndInternational Continuous Improvement Survey”, Proceedings of the 5th International CINetConference, pp. 114-126.
Dabhilkar, M., Bengtsson, L. and Bessant, J. (2007), “Convergence or national specificity? Testing the CImaturity model across multiple countries”, Creativity & Innovation Management, Vol. 16 No. 4,pp. 348-362.
Dal Pont, G., Furlan, A. and Vinelli, A. (2008), “Interrelationships among lean bundles and their effectson operational performance”, Operations Management Research, Vol. 1 No. 2, pp. 150-158.
de Jager, B., Minnie, C., de Jager, J., Welgemoed, M., Bessant, J. and Francis, D. (2004), “Enablingcontinuous improvement: a case study of implementation”, Journal of ManufacturingTechnology Management, Vol. 15 No. 4, pp. 315-324.
Deming, W.E. (1993), The New Economics, 1st ed., MIT Press, Boston, MA.
Dul, J. (2016), “Necessary condition analysis (NCA): logic and methodology of ‘necessary but notsufficient’ causality”, Organizational Research Methods, Vol. 19 No. 1, pp. 10-52.
Dul, J. and Hak, T. (2012), Case Study Methodology in Business Research, Routledge, Oxon.
European Commission (2005), The New SME Definition, User Guide and Model Declaration, Enterpriseand Industry Publications, Brussels.
European Commission (2010), “List of NACE codes”, European Commission, Brussels.
Finstad, K. (2010), “Response interpolation and scale sensitivity: evidence against 5-point scales”,Journal of Usability Studies, Vol. 5 No. 3, pp. 104-110.
Fiol, C.M. and Lyles, M.A. (1985), “Organizational learning”, Academy of Management Review, Vol. 10No. 4, pp. 803-813.
Fornell, C. and Larcker, D.F. (1981), “Structural equation models with unobservable variablesand measurement error: algebra and statistics”, Journal of Marketing Research, Vol. 18 No. 3,pp. 382-388.
Gelinas, R. and Bigras, Y. (2004), “The characteristics and features of SMEs: favorable or unfavorableto logistics integration?”, Journal of Small Business Management, Vol. 42 No. 3, pp. 263-278.
Goertz, G., Hak, T. and Dul, J. (2012), “Ceilings and floors: where are there no observations?”,Sociological Methods & Research, Vol. 42 No. 1, pp. 3-40.
Hines, P.A., Holweg, M. and Rich, N.L. (2004), “Learning to evolve: a review of contemporary leanthinking”, International Journal of Operations & Production Management, Vol. 24 No. 10,pp. 994-1011.
Hofer, C., Eroglu, C. and Rossiter Hofer, A. (2012), “The effect of lean production on financialperformance: the mediating role of inventory leanness”, International Journal of ProductionEconomics, Vol. 138 No. 2, pp. 242-253.
Joreskog, K.G. (1969), “A general approach to confirmatory factor analysis”, Psychometrika, Vol. 34No. 2, pp. 183-202.
Jørgensen, F., Boer, H. and Laugen, B.T. (2006), “CI implementation: an empirical test of the CI maturitymodel”, Creativity and Innovation Management, Vol. 15 No. 4, pp. 328-337.
233
Implementinglean practices

Kaltoft, R., Boer, H., Caniato, F., Gertsen, F., Middel, R. and Nielsen, J.S. (2004), “Implementingcollaborative improvement top–down, bottom–up or both?”, Operations Management as aChange Agent. Proceedings of the 11th International Annual EurOMA Conference, INSEADBusiness School, Fontainebleau, 27–29 June, pp. 333-342.
Kim, Y.H., Sting, F.J. and Loch, C.H. (2014), “Top–down, bottom–up, or both? Toward an integrativeperspective on operations strategy formation”, Journal of Operations Management, Vol. 32 No. 7,pp. 462-474.
Knol, W.H., Slomp, J., Schouteten, R.L.J. and Lauche, K. (2018), “Implementing lean practices inmanufacturing SMEs: testing ‘critical success factors’ using necessary condition analysis”,International Journal of Production Research, Vol. 56 No. 11, pp. 3955-3973, available at: https://doi.org/10.1080/00207543.2017.1419583
Liker, J.K. (2004), The Toyota Way: 14 Management Principles from the World’s Greatest Manufacturer,McGraw-Hill, Madison, WI.
McGovern, T., Small, A. and Hicks, C. (2017), “Diffusion of process improvement methods in EuropeanSMEs”, International Journal of Operations & Production Management, Vol. 37 No. 5,pp. 607-629.
McKone, K.E., Schroeder, R.G. and Cua, K.O. (2001), “The impact of total productive maintenancepractices on manufacturing performance”, Journal of Operations Management, Vol. 19 No. 1,pp. 39-58.
Marodin, G.A. and Saurin, T.A. (2013), “Implementing lean production systems: research areas andopportunities for future studies”, International Journal of Production Research, Vol. 51 No. 22,pp. 6663-6680.
Matthews, R.L., MacCarthy, B.L. and Braziotis, C. (2017), “Organisational learning in SMEs: a processimprovement perspective”, International Journal of Operations & Production Management,Vol. 37 No. 7, pp. 970-1006.
Meiling, J., Backlund, F. and Johnsson, H. (2012), “Managing for continuous improvement in off-siteconstruction”, Engineering, Construction and Architectural Management, Vol. 19 No. 2,pp. 141-158.
Middel, R., op de Weeg, S. and Gieskes, J. (2007), “Continuous improvement in the Netherlands: asurvey-based study into the current practices”, International Journal of TechnologyManagement, Vol. 37 Nos 3/4, pp. 259-271.
Preacher, K.J. and Hayes, A.F. (2008), “Asymptotic and resampling strategies for assessing andcomparing indirect effects in multiple mediator models”, Behavior Research Methods, Vol. 40No. 3, pp. 879-891.
Rahman, S. and Bullock, P. (2005), “Soft TQM, hard TQM, and organisational performancerelationships: an empirical investigation”, Omega, Vol. 33 No. 1, pp. 73-83.
Raju, N.S. (1977), “A generalization of coefficient alpha”, Psychometrika, Vol. 42 No. 4, pp. 549-565.
Rijnders, S. and Boer, H. (2004), “A typology of continuous improvement implementation processes”,Knowledge & Process Management, Vol. 11 No. 4, pp. 283-296.
Rother, M. (2010), Toyota Kata, 2nd ed., Tata McGraw Hill, New Delhi.
Sakakibara, S., Flynn, B.B., Schroeder, R.G. and Morris, W.T. (1997), “The impact of just-in-timemanufacturing and its infrastructure on manufacturing performance”, Management Science,Vol. 43 No. 9, pp. 1246-1257.
Savolainen, T.I. (1999), “Cycles of continuous improvement: realizing competitive advantages throughquality”, International Journal of Operations & Production Management, Vol. 19 No. 11,pp. 1203-1222.
Shah, R. and Ward, P.T. (2003), “Lean manufacturing: context, practice bundles, and performance”,Journal of Operations Management, Vol. 21 No. 2, pp. 129-149.
Shah, R. and Ward, P.T. (2007), “Defining and developing measures of lean production”, Journal ofOperations Management, Vol. 25 No. 4, pp. 785-805.
234
IJOPM39,2
Singh, J. and Singh, H. (2015), “Continuous improvement philosophy – literature review and directions”,Benchmarking: An International Journal, Vol. 22 No. 1, pp. 75-119.
Slack, N., Chambers, S. and Johnston, R. (2010), Operations Management, 6th ed., Pearson EducationLimited, Harlow.
Sousa, R. and da Silveira, G.J. (2017), “Capability antecedents and performance outcomes ofservitization: differences between basic and advanced services”, International Journal ofOperations & Production Management, Vol. 37 No. 4, pp. 444-467.
Spear, S. and Bowen, H.K. (1999), “Decoding the DNA of the Toyota Production System”, HarvardBusiness Review, Vol. 77 No. 5, pp. 96-106.
Van Der Valk, W., Sumo, R., Dul, J. and Schroeder, R.G. (2016), “When are contracts and trust necessaryfor innovation in buyer–supplier relationships? A necessary condition analysis”, Journal ofPurchasing and Supply Management, Vol. 22 No. 4, pp. 266-277.
Vickery, S.K., Droge, C. and Markland, R.E. (1993), “Production competence and business strategy: dothey affect business performance?”, Decision Sciences, Vol. 24 No. 2, pp. 435-455.
Vinodh, S. and Balaji, S.R. (2011), “Fuzzy logic based leanness assessment and its decision supportsystem”, International Journal of Production Research, Vol. 49 No. 13, pp. 4027-4041.
Welsh, J. a and White, J.F. (1981), “A small business is not a little big business”, Harvard BusinessReview, Vol. 59 No. 4, pp. 18-27.
White, R.E., Pearson, J.N. and Wilson, J.R. (1999), “JIT manufacturing: a survey of implementations insmall and large US manufacturers”, Management Science, Vol. 45 No. 1, pp. 1-15.
Wieland, A., Durach, C.F., Kembro, J. and Treiblmaier, H. (2017), “Statistical and judgmental criteriafor scale purification”, Supply Chain Management: An International Journal, Vol. 22 No. 4,pp. 321-328.
Womack, J. (2013), Gemba Walks, 2nd ed., Lean Enterprise Institute, Cambridge, MA.
Womack, J.P. and Jones, D.T. (2003), Lean Thinking: Banish Waste and Create Wealth in YourCorporation, Free Press, New York, NY.
Zollo, M. and Winter, S.G. (2002), “Deliberate learning and the evolution of dynamic capabilities”,Organization Science, Vol. 13 No. 3, pp. 339-351.
Appendix 1. Improvement routinesThis appendix gives an overview of the different improvement routines listed in the literature. Theseroutines were first conceptualised by Bessant and Caffyn (1997) and later developed by Bessant et al.(2001). After Bessant finished his research, de Jager et al. (2004), Dabhilkar and Bengtsson (2004) andDabhilkar et al. (2007) altered the conceptualisation of the improvement routines based on, respectively,a case study and a statistical analysis. The routines of de Jager et al. (2004) show great overlap with theones listed by Bessant et al. (2001). The ones Dabhilkar and Bengtsson (2004) found differ, butDabhilkar et al. (2007) again found routines that were more in line with Bessant et al. (2001).An overview is given in Table AI.
Appendix 2. Accuracy and effect sizeTo determine the validity of the ceiling lines, two parameters were calculated: accuracy and effect size.The accuracy of improvement routines depends on the number of observations on or above the ceilinglines. Dul (2016, p. 28) defines accuracy as “the number of observations that are on or below the ceilingline, divided by the total number of observations, multiplied by 100%”. Because there can beobservations above the ceiling line, the empty space is henceforth referred to as the “ceiling zone”.If there were many observations above the ceiling line and in the ceiling zone, the improvementroutines would not always be necessary for implementing lean practices. So, the more observationsfound above the ceiling line, the less accurate the indication of improvement routine criticality forimplementing lean practices.
The NCA software further provides the improvement routine accuracies shown in Table AII. As theCE is a piecewise-linear line through the upper-left observations, the ceiling zone positioned leftof the CE line was completely empty. This results in an accuracy of 100 per cent; the CE line was valid
235
Implementinglean practices
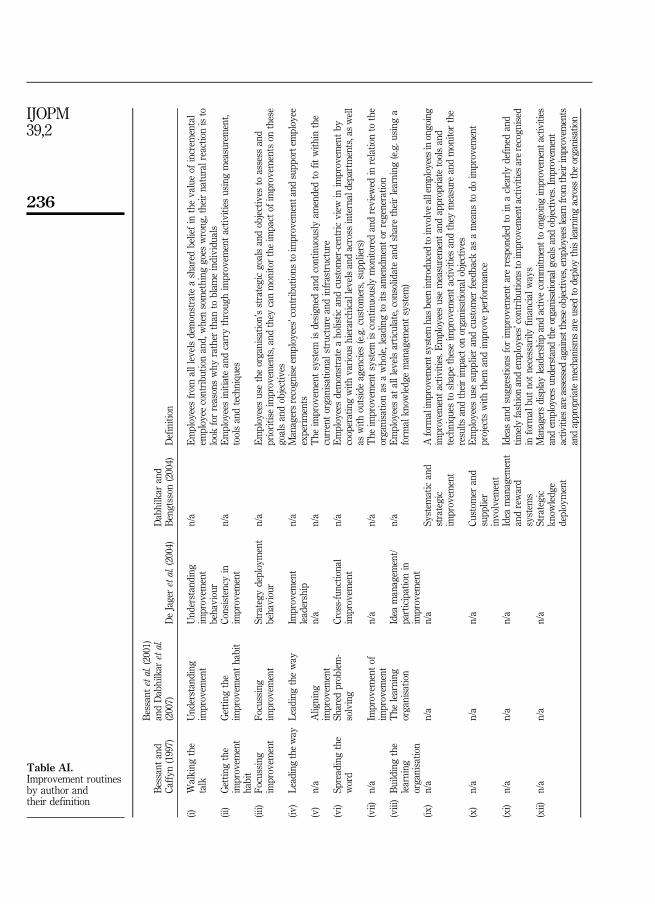
Bessant
and
Caffyn
(1997)
Bessant
etal.(2001)
andDabhilkar
etal.
(2007)
DeJageretal.(2004)
Dabhilkar
and
Bengtsson
(2004)
Definition
(i)Walking
the
talk
Und
erstanding
improvem
ent
Und
erstanding
improvem
ent
behaviour
n/a
Employeesfrom
alllevelsdemonstrate
ashared
beliefin
thevalueof
increm
ental
employee
contribu
tionand,whensomething
goes
wrong
,theirnaturalreactionisto
look
forreasonswhy
rather
than
toblam
eindividu
als
(ii)
Gettin
gthe
improvem
ent
habit
Gettin
gthe
improvem
enthabit
Consistencyin
improvem
ent
n/a
Employeesinitiateandcarrythroug
him
provem
entactiv
ities
usingmeasurement,
toolsandtechniqu
es
(iii)
Focussing
improvem
ent
Focussing
improvem
ent
Strategy
deployment
behaviour
n/a
Employeesusetheorganisatio
n’sstrategicgoalsandobjectives
toassess
and
prioritiseim
provem
ents,and
they
canmonito
rtheim
pactof
improvem
ents
onthese
goalsandobjectives
(iv)
Leadingtheway
Leadingtheway
Improvem
ent
leadership
n/a
Managersrecogn
iseem
ployees’contribu
tions
toim
provem
enta
ndsupp
ortemployee
experiments
(v)
n/a
Alig
ning
improvem
ent
n/a
n/a
The
improvem
entsystem
isdesign
edandcontinuously
amendedto
fitwith
inthe
currentorganisatio
nalstructure
andinfrastructure
(vi)
Spreadingthe
word
Shared
problem-
solving
Cross-functio
nal
improvem
ent
n/a
Employeesdemonstrate
aholistic
andcustom
er-centricview
inim
provem
entby
cooperatingwith
varioushierarchicallevelsandacross
internaldepartments,aswell
aswith
outsideagencies
(e.g.customers,supp
liers)
(vii)
n/a
Improvem
entof
improvem
ent
n/a
n/a
The
improvem
entsystem
iscontinuously
monito
redandreview
edin
relatio
nto
the
organisatio
nas
awhole,leading
toits
amendm
entor
regeneratio
n(viii)Buildingthe
learning
organisatio
n
The
learning
organisatio
nIdea
managem
ent/
participationin
improvem
ent
n/a
Employeesat
alllevelsarticulate,consolidateandsharetheirlearning
(e.g.u
sing
aform
alkn
owledg
emanagem
entsystem
)
(ix)
n/a
n/a
n/a
System
aticand
strategic
improvem
ent
Aform
alim
provem
entsystemhasbeen
introduced
toinvolveallemployeesinongoing
improvem
entactiv
ities.E
mployeesusemeasurementandappropriatetoolsand
techniqu
esto
shapetheseim
provem
entactiv
ities
andthey
measure
andmonito
rthe
results
andtheirim
pact
onorganisatio
nalobjectiv
es(x)
n/a
n/a
n/a
Custom
erand
supp
lier
involvem
ent
Employeesusesupp
lierandcustom
erfeedback
asameans
todo
improvem
ent
projects
with
them
andim
proveperformance
(xi)
n/a
n/a
n/a
Idea
managem
ent
andreward
system
s
Ideasandsugg
estio
nsforim
provem
entarerespondedto
inaclearlydefin
edand
timelyfashionandem
ployees’contribu
tions
toim
provem
entactivities
arerecogn
ised
inform
albu
tnotnecessarily
financial
ways
(xii)
n/a
n/a
n/a
Strategic
know
ledg
edeployment
Managersdisplayleadership
andactiv
ecommitm
enttoongoingimprovem
enta
ctivities
andem
ployeesunderstand
theorganisationalg
oalsandobjectives.Improvem
ent
activ
ities
areassessed
againstthese
objectives,employeeslearnfrom
theirimprovem
ents
andappropria
temechanism
sareused
todeploy
thislearning
across
theorganisation
Table AI.Improvement routinesby author andtheir definition
236
IJOPM39,2
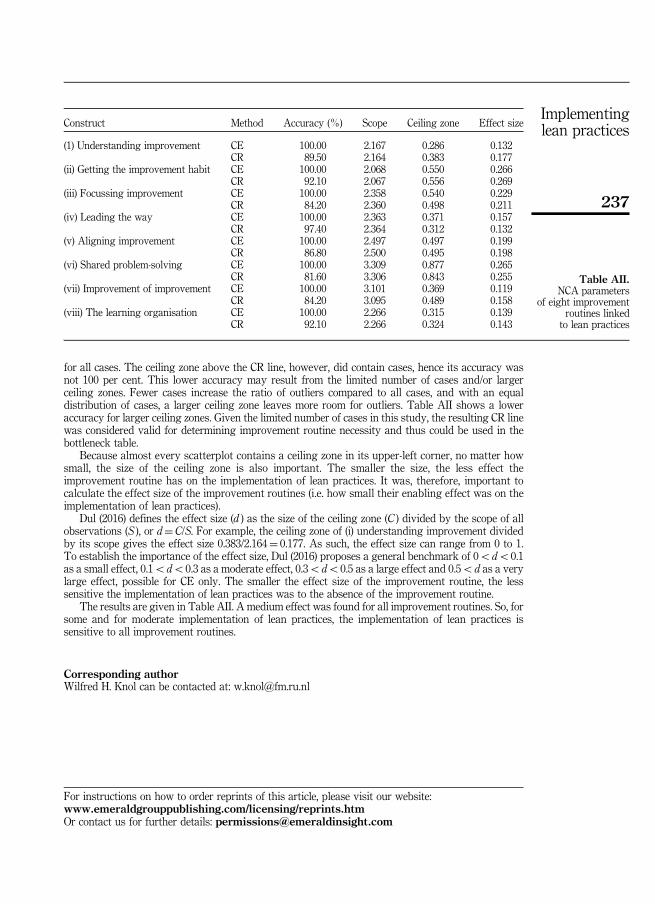
for all cases. The ceiling zone above the CR line, however, did contain cases, hence its accuracy wasnot 100 per cent. This lower accuracy may result from the limited number of cases and/or largerceiling zones. Fewer cases increase the ratio of outliers compared to all cases, and with an equaldistribution of cases, a larger ceiling zone leaves more room for outliers. Table AII shows a loweraccuracy for larger ceiling zones. Given the limited number of cases in this study, the resulting CR linewas considered valid for determining improvement routine necessity and thus could be used in thebottleneck table.
Because almost every scatterplot contains a ceiling zone in its upper-left corner, no matter howsmall, the size of the ceiling zone is also important. The smaller the size, the less effect theimprovement routine has on the implementation of lean practices. It was, therefore, important tocalculate the effect size of the improvement routines (i.e. how small their enabling effect was on theimplementation of lean practices).
Dul (2016) defines the effect size (d ) as the size of the ceiling zone (C ) divided by the scope of allobservations (S ), or d¼C/S. For example, the ceiling zone of (i) understanding improvement dividedby its scope gives the effect size 0.383/2.164¼ 0.177. As such, the effect size can range from 0 to 1.To establish the importance of the effect size, Dul (2016) proposes a general benchmark of 0odo0.1as a small effect, 0.1odo0.3 as a moderate effect, 0.3odo0.5 as a large effect and 0.5od as a verylarge effect, possible for CE only. The smaller the effect size of the improvement routine, the lesssensitive the implementation of lean practices was to the absence of the improvement routine.
The results are given in Table AII. A medium effect was found for all improvement routines. So, forsome and for moderate implementation of lean practices, the implementation of lean practices issensitive to all improvement routines.
Corresponding authorWilfred H. Knol can be contacted at: [email protected]
Construct Method Accuracy (%) Scope Ceiling zone Effect size
(1) Understanding improvement CE 100.00 2.167 0.286 0.132CR 89.50 2.164 0.383 0.177
(ii) Getting the improvement habit CE 100.00 2.068 0.550 0.266CR 92.10 2.067 0.556 0.269
(iii) Focussing improvement CE 100.00 2.358 0.540 0.229CR 84.20 2.360 0.498 0.211
(iv) Leading the way CE 100.00 2.363 0.371 0.157CR 97.40 2.364 0.312 0.132
(v) Aligning improvement CE 100.00 2.497 0.497 0.199CR 86.80 2.500 0.495 0.198
(vi) Shared problem-solving CE 100.00 3.309 0.877 0.265CR 81.60 3.306 0.843 0.255
(vii) Improvement of improvement CE 100.00 3.101 0.369 0.119CR 84.20 3.095 0.489 0.158
(viii) The learning organisation CE 100.00 2.266 0.315 0.139CR 92.10 2.266 0.324 0.143
Table AII.NCA parameters
of eight improvementroutines linked
to lean practices
For instructions on how to order reprints of this article, please visit our website:www.emeraldgrouppublishing.com/licensing/reprints.htmOr contact us for further details: [email protected]
237
Implementinglean practices