The rates of dissolution of olivine, plagioclase, and ... · PDF fileThe rates of dissolution...
11
MINERALOGICAL MAGAZINE, DECEMBER 1985, VOL. 49, PP. 683-93 The rates of dissolution of olivine, plagioclase, and quartz in a basalt melt COLIN H. DONALDSON Department of Geology, University of St Andrews, St Andrews, Fife, KY16 9ST, Scotland ABSTRACT. The dissolution rates of spheres of two magnesian olivines, two plagiodases, and quartz in tholeiitic basalt have been determined at three super- liquidus temperatures and one-atmosphere pressure. There are considerable differences in the rates among the minerals, e.g. at 1210~ 12~ above the liquidus temperature of the basalt, labradorite dissolves at 86 #m/h. and the magnesian olivines at 9 and 14/~m/h. The rates are not time dependent and this, coupled with the existence of concentration gradients in the composition of quenched melt adjacent to partially dissolved crystals, indicates that the dissolution rates are dictated by a combination of diffusion and convection of components to and from the crystal-liquid interface. Values for the activation enthalpy of dissolution are small for quartz and plagioclase (40- 50 kcal mol 1) but large for olivine 73-118 kcal mol-~). Dissolution of plagiodase in rock melts seems to be a much more rapid process than crystal growth, whereas olivines apparently dissolve and grow at similar rates. Crystal dissolution is sufficiently slow that ascending, crystal-bearing magma may become superheated and yet fail to dissolve the crystal fraction before quenching; this may be the reason that olivine phenocrysts are often rounded. K E Y W O R D S : olivine, plagioclase, quartz, tholeiite, basalt, dissolution. W H ER EA S the kinetics of magmatic crystallization have been of great interest in the last decade (see Dowty, 1980 and Kirkpatrick, 1980, for recent reviews), comparatively little work has been done on the dissolution of minerals in silicate melts of rock or rock-like compositions (Table I). Yet there is an ever-growing body of literature containing evidence of the interaction of mafic magmas with crustal materials (e.g. see papers in Moorbath et al., 1984) and a number of situations are likely in which dissolution may occur. For example, when country rock is accidentally incorporated in a magma, when a primary magma carrying restite crystals ascends speedily from its source, or when a water- undersaturated magma containing phenocrysts moves upwards, and when porphyritic magma, resident in a chamber, is heated by, and/or mixes with a new batch of more primitive magma entering the chamber. Knowledge of dissolution kinetics of minerals in rock melts and an understanding of what controls these kinetics can provide a better sense of what happens during these interactions between crystals and liquid. This paper presents data on the dissolution rates Table I. Summary of previous studies of mineral dissolution in silicate melt Reference Melt composition Crystal dissolved Pressure Kutolin and Alkalic basalt Olivine, garnet, 1 bar Agafanov, 197B orthopyroxene, clinopyroxene Donaldson, 1979a Alkali olivine basalt Olivine 1 bar Scarfe et al., Alkali olivine basalt Olivine, orthopyroxene, 12.5- 1980 clinopyroxene, spinel, 20 kbam garnet Watson, i~82 Thcleiitic basalt Quartz, oligoclase, I bar K-feldspar Thornber and Synthetic lunar Olivine i bar Huebner, 1982 basalt Kuo and Melts in the Forsterite, diopside, 1 bar Kirkpatrick, 1983 system CaMgSi206- enstatite, quartz Mg2Si04-SiO2 Harrison and Obsidian Zircon 8 kba~ Watson, 1983 t~ Copyright the Mineralogical Society
Transcript of The rates of dissolution of olivine, plagioclase, and ... · PDF fileThe rates of dissolution...

M I N E R A L O G I C A L M A G A Z I N E , D E C E M B E R 1985, VOL. 49, PP. 683-93
The rates of dissolution of olivine, plagioclase, and quartz in a basalt melt
COLIN H. DONALDSON
Department of Geology, University of St Andrews, St Andrews, Fife, KY16 9ST, Scotland
ABSTRACT. The dissolution rates of spheres of two magnesian olivines, two plagiodases, and quartz in tholeiitic basalt have been determined at three super- liquidus temperatures and one-atmosphere pressure. There are considerable differences in the rates among the minerals, e.g. at 1210 ~ 12 ~ above the liquidus temperature of the basalt, labradorite dissolves at 86 #m/h. and the magnesian olivines at 9 and 14/~m/h. The rates are not time dependent and this, coupled with the existence of concentration gradients in the composition of quenched melt adjacent to partially dissolved crystals, indicates that the dissolution rates are dictated by a combination of diffusion and convection of components to and from the crystal-liquid interface. Values for the activation enthalpy of dissolution are small for quartz and plagioclase (40- 50 kcal mol 1) but large for olivine 73-118 kcal mol-~). Dissolution of plagiodase in rock melts seems to be a much more rapid process than crystal growth, whereas olivines apparently dissolve and grow at similar rates. Crystal dissolution is sufficiently slow that ascending, crystal-bearing magma may become superheated and yet fail to dissolve the crystal fraction before quenching; this may be the reason that olivine phenocrysts are often rounded.
K E Y W O R D S : olivine, plagioclase, quartz, tholeiite, basalt, dissolution.
W H E R E A S the kinetics of magmatic crystallization have been of great interest in the last decade (see Dowty, 1980 and Kirkpatrick, 1980, for recent reviews), comparatively little work has been done on the dissolution of minerals in silicate melts of rock or rock-like compositions (Table I). Yet there is an ever-growing body of literature containing evidence of the interaction of mafic magmas with crustal materials (e.g. see papers in Moorba th et al., 1984) and a number of situations are likely in which dissolution may occur. For example, when country rock is accidentally incorporated in a magma, when a primary magma carrying restite crystals ascends speedily from its source, or when a water- undersaturated magma containing phenocrysts moves upwards, and when porphyritic magma, resident in a chamber, is heated by, and/or mixes with a new batch of more primitive magma entering the chamber. Knowledge of dissolution kinetics of minerals in rock melts and an understanding of what controls these kinetics can provide a better sense of what happens during these interactions between crystals and liquid.
This paper presents data on the dissolution rates
Table I. Summary of previous studies of mineral dissolution in silicate melt
Reference Melt composition Crystal dissolved Pressure
Kutolin and Alkalic basalt Olivine, garnet, 1 bar Agafanov, 197B orthopyroxene,
clinopyroxene
Donaldson, 1979a Alkali olivine basalt Olivine 1 bar
Scarfe et al., Alkali olivine basalt Olivine, orthopyroxene, 12.5- 1980 clinopyroxene, spinel, 20 kbam
garnet
Watson, i~82 Thcleiitic basalt Quartz, oligoclase, I bar K-feldspar
Thornber and Synthetic lunar Olivine i bar Huebner, 1982 basalt
Kuo and Melts in the Forsterite, diopside, 1 bar Kirkpatrick, 1983 system CaMgSi206- enstatite, quartz
Mg2Si04-SiO 2
Harrison and Obsidian Zircon 8 kba~ Watson, 1983
t~ Copyright the Mineralogical Society

684 C. H. DONALDSON
of several common rock-forming minerals in a common magma (tholeiitic basalt), at several temperatures. The data, and electron probe micro- analyses of the quenched melt near crystal-liquid junctions, are used to examine the factors that limit the rate of mineral dissolution in magmas. Dissolu- tion is shown to be rapid by comparison with crystal growth rates and dissolution rates differ considerably from mineral to mineral.
Experimental
Method. The experiments were conducted at atmospheric pressure in a 3 cm ID vertical muffle tube, set in a Deltecb VT-31D furnace. Tempera- ture at the 'hot-spot' of the furnace, was measured with a Ptl oo-Pts 7 Rh 13 thermocouple and a digital thermometer which has 1 ~ resolution and + 1 ~ accuracy. The thermocouple was calibrated against the melting point of gold.
Oxygen partial pressure was controlled by down- wards flow of a CO and CO 2 mixture at 60 cm3/ min. The Po~ at the "hot spot' was measured with a ZrO2-CaO electrolytic cell, calibrated by bracket- ing the Fe -FeO reaction. It was controlled within 0.3 log units of the quartz-fayalite magnetite buffer, i.e. close to values typical of terrestrial basalts (Sate, 1978). (One consequence of using hydrogen- free gases to control Po~ is that the basalt melt will be nominally anhydrous. Users of the data reported here should note this point as the larger viscosity than is likely in nature will result in slower rates of dissolution than in nature.)
A charge was suspended from a ceramic rod and quenched into either air or water (cooling rates of 200 and 500~ respectively).
The sample was held on a 3 mm-diameter loop of 0.125 mm diameter platinum wire (Donaldson et al., 1975). A pressed, 35-40 mg pellet of powdered basalt rock (or rarely glass), surrounding a small crystal sphere, was tacked to the wire by passing a small electric current through the wire until the parts of the pellet touching it fuse (Donaldson et al., 1975).
Once at the furnace hot-spot, the basalt fraction fuses as a drop on the wire loop. The maximum size of mineral grains in the pulverised basalt is 5 #m and Donaldson (1979a) has shown that complete fusion, 5 ~ above the liquidus temperature, occurs within a few minutes. In the present experiments at > 12 ~ above the liquidus fusion of the basalt will be nearly instantaneous.
In a few experiments reported here powdered rock and a crystal sphere were reacted in the melting interval of the rock, as much as 70 ~ below the liquidus temperature. Melt appeared virtually instantly, however, the full amount of melt and its
Table II. Composition of basalt used in experiments
5i02 51.91
TiO 2 1.16
AI203 15.85
Cr203 0.06
Fe203 1.65
FeO B.27
MnO 0.15
MgO 7.01
CaO B.66
Na20 3.03
K20 0.75
P205 0.17
H2O total 0.86
9 9 . 5 3
equilibrium composition were not achieved for roughly 1 to 3 hours.
Rock and minerals used. The basalt used is a tholeiite (Table II) with 0.4 wt. ~ of normative quartz; it is saturated with olivine (Foa~-s4) at its liquidus temperature of 1198-t-2 ~ followed by plagioclase (An64) at 1187 ~ clinopyroxene at 1133 ~ and magnetite and ilmenite near the solidus at 1090 ~ (Lofgren, 1983). At the three isotherms investigated (1300 ~ 1250 ~ and 1210 ~ the viscosity of the basalt melt is 220, 370, and 560 poise, as computed by the method of Shaw (1972). At the Po~ used losses of Fe to the wire and volatilization of Na and K are minor (Donaldson, 1979b) and will not affect the results.
Crystals (Table III) came from the St Andrews mineral collection.*
During dissolution the melt fraction of a charge changes slightly; a typical 1 mm diameter quartz crystal represents approximately 4 ~o of the mass of a charge and the amount of SiO2 in the melt would rise by c.2 wt. ~o, if the crystal completely dissolved in the basalt. The same is not true of the melt at the interface between a dissolving quartz crystal and the basaltic melt.
The final column of Table III indicates the fusion characteristics of the various crystals used, in the absence of the basalt solvent. At the temperatures at which the experiments were conducted (1120- 1300~ the olivines and quartz do not melt and the labradorite would melt only slightly at 1300~ on the other hand, the oligoclase could partially melt
* Pyroxene is conspicuous by its absence from Table II1. In the melt used both orthopyroxene and aug~te undergo a complex dissolution reaction in which pyroxene destruction is accompanied by the crystallization of very small crystals of olivine around the pyroxene. The process will be described in another article.
D I S S O L U T I O N IN BASALT MELT
Table I I I . Crystals user and their origin
685
Mineral Comments Orlqin
Olivine, Ig. Fool ~ (ave. of 12 'probe Phenocrysts from the an~lg~es ; spread of values Iglorrsuit picrite sill
42~ FO); glassy green; Ubekend% [Jland, inclusion-free West Greenland
Olivine, ff19 Fo~A m (ave. Of 6 'probe Phenocryats in picritlc an~9~es ; spread of values hasal~ lava, Mauns
2~ Fo); glassy yellow; Lea, Hawaii scmrce inclusions of chrome spinel
tsbzadorite An52.5 0z2. 9 Ab44.6 (ave. Anorthosite, Michiksmau of !0 tprobe analyses; intrusio,, Labrador spread of An values
3~); cloudy white
01igoclass An2~ 0 0=3 4 Abe7 ~ [ave. Pegmatite, Isle of Lewis, of 9" proS~ anal~s; Scotland spread of An values
~7~)~ cloudy white
Quartz, ~ Colourless, transparent, Vein qua~tz~ 5an Jos~ inclusion-free Main Vein, Llallagua t
~olivia (Quartz I, C Crystals with strained Granodiorite, Criffel
(undulose) extinction intrusion, Scotland)
(Qua~tzlt T Cloudy white Phenocrysts from rhyolite= Tihcbi complex, Nigeria)
Fusion characteristics in absence 07 basalt
Solidus ca. 1760 ~ liquidus ca. 1850 ~ (Seven and 5chairer, 1935)
Solidus ca. 1740 ~ liquidus ca. IS40 a [B~wen and 5chairez, i~35)
Solidus 1290 ~ , liquidus 14357 At 1300 ~ under equilibrium conditions there should be 2.5~ liquid. (Howen, 1913)
Solidus i180 ~ , liquidus 1380~ At 1210 ~ should be 16.5~ liquid, and at 1300 ~ 61~ liquid. (~owen, 1913)
Melts at 1713 ~
i Very few experiments conducted with these crystals (see Table 4)
in all the experiments above 1180 ~ In experiments in which plagioclase is dissolved in basalt, except those with oligoclase at 1300 ~ there is no clear evidence of internal melting of the crystals, nor is there an enveloping film of plagioclase glass separa- ting crystal from basalt. This implies that dissolu- tion rates of plagioclase in basalt exceed the fusion rates of the crystals. The exception, oligoclase at 1300 ~ melts in approximately twenty minutes and it is this blob of melt that proceeds to dissolve in the basalt.
Mineral sphere preparation and measurement. The spheres used range from 0.5 to 1.5 mm in diameter, with most being 0.6 to 0.9 mm. They were prepared in a mini-tumbler, as described by Bond (1951): roughly equant mineral chips are blown around the inside of a 1.5 cm diameter brass cylinder lined with carborundum-coated paper. By rejecting roughly seventy percent of all the 'spheres' obtained, crystals with a 'high' degree of sphericity can be obtained, in which diameters measured in any direction differ by less than __+ 5 ~o of the average of ten measurements, in random orienta- tions, using a microscope equipped with an eyepiece graticule.
Post-experiment observations. One means of determining dissolution rates is to conduct a series of isothermal experiments of different duration on crystals of uniform size, and thereby establish the minimum time needed to completely destroy that size of crystal. The rate of dissolution would then be taken as the crystal size divided by the minimum
time established from the experiments. The draw- back to this approach is that it would not reveal whether the dissolution rate was time dependent, as it would be if it is controlled purely by diffusion of material in the melt. It is more informative to conduct a series of experiments of different dura- tions at each isotherm and determine the change in size of the crystal spheres: then a graph of run duration versus the change in size will reveal any time dependence.
To determine the change in size of a sphere requires measuring the post-experiment size of the crystal. This is done by gluing the charge to a glass slide and then hand-grinding with carborundum powder. Once the crystal is exposed, its diameter is measured between successive 30-second grindings and the maximum value is taken as the diameter of the sphere. This value is considered accurate to + 0.02 mm. In many charges, notably of quartz, oligoclase, and olivine, the crystal remnant is close enough to the surface to be measured with a binocular microscope; agreement with the other method is excellent.
If required, the now-flattened surface of the charge can be mounted on a glass slide and a thin section prepared. A small proportion of the charges were prepared as polished thin sections and the electron probe used to examine the composition of the glass near to crystals.
The probe analyses were obtained on the Cam- bridge Instruments Mark V machine in the Edin- burgh University Geology Department. Individual

686 C. H. D O N A L D S O N
T~bl~ i~. Data f e r indi~idu~l runs
aun ,c C r y s t e Z T e ~ p * Dura%lon , I n l t . f i n a l Azadlus. r i n t e r c e p t o, d i s s o i u ~ i o n ~ e t e , oc houzs aiam. ~s ~ coefficient ~ radius axis, m m ~m/hr
z l 7 quaz%r G 1300 1.5o ~is ~.66 ~20 1 .42 319 o.so 320 3 .01
243 1250 d. Oe ~ 6 2.0 Z~ l 2.75 Z6Z z .53 Z7T i.oo ~ I.OO 290 i.oo
261, Z.75 ~5!6 2.7~
zg~ ~ u a ~ z , T 2.ZS 0.70 3~0 �9 5.05 i.60 300~ �9 5 . 3 0 i.TZ 35~ qu~rt~, c ~.60 0.s5 3~0 " 3.21 0 .83 3~1 i.25 0 .04
193 ~ua ,~z , G !210 25.2~ 0.5~ Ig4 " i T . O o,60 !~5 - 2 . 5 0.60 196 " 9 .33 0.52 31~ i. Oi ~.02 ~Z ~.oe 0 .~5 392 3 .92 0 .63
2~2 " ~ 4 3 T~,O 1.01 z ~ �9 71 .o c . ; s 338 " 24 .25 0 . s Z 330 163.0 0.8~ 3ao 149.2 1.22
�9 i~9.S 0.50
2Z2 Oliqoelas~ 1300 3Z4 -
SZ6 ~Z6a
Z56
28~
leo igo ig2 ~31 3SS
Zg4
21~ La~r~do~lle 1300 221 3Z~ 322 323
247 " 1250 2se
z s i 2sz 3~o
164 " 1210 187
aa5
208 olivine zg. 1300 209 Z09~ " ~1o
133 - 1250
26T
149 " 1210 150
153
2it olivine, H19 1300
139 1250
zaz 154 ~55 155a
160
~68 Z72 273
Z9~ 29e ~oe
3o6 307
179 180
o.a2s o.ze o.1o o.os o.16
o.18 o.o75 o.15 o.o75 o.04 0.045 0.03 0.12 0.26 C.14 0 .~4
o.12 0.26 0.20 0,04 o, le o .oTs
o 0.16 0 0 . 3 0 O.a6 0.07
0.3t .7G 0.0~
0.50 0.175 0,3~ C,15
0 .76 o.lzs o.7o o.;a o ,a5 0.0~5
0 .91 0.!53
0,21 0.075
1 . o 0.98 0.53 0.225 0 . 4 5 t . 0 1 0.73 o .14 o,ta o.72 o,~ C.05 o.5T 0,55 0,~5 0.~5 o,6s o .7~ o .~1 o . l a
1260 1.25 0.50 0.14 2.0 0.52 o 1 . 7 5 ~.oz 0.52 1 . o 1 . O l C.71
1210 0 . 7 5 0 ,61 0,a6 - s.se 0,60 0 - 3 .0 0.62 O , l Z
0.5 0 . 7 5 ~ .63 i . e 3 o ,95 0.60
i 1 5 0 70.0 1 .52 0,72
i . o o . 6 z o , z ~ 1.5 1 . 0 2 0 ,38 0 .75 0 ,65 0 .31 0.5 0.75 0.60 O. Z5 o . r s 0.63
1 .a2 o . 5 5 0 .21 0 .17 1 .75 0.60 o , z ! 0 . i 9 5 i.~o o.45 0 0 . ; 2 5 1 .15 0.90 0.68 0.Ii 1 .78 1.03 0.67 0,10 0.52 0 .70 0.60 0.05
1.67 o.so 0.35 0.ii~ Z.25 0.52 0 .37 0.175 2 .0 o . e o ~,SA o.i3 0.~7 o ,a~ O.Te o . o z z , o 0.~5 0 .53 0.06
2.oe o.so o,oe o , ~ i i.20 0.50 0.30 O.iO 1 . 2 0 0 .54 0.29 0 . i 2 5 3.00 0.60 0 0.30
z . o o . 5 o o . z 5 0 . i ~ 5 i , o o .51 o.a~ o,o25 4 . 0 0.50 0:20 o .16 5.0 0 . 5 1 0.23 0 .14 3 , 0 0.65 0.~0 0.07~ 2 .T5 0.50 0,35 0.0T5 4.0~ o.7o 0.55 O.OTS t . s 0.40 0.30 0.05 l.S 0.45 0.35 0,0~ 3.0 0.40 O . i 7 0 . i i 5
2.0 0 .40 0.~6 0.02 s.o o.~o ~.z~ 0.075 ~ .67 0 .~Z 3 . Z ? 0.075
17.58 G.43 ~.23 o.io 12.0 0.44 ~.i~ 0.125
3.08 0.~5 o .za o.!~ 1 .50 o ,60 0.40 O.i~
4.0 0.60 o.~o o.io 1.03 0 .50 0 .45 0 .025 2.0 0.50 o.az o, oa
16.67 0.55 0 0,275 ~.5 0.45 ~.1o 0.175 5.5 0.48 O.18 0 . i 5
i0.~7 O.aO o o . ~ e . i 7 0.45 o O.ZZ5 6.92 0.40 0 O.ZO 6 .42 0 . 5 0 0 .20 0 .15 1 .5 0 . 4 5 o .~e 0.035 1.o 0.40 o.14 o.oe 3.0 0 . 6 1 o.43 0.09 1.5 o.So o.44 o.~2 �9 .o~ o.8i 0.59 o.i! 9.5 1.01 0.53 0,2~
i z 1 0 ~.5 0.55 0.49 0 .03 �9 ~.o o.s6 o . a o o.o~ - 2~.0 0.~0 O.ZO o.1c
46 .75 0 .39 o.17 o.ii ~5.0 0.51 0.32 0 .0~5
0.60 0.35 ~.02 0.~6 0.T5 0.55 0.53 O.43 0.05 0.)3
0.60 0.14 0.62 O.4T 0.60 0.30 o.a5 a . ? ~ 0.52 o.04 I.oo o.91 i . o z 0 .92 0.70 O.aS 1.~5 1 .13 0.65 0 .37 0.67 0.39
0.4~ z .ce 1 .14 G.37 c,~y o.sg
0.93 0.005 7e
0.06 -0.C10 51
o . 5 7 o, 0,~ 9
0.18 1 0.26 0.15 0.92 0.15 0.13
0.075 1 0.3 0.25 0,90 0.06 0 .175
0.40
o, ze c ,32 o.17 0.98 0.ois 0.05
0.~9
0.99
-0,011
-0.O06
av~.53
703
8 . 7
a v e . 63.5
DISSOLUTION IN BASALT MELT 687
wavelength-dispersive analyses were obtained of 2 #m-wide spots along a traverse at right angles to the crystal-glass interface. Full ZAF corrections were applied.
Errors and reproducibility of results. In obtaining a value for the change in diameter of a sphere there are two main sources of error: (i) the imperfect sphericity of the crystals and (ii) the errors in measuring the crystals before and after the experi- ment. It is estimated that the total error attached to each value of the change in crystal radius (Ar) in Table IV is +0.035 mm.
The reproducibility of results was examined in a small number of experiments carried out on quartz crystals at the same temperature (1250 ~ ) and two different run times (1.0 and 2.75 hours). The results (Table IV) show reasonable agreement in the values of Ar, the spread in values being 0.01 mm for both run times.
A useful conclusion to be drawn from these estimates is that to obtain results of greater accuracy would require either (a) the use of bigger crystals or (b) the ability to observe the dissolving crystals directly. Neither approach is free of problems: (a) requires longer run times and larger volumes of melt than can be held on wire loops, and the resultant need for a crucible will result in greater iron loss; (b) quite simply is impossible because Fe-bearing melts are opaque--only model, Fe-free, melts could be studied.
Results
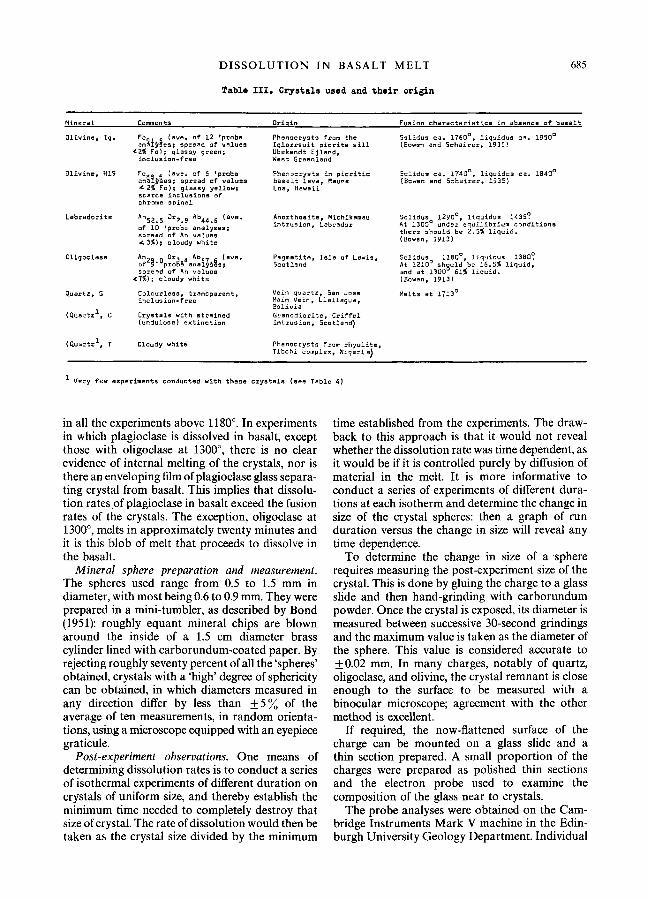
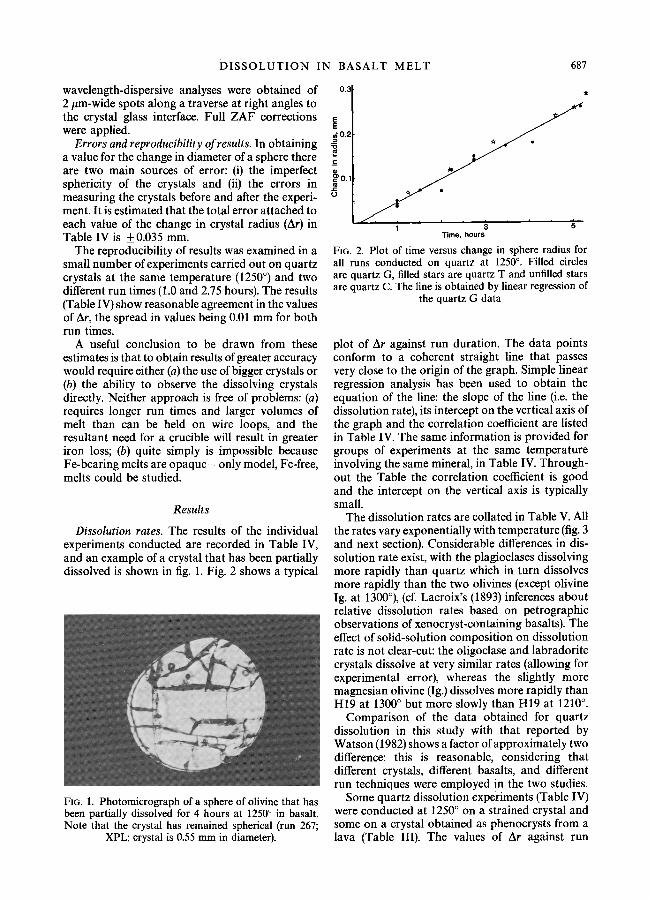
Dissolution rates. The results of the individual experiments conducted are recorded in Table IV, and an example of a crystal that has been partially dissolved is shown in fig. 1. Fig. 2 shows a typical
FIG. 1. Photomicrograph of a sphere of olivine that has been partially dissolved for 4 hours at 1250 ~ in basalt. Note that the crystal has remained spherical (run 267;
XPL; crystal is 0.55 mm in diameter).
0.21"
. . . . . . . .
1 3 5 Time, hours
FIG. 2. Plot of time versus change in sphere radius for all runs conducted on quartz at 1250 ~ . Filled circles are quartz G, filled stars are quartz T and unfilled stars are quartz C. The line is obtained by linear regression of
the quartz G data
plot of Ar against run duration. The data points conform to a coherent straight line that passes very close to the origin of the graph. Simple linear regression analysis has been used to obtain the equation of the line: the slope of the line (i.e. the dissolution rate), its intercept on the vertical axis of the graph and the correlation coefficient are listed in Table IV. The same information is provided for groups of experiments at the same temperature involving the same mineral, in Table IV. Through- out the Table the correlation coefficient is good and the intercept on the vertical axis is typically small.
The dissolution rates are collated in Table V. All the rates vary exponentially with temperature (fig. 3 and next section). Considerable differences in dis- solution rate exist, with the plagioclases dissolving more rapidly than quartz which in turn dissolves more rapidly than the two olivines (except olivine Ig. at 1300~ (cf. Lacroix's (1893) inferences about relative dissolution rates based on petrographic observations of xenocryst-containing basalts). The effect of solid-solution composition on dissolution rate is not clear-cut: the oligoclase and labradorite crystals dissolve at very similar rates (allowing for experimental error), whereas the slightly more magnesian olivine (Ig.) dissolves more rapidly than H19 at 1300 ~ but more slowly than H19 at 1210 ~
Comparison of the data obtained for quartz dissolution in this study with that reported by Watson (1982) shows a factor of approximately two difference: this is reasonable, considering that different crystals, different basalts, and different run techniques were employed in the two studies.
Some quartz dissolution experiments (Table IV) were conducted at 1250 ~ on a strained crystal and some on a crystal obtained as phenocrysts from a lava (Table III). The values of Ar against run

688 C. H. D O N A L D S O N
Table V. Collation of dissolution rates (~m/hr) in Table IV.
T ~ Quartz Oligoclase Labradorite Olivine Ig. Olivine H19
1300 Y8 205 213 83 63.5
1250 51 14Y I14 24 26
1210 36 T7 86 8.7 14
llSO 6 - -
1143 0.4 - -
1122 0.38
duration (open star and filled star symbols, respec- tively, in fig. 2) reveal no significant differences in dissolution rates among the crystals from the three quite different environments (hydrothermal, plu- tonic (and strained) and volcanic). Apparently any differences between these crystals with respect to minor- and trace-element contents and defects (sensu lato) do not influence the rate at which atoms are removed from the surface of the quartz.
In fig. 3 the three high-temperature data points are for quartz dissolution in basalt melt that is absolutely superheated (i.e. above the liquidus temperature) and the other two involve dissolution in partially melted basalt. Note that the two low-temperature points fall considerably below the extension of the curve extrapolated from the three high-temperature points. There are several possible reasons for this: 1, the melt fraction of the partially melted basalt is likely to be more siliceous than the completely molten basalt, and hence more viscous than supercooled basalt melt at the same tempera- ture. Transport of dissolved quartz components away from the crystal therefore will be inhibited. 2, at these lower temperatures plagioclase is a stable
phase and hence the melt is likely to be far more polymerized than supercooled, plagioclase-free basalt melt at the same temperature; this too would result in a relatively large viscosity and sluggish transport of quartz components away from the crystal-liquid interface. 3, at both the lower temperatures there develops about the quartz crystals a continuous fringe of elongate pigeonite crystals, as dissolution proceeds (fig. 4; cf. Sato, 1974); this fringe will tend to extend the distance through which quartz components have to migrate in moving away from the quartz-melt interface and hence reduce dissolution rate; it will also inhibit any convection of melt that might occur near to the crystal (see later section), i.e. reduce the rate of transport of quartz components in the melt.
'Activation enthalpies' of dissolution and their implications. Since the dissolution rates increase exponentially with temperature the Arrhenius relationship is expected to apply:
Z = Aoe (AH/RT)
where Z is dissolution rate at absolute temperature, T, AH is the apparent enthalpy of activation of the dissolution reaction, Ao is a constant, the 'frequency
6 0
4C
o
1 1 0 0
J J
J f
- . I , I 1 2 0 0 1 3 0 0
o Temperature , C
FIG. 3. Plot of temperature versus dissolution rate of quartz G. Note how the measurements at 1122 ~ and 1143 ~ fall well below the extrapolation of the higher tempera-
ture data.
FIG. 4. Photomicrograph of the boundary between a partially dissolved quartz crystal and basalt glass, showing the elongate pigeonite crystals that form a felty texture about the quartz (run 292; PPL; width of view is
c.0.7 mm).

D I S S O L U T I O N IN BASALT M E L T 689
1.8
O
O
1.6
I I ~ I
6.3 6.5 6.7
104/Temperature(K) FIG, 5. Arrheniusplot ofthedissolution rates ofquartz at 1210 ~ , 1250 ~ and 1300 ~ . The line is that obtained by linear
regression.
factor', and R is the gas constant. Plots of log Z versus 1/T were prepared (e.g. fig. 5) and give the value of the slopes -(AH/R) used to obtain - A H (Table VI). For each of the five minerals, the three data points at the temperatures 1210 ~ , 1250 ~ and 1300 ~ are closely colinear, indicating that - A H is approximately constant in value over this small temperature interval.*
The values of - AH for dissolution of quartz and the two plagioclases are comparable and relatively small, whereas those for the two olivines, while comparable to one another, are very much larger than those of the framework silicates. The data of Watson (1982) and Thornber and Huebner (1982) have been used to obtain the values of - - A H for quartz dissolution in basalt and olivine dissolution in a lunar basalt (Table VI), and these too, show a low value for quartz and a Very high value for olivine.
Dissolution of minerals in rock melts must involve at least two distinct processes: ions must be extracted from the lattice and enter the melt, and
* That the three data points for oligoclase are colinear, despite the fact that the mineral fuses during dissolution at 1300 ~ , implies that there is little difference in the processes of dissolving oligoclase melt and oligoclase crystal in basalt melt; presumably the two phases have very similar structures.
T a b l e V I .
Computed values of activation enthalpy of dissolution, using data in Table V and the Arrhenius relationship, and comparison with other studies
Mineral -~H, Kcal mol -I
quartz 4D.3
Oligoclase 50.O
Labradorite 47.7
Olivine Ig. 117
Olivine HI9 72.8
Olivine in two 268, lunar basalts 213 (computed from data of Turnock and Huebner, 1982)
Quartz in tholeiite ~ 45 (computed from data of Watson, 1982)
they must then be transported away from the crystal-l iquid interface and mixed into the bulk of the melt (e.g. Elwell and Scheel, 1975). Each process has its own activation enthalpy, and its own activated state,t and hence the values of - - A H determined from experiments will reflect the most energy-demanding of these processes. It is striking how similar are the values of - A H obtained for the dissolution of quartz and plagioclase to the equivalent parameters for viscous flow of basaltic melt (56 kcal mol-~ [Shaw, 1969]) and for tracer diffusion of mono- and divalent cations in silicate melts (30-65 kcal m o l - 1) (Hofman, 1980; Hender- son, 1982). This may indicate that more energy is required to activate the transport of ions from the quartz- and plagioclase-melt interfaces than is needed to activate the extraction of ions from the lattice.
Olivine dissolution has larger values of - A H compared with the values of viscous flow and cation diffusion; these indicate that activation of the reaction(s) that extracts ions from the olivine lattice requires a large energy input. Given the large difference in - A H between the two olivines, it will be interesting to determine the values for more fayalitic olivines, to see if they are less than that for H19.
Rate-controlling step in dissolution. Dissolution
t In reality there are probably a series of activated states involved in removing an ion from a crystal (e.g. Elwell and Scheel, 1975, pp. 148 51), each with its own activation energy.

690 C. H. D O N A L D S O N
rate depends on whether the reactions that occur at the surface of a dissolving crystal release ions faster or slower than they can be transported away from the crystal. If diffusion of ions in the melt is the dominant rate-controlling step, the dissolution rate ought to be time dependent (Berner, 1980)- specifically, the change in crystal radius should be directly proportional to the square root of time, owing to the ever-increasing thickness of 'con- taminated' boundary layer of melt. Yet it has been shown (fig. 2 and Table IV) that Ar in fact is proportional to time, not its square root. There are two ways of explaining this relationship, either (a)it is the surface reactions which limit the dissolution rate or (b) the dissolution rate is limited by steady- state transport conditions involving both diffusion and convection of melt components, specifically diffusion of components through a compositional boundary layer whose thickness remains constant with time and beyond which the melt is mixed by convection (cf. Burton and Slichter, 1958; Kirk- patrick, 1975, 1980): it is the convection that prevents the boundary layer thickening. Situation (a) would result in the virtual absence of composi- tion gradients in the melt adjacent to a dissolving crystal, whereas in (b) gradients would exist and their thickness would be approximately constant with time.
Fig. 6 illustrates the results of electron microprobe analyses of the glass adjacent to partially dissolved quartz, oligoclase, and olivine crystals. All three exhibit compositional gradients. (Compare the results of Watson (1982) on quartz and feldspar dissolution in basalt, but contrast Thornber and Huebner (1982) who found gradients that indicated growth of olivine during quenching.) For example, in fig. 6a the melt is enriched in SiO 2 at the crystal- liquid interface and correspondingly depleted in the other oxides [except K20 which preferentially migrates from the basalt to the contaminated, interfacial melt, cf. Sato (1974) and Watson (1982)]. The 'characteristic thickness', 6, of each gradient, i.e. the distance in which the excess or deficiency of concentration falls or rises to 1/e of its original value (Chalmers, 1964, p. 133) is c.10 #m in the quartz example, 100 pm in oligoclase and 75/~m in the olivine* (fig. 6). The actual lengths of the gradients are approximately 100, 400, and 400/~m, respectively. Electron probe traverses have been
* There must, for a time, exist a transient condition as the layer of contaminated melt thickens from zero to its steady-state value. During this time dissolution rate will steadily decrease because ions have to diffuse through a growing thickness of melt and because undersaturation at the crystal-liquid interface is steadily reduced. The available d~ta, however, suggest that this transient condi- tion is very short lived, certainly less than half an hour.
obtained for only a small proportion of the total number of runs, however, these reveal no significant differences in either the characteristic thickness or the actual thickness of the concentration gradients with run duration.
It is concluded that in all these experiments transport of ions to and from the crystal-liquid interface is the rate-controlling step; furthermore, the transport takes the form of diffusion through a boundary layer which has a characteristic thick- ness of the order of 10-100 pm and beyond which some convection occurs. This inference of steady state, mixed-transport control of dissolution rate is in accord with investigations of olivine, quartz, and pyroxene dissolution in the system CaMgSi20 6- Mg/SiO4-SiO2 (Kuo and Kirkpatrick, 1983).
That the convection occurs is surprising and its cause a matter for conjecture. Application of the equation for the thermal Rayleigh number indicates that thermal convection of the bulk melt (e.g. Burton and Slichter, 1958) would not occur unless an impossibly large thermal gradient existed in the experimental charges. Alternatives include convec- tion set up by surface tension variations around the surface of the charge (cf. Tritton, 1977, pp. 204-6), compositional convection caused by flow of rela- tively light or heavy fluid produced at the crystal- liquid interface (Carruthers, 1976; Huppert and Sparks, 1984), possibly with convective instability of the boundary layer (cf. Turner, 1973, p. 243), and, lastly, random motion of crystals dragging boundary layer melt through the bulk melt. The true nature of the motion must await experiments designed to reveal the three-dimensional form of the boundary layer adjacent to a dissolving crystal.
The enrichment of the interracial melt in olivine components adjacent to olivine (fig. 6c) is trivial by comparison with the large enrichment in SiO 2 adjacent to quartz (fig. 6a); despite the large MgO content of the olivine (c.50 wt. %) the basaltic melt is enriched by only 1-1.5 % in MgO at the interface. Coupled with the relatively large values of - A H for olivine dissolution (last section) this suggests that, although transport of components in the melt is the dominant process controlling olivine dissolu- tion rate, the release of ions from the crystal is not a great deal faster. Application of the Roeder and Emslie (1970) olivine-liquid distribution coefficient
ol . l iq XF�9 X M g O
KD - - y l i q . y o l ~XFeO ~XMgO
to the olivine and the interfacial melt gives values of 0.12-0.20, as opposed to the equilibrium value of 0.30. Clearly the interfacial melt is grossly depleted in MgO for surface equilibrium to pertain. Curiously, despite the olivine in fig. 6c con- taining less FeO than the basalt, there is a slight

D I S S O L U T I O N IN B A S A L T M E L T 691
,% /%
-Si
6 0 -
5o~, 20-
1 6 -
AI -+-!
Si
-AI
f x 14 o 10 x
o ,- Fe ._m Ca
,.- 10 Fe �9 ._m ~ . Mg ~ Ca 6
Mg 6 Na
_Na 2 2 K K
0 . . . . 5'0 . . . . 1 (~0 0 ' 2(50 " 4 6 0 ' 6 6 0
IJm from crys ta l lure f rom c r y s t a l
"o ,m X o
.Z
52~ 48"
14
10
6
(0.6)
(0.4) 2
o
Si
-AI
Fe
Ca -Mg
-K
Na
160 260
lum from crysta l
FIG. 6. Three examples of the variation in melt (quenched glass) composition adjacent to dissolving crystals. (a) quartz G, run 290. (b) oligoclase, run 289. (c) olivine Ig, run 267. (Note the breaks in vertical scales; in (c) the numbers in brackets refer to potassium.) The approximate major-element composition of the oligoclase is 62 wt. ~ SIO2, 22 AIzO3, 6 CaO,
7 Na20, 0.6 K20; that of olivine Ig is 40.5 SiO z, 50 MgO, 8 FeO.

692 C. H. D O N A L D S O N
enrichment in FeO of melt at the interface. This is not understood.
Conclusions
The measured rates of dissolution of olivine, plagioclase, and quartz in basaltic magma differ substantially, raising the possibility that the melt fraction of a magma dissolving megacrysts (whether cognate or truly foreign to the magma) may undergo selective contamination by preferential dissolution of one mineral over another. The results suggest that the melt fraction would enrich in felsic components over mafic ones, assuming all the crystals were of the same size.
The olivine dissolution rates decrease rapidly with falling temperature; close to the liquidus temperature of the basalt olivine dissolves at only 9-14 #m/h. Thus a large olivine Ig phenocryst of 5 mm diameter would require 12 days to dissolve at 1210 ~ . Depending on the rate of ascent and the quantity of olivine phenocrysts in suspension, a basalt moving upwards through the crust could well become both absolutely superheated and increasingly superheated, as the liquidus tempera- ture fell, and yet erupt at the surface or enter a sub- volcanic environment with phenocrysts. Perhaps this is why olivine phenocrysts in basalts and olivine primocrysts in some cumulates often have somewhat rounded outlines.
Plagioclase dissolution rates at small degrees of undersaturation seem rapid by comparison with magmatic crystal growth rates at small degrees of supersaturation. For example, the dissolution rate of plagioclase within a few degrees of the plagio- clase liquidus temperature of the basalt (1187 ~ is c.60 #m/h (extrapolation of data in Table V), whereas Kirkpatrick (1977) estimated the half growth rate of plagioclase in two Hawaiian lava lakes to be approximately three orders of magni- tude slower (up to 4• 10 -2 #m/h) at probable small degrees of supercooling. This means that a 10 mm crystal of plagioclase that grew in a lava lake in c.14 years, would dissolve in a few days. Thus, even very modest degrees of superheat result in rapid contamination of the melt. This point is re- inforced by data of Sato et al. (1981) who have measured the growth rates of plagioclase in an aluminous basalt. Extrapolation of their data to a few degrees of supercooling gives a growth rate of 0.35 #m/h, approximately 170 times slower than dissolution at very small superheating. Even at a superheating of 80 ~ the dissolution rate is 3-5 times faster than the growth rate of 35 #m Hr measured by Sato et al. at 80 ~ supercooling.
By contrast, Donaldson (1975) computed growth rates for magnesian olivine in an oceanic tholeiite of
7-20 #m/h. These crystals grew at an unknown value of supercooling but in view of their hopper shapes it was probably several tens of degrees centi- grade. Thus olivine growth and dissolution rates seem to be rather similar in magnitude.
Magma does not have to be absolutely super- heated in order to dissolve a mineral, only under- saturated with respect to the mineral concerned. Thus, a tholeiitic basalt that acquires a 10 mm diameter crystal of oligoclase at 1150 ~ would dissolve it in c.35 days, geologically a trivial amount of time. (See the descriptions of the composite basalt-rhyolite lava/dome at Gardiner River, Wyoming by Wilcox (1944) and of contaminated lavas in the San Juan Mountains of Colorado (Larsen and Irving, 1938) and in the Lassen Volcanic National Park, California (Finch and Anderson, 1930) for classic instances of this situation.)
The most important finding of the study is that, even in the small sample volumes used, dissolution rate is not time dependent. Thermal convection and compositional convection are both very likely to occur in bodies of basaltic magma (Sparks et al., 1984) and so here too there should be no slowing down of dissolution due to an ever-thickening layer of contaminated melt about a dissolving crystal. Depending on the vigour of such convection, the dissolution rates could be faster than those deter- mined in the present study. It will be interesting to examine what happens in more viscous rock melts, in which convection is likely to be much slower. Preliminary results obtained by the author on a melt of 58 ~ SiO z suggest that convection may not occur in intermediate composition melts in the beads of melt used in this experimental technique.
A final petrological implication concerns the rate of contamination of the melt fraction of a magma (i.e. weight of dissolved material entering melt per unit time). Whether the dissolution is determined by pure diffusion control or by mixed-transport control, the rate of contamination must decrease with time (assuming that the number of dissolving crystals remains constant). [For example, a plagio- clase of 1 mm radius dissolving at 100 #m/h releases 29 mg/h of matter, whereas a crystal of half that radius dissolving at the same rate releases 6.6 mg/h]. However, the rate of decrease in contamina- tion rate will be smaller for the mixed transport situation and, furthermore, the dissolved material will be more rapidly distributed throughout the melt.
Acknowledgements. I thank P. G. Hill for assistance with the electron probe analyses and both G. M. Biggar and I. M. Young for comments on the manuscript. This work is supported by NERC grant GR3/4717. I am indebted to

D I S S O L U T I O N IN BASALT M E L T 693
the Nuffield Foundation for a Science Research Fellow- ship, 1983-4, during which this work was done.
R E F E R E N C E S
Berner, R. A. (1980) Kinetics of Weathering and Dia- genesis. In Kinetics of Geochemical Processes (A. C. Lasaga and R. J. Kirkpatrick, eds.), 111 34. Mineral. Soc. Am.
Bond, W. L. (1951) Rev. Sci. Instrum, 22, 344-5. Bowen, N. L. (1913) Am. J. Sci. 35, 577-99. - - a n d Schairer, J. F. (1935) Am. d. Sci. 26, 151-217. Burton, J. A., and Slichter, W. P. (1958) The distribution
of solute elements: steady-state growth. In Transistor Technolooy, 1 (H. E. Bridgers, ed.), 71-106. Van Nostrand, New York.
Carruthers, J. A. (1976) J. Crystal Growth, 32, 13 26. Chalmers, B. (1964) Principles of Solidification. 319 pp.
Wiley and Sons, New York. Donaldson, C. H. (1975) Lithos, g, 163-74. - - ( 1 9 7 9 a ) Contrib. Mineral. Petrol. 69, 21-32. - - ( 1 9 7 9 b ) Mineral. Ma 9. 43, 115 19. - - W i l l i a m s , R. J., and Lofgren, G. E. (1975) Am.
Mineral. 60, 324-6. Dowty, E. (1980) Crystal Growth and Nucleation Theory
and the Numerical Simulation of Igneous Crystalliza- tion. In Physics of Magmatic Processes (R. B. Hargraves, ed.), 419-85. Princeton Univ. Press.
Elwell, D., and Scheel, H. J. (1975) Crystal Growth from High-Temperature Solutions. Academic Press.
Finch, R. H., and Anderson, C. A. (1930) Univ. Calif. Dept. Geol. Sci. Bull. 19, 245-73.
Harrison, T. M., and Watson, E. B. (1983) Contrib. Mineral. Petrol. 84, 66 72.
Henderson, P. (1982) Inorganic Geochemistry. 353 pp. Pergamon Press, Oxford.
Hofman, A. W. (1980) Diffusion in natural silicate melt: a critical review. In Physics of Magmatic Processes (R. B. Hargraves, ed.), 385 417. Princeton Univ. Press.
Huppert, H. E., and Sparks, R. S. J. (1984) Ann. Rev. Earth Planet. Sci. 12, 11-37.
Kirkpatrick, R. J. (1975) Am. Mineral. 60, 798 814. - - ( 1 9 7 7 ) Bull. Geol. Soc. Am. 88, 78 84. --(1980) Kinetics of Crystallization of Igneous Rocks.
In Kinetics of Geochemical Processes (A. C. Lasaga and R. J. Kirkpatrick, eds.), 321-95. Mineral. Soc. Am.
Kuo, L-C., and Kirkpatrick, R. J. (1983) EOS (Trans. Am. Geophys. Union), 64, 349.
Kutolin, V. A., and Agafanov, L. V. (i978) Geol. Geofiz. (Acad. Nauk USSR, Novosibirsk), 5, 3-13.
Lacroix, A. (1893) Les Enclaves des Roches Volcaniques. Masson, Paris.
Larsen, E. S., and Irving, J. (1938) Am. Mineral. 23, 227-57.
Lofgren, G. E. (1983) J. Petrol. 24, 229-55. Moorbath, S., Thompson, R. N., and Oxburgh, E. R.
(1984) Phil. Trans. R. Soc. A310, 437-780. Roeder, P. L., and Emslie, R. F. (1970) Contrib. Mineral.
Petrol. 29, 275-89. Sato, H. (1974) Ibid. 50, 49-64. Sato, K., Kahima, K., and Sunagawa, I. (1981) J. Jap.
Assoc. Petrols. Econ. Geols. 76, 294 307. Sato, M. (1978) Geophys. Res. Letts. 5, 447-9. Scarfe, C. M., Takahashi, E., and Yoder, H. S. (1980)
Carnegie Inst. Wash. Yearb. 79, 290-6. Shaw, H. R. (1969) J. Petrol. 10, 510-35. - - ( 1 9 7 2 ) Am. J. Sci. 272, 870-93. Sparks, R. S. J., Huppert, H. E., and Turner, J. S. (1984)
Phil. Trans. R. Soc. A310, 511-34. Thornber, C. R., and Huebner, J. S. (1982). EOS (Trans.
Am. Geophys. Union), 63, 452-3. Tritton, D. J. (1977) Physical Fluid Dynamics. 362 pp. Van
Nostrand, New York. Turner, J. S. (1973) Buoyancy Effects in Fluids. 367 pp.
Cambridge Univ. Press. Watson, E. B. (1982) Contrib. Mineral. Petrol. 80, 73-
87. Wilcox, R. E. (1944) Bull. Geol. Soc. Amer. 55, 1047-80.
[Manuscript received 2 November 1984; revised 24 December 1984]