
ASSESSMENT OF OPECTitle: ASSESSMENT OF OPEC Subject: ASSESSMENT OF OPEC Keywords

Energy Policy ∎ (∎∎∎∎) ∎∎∎–∎∎∎
Contents lists available at ScienceDirect
Energy Policy
0301-42http://d
n CorrE-m
nayouse
Pleasorg/1
journal homepage: www.elsevier.com/locate/enpol
The rapid growth of OPEC′s domestic oil consumption
Dermot Gately a,n, Nourah Al-Yousef b, Hamad M.H. Al-Sheikh c
a Economics Department, New York University, 19 West 4 Street, New York, NY 10012, USAb Economics Department, King Saud University, P.O. Box 85064, Riyadh 11691, Saudi Arabiac Economics Department, King Saud University, P.O. Box 2454, Riyadh 11451, Saudi Arabia
H I G H L I G H T S
� We analyze rapid growth of OPEC oil consumption (sevenfold since 1971: 5.1% annually).
� Panel co-integration econometric estimate of income elasticity about 1.0.� Consensus projections (IEA, DOE/EIA) have consistently under projected OPEC consumption.� Future oil market implications if OPEC consumption grows as fast as income (as in past).a r t i c l e i n f o
Article history:Received 24 March 2013Accepted 6 July 2013
Keywords:OPEC oil consumptionIncome elasticityIEA DOE/EIA BP projections
15/$ - see front matter & 2013 Published by Ex.doi.org/10.1016/j.enpol.2013.07.044
esponding author. Tel.: +1 212 998 8900; fax:ail addresses: [email protected] (D. [email protected] (N. Al-Yousef), [email protected]
e cite this article as: Gately, D., et al0.1016/j.enpol.2013.07.044i
a b s t r a c t
OPEC′s domestic oil consumption has increased seven-fold in 40 years, to 8.5 million barrels per day(mbd). They consume almost as much oil as China. This constitutes one-fourth of their production. Suchrapid growth in consumption (5.1% annually, faster than their income growth of 3.1%) will challengeOPEC′s ability to increase their oil exports, which are relied upon in long-term world oil projections bythe International Energy Agency (IEA), US Department of Energy (DOE/EIA) and British Petroleum (BP).However, these institutions assume unprecedented slowdowns in OPEC oil consumption – to less than2% in the future – allowing them to project increases in OPEC oil exports with only modest increases inproduction. We analyze 1971–2010 data econometrically, with panel co-integration methods. Weestimate that the income elasticity of consumption is about 1 for energy and oil. This means thatOPEC′s energy and oil consumption will grow as rapidly as their income. Hence, continued high growthrates for domestic oil consumption are more likely than the unprecedented slowdowns projected by IEA,DOE/EIA and BP – adding an extra 6 mbd of OPEC consumption in 2030. This will have major implicationsfor OPEC production and export levels, and for world oil prices.
& 2013 Published by Elsevier Ltd.
1. Introduction
This paper analyzes the rapid increase in OPEC′s domestic oilconsumption, from 1.2 in 1971 to 8.5 in 2010, in million barrels per day(mbd). Demand grew an average of 5.1% annually, much faster thanthe 3.1% rate of income growth. We also analyze the Middle Eastregion, which has substantial overlap with OPEC, in order to analyzeprojections that are made for this region – but not for OPEC – by IEA,DOE/EIA and others. The countries and groups are as follows:
Total OPEC:
Middle East OPEC: Saudi Arabia, Iran, Iraq, Kuwait, UAE, Qatar;Other OPEC: Venezuela, Ecuador, Algeria, Libya, Angola, Nigeria.
lsevier Ltd.
+1 212 995 3932.ly),.sa (H.M.H. Al-Sheikh).
., The rapid growth of OPEC
Middle East:
Middle East OPEC: Saudi Arabia, Iran, Iraq, Kuwait, UAE, Qatar;Other Middle East (Non-OPEC): Bahrain, Oman, Yemen, Syria,Lebanon, Israel, Jordan.
We analyze the demand for total oil as well as for three groupsof oil products: Transport Oil (gasoline, jet fuel, and light fuel oilincluding diesel oil); Residual Fuel Oil; and Other Oil (LPG,naphtha, and all other oil products). In addition, we analyze thedemand for natural gas and for total energy.
The outline of this paper is as follows. Section 2 summarizesthe 1971–2010 historical relationship between oil demand andincome, as well as for energy and natural gas, for the OPECcountries and the Middle East. We also summarize the oil demandprojections to 2030 for the Middle East that are made regularly byIEA, DOE/EIA, and other institutions. Section 3 summarizes theprevious literature on oil demand, especially within the Middle
′s domestic oil consumption. Energy Policy (2013), http://dx.doi.

1971 1976 1981 1986 1991 1996 2001 20060
1
2
3
4
5
6
7
8
9
mbd
0
1
2
3
4
5
6
7
8
9
Saudi Arabia
Iran
OtherOPEC
OtherMidEast OPEC
1971 1976 1981 1986 1991 1996 2001 20060
1
2
3
trill
ions
real
PPP
$ p
er y
ear
trill
ions
real
PPP
$ p
er y
ear
0
1
2
3Real Income:Total OPEC1971-2010
Oil Consumption:Total OPEC1971-2010
1971 1976 1981 1986 1991 1996 2001 20060
1
2
3
4
5
6
7
mbd
0
1
2
3
4
5
6
7
1971 1976 1981 1986 1991 1996 2001 20060
1
2
0
1
2
Real Income:Middle East1971-2008
Oil Consumption:Middle East1971-2008
Saudi Arabia
Saudi Arabia
Saudi Arabia
OtherMidEast OPEC
OtherMidEast OPEC
OtherMidEast OPEC
Iran
IranIran
OtherOPEC
OtherMidEast Other
MidEast
Fig.1. Oil Consumption and Real Income for Total OPEC and for Middle East, 1971–2010.Data Sources: See Appendix A.
D. Gately et al. / Energy Policy ∎ (∎∎∎∎) ∎∎∎–∎∎∎2
East. The econometric analysis in Section 4 utilizes panel co-integration methods, for each of the fuels separately. In Section 5we compare our projections of oil demand with those of IEA andDOE/EIA, and in Section 6 we summarize our conclusions. Datasources are listed in Appendix A.
1 Exxon-Mobil (2010) projects that Middle East energy demand will grow only2% annually to 2030. This is much slower than the 5.8% annual growth of the past40 years.
2. Background
Domestic oil consumption within OPEC has grown rapidly inthe past four decades and is now about 10% of total world oilconsumption. This is almost as large as the share of China. In per-capita terms, OPEC′s oil consumption has grown rapidly, and istwice the average of other developing countries; but it is still onlyone-third the level of the OECD countries However, if Nigeria werenot included with OPEC, then per-capita levels in OPEC would becomparable to those in the OECD (although the OECD uses muchmore non-oil energy).
Fig. 1 summarizes Total Oil Consumption and Real Income forOPEC and the Middle East. Middle East OPEC comprises about 80%of oil consumption for both OPEC and the Middle East, and morethan two-thirds of income. Saudi Arabia plus Iran represent morethan half of oil consumption and income, for both OPEC and theMiddle East.
Table 1 summarizes the 1971–2010 levels and growth rates forincome and the consumption of oil, natural gas, and energy. SeeAppendix A for the sources of data and description of all variablesthat we used. For all these groups of countries, consumption ofboth energy and natural gas has grown faster than income since1971. Consumption of oil has grown faster than income for allcountry groupings except Other Middle East, where it has grownabout as fast as income.
Please cite this article as: Gately, D., et al., The rapid growth of OPECorg/10.1016/j.enpol.2013.07.044i
However, the IEA, DOE/EIA, and BP all project that Middle East oilconsumption – and, by implication, OPEC consumption – in the nexttwo decades will grow only half as fast as income. Moreover, theyproject that energy and natural gas consumption will also growmoreslowly than income; only BP projects natural gas growing as fast asincome.1 OPEC (2010) projects that their own oil consumption willgrow 1.7% annually, which is one-third their rate of the past 40 yearsand less than half their projected rate of income growth.
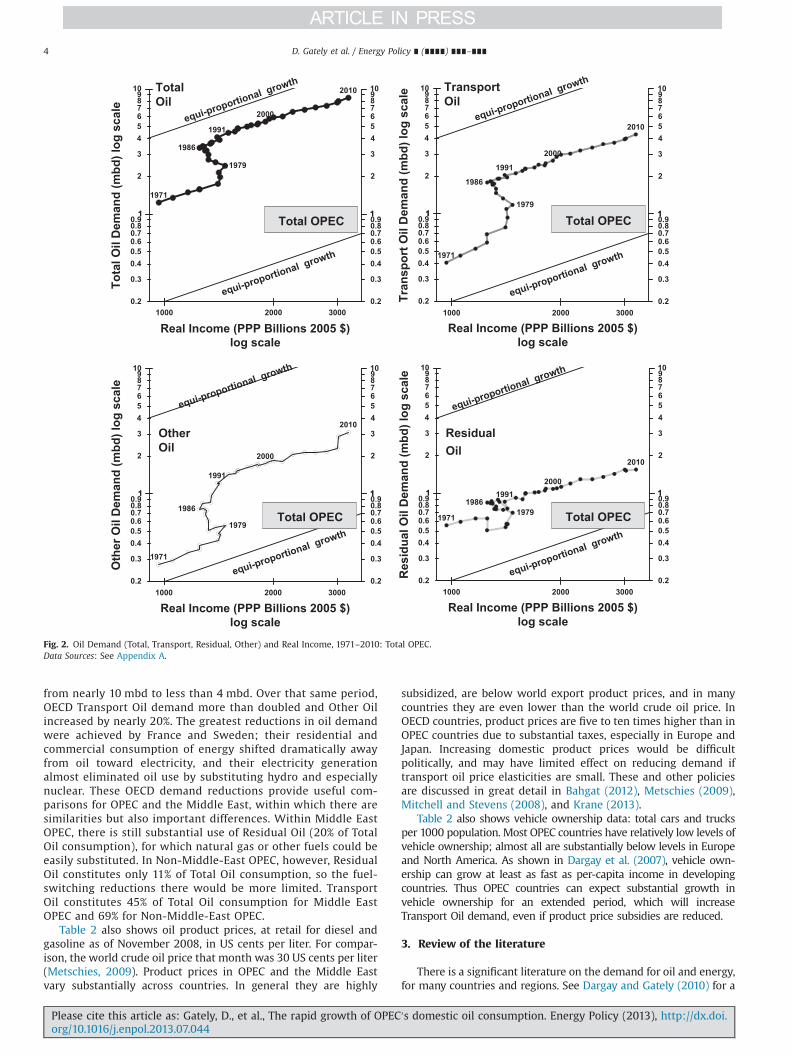
Fig. 2 graphs Total OPEC′s oil consumption and real income, 1971–2010, for total oil and its three component products: transport oil,residual oil, and other oil. Residual Oil (heavy fuel oil) was a significantpart of Total Oil consumption in the early 1970s, but its consumptionhas not increased much since then. It is used primarily in electricitygeneration, and it can be replaced by natural gas in some OPECcountries. In contrast, Transport Oil (gasoline, jet fuel, and light fuel oilincluding diesel oil) has grown faster than income for forty years, ashas Other Oil (LPG, naphtha, and all other oil products). The axes inFig. 2 are logarithmic; the diagonal lines indicate equi-proportionalgrowth of oil consumption and income. Movement parallel to theselines indicates that oil consumption is growing as rapidly as income(income elasticity¼1); steeper/less steep movement indicates incomeelasticity greater than/less than 1. In the upper-left graph of Fig. 2, wesee the following changes in Total Oil demand:
�
′s d
1971–75: Total Oil grows as fast as income;
� 1975–86: Total Oil increases despite stagnant or decliningincome;
� 1986–2010: Total Oil grows as fast as income.omestic oil consumption. Energy Policy (2013), http://dx.doi.

Table 1Levels and growth rates of income and consumption of oil, gas, and energy in 1971–2010, with projections to 2030.Data Sources: See Appendix A.
History, 1971–2010 Projections to 2030
Average annual % growth IEA DOE/EIA BP OPECOutlook
1971 level 2010 level 1971–2010 1971–1975 1975–1986 1986–2010 New Policiesscenario
Ref. Casescenario
Total OPEC: Middle East OPEC+Other OPECTotal oil (mbd) 1.2 8.5 5.10% 6.40% 7.10% 3.90% 1.70%
Transport oil (mbd) 0.4 4.3 6.20% 14.00% 9.00% 3.80%Other oil (mbd) 0.3 3.1 6.40% 9.10% 6.30% 6.10%Residual oil (mbd) 0.6 1.6 2.70% �2.20% 4.70% 2.60%
Natural gas (mbdoe) 0.4 6.8 7.40% 7.70% 10.40% 5.90% 4.40%Real income (B 2005$ PPP) 967 3223 3.10% 6.60% 0.00% 4.00% 3.50%Ratio: % gr. Total Oil/% gr. Income 1.62 0.96 499 0.97 0.47
Middle East OPEC: Saudi Arabia, Iran, Iraq, Kuwait, Qatar, UAETotal oil (mbd) 0.8 6.5 5.40% 5.70% 8.00% 4.20%
Transport oil (mbd) 0.2 2.9 6.90% 14.20% 11.30% 3.80%Other oil (mbd) 0.2 2.7 7.70% 12.50% 6.70% 7.30%Residual oil (mbd) 0.5 1.3 2.70% �2.20% 4.80% 2.70%
Natural gas (mbdoe) 0.2 5.5 8.80% 9.20% 11.90% 7.30%Real income (B 2005$ PPP) 585 2122 3.40% 8.20% �0.70% 4.50%Ratio: % gr. Total oil/% gr. Income 1.61 0.69 �12 0.95
Other OPEC: Venezuela, Ecuador, Algeria, Nigeria, Angola, LibyaTotal oil (mbd) 0.4 2 4.20% 7.80% 5.40% 3.00%Transport oil (mbd) 0.2 1.4 5.20% 13.70% 5.60% 3.70%Other oil (mbd) 0.1 0.4 3.10% 4.30% 5.50% 1.80%Residual Oil (mbd) 0.1 0.2 2.20% �2.40% 4.60% 2.00%
Natural gas (mbdoe) 0.2 1.3 4.70% 6.10% 8.60% 2.70%Real income (B 2005$ PPP) 382 1101 2.80% 4.20% 1.10% 3.30%Ratio: % gr. Total oil/% gr. Income 1.52 1.86 4.8 0.92
Total Middle East: Middle East OPEC+Other Middle EastTotal oil (mbd) 1.1 7.7 5.10% 5.30% 7.20% 4.00% 1.40% 1.70% 1.80%
Transport oil (mbd) 0.3 3.7 6.60% 13.20% 10.00% 3.80%Other oil (mbd) 0.2 2.9 6.40% 10.70% 6.20% 5.80%Residual oil (mbd) 0.6 1.8 2.80% �2.10% 4.50% 2.90%
Natural gas (mbdoe) 0.3 6.6 8.10% 10.10% 10.00% 7.00% 2.50% 2.70% 3.90%Real income (B 2005$ PPP) 703 2660 3.40% 8.00% �0.04% 4.40% 3.90% 3.80% 3.90%Ratio: % gr. Total oil/% gr. Income 1.49 0.66 �187.5 0.92 0.36 0.45 0.46
Other Middle East: Bahrain, Israel, Jordan, Lebanon, Oman, Syria, YemenTotal oil (mbd) 0.3 1.2 3.80% 4.10% 4.60% 3.40%
Transport oil (mbd) 0.1 0.7 5.40% 10.70% 5.70% 4.40%Other oil (mbd) 0 0.2 3.40% 4.40% 3.50% 3.10%Residual oil (mbd) 0.1 0.5 3.40% �1.70% 3.60% 4.10%
Natural gas (mbdoe) 0.1 1.1 6.20% 11.70% 5.70% 5.50%Real income (B 2005$ PPP) 118 538 4.00% 7.40% 2.70% 4.00%Ratio: % gr. Total oil/% gr. Income 0.96 0.56 1.68 0.85
D. Gately et al. / Energy Policy ∎ (∎∎∎∎) ∎∎∎–∎∎∎ 3
The growth of Transport Oil and Other Oil has been similar to
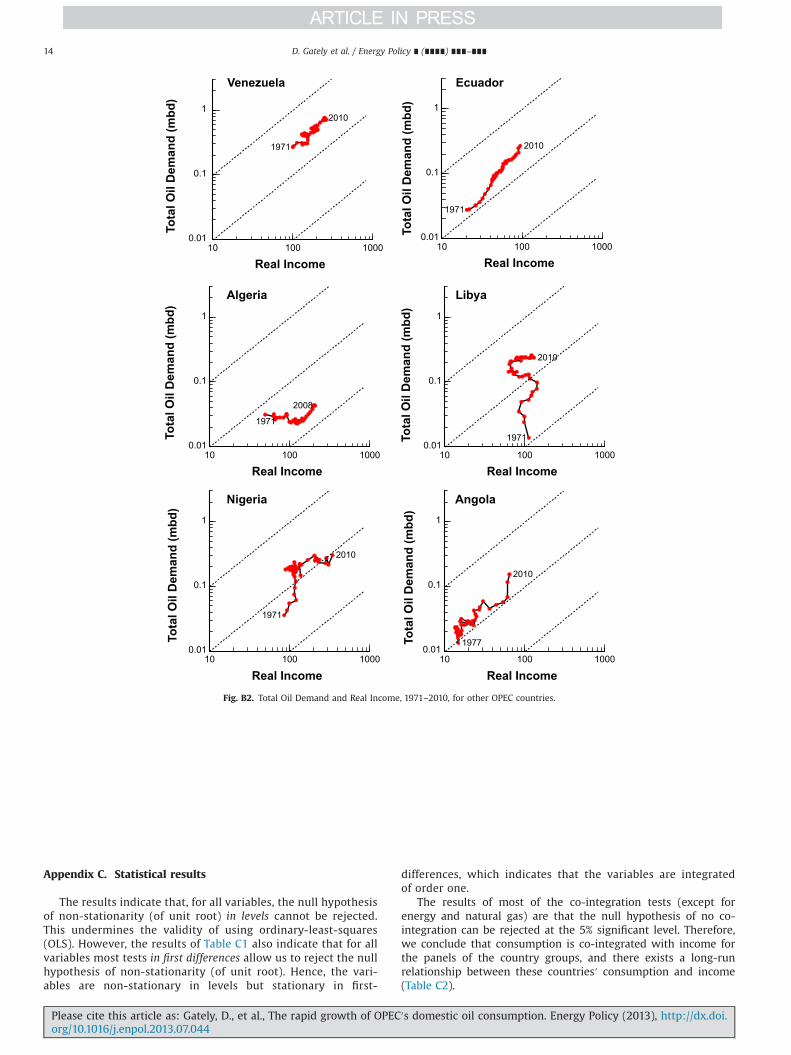
that of Total Oil: increasing as fast as income when income wasincreasing in 1971–75 and 1986–2010 (moving parallel to thediagonal lines), and increasing even when income was stagnant ordeclining in 1975–86. Only Residual Oil has grown more slowlythan income (movement less steep than the diagonal lines).Similar graphs to Fig. 2 for the individual members are shownin Appendix B. These are generally similar to the aggregate OPECgraph, except for countries with disruptions, such as Iraq andKuwait, or countries with stagnant or uneven economic growth,such as Libya and Nigeria.
Similar graphs of Total Oil consumption versus Income areplotted in Fig. 3 for each of the three main groups of countries:Total OPEC, Middle East, and Middle East OPEC. Their paths are allsimilar, which is not surprising because Middle East OPEC com-prises such a large fraction of income and oil consumption for bothTotal OPEC and the Middle East. Since 1986, oil consumption hasgrown about as rapidly as income; movement is roughly parallel tothe diagonal, equi-proportional growth lines.
We plot in Fig. 4 similar graphs for Total Energy, Total Oil,and Natural Gas consumption versus Income, for 1986–2010.
Please cite this article as: Gately, D., et al., The rapid growth of OPECorg/10.1016/j.enpol.2013.07.044i
For all three country groups, energy consumption has grownslightly faster than income: movement has been slightly steeperthan the diagonal lines. Oil consumption has grown about asfast as income (parallel to the diagonals), and natural gas hasgrown much faster than income (much steeper than thediagonals).
Table 2 shows data for individual countries in OPEC, the MiddleEast and in the OECD: oil consumption levels in 1971 and 2010, oilshare of energy consumption, oil product prices for diesel and gasolinein 2008, and vehicle ownership levels in 2010. These data will help toinform three aspects of the discussion about OPEC and the MiddleEast: (1) the prospects for oil demand reduction, in comparison withOECD oil demand reductions since 1971; (2) the role of oil productprices; and (3) the likely growth of vehicle ownership.
Oil demand reductions achieved by the OECD countries wereprimarily due to fuel-switching in electricity generation (awayfrom Residual Oil to natural gas, coal, hydro and nuclear) and inresidential and commercial heating (to natural gas and elec-tricity, away from “Other Oil”). Efficiency improvements playeda much smaller role. See Dargay and Gately (2010). Between1971 and 2010, OECD demand for Residual Oil fell by two-thirds,
′s domestic oil consumption. Energy Policy (2013), http://dx.doi.
Real Income (PPP Billions 2005 $)log scale
Tota
l Oil
Dem
and
(mbd
) log
sca
le
Real Income (PPP Billions 2005 $)log scale
Tran
spor
t Oil
Dem
and
(mbd
) log
sca
le
Real Income (PPP Billions 2005 $)log scale
Oth
er O
il D
eman
d (m
bd) l
og s
cale
Real Income (PPP Billions 2005 $)log scale
Res
idua
l Oil
Dem
and
(mbd
) log
sca
le
TotalOil
TransportOil
OtherOil
ResidualOil
Total OPEC Total OPEC
Total OPEC Total OPEC
Fig. 2. Oil Demand (Total, Transport, Residual, Other) and Real Income, 1971–2010: Total OPEC.Data Sources: See Appendix A.
D. Gately et al. / Energy Policy ∎ (∎∎∎∎) ∎∎∎–∎∎∎4
from nearly 10 mbd to less than 4 mbd. Over that same period,OECD Transport Oil demand more than doubled and Other Oilincreased by nearly 20%. The greatest reductions in oil demandwere achieved by France and Sweden; their residential andcommercial consumption of energy shifted dramatically awayfrom oil toward electricity, and their electricity generationalmost eliminated oil use by substituting hydro and especiallynuclear. These OECD demand reductions provide useful com-parisons for OPEC and the Middle East, within which there aresimilarities but also important differences. Within Middle EastOPEC, there is still substantial use of Residual Oil (20% of TotalOil consumption), for which natural gas or other fuels could beeasily substituted. In Non-Middle-East OPEC, however, ResidualOil constitutes only 11% of Total Oil consumption, so the fuel-switching reductions there would be more limited. TransportOil constitutes 45% of Total Oil consumption for Middle EastOPEC and 69% for Non-Middle-East OPEC.
Table 2 also shows oil product prices, at retail for diesel andgasoline as of November 2008, in US cents per liter. For compar-ison, the world crude oil price that month was 30 US cents per liter(Metschies, 2009). Product prices in OPEC and the Middle Eastvary substantially across countries. In general they are highly
Please cite this article as: Gately, D., et al., The rapid growth of OPECorg/10.1016/j.enpol.2013.07.044i
subsidized, are below world export product prices, and in manycountries they are even lower than the world crude oil price. InOECD countries, product prices are five to ten times higher than inOPEC countries due to substantial taxes, especially in Europe andJapan. Increasing domestic product prices would be difficultpolitically, and may have limited effect on reducing demand iftransport oil price elasticities are small. These and other policiesare discussed in great detail in Bahgat (2012), Metschies (2009),Mitchell and Stevens (2008), and Krane (2013).
Table 2 also shows vehicle ownership data: total cars and trucksper 1000 population. Most OPEC countries have relatively low levels ofvehicle ownership; almost all are substantially below levels in Europeand North America. As shown in Dargay et al. (2007), vehicle own-ership can grow at least as fast as per-capita income in developingcountries. Thus OPEC countries can expect substantial growth invehicle ownership for an extended period, which will increaseTransport Oil demand, even if product price subsidies are reduced.
3. Review of the literature
There is a significant literature on the demand for oil and energy,for many countries and regions. See Dargay and Gately (2010) for a
′s domestic oil consumption. Energy Policy (2013), http://dx.doi.

500
600
700
800
90010
0020
0030
0040
00
Real Income (PPP billions 2005 $)
0.80.9
11
2
3
4
5
6789
10To
tal O
il D
eman
d (m
bd)
Tota
l Oil
Dem
and
(mbd
)To
tal O
il D
eman
d (m
bd)
0.80.911
2
3
4
5
678910
1971
1979
1986
1991
2000
2010
500
600
700
800
90010
0020
0030
0040
00
Real Income (PPP billions 2005 $)
0.80.9
11
2
3
4
5
6
789
10
0.80.911
2
3
4
5
6
78910
1971
1979
1986
1991
2000
2010
500
600
700
800
90010
0020
0030
0040
00
Real Income (PPP billions 2005 $)
0.80.9
11
2
3
4
5
6
789
10
0.80.911
2
3
4
5
6
78910
1971
1979
1986
1991
2000
2010
TotalOPEC
MiddleEast
Middle EastOPEC
equi-proportio
nal growth
equi-proportio
nal growth
equi-proportio
nal growth
equi-proportio
nal growth
equi-proportio
nal growth
equi-proportio
nal growth
Fig. 3. Total Oil Demand and Real Income, 1971–2010: Total OPEC, Middle East, andMiddle East OPEC.Data Sources: See Appendix A.
500
600
700
800
900
1000
2000
3000
500
600
700
800
900
1000
2000
3000
Real Income (PPP Billions 2005 $)
1
2
3
4
56789
10
20
1986
2010
1986
2010
1986
2010
500
600
700
800
900
1000
2000
3000
Real Income (PPP Billions 2005 $)
1
2
3
4
56789
10
20
Ener
gy, O
il &
Gas
Dem
and
(mbd
oe)
Ener
gy, O
il &
Gas
Dem
and
(mbd
oe)
Ener
gy, O
il &
Gas
Dem
and
(mbd
oe)
1986
2010
1986
2008
1986
2008
Real Income (PPP Billions 2005 $)
1
2
3
4
56789
10
20
1986
2010
1986
2008
1986
2008
MiddleEast
TotalOPEC
Middle EastOPEC
Energy
Energy
Energy
Gas
Gas
Gas
Oil
Oil
Oil
growthas fast as income
growthas fast as income
growthas fast as income
growthas fast as income
growthas fast as income
growthas fast as income
Fig. 4. Energy, Oil, Natural Gas and Real Income, 1986–2010: OPEC, Middle East,and Middle East OPEC.Data Sources: See Appendix A.
D. Gately et al. / Energy Policy ∎ (∎∎∎∎) ∎∎∎–∎∎∎ 5
recent example of this work, and see the surveys and extensivebibliographies by Dahl (1993, 1994, 2007). An early analysis ofenergy demand within the OPEC countries was published by Al-
Please cite this article as: Gately, D., et al., The rapid growth of OPECorg/10.1016/j.enpol.2013.07.044i
Janabi (1979). Important studies on gasoline demand werepublished for Saudi Arabia by Al-Sahlawi (1988a), for Kuwait byEltony and Al-Mutari (1995), and for Iran by Ahmadian et al.
′s domestic oil consumption. Energy Policy (2013), http://dx.doi.

Table 2Countries′ oil consumption levels, oil shares of energy consumption, product prices and vehicle ownership, for selected years: OPEC, Middle East, and OECD.Sources: Oil Consumption from IEA; Oil % Share of Energy Consumption from BP; Product Prices from Metschies (2009), Vehicle Ownership from Dargay et al. (2007).
Total oil consumption(mbd)
Transport oil consumption(mbd)
Residual oil consumption(mbd)
Oil as % ofenergy
Oil+gas as % ofenergy
Oil product prices(2008 US ¢/liter)
Vehiclesper 1000
Diesel GasolineYear 1971 2010 1971 2010 1971 2010 1971 2010 1971 2010 2008 2008 2010
Total OPEC 1.24 8.51 0.41 4.32 0.56 1.55Non-Middle-East OPEC: 0.41 2.01 0.19 1.39 0.10 0.23
Venezuela 0.27 0.75 0.11 0.46 0.07 0.09 57% 43% 93% 77% 1 2Ecuador 0.03 0.27 0.02 0.15 0.01 0.05 86% 81% 90% 84% 27 51 59Algeria 0.05 0.30 0.03 0.21 0.01 0.01 67% 38% 97% 100% 20 34Nigeria 0.04 0.30 0.02 0.25 0.01 0.01 113 59Angola 0.02 0.15 0.01 0.18 0.01 0.00 39 53Libya 0.01 0.24 0.01 0.14 0.00 0.07 12 14
Middle East OPEC: 0.83 6.49 0.22 2.93 0.46 1.32Saudi Arabia 0.31 2.71 0.04 1.10 0.25 0.26 94% 61% 100% 100% 9 16 219Iran 0.32 1.79 0.13 0.91 0.09 0.32 66% 40% 97% 99% 3 10 98UAE 0.00 0.70 0.00 0.35 0.00 0.31 10% 35% 100% 100% 62 45Qatar 0.00 0.17 0.00 0.08 0.00 0.00 9% 29% 100% 100% 16 22Iraq 0.07 0.81 0.02 0.35 0.03 0.31 1 3 41Kuwait 0.12 0.32 0.02 0.13 0.09 0.13 69% 59% 100% 100% 20 24 405
Middle East Non-OPEC 0.27 1.03 0.09 0.57 0.13 0.29Total Middle East 1.10 7.52 0.31 3.50 0.59 1.61 79% 51% 99% 98%OECD Countries, Total 36.64 46.52 12.96 26.56 9.79 3.56 50% 38% 70% 63%
Japan 4.40 4.41 0.67 1.56 2.02 0.50 74% 40% 75% 57% 130 142 685France 2.08 1.76 0.47 0.94 0.56 0.09 64% 34% 71% 50% 145 152 658Germany 2.90 2.44 0.73 1.29 0.68 0.17 46% 36% 52% 59% 156 156 474Great Britain 2.08 1.59 0.58 1.06 0.84 0.07 49% 35% 57% 76% 165 144 618Italy 1.80 1.53 0.36 0.84 0.86 0.21 74% 42% 84% 82% 163 157 719Sweden 0.55 0.32 0.10 0.18 0.23 0.05 67% 30% 67% 33% 152 138 605USA 15.80 19.18 7.78 13.43 2.30 0.68 44% 37% 78% 64% 78 56 829
D. Gately et al. / Energy Policy ∎ (∎∎∎∎) ∎∎∎–∎∎∎6
(2007),2. Multi-fuel studies (gasoline, diesel, jet fuel, total oil) weredone for Saudi Arabia by Al-Sahlawi (1997), and by Al-Faris (1997)for six oil products – gasoline, jet fuel, gasoil/diesel, LPG, kerosene,and residual fuel oil – for all the countries of the Gulf CooperationCouncil (GCC): Saudi Arabia, Kuwait, UAE, Qatar, Bahrain, and Oman.In addition, Al-Sahlawi (1988b) analyzed energy demand in the GCCcountries. Most of these analyses were partial adjustment models:demand being a linear function of income, price, and laggeddemand.
Subsequent work has utilized the newly developed statisticalmethods of panel co-integration3. Eltony (1996) analyzed gasolinedemand for the countries of the GCC. Narayan and Smyth (2007)analyzed oil demand for all the countries of the Middle East. Ourpaper, also using panel co-integration methods4, extends previouswork in several directions:
2 Several previous studies on gasoline demand in Iran are cited and discussedin Ahmadian et al. (2007).
3 Gately et al. (2012) employ both approaches – partial adjustment models andco-integration methods – in analyzing demand for oil and oil products in SaudiArabia. The two methods yield similar income-elasticity estimates.
4 Several of these co-integration studies have addressed the issue of causality –
whether income “Granger causes” energy demand, or whether energy demand “Grangercauses” income, or both. Al-Iriani (2006) and Mehrara (2007) concluded that income“Granger causes” energy demand and not the reverse, for the GCC and OPEC countriesrespectively. Our analysis of this question is consistent with theirs for energy; we alsoreach this conclusion for oil and natural gas. Reaching the opposite conclusion, however,was Lee (2005), who analyzed oil demand for a panel of 18 developing countries;however, only two of these countries were oil producers (Venezuela and Indonesia) andnone of the countries were in the Middle East. Finally, Damette and Seghir (2013), usinga panel of a dozen oil exporters over 1990–2010, found “a short-run unidirectionalcausality from energy consumption to income growth, whereas in the long-run, it is theeconomic process that determines the energy consumption trend” (p. 193).
Please cite this article as: Gately, D., et al., The rapid growth of OPECorg/10.1016/j.enpol.2013.07.044i
�
perincrlittl
′s d
we use the longest data period: 1971–2010; none of the articlescited above, for the Middle East and OPEC, utilize data beyond2002;
�
we analyze more countries: all 12 current OPEC members and7 other countries in the Middle East that are not members ofOPEC; this facilitates comparison of our projections with thoseof IEA and others who make projections for Middle East but notfor OPEC;�
we analyze the demand for multiple fuels: total oil and three oilproduct groups (transport oil, residual fuel oil, and other oil);natural gas; and total energy;�
We analyze total demand and income rather than per-capitavalues; this minimzes problems due to asymmetric response ofdemand to increases and decreases in income.5We compare many of these studies′ long-run income elasti-cities of demand, in the summary of our own elasticity estimatesbelow.
4. Econometric analysis
We want to estimate the long-run responsiveness of thedemand for oil (as well as energy and natural gas) to changes incurrent and past levels of income: the long-run “income elasticity”of demand. Demand is influenced by current and past values ofincome, capital stock, end-user prices of oil and competing fuels,
5 As shown in Gately and Huntington (2002) and Dargay and Gately (2010),-capita oil demand in the Oil Exporting Countries responds asymmetrically toeases and decreases in per-capita income: big increases when income rises bute declines when income falls.
omestic oil consumption. Energy Policy (2013), http://dx.doi.

Table 3Long-run income elasticities of demand, using panel dynamic OLS. Annual data 1971–2010 for oil, and 1971–2008 for energy and natural gas.
Oil, total Oil, transport Oil, residual Oil, other Energy, total Natural gasg
Total OPEC 0.94 0.02 1.04 0.98 1.44Non-Middle East OPEC
Venezuela 1.09 1.33 �0.24? 1.21 1.38 1.36Ecuador 1.49 1.53 0.98 1.94 1.24 2.22Nigeria 0.76 1.05 0.38? �0.31? 0.82 2.25Algeria 1.14 1.17 �0.73 1.32 1.63 2.09Angola 1.1 1.35 �1.03 1.39 0.83 2.52Libya �0.82 �0.30? �1.14? �1.85 �1.25 �1.45
Middle East OPECIran 1.04 1.23a 0.51 1.14 1.61 3.25?Iraq 0.32? 0.59? 0.15? 0.11? 0.02? �1.01
GCC: Gulf cooperation councilc, e, f
Saudi Arabia (GCC) 1.71b 1.90b 0.36? 3.29 2.36 2.59Kuwait (GCC) 0.67 �0.01?d 1.35 0.62? 0.5 0.79?UAE (GCC) 1.76 1.48 1.23 2.7 1.67 1.79Qatar (GCC) 0.95 1.08 �1.63? 0.96? 0.93 0.92
Non-OPEC Middle EastBahrain (GCC) 0.25 0.87 �3.88 0.13 1.08 1.21Oman (GCC) 0.88 1.14 0.78 1.38 1.94 2.12Yemen 0.84 0.84 0.56 1.36 0.94Syria 0.89 0.78 1.25 0.65 1.18 4.39Lebanon �0.76 �0.96 �0.42? �0.66? �0.82Israel 0.57 1.06 �0.08? 0.82 0.99 0.13?Jordan 1.27 1.22 1.56 1.05 1.49
Total Middle East 0.8 0.14 1.04 1.07 1.63
Note: ? Indicates statistically insignificant coefficient (p40.05); all other coefficients are statistically significant.a Long-run income elasticity of gasoline demand, Iran¼1.25; Ahmadian et al. (2007) using 1968-2002 data.b Long-run income elasticities of demand, Saudi Arabia: 2.0 for total oil, 1.5 for gasoline, 0.83 for diesel, 0.88 for jet fuel; Al-Sahlawi (1997) using 1971–1995 data.c Long-run income elasticity of demand for gasoline in GCC group: 0.28–0.43; Eltony (1996) using 1975–1993 data. Al-Sahlawi (1997) using 1970–1991 data, gasoline:
Saudi Arabia 0.1, Kuwait 1.2, UAE 1.0, Qatar 0.1, Bahrain 1.2, Oman 1.1.d Long-run income elasticity of gasoline demand, Kuwait¼0.48; Eltony and Al-Mutari (1995) using 1970–1989 data.e Long-run income elasticity of residual oil demand: Saudi Arabia 0.24, UAE 3.83, Bahrain 1.91; Al-Sahlawi (1997) using 1970–1991 data.f Long-run income elasticity of demand for total energy in GCC group: 2.0; Al-Sahlawi (1997) using 1980–1983 data.g If a country uses no natural gas, no elasticity is shown.
7 Pedroni (1999) introduced seven test statistics, three of which are between-dimension tests and four are within-dimension tests; Pedroni (2004) enhances thelatter tests. The between-dimension statistics are group mean panel co-integrationstatistics, based on estimators that average the individually estimated coefficientsfor each cross-sectional unit. The within-dimension statistics are panel co-integration statistics and are based on estimators that pool the autoregressivecoefficients across different cross-sectional units for the stationarity tests on theestimated residuals; namely, these seven tests are panel v, ρ and non-parametricand parametric t statistics, group ρ and non-parametric and parametric t statistics.
8 Pedroni (2000) proposed fully modified ordinary least squares (FM-OLS) toestimate the coefficients of co-integrating vectors that are detected by panel co-integration tests. This method permits the existence of heterogeneity between
D. Gately et al. / Energy Policy ∎ (∎∎∎∎) ∎∎∎–∎∎∎ 7
and technology. Unfortunately, we do not have sufficient data overtime and across countries for capital stock or technology, nor dowe have end-user prices (although we do analyze below the effectof crude oil prices). Hence we focus on the relationship betweendemand and income; we estimate demand for each fuel sepa-rately. For each of the countries of OPEC and the Middle East weuse annual data 1971–2010, for country i and year t: demand Dit inmillion barrels per day (mbd) and real income Yit (PPP, constant2005 international $); see Appendix A for data details. In itssimplest log-linear form we have the standard equation used inNarayan and Smyth (2007), which our analysis closely resembles:
log Dit ¼ α0i þ α1i n log Y it þ εit ð1ÞFollowing the work of Engle and Granger (1987), which focusedattention on whether the variables in a regression are stationary,we performed stationarity (unit root) tests6 on the variables, theresults of which are shown in Appendix C, Table C1. The resultsindicate that, for all variables, the null hypothesis of non-stationarity (of unit root) in levels cannot be rejected. This under-mines the validity of using ordinary-least-squares (OLS). However,the results of Table C1 also indicate that for all variables most testsin first differences allow us to reject the null hypothesis of non-stationarity (of unit root). Hence, the variables are non-stationaryin levels but stationary in first-differences, which indicates thatthe variables are integrated of order one.
In order to test for the existence of a long-run relationship amongconsumption of oil (or energy or gas) and income, we employ the
6 We check for non-stationarity by employing several well-known panel unit-root tests: Levin, Lin and Chu (2002) test; Im et al. (2003) W-Stat test; ADF-FisherChi-square test; and Phillips-Perron (PP)–Fisher Chi-square test. Breitung andPesaran (2008) is an excellent survey of non-stationary panel data analysis.
Please cite this article as: Gately, D., et al., The rapid growth of OPECorg/10.1016/j.enpol.2013.07.044i
Pedroni (1999, 2004) panel co-integration tests of the null hypothesisof no co-integration. The tests allow for heterogeneity among cross-sectional units.7 Table C2 shows the outcomes of these co-integrationtests for the consumption of oil (or energy or gas) with income, foreach of the three groups of countries.
The results of most of the co-integration tests (except forenergy and natural gas) are that the null hypothesis of no co-integration can be rejected at the 5% significant level. Therefore,we conclude that consumption is co-integrated with income forthe panels of the country groups, and there exists a long-runrelationship between these countries′ consumption and income.
Having found that there exists a co-integrating link betweenthese pairs of variables, we then used a panel co-integratingestimator – Dynamic OLS8 – to measure the income elasticity
cross section members. Kao (1999) analyzed the properties of the OLS estimatorand found that the bias-corrected OLS estimator does not improve on the OLSestimator in general; see also Chen et al. (1999). These results suggest that analternative such as the fully modified ordinary least squares (FM-OLS) estimator orthe Dynamic OLS (DOLS) estimator, are preferable for co-integrated panel regres-sions. In addition, Kao and Chiang (2000) showed that both the OLS and Fully
′s domestic oil consumption. Energy Policy (2013), http://dx.doi.

?
?
?
?
-2 -1 0 1 2 3
energy, natural gas, total oil
LegendEnergyNat. GasOil, Total
?
?
?
?
?
?
?
?
?
?
?
?
?
-2 -1 0 1 2 3
oil products
Total OPEC
Middle East:
Saudi Arabia
Iran
UAE
Qatar
Iraq
Kuwait
Other OPEC:
Venezuela
Ecuador
Nigeria
Algeria
Angola
Libya
LegendOil, TransportOil, ResidualOil, Other
OPEC: long-run income elasticities of demand
Fig. 5. OPEC Long-run Income Elasticities of Demand (from Table 3):. Energy, Natural Gas, Total Oil, and Oil products.Note: “?” denotes statistical insignificance: p40.05; those unmarked are statistically significant.
D. Gately et al. / Energy Policy ∎ (∎∎∎∎) ∎∎∎–∎∎∎8
of demand.9 Table 3 summarizes our estimated long-run incomeelasticities of demand: for total oil, for each of the three oilproducts, and for natural gas and total energy – for all thecountries of OPEC (Fig. 5) and the Middle East (Fig. 6).
The income elasticity results for OPEC are that total oil demandincreases about as fast as income (elasticity¼0.94 for OPEC), asdoes transport oil and other oil. This is consistent with what wouldbe expected by Fig. 2, since demand and income move parallel tothe equi-proportional growth lines. For Residual Oil the incomeelasticity is close to zero for Total OPEC; a few members withsubstantial reserves of natural gas (Algeria, Qatar) have substitutednatural gas for residual oil, and their income elasticity is estimatedas negative: residual oil declined as income increased.
Similarly, OPEC′s income elasticities are 0.98 for energy and1.44 for natural gas; demand increases as fast as income or faster,respectively. Again, this is what would be expected given Fig. 4:
(footnote continued)Modified OLS (FMOLS) exhibit small-sample bias and that the DOLS estimatorappears to outperform both estimators.
9 Although Pedroni′s methodology allows us to test for the presence of co-integration, EViews software it does not provide an elasticity measure of long-runrelationships. For that, we adopted a procedure for estimating the co-integratingvectors using the multivariate group mean panel Dynamic OLS procedure (DOLS),from Pedroni (2001). This procedure is available in the econometric software RATS;the code is available at the RATS Software Forum: http://www.estima.com/forum/viewtopic.php?f=7&t=1056.
Please cite this article as: Gately, D., et al., The rapid growth of OPECorg/10.1016/j.enpol.2013.07.044i
energy and income move parallel to the equi-proportional growthlines, while natural gas increases more steeply.
The countries with the steadiest income growth generally hadthe highest income elasticities: Saudi Arabia, UAE, Ecuador, andIran. For a few countries, the income elasticities are not statisti-cally significant, or implausibly low, or even negative in the case ofLibya. These are the countries with the greatest disruptions (Iraq,Kuwait) or stagnant income growth (Libya, Nigeria). See thecountry graphs for the 12 current OPEC members in Appendix B.
We also included price as an explanatory variable in the totaloil equation but it was not statistically significant.10 This does notimply, of course, that increasing domestic end-user product priceswould have no effect on restraining demand. It only means thathistorical prices have been so consistently low in the oil producingcountries that we cannot detect their effect on oil demand.However, comparisons with OECD countries, in which end-userprices are five to ten times higher (Table 2), suggest that per-capitaconsumption can be reduced by higher prices.
These estimated income elasticities are consistent with ourdiscussion about the country data in Table 2. For Residual Oil,
10 We used the world price of crude oil (BP Statistical Review of World Energy2011), in lieu of domestic end-user product prices which were not available formost countries (except for gasoline and gasoil/diesel in a few years: Metschies,2009). We also used whatever oil product prices were available for a few countries(gasoline, diesel, kerosene, fuel oil), but they were not statistically significant.
′s domestic oil consumption. Energy Policy (2013), http://dx.doi.

-2 -1 0 1 2 3energy, natural gas, total oil
LegendEnergyNat. GasOil, Total
-2 -1 0 1 2 3oil products
Total MidEast
OPEC:
Saudi Arabia
Iran
UAE
Qatar
Iraq
Kuwait
Non-OPEC:
Bahrain
Oman
Yemen
Syria
Lebanon
Israel
Jordan
LegendOil, TransportOil, ResidualOil, Other
Middle East: long-run income elasticities of demand
Fig. 6. Middle East Long-run Income Elasticities of Demand (from Table 3):. Energy, Natural Gas, Total Oil, and Oil products.Note: “?” denotes statistical insignificance: p40.05; those unmarked are statistically significant.
0 0.5 1 1.5 2
long-run income elasticity of total oil:Gately/Al-Yousef/Al-Sheikh
0
0.5
1
1.5
2
long
-run
inco
me
elas
ticity
ofto
talo
il:N
aray
an-S
myt
h(2
007)
Iran
Iraq
Saudi Arabia
Kuwait
UAEQatar
Bahrain
Oman
YemenSyria
Israel
Jordan
MidEast
estimates inNarayan-Smyth (2007)
are higher
estim
ates are
the same
estimatesin this paperare higher
Fig. 7. Long-run income elasticities of total oil demand for all Middle Eastcountries: comparison of our estimates with those of Narayan and Smyth (2007).
11 It is common to specify per-capita demand as a function of per-capitaincome, without testing whether the demand response is symmetric to incomeincreases and decreases. As shown in Gately and Huntington (2002) and Dargayand Gately (2010), symmetric response of per-capita demand can be rejected for theOil Exporters; ignoring this may bias the estimated income elasticity.
D. Gately et al. / Energy Policy ∎ (∎∎∎∎) ∎∎∎–∎∎∎ 9
there could be little or no increase in demand. Indeed it could begreatly reduced, as it was in the OECD, with natural gas and otherfuels used as substitutes in electricity generation – especially inMiddle East OPEC where it now constitutes 20% of Total OilDemand. For Other Oil used in residential and commercial sectors,its growth could be slowed by reducing product-price subsidiesand especially by policies that would encourage fuel-switchingaway from oil – to natural gas or electricity – in appliances that areused for cooking and water heating, as was done in Sweden andFrance especially. It will be more difficult to slow the growth ofTransport Oil, which is nowmore than half of Total Oil in OPEC andthe Middle East. Eliminating product-price subsidies will help,although it will be difficult politically, and the impact will belimited if price elasticities are low. However, the growth of vehicleownership, expected to increase at least as fast as per-capitaincome, will make it very difficult to keep the growth of TransportOil much lower than income growth.
Our estimated income elasticities for oil demand can becompared with those in the literature. Gately and Huntington(2002) and Dargay and Gately (2010) estimated per-capita demandequations for different groups of countries around the world. Forthe Oil Exporters they found an asymmetric response to changesin income: oil demand (except for Residual Oil) increased about asfast as income for increases in maximum historical income levels,and nearly as fast for income recoveries. In the most recentsummary of demand elasticities, Dahl (2007) reports medianestimates for income elasticities for oil products in all Non-OECDcountries to be about 1 for most oil products; similarly for Dahl(1993, 1994).
Notes at the bottom of Table 3 summarize income elasticitiesthat have been estimated for a few individual countries and fuels:Iran, Saudi Arabia, Kuwait, UAE, Qatar, Bahrain, and Oman. These
Please cite this article as: Gately, D., et al., The rapid growth of OPECorg/10.1016/j.enpol.2013.07.044i
show a wide variation; several are similar to our own. Somedifferences in elasticities may be due to shorter time series, or todifferences in specification11.
′s domestic oil consumption. Energy Policy (2013), http://dx.doi.
1995 2000 2005 2010 2015 2020 2025 20304
6
8
10
12
DOE/EIA 2002
DOE/EIA 2004DOE/EIA 2006
DOE/EIA 2008
DOE/EIA 2010
DOE/EIA projections,for different years of publication
1995 2000 2005 2010 2015 2020 2025 20304
6
8
10
12
IEA 2002IEA 2004
IEA 2006
IEA 2008
IEA 2010
IEA projections,for different years of publication
Middle EastOil Consumption (mbd)with IEA projections
Middle EastOil Consumption (mbd)with DOE/EIA projections
Actual
Actual
3.9% annualgrowth
3.9% annualgrowth
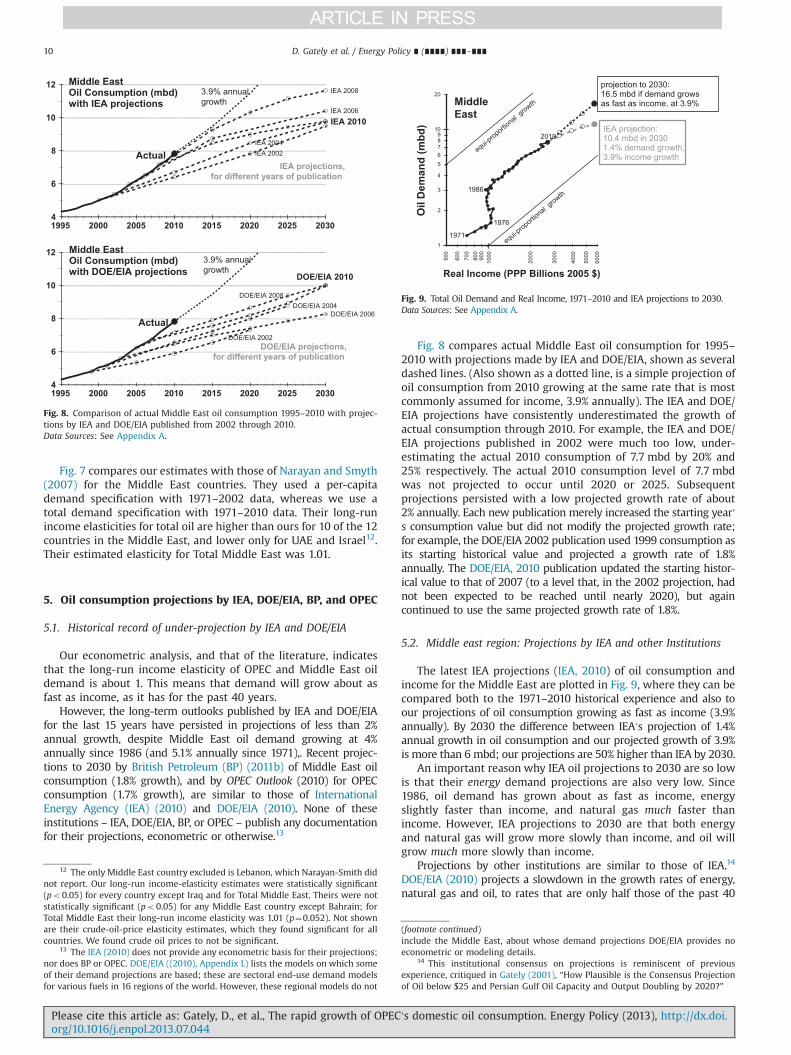
Fig. 8. Comparison of actual Middle East oil consumption 1995–2010 with projec-tions by IEA and DOE/EIA published from 2002 through 2010.Data Sources: See Appendix A.
Real Income (PPP Billions 2005 $)
1971
1976
1986
2010
projection to 2030:16.5 mbd if demand grows as fast as income, at 3.9%
IEA projection:10.4 mbd in 20301.4% demand growth,3.9% income growth
equi-proportio
nal growth
equi-proportio
nal growth
MiddleEast
Oil
Dem
and
(mbd
)
Fig. 9. Total Oil Demand and Real Income, 1971–2010 and IEA projections to 2030.Data Sources: See Appendix A.
D. Gately et al. / Energy Policy ∎ (∎∎∎∎) ∎∎∎–∎∎∎10
Fig. 7 compares our estimates with those of Narayan and Smyth(2007) for the Middle East countries. They used a per-capitademand specification with 1971–2002 data, whereas we use atotal demand specification with 1971–2010 data. Their long-runincome elasticities for total oil are higher than ours for 10 of the 12countries in the Middle East, and lower only for UAE and Israel12.Their estimated elasticity for Total Middle East was 1.01.
5. Oil consumption projections by IEA, DOE/EIA, BP, and OPEC
5.1. Historical record of under-projection by IEA and DOE/EIA
Our econometric analysis, and that of the literature, indicatesthat the long-run income elasticity of OPEC and Middle East oildemand is about 1. This means that demand will grow about asfast as income, as it has for the past 40 years.
However, the long-term outlooks published by IEA and DOE/EIAfor the last 15 years have persisted in projections of less than 2%annual growth, despite Middle East oil demand growing at 4%annually since 1986 (and 5.1% annually since 1971),. Recent projec-tions to 2030 by British Petroleum (BP) (2011b) of Middle East oilconsumption (1.8% growth), and by OPEC Outlook (2010) for OPECconsumption (1.7% growth), are similar to those of InternationalEnergy Agency (IEA) (2010) and DOE/EIA (2010). None of theseinstitutions – IEA, DOE/EIA, BP, or OPEC – publish any documentationfor their projections, econometric or otherwise.13
12 The only Middle East country excluded is Lebanon, which Narayan-Smith didnot report. Our long-run income-elasticity estimates were statistically significant(po0.05) for every country except Iraq and for Total Middle East. Theirs were notstatistically significant (po0.05) for any Middle East country except Bahrain; forTotal Middle East their long-run income elasticity was 1.01 (p¼0.052). Not shownare their crude-oil-price elasticity estimates, which they found significant for allcountries. We found crude oil prices to not be significant.
13 The IEA (2010) does not provide any econometric basis for their projections;nor does BP or OPEC. DOE/EIA ((2010), Appendix L) lists the models on which someof their demand projections are based; these are sectoral end-use demand modelsfor various fuels in 16 regions of the world. However, these regional models do not
Please cite this article as: Gately, D., et al., The rapid growth of OPECorg/10.1016/j.enpol.2013.07.044i
Fig. 8 compares actual Middle East oil consumption for 1995–2010 with projections made by IEA and DOE/EIA, shown as severaldashed lines. (Also shown as a dotted line, is a simple projection ofoil consumption from 2010 growing at the same rate that is mostcommonly assumed for income, 3.9% annually). The IEA and DOE/EIA projections have consistently underestimated the growth ofactual consumption through 2010. For example, the IEA and DOE/EIA projections published in 2002 were much too low, under-estimating the actual 2010 consumption of 7.7 mbd by 20% and25% respectively. The actual 2010 consumption level of 7.7 mbdwas not projected to occur until 2020 or 2025. Subsequentprojections persisted with a low projected growth rate of about2% annually. Each new publication merely increased the starting year′s consumption value but did not modify the projected growth rate;for example, the DOE/EIA 2002 publication used 1999 consumption asits starting historical value and projected a growth rate of 1.8%annually. The DOE/EIA, 2010 publication updated the starting histor-ical value to that of 2007 (to a level that, in the 2002 projection, hadnot been expected to be reached until nearly 2020), but againcontinued to use the same projected growth rate of 1.8%.
5.2. Middle east region: Projections by IEA and other Institutions
The latest IEA projections (IEA, 2010) of oil consumption andincome for the Middle East are plotted in Fig. 9, where they can becompared both to the 1971–2010 historical experience and also toour projections of oil consumption growing as fast as income (3.9%annually). By 2030 the difference between IEA′s projection of 1.4%annual growth in oil consumption and our projected growth of 3.9%is more than 6 mbd; our projections are 50% higher than IEA by 2030.
An important reason why IEA oil projections to 2030 are so lowis that their energy demand projections are also very low. Since1986, oil demand has grown about as fast as income, energyslightly faster than income, and natural gas much faster thanincome. However, IEA projections to 2030 are that both energyand natural gas will grow more slowly than income, and oil willgrow much more slowly than income.
Projections by other institutions are similar to those of IEA.14
DOE/EIA (2010) projects a slowdown in the growth rates of energy,natural gas and oil, to rates that are only half those of the past 40
(footnote continued)include the Middle East, about whose demand projections DOE/EIA provides noeconometric or modeling details.
14 This institutional consensus on projections is reminiscent of previousexperience, critiqued in Gately (2001), “How Plausible is the Consensus Projectionof Oil below $25 and Persian Gulf Oil Capacity and Output Doubling by 2020?”
′s domestic oil consumption. Energy Policy (2013), http://dx.doi.

Table 4Projections to 2030 of Oil Consumption, Exports and Production by IEA, DOE/EIA, BP and OPEC, with 3 other projections assuming oil consumption grows as fast as income(3.9% annually) and 3 illustrative growth rates of production (1%, 2%, 3% annually).().Data Sources: See Appendix A
History Projections to 2030
1971level
2010level
%gr.a
IEA DOE/EIA BP OPEC Outlook Consumption grows as fast as income(3.9% annually), with 3 illustrative growthrates of production
1% Annualgrowth inproduction
2% Annualgrowth inproduction
3% Annualgrowth inproduction
2030level
%gr.b
2030level
%gr.b
2030level
%gr.b
2030level
%gr.b
2030level
% gr.b 2030level
%gr.b
2030level
%gr.b
Total Middle EastOil consumption (mbd) 1.1 7.7 5.1% 10.4 1.5% 11.0 1.8% 11.2 1.9% 16.5 3.9% 16.5 3.9% 16.5 3.9%Oil exports (mbd) 15.3 17.5 0.4% 21.2 1.0% 21.1 0.9% 24.4 1.7% 14.3 �1.0% 21.0 0.9% 29.0 2.6%Oil production (mbd) 16.4 25.2 1.1% 31.6 1.1% 32.1 1.2% 35.5 1.7% 30.7 1% 37.4 2% 45.5 3%Exports as % of Pdn 93% 70% 67% 66% 69% 46% 56% 64%Income (B$/year) 703 2660 3.5% 3.9% 3.8% 3.9% 3.9% 3.9% 3.9%
Total OPECOil Consumption (mbd) 1.2 8.5 5.1% 11.4 1.5% 18.3 3.9% 18.3 3.9% 18.3 3.9%Oil exports (mbd) 23.5 25.8 0.2% 36.8 1.8% 23.6 �0.4% 32.7 1.2% 43.7 2.7%Oil production (mbd) 24.7 34.3 0.8% 48.2 1.7% 41.9 1% 51.0 2% 62.0 3%Exports as % of Pdn 95% 75% 76% 56% 64% 71%Income (B$/year) 967 3223 3.1% 3.5% 3.9% 3.9% 3.9%
Middle East OPECOil consumption (mbd) 0.8 6.5 5.4% 14.0 3.9% 14.0 3.9% 14.0 3.9%Oil exports (mbd) 15.0 17.1 0.3% 14.9 �0.7% 21.2 1.1% 28.7 2.6%Oil production (mbd) 15.9 23.6 1.0% 28.8 1% 35.1 2% 42.7 3%Exports as % of Pdn 95% 73% 52% 60% 67%Income (B$/year) 585 2122 3.4% 3.9% 3.9% 3.9%
a Average annual % growth, 1971–2010.b Average annual % growth, 2010–2030.
D. Gately et al. / Energy Policy ∎ (∎∎∎∎) ∎∎∎–∎∎∎ 11
years – despite income growth than is projected to be faster than inthe past.
BP (2011b) projects an oil growth rate that is only half as fast asincome, at one-third the growth rate since 1971. It projects energygrowth to be slower than income growth, and much slower thanpast energy growth. Only natural gas is projected to grow as fast asincome, but at only half the growth rate of the past 40 years.
OPEC Outlook (2010) projects that OPEC′s own oil consumptiongrowth will be dramatically slower in the future: at half the rate ofincome growth, and half the rate of growth since 1986. It projectsthat its growth of natural gas will be slightly faster than incomegrowth, but much slower than its growth in the past.
As noted above, none of these institutions provide any evidenceof econometric estimation nor any documentation for the basis oftheir projections.
5.3. Comparison of oil Projections to 2030
Table 4 compares the projections by IEA, DOE/EIA, BP and OPECwith our projections. We assume, for each of the three groups ofcountries, that oil consumption grows as rapidly as income (3.9%annually15) and we use 3 illustrative growth rates of oil production
15 Faster growth in oil consumption is projected for Saudi Arabia in two recentstudies. Annual growth of 5% is projected in Gately et al. (2012). Similarly, Lahn andStevens (2011) in their Business-As-Usual scenario project 5.36% annual growth.They also consider two alternative scenarios: (1) higher production and consump-tion of natural gas, which substitutes for oil consumption and slows oil growth to3.7% annually; (2) nuclear power development combined with increasing energyefficiency, which slows oil growth to 2.6% annually. None of these projections,
Please cite this article as: Gately, D., et al., The rapid growth of OPECorg/10.1016/j.enpol.2013.07.044i
(1%, 2%, and 3% annually). IEA, DOE/EIA and BP project that MiddleEast oil consumption will grow much slower than 2% annually,which is less than half the projected rate of income growth – incontrast to the experience of the last 40 years. OPEC Outlook makessimilar projections for OPEC′s own oil consumption. For theMiddle East we project oil consumption to be at least 5 mbdhigher than the levels projected by IEA, DOE/EIA and BP in 2030,which is 50% higher than what they project. With 2% annualgrowth in production, our 3.9% consumption growth will allowexports to increase, but only slowly: 0.9% annually, from 17.5 in2010 to 21 mbd in 2030. In contrast, they project a similar increasein exports but without the need to increase production nearlyas much.
For the OPEC countries the results are similar. Growth as fast asincome will increase oil consumption from 8.5 in 2010 to 18.5 mbdin 2030. With 2% annual growth in production, to 51 mbd in 2030,oil exports can increase, but only slowly: 1.2% annually, from 25.8in 2010 to 32.7 in 2030. With only 1% annual growth in produc-tion, however, oil exports will decline, because domestic con-sumption increases faster than production.16
(footnote continued)however, have Saudi oil consumption growing slower than 2% annually, which iswhat IEA, DOE/EIA, BP, and OPEC Outlook are assuming for the Middle Eastand OPEC.
16 In contrast to the relatively optimistic projections by IEA, DOE/EIA, BP andOPEC, a more pessimistic outlook for OPEC exports can be found in Mitchell andStevens (2008).
′s domestic oil consumption. Energy Policy (2013), http://dx.doi.

Table 5Effect of an extra 6 mbd increase in OPEC consumption in 2030 on Non-OPEC Demand, Supply and Price.Data Sources: See Appendix A.
History Projections for year 2030
1971 2010 DOE Ref. Case projection:11 mbd OPEC consumptionin 2030
Same OPEC productionas DOE but 17 mbd OPECconsumption in 2030
Oil liquids consumption (mbd)Non-OPEC 46.7 78.9 93 89.4OPEC 1.2 8.5 11 17World 47.9 87.4 104 106.4
Oil liquids production (mbd)Non-OPEC 26.1 47.8 60 62.4OPEC 24.7 34.3 44 44World 50.8 82.1 104 106.4
OPEC oil liquids exports in 2030 (mbd) 23.5 25.8 33 27Price in 2030 (2010 $/b) $16 $80 $125 $143OPEC oil export revenue in 2030 (B$/year) $139 $749 $1506 $1405Non-OPEC oil expenditures in 2030 (B$/year) $276 $2289 $4243 $4651
D. Gately et al. / Energy Policy ∎ (∎∎∎∎) ∎∎∎–∎∎∎12
5.4. World oil market implications of much higher OPECconsumption
Let us assume that OPEC′s domestic consumption grows 6 mbdfaster by 2030 than the projections of these institutions. Thiswould imply that price would have to be higher than projected, tostimulate Non-OPEC supply and reduce Non-OPEC demand byenough to offset any net reduction in OPEC exports. The amount ofthe price increase will depend upon the price elasticities of non-OPEC demand and supply, and upon the amount of any increase inOPEC production in response to the increased OPEC consumption.Table 5 compares the DOE/EIA projections for 2030 of demand,supply and price with an alternative projection that assumes long-run price-elasticities of Non-OPEC demand and supply of �0.3 and+0.3 respectively; these elasticities were used by Smith (2009).The alternative projection assumes no offsetting increase in OPECproduction, so that OPEC exports are 6 mbd lower than in theDOE/EIA projection, because of the increase in OPEC consumption.Hence, price will have to increase by enough to lessen Non-OPECconsumption and stimulate Non-OPEC supply to reduce Non-OPEC′s imports by 6 mbd. In this example, price is $18 higher ($143 vs.$125), which lessens Non-OPEC demand by 3.6 mbd (from 93 to89.4) and stimulates Non-OPEC supply by 2.4 mbd (from 60 to62.4). The effect on OPEC export revenue is negative, as the higherprice only partially offsets the reduction in OPEC exports; OPECexport revenue would be $101 billion lower in 2030 than in theDOE/EIA projection. Non-OPEC oil expenditures, however, wouldbe $408 billion higher, because the higher price is only partiallyoffset by the reduction in Non-OPEC oil consumption. Thisexample is only illustrative of the magnitudes involved. The priceincrease would be lessened by offsetting increases in OPECproduction or by higher price-elasticities.
6. Conclusions
All the major institutions – IEA, DOE/EIA, BP, and OPEC –
project growth rates of oil consumption for the Middle East andOPEC that are less than 2% annually, with income growth about 4%.By contrast, since 1971 the average annual growth rate of OPECconsumption has been 5.1% for oil (5.5% for energy) with incomegrowth of 3.1%; growth rates for the Middle East are similar. Theseinstitutions provide no econometric analysis in support of theirpersistent hopefulness.
Please cite this article as: Gately, D., et al., The rapid growth of OPECorg/10.1016/j.enpol.2013.07.044i
Unlike these projections that OPEC oil demand will grow only halfas fast as income, we believe that it will increase about as fast as theirincome. The income elasticity of oil demand, econometrically esti-mated by us and by much of the literature, is near 1. Given standardincome growth projections, by 2030 OPEC will consume about 50%more oil (6 mbd) than is projected by IEA, DOE/EIA, BP, and OPECitself. This will have important implications for increases in OPEC oilproduction or decreases in OPEC exports. Oil prices are likely toincrease faster than projected, in order to slow the growth of Non-OPEC oil consumption and stimulate Non-OPEC production.
Of course, it is possible that OPEC′s oil consumption could growonly half as fast as their income, as the IEA and DOE/EIA have beenprojecting for more than a decade, persistently but wrongly.However, this has not happened in four decades, and there is noreason to expect it will start happening soon. Their projectionsrepresent what Samuel Johnson called, in another context, “thetriumph of hope over experience.”
Appendix A. Data
We used 1971–2008 IEA data for consumption of oil, naturalgas, and total energy, with 2009–10 estimates of oil consumptionfrom JodiDATA:
1971–2008: IEA, Energy Balances of Non-OECD Countries, Paris,2010.2009–2010: Joint Organizations Data Initiative, www.JodiData.org.
We calculated Transport Oil as the sum of Motor Gasoline,Aviation Fuels, and GasOil (which includes not only diesel oilbut also light fuel oil used for heating and other purposes; theseare disaggregated by the IEA only for the OECD countries). OtherOil is calculated as Total Oil minus Transport Oil and ResidualOil; it includes LPG, naphtha, non-jet kerosene, and otherproducts. For 2009–2010, we used oil product data from Jodi-DATA by assuming the following: (1) JodiDATA “kerosene” wasdisaggregated into jet-fuel kerosene and other kerosene in thesame proportion as the 2008 IEA data, and then aggregatedgasoline, gasoil, and jet-fuel kerosene into “transport oil”;(2) the IEA total increased from 2008 to 2009 and 2010 by thesame percentage as the totals from JodiDATA; (3) Other Oil in2009 and 2010 was calculated as the difference between the
′s domestic oil consumption. Energy Policy (2013), http://dx.doi.

D. Gately et al. / Energy Policy ∎ (∎∎∎∎) ∎∎∎–∎∎∎ 13
total demand calculated in (2) minus transport oil calculated in(1) and the JodiData values for Residual Oil in 2009–2010.
Other data used were the following:
�
Po
Population: Penn World Tables 7.0: Alan Heston, Robert Summersand Bettina Aten, Center for International Comparisons of Produc-tion, Income and Prices at the University of Pennsylvania, May2011. http://pwt.econ.upenn.edu/php_site/pwt_index.php.
�
“Real Income” calculated from Penn World Tables data, asPopulation times PPP Converted GDP Per Capita (Chain Series),at 2005 constant prices.10 100 1000
Real Income
0.01
0.1
1
1971
1986
2010
10 100 1000
Real Income
0.01
0.1
1
1971
2001
2010
Tota
l Oil
Dem
and
(mbd
)To
tal O
il D
eman
d (m
bd)
Tota
l Oil
Dem
and
(mbd
)
SaudiArabia
10 100 1000
Real Income
0.01
0.1
1
1971
19791991
2003
2010
Iraq
UAE
Fig. B1. Total Oil Demand and Real Income, 1971–2
lease cite this article as: Gately, D., et al., The rapid growth of OPECrg/10.1016/j.enpol.2013.07.044i
�
Tota
l Oil
Dem
and
(mbd
)To
tal O
il D
eman
d (m
bd)
Tota
l Oil
Dem
and
(mbd
)
010
′s d
World crude oil prices (2010 $ per barrel), 1971–2010: BPStatistical Review (2011a).
�
Middle East consumption of natural gas and energy, 2009–10:BP Statistical Review (2011a).Appendix B. Individual OPEC countries′ Oil Demand andIncome
Also see Figs. B1 and B2.
10 100 1000
Real Income
0.01
0.1
1
1980
1986
2010
Qatar
10 100 1000
Real Income
0.01
0.1
1
1971
19801986
2010
10 100 1000
Real Income
0.01
0.1
1
19711991
2010
Iran
Kuwait
: individual countries in Middle East OPEC.
omestic oil consumption. Energy Policy (2013), http://dx.doi.
10 100 1000
Real Income
0.01
0.1
1
Tota
l Oil
Dem
and
(mbd
)
Tota
l Oil
Dem
and
(mbd
)
Tota
l Oil
Dem
and
(mbd
)
Tota
l Oil
Dem
and
(mbd
)
Tota
l Oil
Dem
and
(mbd
)
Tota
l Oil
Dem
and
(mbd
)
1971
2010
10 100 1000
Real Income
0.01
0.1
1
1971
2010
10 100 1000
Real Income
0.01
0.1
1
1977
2010
Angola
10 100 1000
Real Income
0.01
0.1
1
1971
2010
Venezuela
10 100 1000
Real Income
0.01
0.1
1
1971
2010
10 100 1000
Real Income
0.01
0.1
1
1971
2008
Ecuador
LibyaAlgeria
Nigeria
Fig. B2. Total Oil Demand and Real Income, 1971–2010, for other OPEC countries.
D. Gately et al. / Energy Policy ∎ (∎∎∎∎) ∎∎∎–∎∎∎14
Appendix C. Statistical results
The results indicate that, for all variables, the null hypothesisof non-stationarity (of unit root) in levels cannot be rejected.This undermines the validity of using ordinary-least-squares(OLS). However, the results of Table C1 also indicate that for allvariables most tests in first differences allow us to reject the nullhypothesis of non-stationarity (of unit root). Hence, the vari-ables are non-stationary in levels but stationary in first-
Please cite this article as: Gately, D., et al., The rapid growth of OPECorg/10.1016/j.enpol.2013.07.044i
differences, which indicates that the variables are integratedof order one.
The results of most of the co-integration tests (except forenergy and natural gas) are that the null hypothesis of no co-integration can be rejected at the 5% significant level. Therefore,we conclude that consumption is co-integrated with income forthe panels of the country groups, and there exists a long-runrelationship between these countries′ consumption and income(Table C2).
′s domestic oil consumption. Energy Policy (2013), http://dx.doi.

Table C2Results of Pedroni′s panel co-integration tests for models of consumption of oil products, energy, and gas on income, for Middle East, OPEC, and Middle East OPEC, with nointercept, no deterministic trend, and lag length selection based on SIC.
Panel statistics Group statistics
Panel v� statistic Panel ρ� statistic Panel PP statistic Panel ADF Statistic Group ρ� statistic Group PP statistic Group ADF statistic
Middle EastTotal oil �0.17 �1.08 �3.07n �2.45n �1.84n �1.65n �1.84n
Transport oil 0.66 �1.21 �3.23n �3.05n 0.97 �3.42n �3.91n
Residual oil 4.36n �2.53n �1.5 �0.72 �0.55 �3.29n �2.36n
Other oil 0.03 �0.35 �1.96n �1.91n 1.39 �1.70n �1.4Energy �1.53 �1.1 �1.77n �1.37 1.21 �1.29 �1Natural Gas 1.43 �0.8 �0.92 �0.7 0.8 �1.11 �1.57
OPECTotal oil 0.66 �1.59 �4.18n �3.96n 0.38 �3.89n 4.97n
Transport oil 1.46 �2.02n �4.45n �4.33n 0.65 �4.49n �5.50n
Residual Oil 2.01n �3.14n �3.91n �3.09n �1.35 �4.75n �4.00n
Other oil �0.04 �0.66 �2.63n �2.70n 0.86 �3.33n �2.99n
Energy �1.05 �0.63 �0.82 �1.03 1.93 0.27 �0.05Natural gas 0.25 �0.91 �1.55 �1.66n 1.26 �1.27 �1.82n
Middle East OPECTotal oil 0.95 �2.30n �5.27n �1.60n �0.3 �3.94n �1.62Transport oil 0.36 �0.83 �2.62n �2.52n 1.09 �3.13n �3.42n
Residual oil 1.70n �2.63n �3.02n �2.16n �2.07n �4.57n �3.38n
Other oil �0.21 �0.23 �1.62 �1.74n 1.53 �1.44 �1.64n
Energy �0.38 �1.58 �2.43n �2.30n 0.32 �3.16n �3.48n
Natural gas 0.12 �0.5 �0.69 �1.86n 0.99 �0.4 �2.05n
n Indicates that the null hypothesis of no co-integration can be rejected because P-value is less than 0.05.
Table C1Panel Unit Root Test Results for oil products, energy, natural gas and income for the three groups: Middle East, OPEC, and Middle East OPEC.
Levels First Differences
Levin, Lin and Chu Im, Pesaran andShin W-stat
ADF – FisherChi-square
PP – FisherChi-square
Levin, Linand Chu
Im, Pesaran andShin W-stat
ADF – FisherChi-square
PP – FisherChi-square
Middle EastTotal oil 5.6 5.1 13.9 11.9 1.5n �4.1n 70.1n 248.5n
Transport oil 5 5.2 12.8 13.2 2.4 �3.8n 69.1n 246.1n
Residual oil �0.1 0.2 27.8 58.1n �5.6n �9.7n 148.4n 296.3n
Other oil 3.9 4.1 13.9 10.6 �0.3 �4.2n 98.4n 277.5n
Energy 0.9 �1.4 29.1 27.8 6.4n �3.1n 66.3n 311.9n
Natural gas 0.2 �1.9n 30.6 29.6 �0.1 �5.1n 79.5n 265.2n
Income �0.6 2.1 23.3 36.3 �12.5n �12.4n 191.7n 280.2n
OPECTotal oil 4.2 7 11.7 10.8 �1.5 �7.2n 119.4n 250.0n
Transport oil 4.5 7.8 7.8 6.6 �2.6n 123.8n 123.8n 231.8n
Residual oil 0 0.2 25.3 28.6 �11.0n �12.1n 187.1n 332.1n
Other oil 2.2 3.7 12.1 13.5 �7.7n �9.3n 152.2n 350.0n
Energy 1.3 �1.6 28.6 25.4 5.8 �3.0n 70.8n 277.8n
Natural gas 0.4 �1.6 29.6 25.4 �3.7n �5.9n 98.1n 262.7n
Income 0.8 2.7 20.5 27.2 �11.0n �11.0n 167.4n 243.1n
Middle East OPECTotal oil 4.8 6.5 1 0.9 �1.6 �4.7n 49.0n 111.6n
Transport oil 3.8 6.5 1.1 1 �1.3 �4.4n 45.1n 105.0n
Residual oil 0.1 0.9 9.5 10.8 �6.5n �7.7n 80.3n 153.8n
Other oil �3.8 �1.4 17.9 19.2 �5.8n �6.8n 72.4n 149.7n
Energy 0.6 �1.3 15.7 15.3 3.6 0.1 24.0n 146.7n
Natural Gas 0.2 �1.5 17 15.3 2.9n �6.3n 67.9n 140.1n
Income 7.6 7.3 5.2 4.9 �5.7n �6.5n 79.1n 79.3n
n Indicates that the null hypothesis of a unit root can be rejected because P-value is less than 0.05.
D. Gately et al. / Energy Policy ∎ (∎∎∎∎) ∎∎∎–∎∎∎ 15
Please cite this article as: Gately, D., et al., The rapid growth of OPEC′s domestic oil consumption. Energy Policy (2013), http://dx.doi.org/10.1016/j.enpol.2013.07.044i

D. Gately et al. / Energy Policy ∎ (∎∎∎∎) ∎∎∎–∎∎∎16
References
Ahmadian, Majid, Chitnis, Mona, Hunt, Lester C., 2007. Gasoline demand, pricingpolicy and social welfare in the islamic republic of Iran. OPEC Review 31 (2),105–124.
Al-Iriani, Mahmoud, 2006. Energy-GDP relationship revisited: an example fromGCC countries using panel causality. Energy Policy 34, 3342–3350.
Al-Janabi, Adnan, 1979. Estimating energy demand in OPEC countries. EnergyEconomics 1, 87–92.
Al-Sahlawi, Mohammed A., 1988a. Gasoline demand: the case of Saudi Arabia.Energy Economics 10 (4), 271–275.
Al-Sahlawi, Mohammed A., 1988b. GCC energy demand: outlook to 2000. EnergyEconomics 10 (1), 42–46.
Al-Sahlawi, Mohammed A., 1997. The demand for oil products in Saudi Arabia.OPEC Review 21 (1), 33–38.
Al-Faris, Abdul-Razak F., 1997. Demand for oil products in the GCC countries.Energy Policy 25 (1), 55–61.
Bahgat, Gawdat, 2012. Will Saudi Arabia face an energy crisis? Journal of Social andEconomic Studies 37 (2), 181–198.
Breitung, J., Pesaran, M.H., 2008. Unit roots and co-integration in panels. In: Matyas,L., Sevestre, P. (Eds.), The Econometrics of Panel Data, third edition Springer-Verlag, New York, pp. 279–322. (Chapter 9).
British Petroleum (BP), 2011a. BP Statistical Review of World Energy. Availablefrom: ⟨http://www.bp.com/statisticalreview⟩.
British Petroleum (BP), 2011b. BP Energy Outlook 2030.Chen, B., McCoskey, S., Kao, C., 1999. Estimation and inference of a co-integrated
regression in panel data: a Monte Carlo study. American Journal of Mathema-tical and Management Sciences 19, 75–114.
Dahl, Carol, 1993. A survey of oil demand elasticities for developing countries. OPECReview XVII (4), 399–419.
Dahl, Carol, 1994. A survey of oil product demand elasticities for developingcountries. OPEC Review XVIII (1), 47–87.
Dahl, Carol, 2007. Oil and oil product demand. ENI Encyclopedia of Hydrocarbons,42–45.
Damette, Olivier, Seghir, Majda, 2013. Energy as a driver of growth in oil exportingcountries. Energy Economics 37, 193–199, http://dx.doi.org/10.1016/j.eneco.2012.12.011.
Dargay, Joyce M., Gately, Dermot, 2010. World oil demand′s shift toward fastergrowing and less price-responsive products and regions. Energy Policy 38,6261–6277.
Dargay, Joyce M., Gately, Dermot, Sommer, Martin, 2007. Vehicle ownership andincome growth, worldwide: 1960–2030. Energy Journal 28 (4), 163–190.
Eltony, M.Nagy, 1996. Demand for gasoline in the GCC: an application of poolingand testing procedures. Energy Economics 18, 203–209.
Eltony, M.Nagy, Al-Mutari, N.H., 1995. Demand for gasoline in Kuwait, an empiricalanalysis using co-integration techniques. Energy Economics 17 (3), 249–253.
Engle, F., Granger, C.W.J., 1987. Co-integration and error correction representation,estimation, and testing. Econometrica 55, 251–276.
Exxon-Mobil, 2010. The outlook for energy: a view to 2030. Available from: ⟨www.exxonmobil.com/corporate/files/news_pub_eo_2010.pdf⟩.
Please cite this article as: Gately, D., et al., The rapid growth of OPECorg/10.1016/j.enpol.2013.07.044i
Gately, Dermot, 2001. How plausible is the consensus projection of oil below $25 andPersian Gulf oil capacity and output doubling by 2020? Energy Journal 22 (4), 1–27.
Gately, Dermot, Al-Yousef, Nourah, Al-Sheikh, Hamad M.H., 2012. The rapid growthof domestic oil consumption in Saudi Arabia and the opportunity cost of oilexports foregone. Energy Policy 47, 57–68, http://dx.doi.org/10.1016/j.enpol.2012.04.011.
Gately, Dermot, Huntington, Hillard G., 2002. The Asymmetric effects of changes inprice and income on energy and oil demand. Energy Journal 23 (1), 19–55.
International Energy Agency (IEA), 2010. World Energy Outlook 2010. Paris. JointOrganizations Data Initiative. Available from: ⟨www.JodiDATA.org⟩.
Im, K.S., Pesaran, M.H., Shin, Y., 2003. Testing for unit roots in heterogeneouspanels. Journal of Econometrics 115, 53–74.
Kao, C., 1999. Spurious regression and residual-based tests for co-integration inpanel data. Journal of Econometrics 90, 1–44.
Kao, C., Chiang, M.-H., 2000. On the estimation and inference of a co-integratedregression in panel data. Advances in Econometrics 15, 179–222.
Krane, Jim, 2013. Stability versus sustainability: energy policy in the Gulf Mon-archies, Cambridge Working Paper in Economics, pp. 1304. ⟨www.eprg.group.cam.ac.uk⟩.
Lee, Chien-Chiang, 2005. Energy consumption and GDP in developing countries: aco-integrated panel analysis. Energy Economics 27, 415–427.
Lahn, Glada, Stevens, Paul, 2011. Burning Oil to Keep Cool: The Hidden Energy Crisisin Saudi Arabia. Chatham House, London.
Levin, A., Lin, C.-F., Chu, C.-S.J., 2002. Unit root tests in panel data: asymptotic andfinite-sample properties. Journal of Econometrics 108, 1–24.
Mehrara, Mohsen, 2007. Energy consumption and economic growth: the case of oilexporting countries. Energy Policy 35, 2939–2945.
Metschies, Gerhard P., 2009. International Fuel Prices 2009. German TechnicalCooperation GTZ. Available from: ⟨www.Metschies.com⟩.
Mitchell, John, Stevens, Paul, 2008. Ending Dependence: Hard Choices for Oil-Exporting States. Chatham House, London.
Narayan, Paresh Kumar, Smyth, Russell, 2007. A panel co-integration analysis ofdemand for oil in the Middle East. Energy Policy 35, 6258–6265.
OPEC, 2010. World Oil Outlook. OPEC Secretariat, Vienna.Pedroni, P., 1999. Critical values for co-integration tests in heterogeneous panels
with multiple regressors. Oxford Bulletin of Economics and Statistics 61 (4),653–670.
Pedroni, P., 2000. Fully modified OLS for heterogeneous co-integrated panels.Advances in Econometrics 15, 93–130.
Pedroni, P., 2001. Purchasing power parity tests in co-integrated panels. Review ofEconomics and Statistics 83, 727–731.
Pedroni, P., 2004. Panel co-integration; asymptotic and finite sample properties ofpooled time series tests, with an application to the PPP hypothesis. Econo-metric Theory 20, 597–625.
Smith, James L., 2009. World oil: market or Mayhem. Journal of EconomicPerspectives 23 (3), 145–164.
US Department of Energy, Energy Intelligence Administration (DOE/EIA), 2010.International Energy Outlook 2010. Washington.
′s domestic oil consumption. Energy Policy (2013), http://dx.doi.