The Quality of education: some policy suggestions based on...
96
SACMEQ Policy Research: Report No. 4 Series Editor: Kenneth AT. Ross The quality of education: some policy suggestions based on a survey of schools Zanzibar bY Sebtuu Nassor Khadija Ali Mohammed Ministry of Education Zanzibar, Tanzania International Institute for Educational Planning, UNESCO Ministry of Education Zanzibar, Tanzania
Transcript of The Quality of education: some policy suggestions based on...

SACMEQ Policy Research: Report No. 4 Series Editor: Kenneth AT. Ross
The quality of education: some policy suggestions
based on a survey of schools
Zanzibar
bY
Sebtuu Nassor Khadija Ali Mohammed
Ministry of Education Zanzibar, Tanzania
International Institute for Educational Planning, UNESCO
Ministry of Education Zanzibar, Tanzania

The designations employed and the presentation of material throughout this document do not imply the expression of any opinion whatsoever on the part of UNESCO or IIEP concerning the legal status
of any country, territory, city or area of its authorities, or concerning its frontiers or boundaries.
The publication costs of this study have been covered by a grant-in-aid offered by UNESCO and by voluntary contributions made by several Member States of UNESCO, the list of which will be found at
the end of the booklet.
This document has been composed by IIEP Publications and printed in IIEP’s Printshop
Published by the International Institute for Educational Planning 7-Q rue Eugene-Delacroix, 75116 Paris, France
Cover design by Marie Moncet. Wood cut by H@I&ne D&y.
0 UNESCO 1998

Foreword
The Southern Africa Consortium for Monitoring Educational Quality (SACMEQ) is a consortium of Ministries of Education located in the Southern Africa sub-region. For several years these Ministries have worked in close partnership with the IIEP in order to undertake educational policy research with the main aim of generating reliable information that can be used by decision-makers to plan the quality of education.
In January 1997 the Government of Zimbabwe officially registered SACMEQ as an international non-governmental organization. SACMEQ’s Sub-regional Co- ordinating Centre is located within UNESCO’s Harare Office. The work of the Centre is managed by a Director and is guided by a Committee chaired by Zimbabwe’s Minister of Education. The ‘founding members’ of SACMEQ are the IIEP, Kenya, Malawi, Mauritius, Mozambique, Namibia, Swaziland, Tanzania (Mainland and Zanzibar), Zambia, and Zimbabwe.
SACMEQ’s programme of research and training has four features which have optimized its contributions to the field of educational planning in Africa: it provides research-based policy advice concerning issues that have been identified by key decision-makers, it functions as a co-operative venture based on a strong network of educational planners, it combines research and training components that are linked with institutional capacity building, and its future directions are defined by the participating Ministries.
SACMEQ’s initial educational policy research project was assisted during 1994/1995 through a Funds-in-Trust (FIT) agreement between the Italian Government and UNESCO. In 1996 SACMEQ’s sub-regional activities were financed under an FIT agreement with the Netherlands Government. This arrangement was renewed in 1997 for the launch of SACMEQ’s Sub-regional Co-ordinating Centre.
The costs associated with future SACMEQ projects will be financed from two sources. First, the SACMEQ Sub-regional Co-ordinating Centre will support co- operative sub-regional activities which include project design, sub-regional training workshops, construction of data archives, and dissemination of results. Second, the participating Ministries will cover their own within-country research costs related to printing, fieldwork operations, data entry and cleaning, the provision of genera1 overheads for project co-ordination, and the publication of national reports.
This report presents the research results and policy suggestions that emerged from the implementation of SACMEQ’s initial educational policy research project. It is offered to other educational planners - not as a final evaluative comment, but rather as a stimulus for constructive discussion of educational policy options, and also as a successful model of productive collaboration among educational planners from many different countries.
Hon. Mr Omari R. Mapuri Minister of Education Zanzibar, Tanzania
Dr Jacques Hallak ADG UNESCO / Director, REP
Paris, France

Further information
For further information about SACMEQ and its policy research programme, please contact:
The Director SACMEQ UNESCO Regional Office 8 Kenilworth Road Harare Zimbabwe
Telephone: (263-4) 776 I 14-5,776 775,746 23 1,786 598 Fax: (263-4) 776 055 E-mail:[email protected]
For further information about the IIEP’s programme of co-operation with SACMEQ please contact:
Dr Kenneth N. Ross International Institute for Educational Planning 7-9 rue Eugene-Delacroix 75 116 Paris France
Telephone: (33-l) 45 03 77 19 Fax: (33-l) 40 72 83 66 E-mail: 100143.37compuserve.com
-

Acknowledgements
SACMEQ’s initial educational policy research project was a co-operative cross-national initiative focused on shared policy concerns that were related to planning the quality of primary education in the Southern Africa sub-region. Each national educational policy report prepared for this project therefore represents a ‘team effort’ that has been made possible through the hard work of many people.
The International Institute for Educational Planning and the SACMEQ network of Ministries of Education would like to thank everyone involved in the successful implementation of this important project and, in particular, to acknowledge the contributions made to this report by the following people.
Kenya Mary Kariuki
Malawi Joseph Chimombo
Mauritius Dhurumbeer Kulpoo
Namibia Friedhelm Voigts
Tanzania (Zanzibar) Sebtuu Nassor
Khadija Ali Mohammed
Zambia Manasseh Nkamba
Joe Kanyika
Zimbabwe Thomas Machingaidze
Patrick Pfukani Sibangani Shumba
IIEP Kenneth N. Ross
T. Neville Postlethwaite Mioko Saito
Jocelyne Vellien
Contents
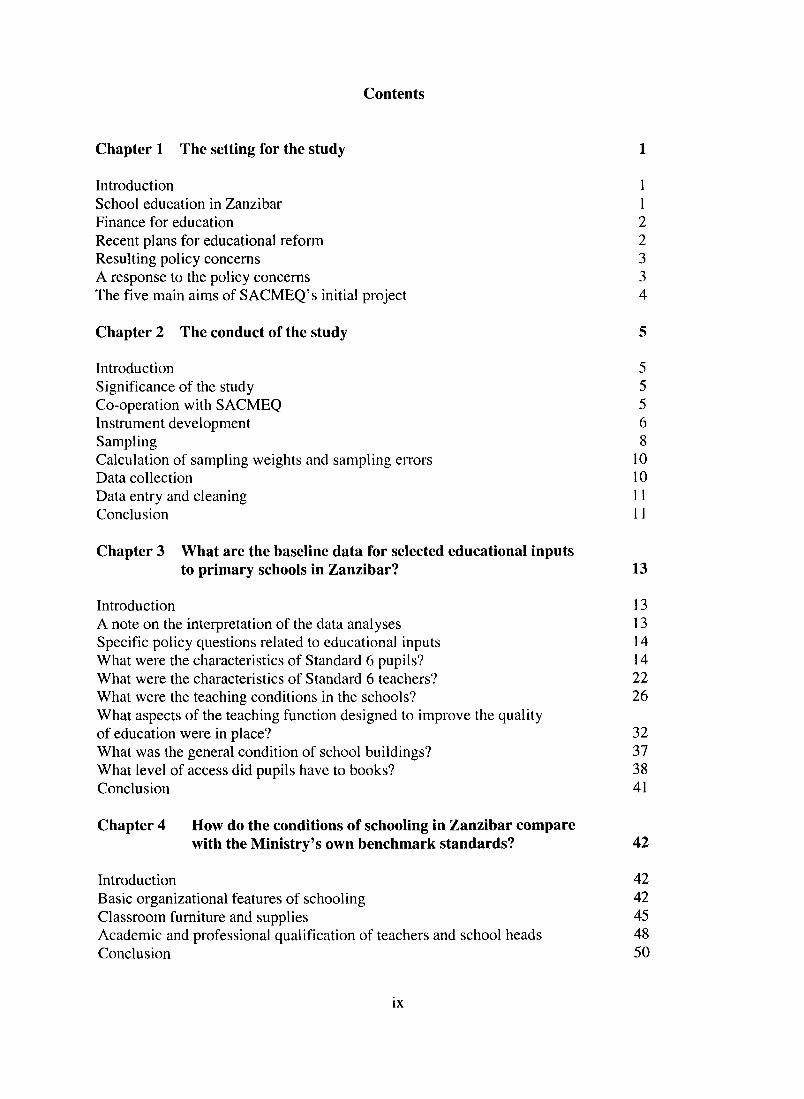
Chapter 1 The setting for the study 1
Introduction School education in Zanzibar Finance for education Recent plans for educational reform Resulting policy concerns A response to the policy concerns The five main aims of SACMEQ’s initial project
Chapter 2 The conduct of the study
Introduction 5 Significance of the study 5 Co-operation with SACMEQ 5 Instrument development 6 Sampling 8 Calculation of sampling weights and sampling errors 10 Data collection 10 Data entry and cleaning II Conclusion 11
Chapter 3 What are the baseline data for selected educational inputs to primary schools in Zanzibar?
Introduction A note on the interpretation of the data analyses Specific policy questions related to educational inputs What were the characteristics of Standard 6 pupils? What were the characteristics of Standard 6 teachers? What were the teaching conditions in the schools? What aspects of the teaching function designed to improve the quality of education were in place? What was the general condition of school buildings? What level of access did pupils have to books? Conclusion
Chapter 4 How do the conditions of schooling in Zanzibar compare with the Ministry’s own benchmark standards?
Introduction Basic organizational features of schooling Classroom furniture and supplies Academic and professional qualification of teachers and school heads Conclusion
ix
5
13
13 13 14 14 22 26
32 37 38 41
42
42 42 45 48 50
- -
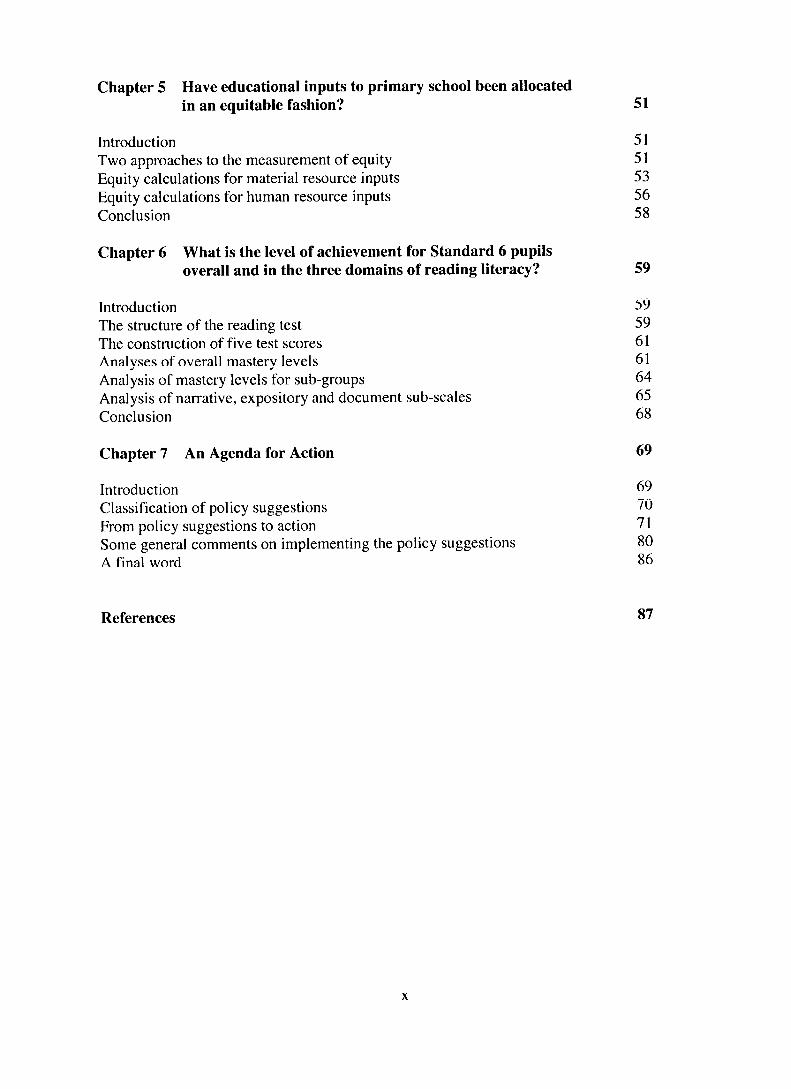
Chapter 5 Have educational inputs to primary school been allocated in an equitable fashion?
Introduction Two approaches to the measurement of equity Equity calculations for material resource inputs Equity calculations for human resource inputs Conclusion
Chapter 6 What is the level of achievement for Standard 6 pupils overall and in the three domains of reading literacy?
Introduction The structure of the reading test The construction of five test scores Analyses of overall mastery levels Analysis of mastery levels for sub-groups Analysis of narrative, expository and document sub-scales Conclusion
Chapter 7 An Agenda for Action 69
Introduction Classification of policy suggestions From policy suggestions to action Some general comments on implementing the policy suggestions A final word
51
51 51 53 56 58
59
59 59 61 61 64 65 68
69 70 71 80 86
References 87

Chapter 1
The setting for the study
Introduction
Zanzibar became part of the United Republic of Tanzania in 1964. The country consists of two main islands, Unguja and Pemba, and several other smaller islands. Administratively Zanzibar has five regions, each with two districts. According to the 1988 Population Census, Zanzibar had a population of about 640,685. The average population growth was 3 percent per annum in the 1980s. In 1996 the population was estimated to be 750,000. The population consists of people from different ethnic backgrounds, the majority of whom are Africans. The official language is Kiswahili, which is spoken by the whole population. English is taught as a second language at the primary-school level and is the medium of instruction at the secondary-school level. The main religion of the people is Islam and there is an Arabic cultural influence in the country - therefore Arabic is taught in all government schools.
School education in Zanzibar
When Zanzibar attained its independence in 1964, there were 62 primary schools and 4 secondary schools. There were 19,106 primary-school pupils and 734 secondary-level pupils. In 1995 there were 139 primary schools with an enrolment of 122,954 pupils, 96 schools offering secondary education with an enrolment of 24,021 students, one technical college, and one teacher training college. Since independence, education in Zanzibar has been free and became compulsory in 1992 - from the age of seven to sixteen years. The education system comprises ten years of basic education (seven years of primary and three years of secondary), two years of senior secondary, and a further two years of higher secondary leading to university education which is offered in Tanzania mainland.
(a) Pre-primary education
Less than 10 percent of the children aged four to six years attend government nursery schools. There has been an increase in private pre-school institutions since 1993. However, nearly all children from the age of four years attend traditional Koranic schools in addition to attending the formal education system. Enrolment in the Koranic schools is not compulsory and the age of entry is varied.
(b) Primary education
Both Tanzania mainland and Zanzibar proclaimed Universal Primary Education (UPE) in 1978. However, the appropriate term for Zanzibar is Universal Basic Education because all children are entitled to have 10 years of education (seven years of primary and three years of junior secondary). Enrolment in primary education has increased and the gross enrolment rate reached 80.5 percent in 1995. The participation rate of boys and girls was virtually the same.
1

The current education plan aims at reaching a gross enrolment ratio of 100 percent by the year 2000, and in order to reach this target, efforts are being made to integrate Koranic schools into the formal system. Most primary schools operate a double-shift system - one in the morning (7:30 a.m. to 12:45 p.m.) and the other in the afternoon (1:00 p.m. to 6:00 p.m.). The medium of instruction at the primary level is Kiswahili. In 1995, there were 4,020 teachers. Only 2,801 of them (69.6 percent) had been trained. There were 12,954 pupils, resulting in an overall pupil/teacher ratio of 35: 1.
(c) Secondary education
Secondary education in Zanzibar is divided into three sections: junior secondary, senior secondary and higher secondary. As noted above, junior secondary is a continuation of primary education within basic education. There were 90 junior secondary schools in 1995 with 20,000 pupils. The first year of junior secondary is an orientation year and concentrates on the improvement of the English language. At the end of the three years, pupils take the ‘end of basic education’ examination. About 60 percent of the pupils will have dropped out of the system by the end of 10 years of schooling.
Around 10 percent of total junior secondary pupils are selected into 14 senior secondary schools. While the proportion of boys and girls is almost the same in junior secondary, there are relatively more boys than girls in senior secondary. Only about 2 percent of those who take the ‘0’ level examinations are selected into higher secondary.
Finance for education
In the 1995/ 1996 financial year, the Ministry of Education was allocated 2.25 billion Tanzanian shillings for recurrent and capital expenditures. This was about 7.89 percent of the total government recurrent and capital expenditures and about 2.5 percent of the Gross Domestic Product (GDP). This appears to be a relatively low proportion compared with other developing countries.
Basic education receives about 70 percent of the total education budget. Over 90 percent of the recurrent budget goes to teacher salaries, while school supplies are allocated only 2 percent. Although no school fees are charged, parents and communities contribute to both the recurrent and capital financing of the education system. They buy school supplies for their children and they contribute towards the construction of schools.
Recent plans for educational reform
An Education Sector Review was carried out in 1995. The review pointed to a number of weaknesses in the education sector. Among them were the inefficiency of the system (both internal and external), the financial constraints, and the poor management of the education system at different levels. In order to address these problems, the government is in the process of drawing up a Five Year Master Plan (1996-2001). The issues addressed in the Master Plan are:
2 .

(a) Increasing access and equity. This involves expanding access to schools across all levels with the target of 100 percent gross enrolment at the primary level and 50 percent gross enrolment at the secondary level. Measures will be taken to reach the under-privileged and the disadvantaged, with special emphasis on girls and the disabled.
(b) ‘Improving the quality of education. This aims at providing an optimum learning environment in terms of relevant curriculum, providing learning materials, and improving the quality of teaching.
(c) Strengthening management skills. This covers management skills training at the national, regional and school levels.
Resulting policy concerns
Parents as well as the government have raised concerns about the problems identified in the Education Sector Review. Whether the programmes set down in the Master Plan will solve these problems depends on a number of policy issues. Among them are:
(i) Under the existing financial constraints in Zanzibar, should the government continue to be the major financial contributor to education and to what extent should parents and communities contribute? It is important to note here that effective implementation of the programmes in the Master Plan will need further examination of all aspects of school finance before decisions are taken concerning the balance of public/private funding of education.
(ii) The Zanzibar Education Master Plan has placed special emphasis on the improvement of the quality of basic education. In that context, the educational achievements of pupils will be monitored thoroughly and, therefore, it will be important to identify those inputs that contribute most to learning achievement.
(iii) Taking into account the situation, that the problems have been identified and that the appropriate strategies have been identified to solve them, how should priorities be made among all of them, and by whom?
A response to the policy concerns
Experience has shown that many educational policy decisions have been made in Zanzibar without ‘hard evidence’ being available concerning the various aspects of the problems that face the education system. This has often resulted in a trial-and-error approach that has, occasionally, resulted in major failures. The Master Plan has emphasized the need for research-based decision-making for further action. That is, the Master Plan has called for policy-makers to ensure that they base their policy decisions on research findings rather than anecdote or unsubstantiated opinion.
With the aim of putting the main ideas of the Master Plan into action, the Zanzibar Ministry of Education agreed to join eight other Ministries in Southern Africa in a co-operative educational policy research project co-ordinated by the International Institute for
3
Educational Planning (IIEP). This research project has become known as the Southern Africa Consortium for Monitoring Educational Quality (SACMEQ). At this point, DANIDA, which had been funding the Primary Education Programme in Zanzibar, concurred with Ministry officials on the overall importance of the project in identifying major inputs to education that have an impact on learning. Furthermore, the Ministry examined the research design and methodological procedures that were to be used by SACMEQ and these were found to be appropriate for developing guidelines for policy in Zanzibar.
The Ministry also needed baseline data about the basic conditions of schooling - as can be seen from the concerns expressed earlier in this chapter. The SACMEQ project was designed to gather these data and also to determine the relative effect of input variables on achievement. In these two important areas the SACMEQ project was opportune for Zanzibar.
The five main aims of SACMEQ’s initial project
The initial phase of the SACMEQ project commenced with a dialogue between the researchers and the key decision-makers within the Ministries of Education in each country. This dialogue provided a set of high-priority educational policy concerns that were then reviewed by the SACMEQ national research co-ordinators in a search for common themes. This review yielded five areas of policy concern which were then used to generate the following five main policy-related questions.
(a) What are the baseline data for selected inputs to primary schools?
(b) How do the conditions of primary schooling compare with the Ministry of Education’s own benchmark standards?
(c) Have educational inputs to schools been allocated in an equitable fashion?
(d) What is the level of reading achievement for Standard 6 pupils (at the upper-primary- school level) for the three main domains of reading literacy (narrative, expository and documents)?
(e) Which educational inputs to primary schools have most impact upon the reading achievement of Standard 6 pupils?
Not only were these aims appropriate for Zanzibar, but the co-operative nature of the project allowed the staff of the Ministry to learn how neighbouring countries used research to tackle important areas of educational policy. This type of capacity building within the Ministry provided direct benefits in the implementation of the Master Plan. It also allowed the personnel to learn the technical skills of sampling, instrument design, fieldwork procedures, data entry/cleaning, and computer-based data analysis. All of these skills are required to conduct high-quality, large-scale educational policy research. It was recognized that the acquisition of these skills was necessary if the Ministry was to be able to undertake a continuing programme of research that would monitor and evaluate the growth and performance of the Zanzibar education system.

Chapter 2
The conduct of the study
Introduction
This chapter describes the way in which the study was conducted in the sub-region and in Zanzibar. First, it describes the significance of the study for Zanzibar. Secondly, it describes the co-operative work undertaken by the participating countries of the Southern Africa Consortium for the Monitoring of Educational Quality (SACMEQ) in order to plan and implement the study in each country. Thirdly, it describes the instrument development, the sampling procedures, the data collection, data entry and cleaning exercises and, finally, presents an overview of the structure of this report.
Significance of the study
This study was designed to provide reliable infomration on selected indicators of educational inputs, conditions, and outcomes that are suitable for use by decision-makers when planning the improvement or revision of existing policies. The study included instrumentation that was suitable for collecting information to inform the Ministry, teachers, and parents about the reading-literacy achievement of Standard 6 pupils in 1995. The information provided by the study has therefore helped to focus the Ministry’s attention on what should be done to improve the current situation, and on the setting of priorities to enable Zanzibar to meet basic access and learning needs as set down by the Jomtien Conference in 1990. The results of the study have also been of interest to different international organizations which have been involved in funding various primary education programmes in Zanzibar.
At the level of researchers and planners, the study assisted in the development of procedures to identify what information to collect, and how this information should be analyzed and interpreted. In short, the project helped to enhance the research skills of the Ministry personnel in Zanzibar.
Co-operation with SACMEQ
In 1991 the IIEP collaborated with the Ministry of Education and Culture of Zimbabwe to conduct a research study on ‘Indicators of the quality of Education’. This study served as a model to be emulated in other countries of the region. In 1992 a course on ‘Data building and data management’ was organized by the IIEP in Harare to provide educational planners in the region with the technical skills and research materials required to undertake a national survey of primary schools. Further hands-on training in all aspects of computer-based data processing was provided to selected planners in the region at a workshop on ‘Data processing for policy report preparation’, held in Harare in September 1993.
At this seminar the participants prepared a proposal to launch a joint research project to monitor progress towards the achievement of the educational quality goals defined by the 1990 Jomtien conference on ‘Education for All’. This proposal was further developed in two
5

subsequent meetings, in Paris (July, 1994) and Harare (September, 1994). The data-collection instruments required for the project were developed and written in first-draft form to be trial- tested by the national research co-ordinators in their respective countries. At the same time, tables were designed which would later be used to summarize the results of the data analyses. The national research co-ordinators attending these meetings were from Ministries of Education and Culture in Kenya, Malawi, Mauritius, Namibia, Tanzania (Mainland), Zambia, Zanzibar, and Zimbabwe. The different stages of the instrument development (trial testing and data analyses) were conducted at more or less the same time in each country.
Instrument development
The instruments developed were: a pupil test of basic reading literacy; a pupil questionnaire; a teacher questionnaire; and, a school head questionnaire.
For the purposes of the study, reading literacy was defined as: ‘the ability to understand and use those written language forms required by society and/or valued by the individual’.
Such a definition was found to be general enough to accommodate the diversity of traditions and languages represented in the participating countries, but specific enough to provide some guidance for test construction. Writing ability was deliberately excluded from the definition, and therefore only a minimal amount of writing was required of students throughout the testing process.
The domains or types of reading-literacy materials included in the pupil reading test were concentrated on the following three dimensions.
(a) Narrative prose: Continuous texts which aimed to tell a story - whether fact or fiction. (b) Expository prose: Continuous text designed to describe, explain, or otherwise convey
factual information or opinion to the reader. (c) Documents: Structured information organized in such a way that pupils had to search,
locate and process selected facts rather than read every word of a continuous text.
After examining the syllabi for reading at Standard 6 level in all countries, a common framework or blueprint for the pupil reading test was developed. The blueprint was constructed by preparing a ‘skills by domain’ table. The three domains have been described above. The seven reading skills were obtained after exhaustive discussion of the most important skills mentioned in the reading syllabus for each country. This table has been reproduced as Table 2.1. There were 21 cells in the table and, in order to ensure that the test provided a balanced coverage of the required reading skills and the main reading domains, the number of items allocated for each was in proportion to the emphasis given to it across the syllabi. This was a difficult task because it was necessary to restrict the total number of items in the test to around 60 so as to avoid problems of pupil fatigue. In fact, following extensive trial-testing and further analyses of data from the final data collection, a final test of 59 items was prepared.
To illustrate, across the syllabi around one third of the emphasis was on ‘Narrative’ (and therefore 21 out 59 items were allocated for this domain), and within ‘Narrative’ around
6
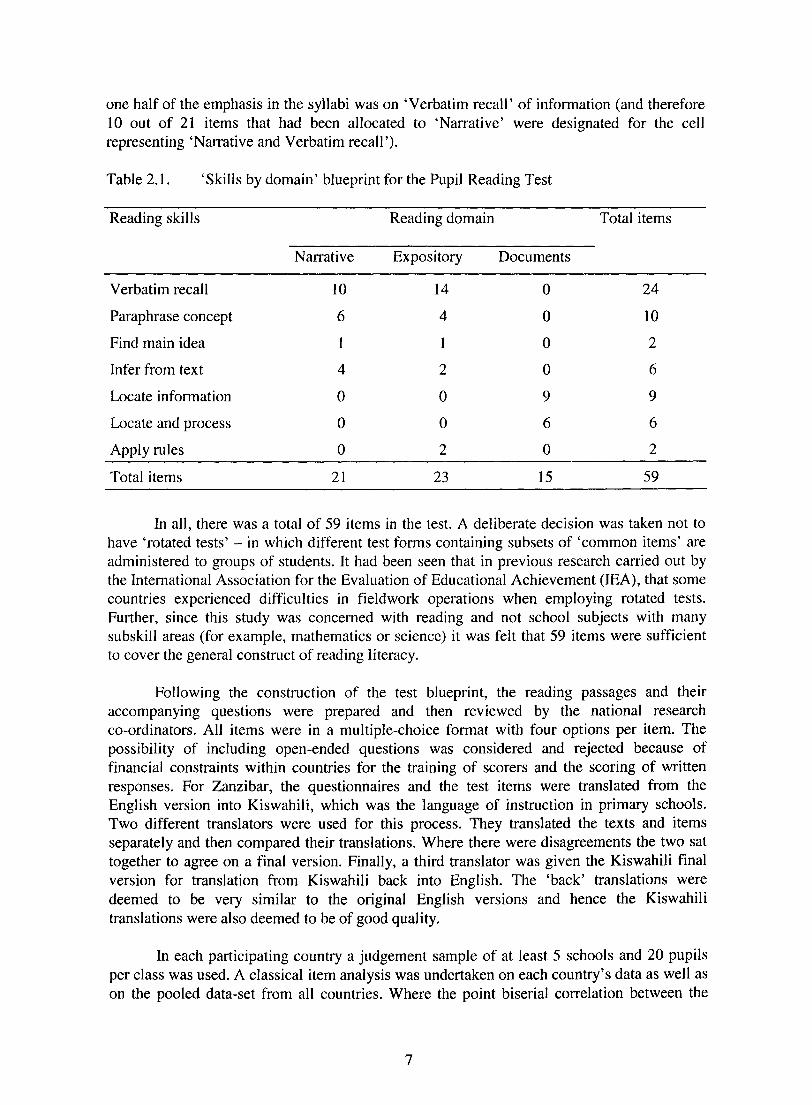
one half of the emphasis in the syllabi was on ‘Verbatim recall’ of information (and therefore 10 out of 21 items that had been allocated to ‘Narrative’ were designated for the cell representing ‘Narrative and Verbatim recall’).
Table 2.1. ‘Skills by domain’ blueprint for the Pupil Reading Test
Reading skills Reading domain Total i terns
Narrative Expository Documents
Verbatim recall 10 14 0 24
Paraphrase concept 6 4 0 10
Find main idea 1 1 0 2
Infer from text 4 2 0 6
Locate information 0 0 9 9
Locate and process 0 0 6 6
Apply rules 0 2 0 2
Total items 21 23 15 59
In all, there was a total of 59 items in the test. A deliberate decision was taken not to have ‘rotated tests’ - in which different test forms containing subsets of ‘common items’ are administered to groups of students. It had been seen that in previous research carried out by the International Association for the Evaluation of Educational Achievement (IEA), that some countries experienced difficulties in fieldwork operations when employing rotated tests. Further, since this study was concerned with reading and not school subjects with many subskill areas (for example, mathematics or science) it was felt that 59 items were sufficient to cover the general construct of reading literacy.
Following the construction of the test blueprint, the reading passages and their accompanying questions were prepared and then reviewed by the national research co-ordinators. All items were in a multiple-choice format with four options per item. The possibility of including open-ended questions was considered and rejected because of financial constraints within countries for the training of scorers and the scoring of written responses. For Zanzibar, the questionnaires and the test items were translated from the English version into Kiswahili, which was the language of instruction in primary schools. Two different translators were used for this process. They translated the texts and items separately and then compared their translations. Where there were disagreements the two sat together to agree on a final version. Finally, a third translator was given the Kiswahili final version for translation from Kiswahili back into English. The ‘back’ translations were deemed to be very similar to the original English versions and hence the Kiswahili translations were also deemed to be of good quality.
In each participating country a judgement sample of at least 5 schools and 20 pupils per class was used. A classical item analysis was undertaken on each country’s data as well as on the pooled data-set from all countries. Where the point biserial correlation between the
7

‘right’ answer and the total score was less than 0.20, then either the passage part, item stem, or option answer was improved or, if this was not possible, the item was dropped from the final test. Furthermore, if the point-biserial correlation between a ‘wrong’ answer and the total score was positive, then either the option was reworded or the item was dropped.
After the analysis, the reliability of the test score was considered to be too low and further piloting was undertaken on other items. After a second exercise of piloting extra questions, a final version of 59 items (as shown in Table 2.1) was agreed upon. At the same time, it was decided that a pooled item analysis of the final test data should be undertaken and that if there were items that were ‘misbehaving’ then they should be dropped, provided that the reliability of the full test of 59 items did not drop below 0.85. The reliability of the full test (KR - 20) in Zanzibar was 0.88. The reliabilities of the sub-scales were: narrative, 0.80; expository, 0.69; and documents, 0.64.
The questions for the different questionnaires were then prepared so as to address the data collection needs outlined in the blank tables that had been prepared at the initial design phase of the study. Where an indicator was required for a table, the specific variables required for the indicator were listed and then the questions required for each variable were prepared. The questions were ordered in a systematic fashion within the different questionnaires. The Pupil Questionnaire was trial-tested on the pupils in the judgement sample schools, the Teacher Questionnaire on the reading teachers of the judgement sample pupils, and the School Head Questionnaire on the school heads of the judgement sample schools. The response distributions were examined and, where necessary, revisions were made to the questions. Interviews were also held with teachers and school heads after they had completed their questionnaires in order to obtain their inputs concerning the clarity and relevance of each question. It should be noted that in one or two countries there were some questions that were considered not to be relevant for the country’s system but were, nevertheless, retained for the sake of comparability among all the SACMEQ countries.
Sampling
All sample designs applied in SACMEQ’S initial project were selected so as to meet the standards set down by the International Association for the Evaluation of Education Achievement (Ross, 1991). These standards require sample estimates of important pupil population characteristics to be (a) adjusted by weighing procedures designed to remove the potential for bias that may arise from different probabilities of selection, and (b) have sampling errors for the main criterion variables that are of the same magnitude or smaller than a simple random sample of 400 pupils (thereby providing 95 percent confidence limits for sample estimates of population percentages of plus or minus 5 percentage points, and 95 percent confidence limits for sample estimates of population means of plus or minus one tenth of a pupil standard deviation unit).
The desired target population in Zanzibar was ‘all pupils in Standard 6 in 1995 in the ninth month of the school year who were attending registered government or non- governmental schools in the country’. The numbers of pupils in the desired, excluded, and defined population have been presented in Table 2.2.
8

There were I1 ‘small’ schools excluded from the desired target population. These schools were excluded because they did not have more than 10 pupils in Standard 6. This resulted in 104 pupils being excluded out of 11,712 Standard 6 pupils. One other school in North Unguja region was excluded because it was a new school and the staff and pupils had not settled into a normal school routine.
Within each selected school, a simple random sample of 20 pupils was selected from among all Standard 6 pupils. The figure of 20 pupils was determined by the SACMEQ NRCs because conditions in many schools would not permit a valid administration of the reading test if more than 20 pupils per school were involved.
Table 2.2. The numbers of schools and pupils in the Desired, Excluded, and Defined populations for Zanzibar
Stratum Desired Excluded Defined
Schools Pupils Schools Pupils Schools Pupils
North Pemba 28 1670 3 35 25 1635
South Pemba 30 2233 2 32 28 2201
North Unguja 21 1385 3 37 18 1348
Urban/West 34 4639 34 4639
South Unguja 27 1785 4 20 23 1765
Zanzibar 140 11712 12 124 128 11588
The response rates from the sample have been recorded in Table 2.3. The rate for schools was 100 percent and the rate for pupils was 89.2 percent. The non-responding pupils were those who were absent on the day of testing. This absenteeism amounted to around 10 percent, which was higher than expected. However, it should be noted that the testing took place in a holiday period when the Ministry had opened the schools for the purpose of testing. This may well account for the high rate of absenteeism.
After drawing the sample of 20 pupils per school, sampling weights were used to adjust for the disproportionate allocation of the sample across the districts and also to account for the loss of student data due to absenteeism on the day of the data collection.
9
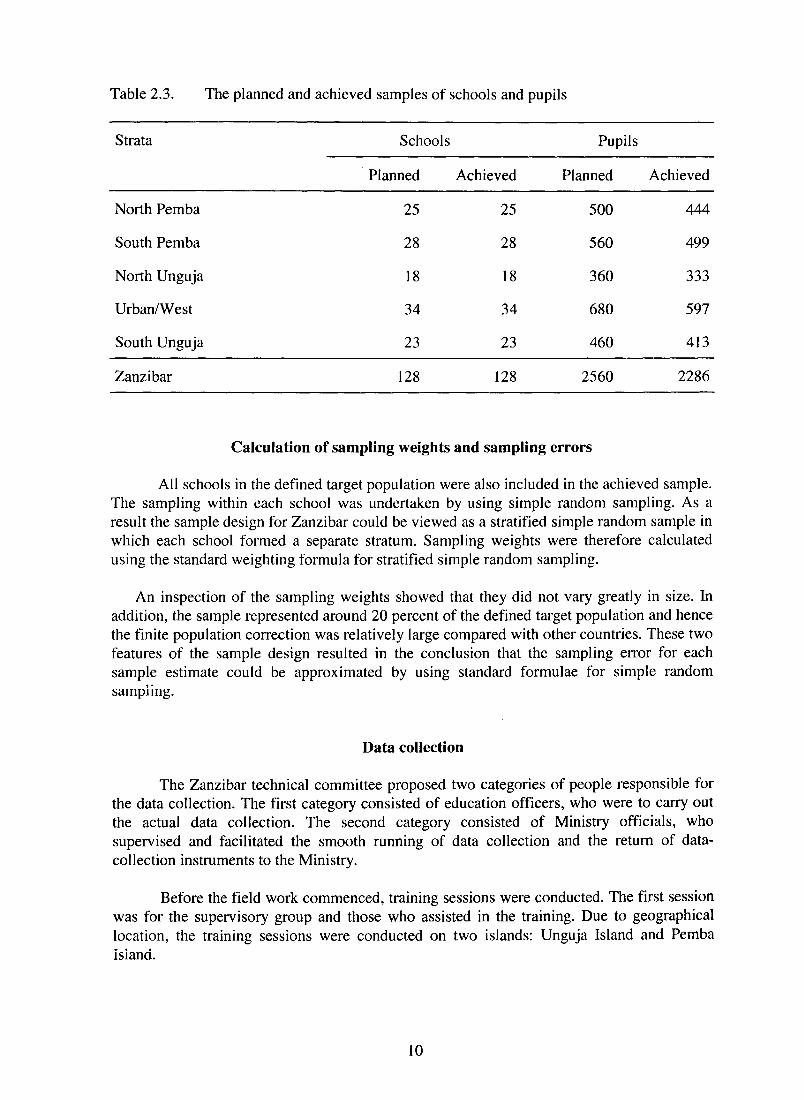
Table 2.3. The planned and achieved samples of schools and pupils
Strata Schools Pupils
Planned Achieved Planned Achieved
North Pemba 25 25 500 444
South Pemba 28 28 560 499
North Unguja 18 18 360 333
Urban/West 34 34 680 597
South Unguja 23 23 460 413
Zanzibar 128 128 2560 2286
Calculation of sampling weights and sampling errors
All schools in the defined target population were also included in the achieved sample. The sampling within each school was undertaken by using simple random sampling. As a result the sample design for Zanzibar could be viewed as a stratified simple random sample in which each school formed a separate stratum. Sampling weights were therefore calculated using the standard weighting formula for stratified simple random sampling.
An inspection of the sampling weights showed that they did not vary greatly in size. In addition, the sample represented around 20 percent of the defined target population and hence the finite population correction was relatively large compared with other countries. These two features of the sample design resulted in the conclusion that the sampling error for each sample estimate could be approximated by using standard formulae for simple random sampling.
Data collection
The Zanzibar technical committee proposed two categories of people responsible for the data collection. The first category consisted of education officers, who were to carry out the actual data collection. The second category consisted of Ministry officials, who supervised and facilitated the smooth running of data collection and the return of data- collection instruments to the Ministry.
Before the field work commenced, training sessions were conducted. The first session was for the supervisory group and those who assisted in the training. Due to geographical location, the training sessions were conducted on two islands: Unguja Island and Pemba Island.
10
The survey required school heads to undertake some homework before the questionnaires were administered in order to answer some of the questions. Letters were therefore sent to each school head one week in advance of the data collection so that there would be enough time for this preparatory work. Further, the data collectors visited the schools a day early in order to undertake the sampling of the 20 pupils and to arrange for the testing room.
Each data collector was given 20 pupil booklets, (plus two spares) and one or more Teacher Questionnaires, depending on the number of teachers teaching Kiswahili at Standard 6 level in the particular school. Each data collector was also given one School Head Questionnaire. Because of the election preparation in which some school heads were involved, the assistant school heads filled in the questionnaire for some of the schools.
All completed questionnaires were returned to the head office of the Ministry on the same day. The conduct of the study went according to plan. However, as expected, some data collectors were more thorough than others. The plan of having supervisors did help in clarifying some mistakes, by solving problems on the spot. Data collectors were asked to write a brief report on the fieldwork.
Data entry and cleaning
Once the data-collection instruments were returned to the Ministry they were checked to ensure that the instruments for each pupil, each teacher, and each school head were there. Each questionnaire was checked for completeness because it was intended that there should not be any missing data. A team of 10 data-entry staff had been trained by the National Research Co-ordinator. One personal computer was available to be used full-time for each data entry clerk.
The Data Entry Manager (DEM) computer software developed at the IIEP (Schleicher, 1995) was used to manage the data entry. This software was adapted specifically for the entry of SACMEQ data and no problems were encountered in the installation and use of this software.
The data entry took four weeks. All data were entered once and a sample of schools was taken for double entry. No major problems were encountered but in some schools, the data collector had mixed up identification codes and these had to be corrected. After the first stage of data cleaning, the data were returned to IIEP in January, 1996.
Conclusion
This chapter has described the procedures undertaken in order to conduct the Zanzibar component of the first educational policy research project of the ‘Southern Africa Consortium for Monitoring Educational Quality’. Detailed explanations were given of the development of instrumentation, the sampling methods, and fieldwork operations.
The following five chapters of this report concentrate on the educational policy implications of the results arising from the data analyses. Each of these chapters addresses
11

one of the five main policy questions described in the first chapter. Chapter 3 presents the results from the analysis of baseline data for selected inputs to primary schools. Chapter 4 examines the results on how the conditions of schooling in Zanzibar compare with the Ministry’s own benchmark standards. Chapter 5 analyzes the extent to which additional inputs to schools have been allocated in an equitable fashion among and within regions. Chapter 6 presents the reading test results. Chapters 3 to 6 include a series of policy suggestions based on the results presented in them. Finally, Chapter 7 presents an ‘Agenda for Action’ which summarizes the policy suggestions, classifies them in terms of low to high costs, and indicates whether they involve short- or long-term action.
12

Chapter 3
What are the baseline data for selected educational inputs to primary schools in Zanzibar?
Introduction
The aim of this chapter is to present some examples of baseline data for inputs to Zanzibar primary schools with the main aim of establishing a descriptive account of the pupils, their teachers, and their schools. These data are presented for two reasons. The first is that they provide a ‘context’ for the later analyses to be undertaken in this report. The second is that over time the levels and distributions of the data may well change and when Zanzibar undertakes a similar Standard 6 reading survey in the future, it will be possible to compare the extent to which such context variables have changed. High-quality data that address the two important areas of level and ‘distribution’ provide educational planners with a sound means of mapping the general evolution of the education system and also offer tools for the identification of existing and emerging problems. The first educational policy suggestion to be presented in this report therefore looks to the future in acknowledgement of the importance of establishing data collections which can be used to study trends over time.
Policy Suggestion 3.1: The Ministry should plan to undertake a follow-up survey of the same target population employed during SACMEQ’s initial project in order to examine changes in important educational indicators over time.
A note on the interpretation of the data analyses
Before presenting the results, two points should be stressed. The first is that the variables presented in this chapter are a subset of all of the variables for which data were collected. A separate publication containing descriptive statistics for all variables in the study will be made available by the Ministry to interested readers.
The second point is that it is very important to interpret each statistic in association with its sampling error. Where a percentage or a mean is presented for a sub-group of pupils (such as for regions) then the standard error will be greater than for the sample as a whole. This occurs, in part, because the sample sizes for sub-groups are smaller than the total sample size.
To illustrate, consider the first column of entries in Table 3.1. The average age of pupils in months at the time of the data collection is presented separately for each region and for Zanzibar overall. The standard error (SE) of each average has also been presented. For the first region, North Pemba, the average student age was 183.2 months at the time of data collection and the standard error was 1.53 months. That is, we can be 95 percent certain that the average age of the population of Standard 6 pupils in North Pemba was 183.2 + 2( 1.53). In other words, we can say that there are 19 chances in 20 that the population value was between 180.1 months and 186.3 months.
13

It is important to note that the standard error for each estimate changed from region to region. This variation was caused by two main factors: the differences in the distribution of pupils among schools within the region, and the size and structure of the sample within each region. The smallest standard error of 0.46 months occurred for the sample estimate of the average pupil age for the whole population of Standard 6 pupils in Zanzibar. This result was to be expected because the overall estimate was based on much larger samples of schools and pupils than the corresponding estimates for any single region.
In interpreting the values in Table 3.1 it should be noted that the percentages and means are presented in terms of pupils. That is, pupils were the units of analysis even though some variables described in this report referred to teachers and schools. Where a percentage for a variable that describes teachers has been presented, the percentage should be interpreted as ‘the stated percentage of pupils were in schools with teachers having the particular characteristic’. The situation for schools is similar. A percentage for a variable that describes schools should be interpreted as ‘the stated percentage of pupils were in schools with the particular characteristic’.
Specific policy questions related to educational inputs
As a starting point, in order to guide the data analyses, the very broad educational policy question posed in the title of this chapter was divided into six specific questions. These six questions were used to develop a more structured response to the educational policy issues surrounding the main question.
(a) What were the characteristics of Standard 6 pupils? (b) What were the characteristics of Standard 6 teachers? (c) What were the teaching conditions in primary schools? (d) What aspects of the teaching function designed to improve the quality of education were
in place? (e) What was the general condition of school buildings? (f) What level of access did pupils have to books?
What were the characteristics of Standard 6 pupils?
A wide range of information about pupil characteristics has been presented in Tables 3.1 and 3.2. Information has been listed concerning the age and sex of the pupils in the sample as well as the extent to which the pupils received help with their homework, the number of books they had in their homes (or the place where they stayed during the school week), the wealth of the homes as measured by the number of possessions they had, the regularity of eating meals, the use of the Kiswahili language, the number of days that they were absent in the month before data collection, the percentage of pupils who were taking extra lessons, and, finally, the amount of grade repetition.
(a) Age of Standard 6 pupils
The official age of entry to Zanzibar schools is seven years. By Standard 6 most pupils should be aged 12 to 13 years, or 144 to 156 months. In Table 3.1, it can be seen that the
14

average age of a Standard 6 pupil in Zanzibar during the first week of the tenth month of the school year was 174.0 months or 14 years and 6 months. This was around two years older than the average expected from the official starting ages. The range within Standard 6 (some four to five years) was also wide. There could be two explanations for these results. First, due to a shortage of classrooms, over 50 percent of the children start school when they are eight to nine. years of age. Second, there are many older children in Standard 6 classes as a direct result of the high rate of grade repetition which occurs in lower primary classes (about 25.0 percent).
In 1991, the gross enrolment rate for primary schools was 65 percent (Buretta, 1994). Although Zanzibar is a small island there are still insufficient classrooms in primary schools to allow all children access to primary school. At the same time, grade repetition has kept classrooms full, if not overcrowded, especially in the beginning standards in primary school.
In a number of countries it has been shown to be possible to mobilize a community effort in order to add more classrooms to schools. If this approach was adopted in Zanzibar then it should be possible to plan for a gradual expansion of enrolments into Standard 1 at the age of seven years. A solution to the problem of low participation rates will need to commence with an examination of census data in order to identify the additional number of classrooms needed in each school. The Ministry must then ensure that it plans for the needed trained teachers for these extra classrooms as well as for the teaching/learning materials needed. The District Education Officers (DEOs) could also visit homes of non-enrolled children in school catchment areas in order to verify the census statistics and discover any other reasons why children are not enrolling in school. These visits could be used to mount a campaign to persuade communities to build and maintain such classrooms.
At the same time, the policy of grade repetition needs to be examined as soon as possible to see whether this tradition has more harmful effects than it has benefits. Whatever the results of this examination, it would appear that, given the gross enrolment rate for primary schools of around 65 percent in 1991, an expansion of participation rates in an environment of limited classroom space will automatically demand an immediate policy shift to reduce grade repetition levels.
Policy Suggestion 3.2: The Ministry should establish a Special Commission to review current practices related to school starting age, repetition rates, and participation rates, with a view to bringing forward policies that will provide a more suitable approach to achieving ‘Education for All’.
Policy Suggestion 3.3: The Ministry should, as a matter of urgency, identify the number of classrooms required in each school in order to enrol all primary-school-aged children and mount a campaign for communities to work with government to build and maintain these classrooms.
15
-

16

(b) Gender distribution
The percentage of girls in Standard 6 has been presented as the second set of figures in Table 3.1. For Zanzibar, the gender distribution of pupils in Standard 6 was reasonably well balanced, with 53.5 percent girls and 46.5 percent boys. At the regional level, there were some minor deviations; for example, North Pemba had 43.3 percent girls and 57.6 percent boys whereas Urban/West district had 57.5 percent girls and 42.5 percent boys. In the other regions the differences were not significant when sampling error was taken into account. However, the regional officers should conduct small studies in North Pemba and Urban/West in order to discover why there are fewer girls than boys in Standard 6 in North Pemba, whereas the opposite is the case in Urban/West.
Policy Suggestion 3.4: The Ministry should conduct two case studies, using the regional education officers in North Pemba and Urban/West, in order to validate gender differences observed in participation rates, and then identify the causes of these disparities with a view to taking immediate action to achieve equity in this area.
(c) Books in the home
The number of books at home can be regarded as a reading resource. From other studies (Elley, 1992) it was found that the availability of books for children to read was highly conducive to better levels of reading achievement. The pupils in the survey were asked to indicate the approximate number of books in their homes. The question had the following categories:
1 = no books in the home, 2 = 1 - 10 books in the home, 3 = 1 l-50 books in the home, 4 = 5 I- 100 books in the home, 5 = 10 l-200 books in the home, 6 = 201 or more books in the home.
The mid-point of each value range above was taken in order to compute the number of books in the home. For the last category a value of 250 was used. From Table 3.1 it can be seen that the average Standard 6 pupil in Zanzibar came from a home where there were 15.4 books. Overall, it seems that most pupils did not have many books in their homes. In fact, an examination of the frequency distribution showed that 29.8 percent were from homes where there were no books at all. Just over half (56.8 percent) of the Standard 6 pupils came from homes where there were 10 or fewer books. It was in the Urban/West region that pupils came from homes with slightly more books (l&9), while in the North Pemba region there were, on average, fewer books (9.0).
There is an obvious need in Zanzibar to expand children’s access to books in order to make up for limited availability in homes. Perhaps this could be achieved by some relatively less costly approaches such as the use of mobile libraries. The borrowing from these mobile libraries could be free - but a system of parents having to pay for damaged books could also be instituted in order to provide an incentive for keeping books in good condition, thereby extending their useful life.
17

Policy Suggestion 3.5: Given the low numbers of books in the homes of many children and the known relationship between book availability and reading achievement, the Ministry should encourage children’s mobile libraries to visit those areas of Zanzibar where homes have relatively few books.
(d) Possessions in the home
Standard 6 pupils were asked if they had the following 14 items in the home: daily newspaper, weekly or monthly magazine, radio, television set, video-cassette recorder, cassette player, telephone, refrigerator, car, motorcycle, bicycle, electricity, piped water, and table to write on. Each pupil was given a score of ‘0’ if they did not have the item and a score of ‘ 1’ if they had the item. These scores were summed to form an ‘Index of possessions’ which reflected the material wealth of the home. A pupil from a home with none of these items received a score of ‘0’ and a pupil from a home with all of these items received a score of 14.
The national mean of 4.0 presented in Table 3.1 indicated that the average Standard 6 pupil in Zanzibar was from a home having about four of the selected items. The standard deviation was 3.1 but 12.6 percent of the pupils were from homes with none of the possessions, 24.4 percent from homes with one or two of the possessions, and 80 percent of the pupils were from homes with only six or fewer of the possessions. Thus the distribution was highly skewed. Pupils in rural areas tended to be from homes with fewer possessions than was the case for pupils in urban areas. The Urban/West region had a mean of 5.3, indicating that the average Standard 6 pupil in this region came from a home that had at least five items. All of the remaining four regions, which were rural or semi-rural, had means of around a little more than three.
(e) Index of regular meals
It has often been pointed out (Pollitt, 1990) that poor nutrition results in a lack of concentration and perseverance in schools. Regularity of meals was therefore seen as a factor likely to influence the acquisition of reading skills. The ‘Index of regular meals’ was a measure on a IO-point scale that assessed the number of meals that pupils reported they ate in a week. These meals were breakfast, lunch and dinner. If a pupil ate no meals at all, the score was 3, but if a pupil ate all meals the score was 12.
In Table 3.2 the means and standard errors of sampling for the ‘Index of regular meals’ are presented. The national mean was 10.6 and there were no major differences between the regions on this index.
18

(f) Parental education
Questions were asked in the Pupil Questionnaire about the level of education that the pupils perceived that each of their parents had received. The information was coded as follows:
Did not go to school = 1 Completed some of primary school = 2 Completed all of primary school = 3 Completed some of secondary school = 4 Completed all of secondary school = 5 Completed some education/training after secondary school = 6
The answers for each child’s mother and father were summed to form an index of parental education. From Table 3.1 it may be seen that the average of the index of parental education for Zanzibar overall was 5.5.
In Table 3.1 it can be seen that there were substantial differences between the Urban/West region and the other regions - most of which were rural. These results reflected the commonly observed phenomenon of more educated people wishing to live in urban areas because of enhanced job opportunities related to industrial and commercial activities, better living amenities, and schools for their children.
(g) Speak Kiswahili at home
Kiswahili is the medium of instruction in schools and the language spoken outside school by all children - with variation in dialects. The reading test used in this study was in Kiswahili, and therefore it was expected that all pupils would have no problem in understanding the test and that the language of the test would not influence pupil performance.
In Table 3.2 it can be seen that the percentage of pupils answering that they spoke Kiswahili at home was 94.2 percent. Zanzibar is a monolingual country and one would have expected nearly 100 percent of pupils to say that they spoke Kiswahili. There was, however, some variation across the regions. The percentage of pupils who reported that they spoke Kiswahili in the Unguja rural regions was somewhat lower than in the Urban/West region. The reasons for these differences may be because of variations in dialects spoken in different areas of Zanzibar. These differences should not be ignored or taken as trivial. Curriculum planners will need to consider such differences if they are to strengthen the teaching of Kiswahili in all regions of Zanzibar. In particular, it would be beneficial if all schools adopted the use of the standardized form of Kiswahili that the Ministry has adopted for textbook production.
Policy Suggestion 3.6: The Ministry should undertake a review of the use of Kiswahili dialects in schools and then explore approaches to encouraging the use of standardized Kiswahili in school.
19

(h) Days absent in previous month
In Zanzibar pupil absenteeism has long been recognized as a problem. It is likely that pupils who are often absent will learn less and hence their levels of reading literacy will be unsatisfactory. The pupils were asked how many days they had been absent in the month before they were tested. As can be seen from Table 3.2, the average number of days of absenteeism was 1.7 for Zanzibar as a whole, but in the Urban/West region it was 2.4 days.
This ‘self-reported’ rate of absenteeism at the national and regional levels seemed quite low in that these figures were much lower than the Ministry thought they would be. It is also a fact that about 10 percent of the pupils were absent on the day of the data collection, a figure that provides a better indication of what is widely known about the normal absenteeism rate in schools.
Policy Suggestion 3.7: The Ministry should conduct a small study on the extent of absenteeism in schools and the reasons for it. It should then establish regulations that lower absenteeism. It is suggested that this study be conducted in 1998 and the new regulations be put in place in 1999.
Table 3.2. The percentages, means, and sampling errors for selected pupil background characteristics (school related)
Region Speak Days Extra Homework Grade Kiswahili absent lessons repetition
% SE Mean SE % SE % SE % SE
North Pemba 93.3 1.32 1.3 0.17 43.2 2.61 13.2 1.78 24.4 2.26
South Pemba 92.5 1.32 1.1 0.10 44.8 2.49 12.3 1.65 26.1 2.20
North Unguja 90.9 1.80 1.0 0.16 52.6 3.13 16.9 2.36 29.6 2.86
Urban/West 96.7 0.56 2.4 0.20 43.0 1.55 16.2 1.15 22.4 1.30
South Unguja 9 1.9 1.71 1.7 0.21 43.6 3.10 15.8 2.28 29.5 2.86
Zanzibar 94.2 0.48 1.7 0.10 44.5 1.04 15.1 0.75 25.0 0.90
(i) Extra lessons
The pupils were asked if they took extra lessons in school subjects outside of school hours. Extra lessons have increased in recent years in both urban and rural areas. However, in rural areas it has long been a tradition that most schools give extra lessons to their pupils outside of school hours. In the urban areas the extent of this practice has caused major concern with respect to questions such as: Who exactly is receiving the tuition? How much of the extra tuition is free and how much is paid for? Are some pupils disadvantaged because they are unable to participate in extra tuition due to lack of funds for payment?
20
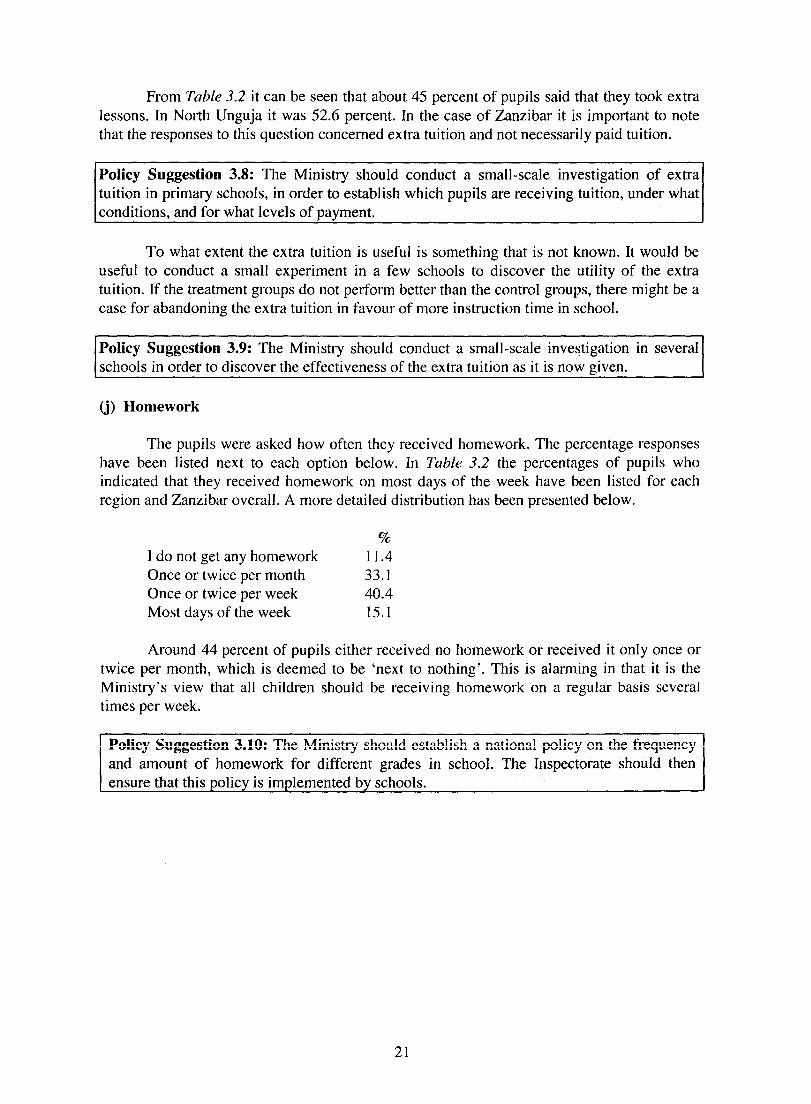
From Table 3.2 it can be seen that about 45 percent of pupils said that they took extra lessons. In North Unguja it was 52.6 percent. In the case of Zanzibar it is important to note that the responses to this question concerned extra tuition and not necessarily paid tuition.
Policy Suggestion 3.8: The Ministry should conduct a small-scale investigation of extra tuition in primary schools, in order to establish which pupils are receiving tuition, under what conditions, and for what levels of payment.
To what extent the extra tuition is useful is something that is not known. It would be useful to conduct a small experiment in a few schools to discover the utility of the extra tuition. If the treatment groups do not perform better than the control groups, there might be a case for abandoning the extra tuition in favour of more instruction time in school.
Policy Suggestion 3.9: The Ministry should conduct a small-scale investigation in several schools in order to discover the effectiveness of the extra tuition as it is now given.
(j) Homework
The pupils were asked how often they received homework. The percentage responses have been listed next to each option below. In Tubfe 3.2 the percentages of pupils who indicated that they received homework on most days of the week have been listed for each region and Zanzibar overall. A more detailed distribution has been presented below.
I do not get any homework Once or twice per month Once or twice per week Most days of the week
% 11.4 33.1 40.4 15.1
Around 44 percent of pupils either received no homework or received it only once or twice per month, which is deemed to be ‘next to nothing’. This is alarming in that it is the Ministry’s view that all children should be receiving homework on a regular basis several times per week.
Policy Suggestion 3.10: The Ministry should establish a national policy on the frequency and amount of homework for different grades in school. The Inspectorate should then ensure that this policy is implemented by schools.
21

(k) Grade repetition
The issue of grade repetition was discussed earlier in the context of an analysis of the average age of Standard 6 pupils. In the final column of figures in Table 3.2 the percentages of Standard 6 pupils who repeated at least one grade or standard have been listed for Zanzibar and for each of the five regions. The actual percentages for all of Zanzibar to the question were as follows:
% I have never repeated 75.0 I have repeated once 17.5 I have repeated twice 6.1 I have repeated three or more times 1.4
The percentages of those having repeated at least once for each of the regions showed some variation, from 22.4 percent in Urban/West region to 29.6 and 29.5 percent in North Unguja and South Unguja. At the national level, 25 percent of the pupils had repeated at least one grade and this was a very high figure. Grade repetition is a complex educational issue. There are some studies that suggest that the more there is grade repetition, the larger the standard deviation of scores becomes for an age group, but the smaller it becomes for a grade group. In other words, in Zanzibar it could be the case that for an age group the range of scores increases over time but that within a standard the range becomes smaller over time. However, there are other studies that suggest that those who repeat actually learn more than they would if there was automatic promotion. In Zanzibar, it would be useful to find out exactly the criteria applied for determining grade repetition and if it is really required. This issue calls for an explanation to establish factors relating to repetition and an identification of the advantages and disadvantages.
Policy Suggestion 3.11: The Ministry should undertake a study to examine the criteria used by schools to identify pupils for grade repetition and also to test whether repetition is linked with improved performance by the pupils who repeat.
What were the characteristics of Standard 6 teachers?
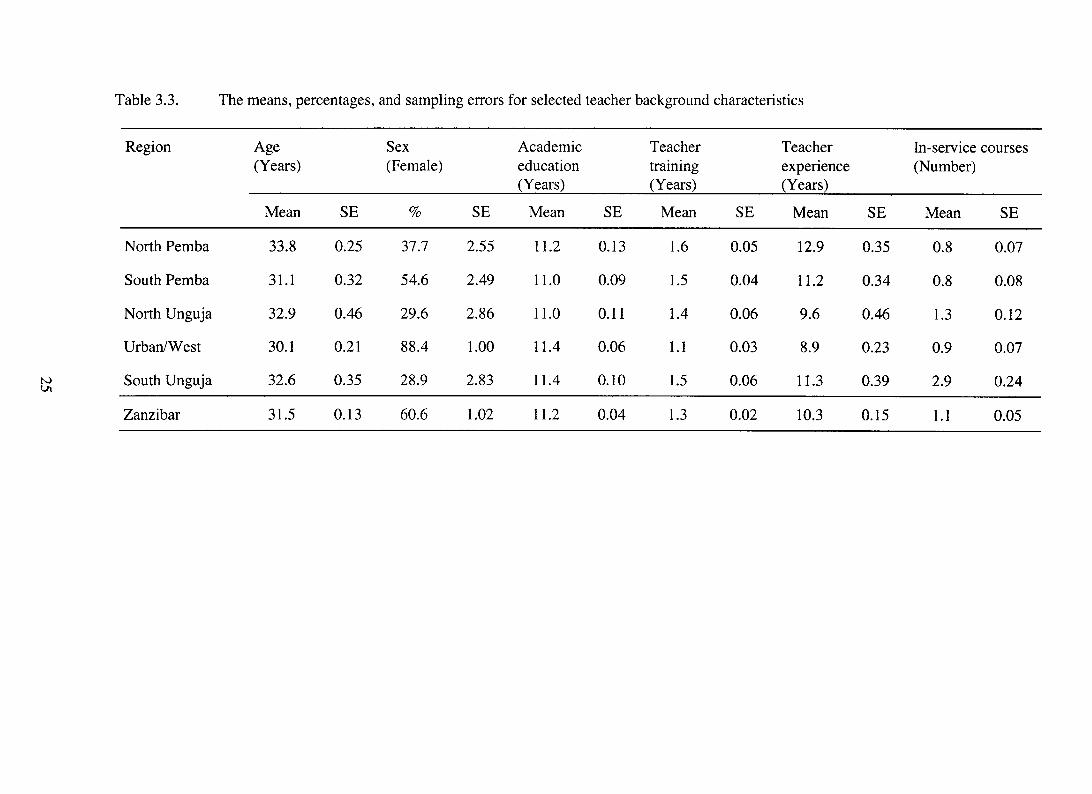
Several important characteristics of teachers were also measured. These concerned the age of teachers, sex of teachers, academic qualifications, professional qualifications, years of teacher experience and number of in-service courses attended. The results of these analyses have been reported in Table 3.3.
(a) Age of teachers
The average ages of Standard 6 teachers in the different regions and in Zanzibar as a whole have been presented as the first variable in Table 3.3. The average age for teachers in Zanzibar was 3 1.5 years and there was little variation among the regions.
22

(b) Sex of teachers
Just over 60 percent of Standard 6 teachers in Zanzibar were female. In Table 3.3 it may be seen that there was a considerable variation across regions. In Urban/West, 88.4 percent of the teachers were female. On the other hand, the two Unguja regions had only about 30 percent female teachers.
A point of concern here was the concentration of female teachers in the Urban/West District. A possible reason for this situation is the movement of married female teachers from rural to urban areas. Another possible reason could be the low ratio of girls completing their education in rural areas, and hence fewer girls qualifying to become teachers, since most teacher candidates come from the urban areas.
In many countries, female teachers at the primary-school level obtain higher levels of reading achievement with their pupils than do male teachers (Elley, 1992). The Ministry should take this into account when posting teachers to schools. There should also be some reward system for female teachers teaching in rural areas. To summarize, there is a need for the Ministry to explore policy options that will narrow the teacher sex discrepancy among the regions.
Policy Suggestion 3.12: The Ministry should design a policy for the distribution of teachers to schools and develop a reward system for female teachers to teach, and continue to teach, in rural schools.
(c) Years of academic education
The teachers were asked to record the number of years (excluding grade repetition) of academic education (for example primary, secondary, and post-secondary education) that they had received. From Table 3.3 it can be seen that the average Standard 6 pupil in Zanzibar had a teacher who had received 11.2 years of education (11 years of basic education and some post-basic secondary education to ‘0’. level). There was little variation among regions on this variable.
(d) Years of teacher training
In Zanzibar, primary-school teachers should normally have attended a two-year teacher training course, or its equivalent, before becoming qualified. The average number of years of teacher training for Standard 6 teachers has been presented in Table 3.3. For Zanzibar overall it was 1.3 years. The actual percentages of pupils with teachers having different lengths of teacher training were as follows:
% I did not receive any teacher training 16.8 Short course of less than one year’s duration 17.0 Total equivalent of one year’s duration 16.1 Total equivalent of two years 46.7 Total equivalent of three years 1.4 More than three years 2.0
23

According to these figures some 50 percent of pupils had teachers who had less than the required number of years of teacher training. This is an unsatisfactory state of affairs and warrants immediate action by the Ministry. In the Urban/West region the situation was the worst, where the average number of years of teacher training was only 1.1 years.
I-
Policy Suggestion 3.13: The Ministry should identify the unqualified Standard 6 teachers and then establish a long-term plan to provide them with supplementary training up to the official reauirement of two Years of teacher education.
(e) Years of teaching experience
The average number of years of teaching experience for Standard 6 teachers has been given in Table 3.3. The average for Zanzibar was 10.3 years and the standard deviation was 7 years. In North Pemba the average number of years of teaching experience was around 13 years, while in South Unguja and South Pemba it was around 11 years. In the Urban/West and North Unguja regions the figures were around 9 years and 10 years, respectively.
24
25

(f) Number of in-service courses attended
The teachers were asked to report the number of in-service courses that they had attended during their teaching careers. The average for the whole country was 1 .l, but for South Unguja it was 2.9 courses. In the past, in-service training was conducted on an ad hoc basis. As a consequence the number of in-service training courses attended by teachers often does not match with the years of teaching experience that they have had. Some initial planning has commenced to improve this situation - but more effort is clearly needed in this area. Since in-service training helps to update and improve teachers’ professional knowledge and skills, it is important that all teachers should be given access to it on a continuing basis.
Policy Suggestion 3.14: The Ministry should identify all teachers not having undergone in-service teacher training, identify the areas in which in-service training is most needed, and then arrange for the teachers to be given the required training, with an incentive package provided after successful completion of the training.
What were the teaching conditions in the schools?
In all countries that participated in SACMEQ’S initial project there was a great deal of interest in the resources that were made available to teachers for their teaching, and the availability of basic supplies and classroom furniture. In order to assess these two important dimensions, Standard 6 teachers were given a checklist of items which they used to indicate the availability of a range of classroom resources. The checklist contained eight items covering teaching materials and five items covering classroom furniture. These items and the percentages of Standard 6 pupils in classrooms with each of these items have been listed in Table 3.4.
(a) Teaching materials and classroom furniture
The results presented in Table 3.4 indicated that there was a major shortage of teaching materials and classroom furniture in Zanzibar schools. It was incredible to find that 21 percent of Standard 6 pupils were in classrooms where there was 110 chalk. Only 21 percent of pupils had teachers with an available Kiswahili dictionary. Slightly more classrooms (54.6 percent) had a map of Africa than a map of Zanzibar (42.3 percent).
Availability and access to a classroom library or book comer for Standard 6 pupils were very low (14.4 percent). This finding, though not surprising, was disturbing because a number of research studies have shown that increasing pupils’ access to books by making them ‘closer’ to ordinary classroom activities is a key factor in improving pupil literacy levels (Postlethwaite and Ross, 1992). Only around 75 percent of pupils were in classrooms where a usable chalkboard was available. Storage space in terms of a cupboard and bookshelves was not found in most classrooms. Furthermore, nearly half of Standard 6 pupils had teachers who did not have teachers’ tables or chairs.
26

Table 3.4. Percentage of Standard 6 pupils in classrooms with selected teaching materials and classroom furniture
Item Percentage with item SE
Teaching materials Chalk A wall chart of any kind A map of Zanzibar A map of Africa A world map A classroom library or book comer An atlas A Kiswahili dictionary
79.0 0.84 31.0 0.96 42.3 1.03 54.6 I .04 43.5 1.04 14.4 0.90 54.3 1.04 21.2 0.85
Classroom furniture A usable chalkboard A cupboard One or more bookshelves A teacher table A Teacher Chair
75.8 0.89 29.1 0.95 15.9 0.77 54.1 1.04 58.6 1.03
The teacher responses concerning each set of resources were combined to form two scales. The ‘Teaching materials index’ was constructed by adding up the number of teaching material items that each teacher reported out of a total of eight items. The ‘Classroom furniture index’ was constructed by adding up the number of items of classroom furniture that each teacher reported out of a total of five items. The mean scores for these indices across regions, and for Zanzibar overall, have been reported in TabEe 3.5.
At the national level, the average Standard 6 pupil was in a classroom with 3.4 teaching material items out of a maximum of eight, and 2.3 classroom furniture items out of a maximum of five. Given the very basic nature of each item, these results confirm the pattern discussed above of very low levels of resources in Zanzibar’s primary schools.
North and South Pemba were relatively underprivileged for teaching materials and North Pemba and North Unguja were low on furniture. Without bookshelves and a cupboard, there is nowhere for storing books - either teacher books, textbooks, or reading, or supplementary books. In those classrooms without usable chalkboards (over 20 percent of pupils are in such classrooms), teaching must be very difficult, to put it mildly!
27

Table 3.5. Means and sampling errors for the Index of teaching materials and the Index of classroom furniture
Region Teaching materials index
Classroom furniture index
North Pemba
Mean SE
2.7 0.08
Mean
1.9
SE
0.05
South Pemba 2.9 0.09 2.1 0.06
North Unguja 4.2 0.12 1.7 0.08
Urban/West 3.3 0.07 2.6 0.05
South Unguja 4.0 0.15 2.9 0.07
Zanzibar 3.4 0.05 2.3 0.03
(b) Pupils’ books and materials in the classrooms
A textbook, an exercise book, a notebook, a pencil or a ballpoint pen - all of these items represent basic equipment that is needed for pupils to learn in school. Information has been presented in Tables 3.6 and 3.7 concerning whether pupils lacked this equipment.
In Zanzibar as a whole, about 90 percent of pupils did not have Kiswahili readers or textbooks, which indicated that only one in ten pupils had this item. This result represented an alarming state of affairs. In the Urban/West region, only 6 percent had Kiswahili readers or textbooks. This lack of readers and textbooks, coupled with a lack of classroom library books, creates an extremely difficult teaching/learning situation, and in order to improve this, a massive effort will be needed by the whole Zanzibar society.
An exercise book was defined as ‘a book for writing that is marked by the teacher’ and a notebook as ‘a book that is used for writing and is not marked by the teacher’. The figures in Table 3.6 illustrated that around 40 percent of the pupils did not have exercise books and that around 60 percent did not have notebooks.
28
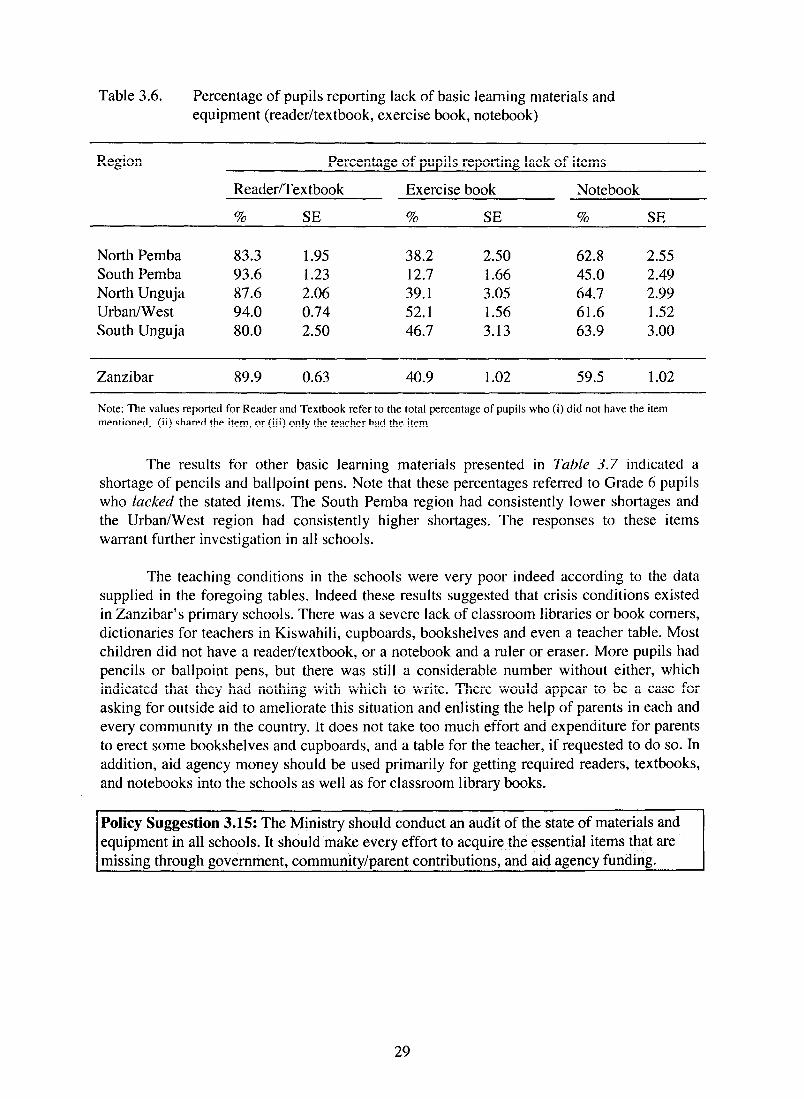
Table 3.6. Percentage of pupils reporting lack of basic learning materials and equipment (reader/textbook, exercise book, notebook)
Region Percentage of pupils reporting lack of items
Reader/Textbook Exercise book Notebook
% SE % SE % SE
North Pemba 83.3 1.95 38.2 2.50 62.8 2.55 South Pemba 93.6 1.23 12.7 1.66 45.0 2.49 North Unguja 87.6 2.06 39.1 3.05 64.7 2.99 Urban/West 94.0 0.74 52.1 1.56 61.6 1.52 South Unguja 80.0 2.50 46.7 3.13 63.9 3.00
Zanzibar 89.9 0.63 40.9 1.02 59.5 I .02
Note: The values reported for Reader and Textbook refer to the total percentage of pupils who (i) did not have the item mentioned, (ii) shared the item, or (iii) only the teacher had the item.
The results for other basic learning materials presented in Table 3.7 indicated a shortage of pencils and ballpoint pens. Note that these percentages referred to Grade 6 pupils who lacked the stated items. The South Pemba region had consistently lower shortages and the Urban/West region had consistently higher shortages. The responses to these items warrant further investigation in all schools.
The teaching conditions in the schools were very poor indeed according to the data supplied in the foregoing tables. Indeed these results suggested that crisis conditions existed in Zanzibar’s primary schools. There was a severe lack of classroom libraries or book corners, dictionaries for teachers in Kiswahili, cupboards, bookshelves and even a teacher table. Most children did not have a reader/textbook, or a notebook and a ruler or eraser. More pupils had pencils or ballpoint pens, but there was still a considerable number without either, which indicated that they had nothing with which to write. There would appear to be a case for asking for outside aid to ameliorate this situation and enlisting the help of parents in each and every community in the country. It does not take too much effort and expenditure for parents to erect some bookshelves and cupboards, and a table for the teacher, if requested to do so. In addition, aid agency money should be used primarily for getting required readers, textbooks, and notebooks into the schools as well as for classroom library books.
Policy Suggestion 3.15: The Ministry should conduct an audit of the state of materials and equipment in all schools. It should make every effort to acquire the essential items that are missing through government, community/parent contributions, and aid agency funding.
29

30
8 8
8 8
8 6
6 6
6 d
0 0
0 0
0 d
6 d
d d
8 d 9 0

What aspects of the teaching function designed to improve the quality of education were in place?
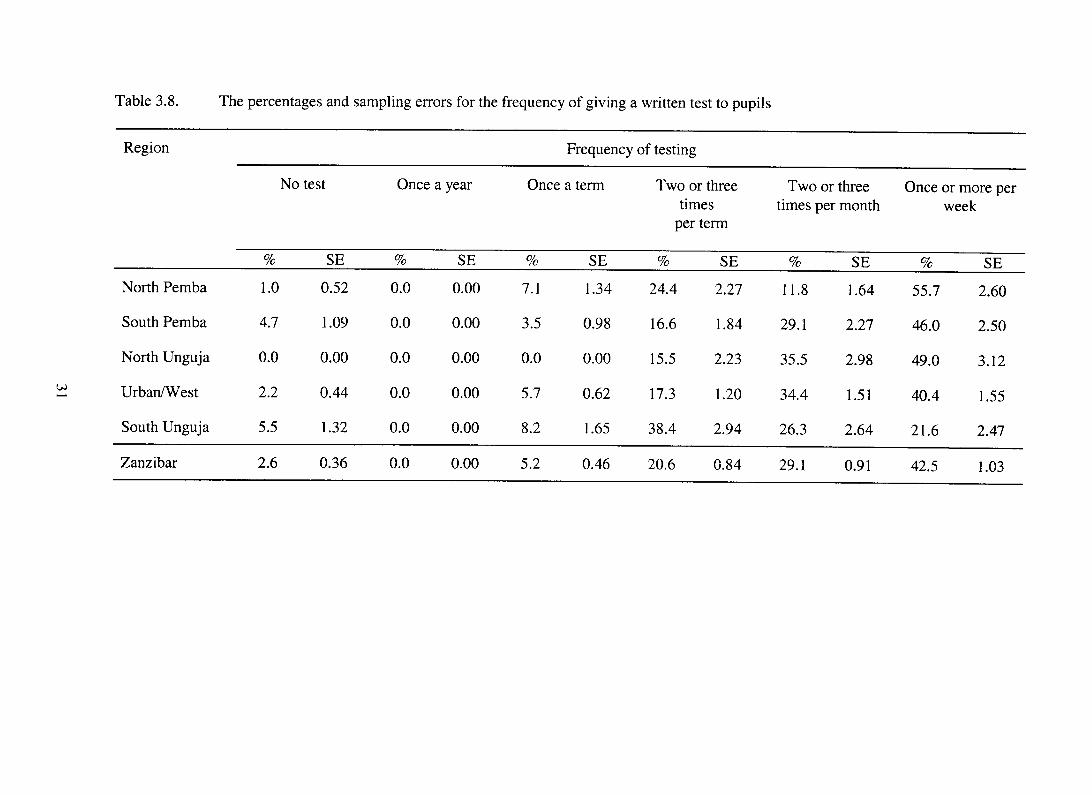
A number of variables were examined with respect to this important aspect of the educational environment. Most of these variables related to teaching practices that were known from previous research to influence pupil learning, or with teachers’ perceptions of the inspectors and the factors that are related to job satisfaction. Four issues were examined: frequency of testing pupils, regularity of meeting with parents, perceptions of the professional performance of the Inspectorate, and perceptions of what gave teachers job satisfaction. The results of the analyses have been presented in Tables 3.8 to 3.12.
(a) Frequency of testing
The final two categories of this variable in Table 3.8 showed that 71.6 percent of pupils had teachers who stated that they gave their pupils a written test in reading at least two or three times per month or more frequently. There were 20.6 percent of Standard 6 pupils whose teachers gave them written tests two or three times per term. Only 5.2 percent were given tests once per term and 2.6 percent no test at all. The lowest figures came from the South Unguja region - where only 47.9 percent of pupils were given a test at least two or three times per month.
Policy Suggestion 3.16: The Ministry should establish a common policy on the regularity of giving written tests to pupils in order to ensure greater uniformity across regions in this important area of the educational environment.
(b) Meeting parents
Postlethwaite and Ross (1992) showed that, in many countries, schools in which the school head and teachers had more contact with parents were more effective in promoting the reading achievement of pupils. That is, schools where school heads and teachers had contact with parents scored better than could be expected after taking into account the socio-economic background of their pupils. The results concerning the frequency of teacher meetings with the parents of Standard 6 pupils in Zanzibar have been presented in Table 3.9.
In Zanzibar the mode for the frequency of teacher meetings with parents was once per term. However, 25.0 percent of pupils had teachers who only met parents once per year, and 17.5 of pupils had teachers who never met parents at all. Given the demonstrated importance of involving parents in the educational life of their children, these results were extremely disappointing. The Ministry clearly needs to reconsider possibilities for improving opportu- nities for teachers to meet with parents. For example, in-service teacher training courses should train teachers how to meet parents both in and out of school, school heads should ensure that teachers meet parents more frequently, and the Ministry should develop a programme of teacher-parent workshops. At these workshops the parents could be asked to come to work with the teachers in the school in order to show the parents how to foster children’s learning.
Policy Suggestion 3.17: The Ministry should introduce instruction on ‘meeting parents’ into teacher training programmes, and should also ask school heads to ensure that teachers meet with parents on a regular basis to discuss the progress of pupils.
32
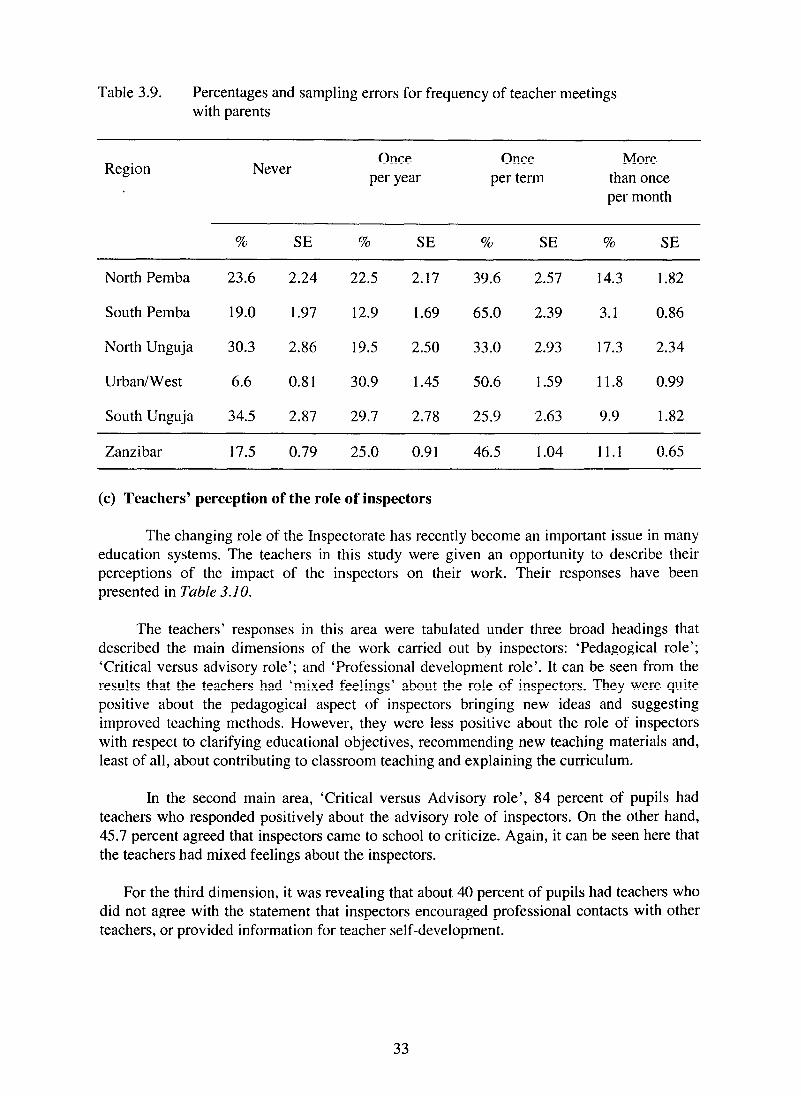
Table 3.9. Percentages and sampling errors for frequency of teacher meetings with parents
Region Never Once
per year Once
per term More
than once per month
% SE % SE % SE % SE
North Pemba 23.6 2.24 22.5 2.17 39.6 2.57 14.3 1.82
South Pemba 19.0 1.97 12.9 1.69 65.0 2.39 3.1 0.86
North Unguja 30.3 2.86 19.5 2.50 33.0 2.93 17.3 2.34
Urban/West 6.6 0.8 1 30.9 1.45 50.6 1.59 11.8 0.99
South Unguja 34.5 2.87 29.7 2.78 25.9 2.63 9.9 1.82
Zanzibar 17.5 0.79 25.0 0.91 46.5 1.04 11.1 0.65
(c) Teachers’ perception of the role of inspectors
The changing role of the Inspectorate has recently become an important issue in many education systems. The teachers in this study were given an opportunity to describe their perceptions of the impact of the inspectors on their work. Their responses have been presented in Table 3. IO.
The teachers’ responses in this area were tabulated under three broad headings that described the main dimensions of the work carried out by inspectors: ‘Pedagogical role’; ‘Critical versus advisory role’; and ‘Professional development role’. It can be seen from the results that the teachers had ‘mixed feelings’ about the role of inspectors. They were quite positive about the pedagogical aspect of inspectors bringing new ideas and suggesting improved teaching methods. However, they were less positive about the role of inspectors with respect to clarifying educational objectives, recommending new teaching materials and, least of all, about contributing to classroom teaching and explaining the curriculum.
In the second main area, ‘Critical versus Advisory role’, 84 percent of pupils had teachers who responded positively about the advisory role of inspectors. On the other hand, 45.7 percent agreed that inspectors came to school to criticize. Again, it can be seen here that the teachers had mixed feelings about the inspectors.
For the third dimension, it was revealing that about 40 percent of pupils had teachers who did not agree with the statement that inspectors encouraged professional contacts with other teachers, or provided information for teacher self-development.
33

Table 3.10. Teachers’ perceptions of the role of the Inspectorate
Aspect of the role of the Inspectorate
Percentage of teachers agreeing
% SE
Pedagogical role Bring new ideas Clarify educational objectives Recommend new teaching materials Contribution to classroom teaching Explain curriculum Suggest improved teaching methods
80.7 0.84 64.5 0.98 66.0 0.99 53.9 1.04 58.2 1.03 79.5 0.84
Critical v. Advisory role Comes to criticize Comes to advise
45.7 1.04 84.3 0.75
Professional development role Encourage professional contacts with other teachers 60.5 1.02 Provide information for teacher self-development 58.9 1.03
In Zanzibar it is part of the new policy for inspectors to move towards a more positive advisory role which will facilitate and improve classroom teaching. It was therefore somewhat perplexing to see that many teachers still perceived the Inspectorate in an ‘old-fashioned’ critical role, and that many teachers considered that the Inspectorate contributed little to important pedagogical areas of the school environment.
Policy Suggestion 3.18: The Ministry should initiate a dialogue with the Inspectorate on teachers’ perceptions of its role. This dialogue should give special emphasis to the areas of curriculum, classroom teaching, and the professional development of teachers.
(d) Source of teacher satisfaction
The motivation of teachers is a critical issue for any programme designed to improve the quality of education. In the SACMEQ countries there has been considerable interest in this issue - especially with respect to those factors that contribute most to job satisfaction. It is widely believed that satisfied teachers will tend to work harder for the benefit of the pupils and are less likely to leave the teaching profession.
Teachers in this study were given an opportunity to respond to 13 possible reasons for satisfaction with their jobs. These reasons have been grouped under five headings in Table 3.11: living conditions, school facilities/equipment, relationships with others, career advancement, and educational outcomes of pupils.
34

All of the reasons given were thought to be rather important in contributing to teacher job satisfaction. However, the item with the highest rating was ‘quality of classroom supplies’. The very high value of 94.1 percent for this reason was to be expected - given the results reported earlier about teaching materials. The ‘level of teacher salary’ reason also registered a very high rating of 92.9 percent. The reasons receiving the lowest level of endorsement were ‘travel distance to school’, the ‘quality of teacher housing’, and the ‘quality of school buildings’.
Table 3.11. Percentage and sampling errors for sources of teacher satisfaction
Source Percentage of teachers indicating reason as
‘very important’
% SE
Living conditions Travel distance to school Availability of teacher housing Quality of teacher housing
70.6 0.96 88.7 0.68 73.4 0.93
School facilities/Equipment Quality of school buildings Quality of classroom furniture Quality of classroom supplies
78.1 0.97 81.4 0.82 94.1 0.50
Relationships with others Quality of school manpower and administration 88.9 0.65 Amicable working relations with other teachers 89.9 0.63 Good relations with community 82.6 0.79
Career advancement Expanded opportunities for promotion Opportunities for professional development Level of teacher salary
81.9 0.80 88.9 0.65 92.9 0.53
Educational outcomes of pupils Seeing pupils learn 86.2 0.73
35
- -
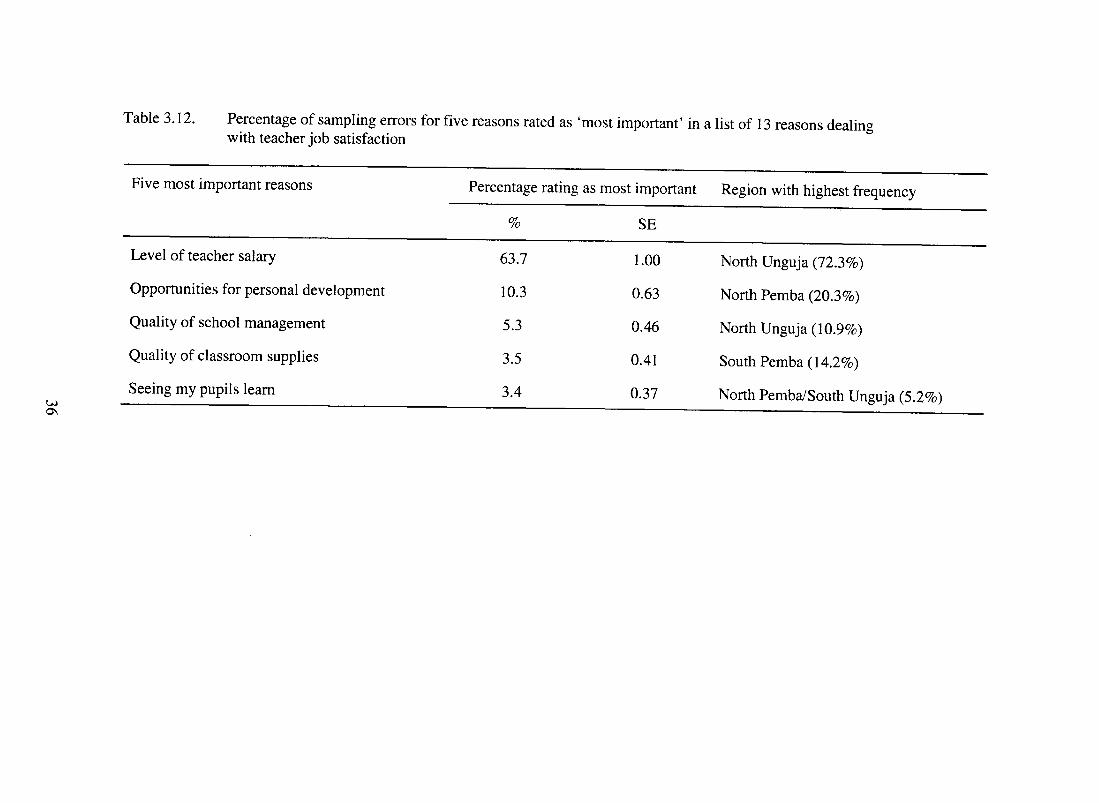
3 d m
d M
36

Teachers were also asked to select ‘the single most important reason’ for job satisfaction from among the 13 items. The results have been presented in Table 3.12. Overwhelmingly, the most important factor for all of Zanzibar was the ‘level of teacher salary’, and this was particularly stressed in the North Unguja region. ‘Opportunity for personal development’ was stressed in North Pemba. It was a little discouraging to see the low rank awarded to ‘seeing my pupils learn’.
Policy Suggestion 3.19: Senior Ministry personnel should meet with teachers in each of the regions to discuss teachers’ concerns about job satisfaction and to identify and implement strategies for addressing these concerns.
What was the general condition of school buildings?
The assessment of the general condition of school buildings in Zanzibar was obtained by examining responses to questions asked of school heads about the repair status of school buildings and by analyzing school heads’ responses to a checklist of school facilities.
(a) Repair status
The school head was asked to state the condition of his or her school building on a five-point scale with the following values: 5 = in good condition; 4 = some classrooms need minor repairs; 3 = most or all classrooms need minor repairs; 2 = some classrooms need major repairs; and 1 = school needs complete rebuilding.
This variable was recoded so that it was possible to calculate the percentage of Standard 6 pupils in schools where the school head perceived the need for either ‘major repair’ or ‘complete rebuilding’. These percentages have been listed in Table 3.13. The analysis revealed that 50.0 percent of Standard 6 pupils were in schools which were perceived by the school heads to be in need of major repair or rebuilding. There was considerable variation among regions, ranging from 33.4 percent in South Unguja to 79.4 percent in South Pemba.
Policy Suggestion 3.20: The Ministry should: (a) encourage and strengthen community participation to undertake repairs of school buildings; (b) inculcate within the school community the culture of preventive maintenance in order to prevent an acceleration of damage to buildings; and (c) identify the different kinds of repairs needed and produce a lo-year plan for undertaking this work.
(b) Classroom space
The value for this variable was obtained by dividing the whole of the internal area of all classrooms by the total number of pupils enrolled in the school. The national average for classroom space per pupil was 1.1 square metres. The results presented in Table 3.23 showed that there was little variation among the regions.
37

Table 3.13. The means and sampling errors for selected school building characteristics
Region Repair status Classroom space
Mean SE Mean SE
North Pemba 49.9 2.62 1.1 0.52
South Pemba 79.4 2.00 1.1 0.51
North Unguja 61.3 3.04 1.1 0.62
Urban/West 40.0 1.55 1.0 0.32
South Unguja 33.4 2.85 1.3 0.60
Zanzibar 50.0 1.05 1.1 0.21
(c) General school facilities
Information has been presented in Tuble 3.14 for four categories of general school facilities: school buildings, school grounds, general services, and equipment. With the exception of a school head’s office, a school garden and a storeroom, many schools lacked a wide range of general school facilities, and most pupils attended schools with very few items of equipment. The lack of machines such as a typewriter, a duplicator, a tape recorder, and an overhead projector indicated that teachers would find it difficult to make their lessons more interesting and lively. Teachers in many countries often wish to develop their own teaching materials and, for this purpose, either a duplicator or photocopier is absolutely essential.
Policy Suggestion 3.21: The Ministry should develop a priority list of general school facilities and then prepare a strategy for working with major funding agencies to obtain the most essential items for schools.
What level of access did pupils have to books?
An international study of reading literacy (Elley, 1992) showed that the more children were able to read books, and the more that they had books available for them to read, the higher was their achievement in reading literacy. In this study several questions were asked about the availability of a classroom library, a school library, and the arrangements that were in place for allowing pupils to borrow books from these libraries. The responses to these questions have been summarized in Table 3.25.
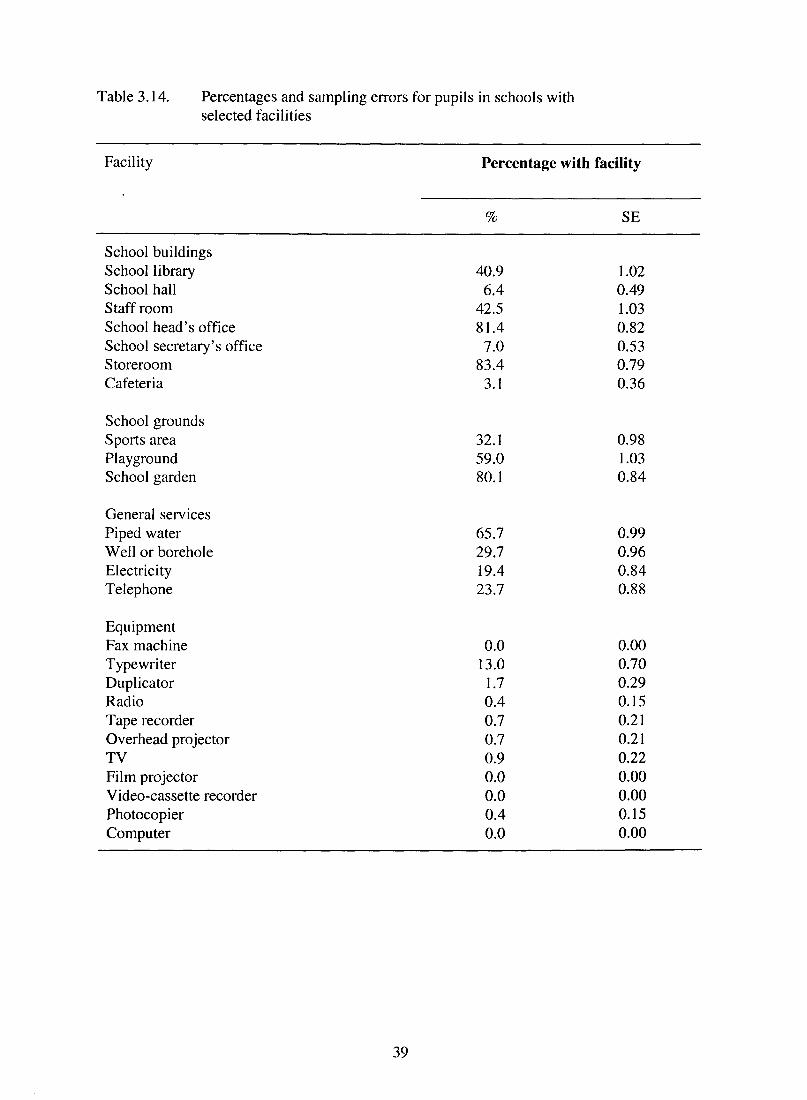
Table 3.14. Percentages and sampling errors for pupils in schools with selected facilities
Facility Percentage with facility
% SE
School buildings School library School hall Staff room School head’s office School secretary’s office Storeroom Cafeteria
40.9 1.02 6.4 0.49
42.5 1.03 81.4 0.82
7.0 0.53 83.4 0.79
3.1 0.36
School grounds Sports area Playground School garden
32.1 0.98 59.0 1.03 80.1 0.84
General services Piped water Well or borehole Electricity Telephone
65.7 0.99 29.7 0.96 19.4 0.84 23.7 0.88
Equipment Fax machine Typewriter Duplicator Radio Tape recorder Overhead projector TV Film projector Video-cassette recorder Photocopier Computer
0.0 13.0
1.7 0.4 0.7 0.7 0.9 0.0 0.0 0.4 0.0
0.00 0.70 0.29 0.15 0.21 0.21 0.22 0.00 0.00 0.15 0.00
39

Table 3.15. The percentages and sampling errors for pupils’ level of access to books
Region Library availability Pupils permitted to
borrow books
Classroom School
% SE % SE % SE
North Pemba 0.4 0.37 0.0 0.00 0.0 0.00
South Pemba 0.0 0.00 27.6 2.23 27.6 2.32
North Unguja 44.5 3.10 66.5 2.95 66.5 2.95
Urban/West 19.7 0.84 46.2 1.58 38.5 1.54
South Unguja 6.3 1.44 71.8 2.75 71.8 2.72
Zanzibar 14.4 0.73 40.9 1.02 37.6 1.02
(a) Classroom library
Elley (1992) showed that there was a strong relationship between reading literacy achievement and the availability of classroom libraries in a study involving 32 systems of education. In Tuble 3.15 the first column of figures presents the percentage of Standard 6 pupils’ classroom with a library. Only 14.4 percent of Standard 6 pupils were in classrooms with a classroom library, which therefore indicated that 85.6 percent of pupils were in classrooms with no libraries. There was a very wide variation among regions on this variable. While in the regions of North and South Pemba almost all of the Standard 6 pupils were in schools with no classroom libraries, 44.5 percent of pupils in the North Unguja region attended schools with classroom library facilities.
(b) School library
Although only 14.4 percent of Standard 6 pupils were in classrooms with libraries, some 40 percent of pupils were in schools that had school libraries. There was wide variation among regions. Around 70 percent of pupils in the South and North Unguja regions attended schools which had libraries. Pupils in North Pemba were in schools with neither classroom nor school libraries and in South Pemba there were no classroom libraries and only 28 percent of pupils were in schools with school libraries. Elley emphasized in his study that whereas it was classroom libraries that were beneficial in primary schools, it was school libraries that were important in secondary schools.
It is clear that Zanzibar needs to make great efforts to increase the number of classrooms in primary schools with classroom libraries containing books in Kiswahili. Parents should contribute books, or money with which to buy books, and the Ministry must make all efforts to obtain more books and ensure that those schools having no books at all are the first to receive them. Another possibility is for the Ministry to organize mobile school libraries whereby library books are rotated across schools at regular intervals.
40

(c) Borrowing books
Even though schools may have classroom libraries and a school library, it often occurs that the pupils are not allowed to borrow books in order to take them home to read. Thus, a question was asked of the school heads about pupils being allowed to borrow books. The response to this question corresponded with the percentage of schools with libraries. It can be seen that 37.6 percent of Standard 6 pupils in Zanzibar were in schools where they were allowed to borrow books.
Policy Suggestion 3.22: The Ministry should devise strategies to improve access to books through the provision of school and classroom libraries. Measures should be taken to ensure that, where school and classroom libraries are available, the pupils can borrow books and take them home to read.
Conclusion
This chapter was designed to provide the reader with some examples of baseline data for inputs to primary schools in Zanzibar. The data were described as ‘baseline’ because they covered essential features of the school system, and because they provided an initial cross- sectional description at one point of time. Educational planners and administrators will be able to use these data to monitor future changes in the evolution of Zanzibar’s primary education system and to assess the degree of change that has occurred in important educational indicators over time.
In general, the data are disquieting. Not all of the children in the relevant age groups are enrolled in primary education. The Standard 6 pupils are in classes where the average age is nearly two years higher than it should be. The children come from homes where, although they are fed regularly, the material possessions of the home are often few; there are also few books at home to read. Grade repetition is high and 25 percent of pupils had repeated at least once. Homework is not given frequently. About 50 percent of the teachers have not received the desired minimum teacher training of at least two years. One in four pupils were in classrooms without a usable chalkboard and most pupils were in classrooms without bookshelves, a cupboard, a teacher’s desk and chair, and so on. Most pupils had no textbook or reader. Many had no exercise book or a pencil or pen with which to write. Indeed, teachers complained a great deal about the lack of teaching/learning materials in the classroom, as well as about their low levels of salary. School heads perceived 50 percent of the buildings as being in need of major repair. There was an enormous paucity of resources in schools.
Taken together, these indicators of the state of the educational environment in Zanzibar suggest the need for a major effort to improve the present state of the primary school system. This will not be achieved quickly and it is clear that assistance from outside agencies will be required. However, the Ministry can make a valuable start on this mission by listing, prioritizing, and timetabling the needed changes so that action can be taken rapidly as soon as resources are available.
41

Chapter 4
How do the conditions of schooling in Zanzibar compare with the Ministry’s own benchmark standards?
Introduction
In this chapter the discussion of schooling conditions has been extended beyond the descriptive account given in the previous chapter, to a comparative analysis in which conditions are compared with reference to benchmark standards laid down by the Zanzibar Ministry of Education. This comparative analysis has permitted judgements to be made about key aspects of the educational environment in relation to the minimal levels of provision that the Ministry has established for the proper functioning of primary schools.
In Zanzibar the provision of equipment and supplies to each school is controlled by the Ministry of Education. However, parents contribute by buying pens, pencils, rulers and, in some cases, exercise books. The general condition of the facilities and supplies is influenced by the adequacy of financial resources to purchase the supplies and the priority placed on the need of the particular item. Over the years the Ministry has developed benchmark standards which regulate the conditions of schooling. These standards are subject to change or modification from time to time because of policy shifts and/or financial conditions. Some of the standards are associated with material provision in classrooms, while others pertain to the professional practice of teachers. Certain standards are determined by health regulations. Examples include the number of pupils per class, the amount of classroom floor space per pupil, and the number of pupils per toilet. Due to financial constraints, not all of these standards are strictly adhered to.
Some of these standards were established long ago. However, sometimes there is no published information available which provides a justification for them. There is therefore a need for the Ministry to re-visit the benchmark standards in order to check their relevance for the 199Os, and also to take action to fill those gaps where standards do not yet exist.
Policy Suggestion 4.1: The Ministry should review and, if necessary, establish benchmark standards for the educational environment that are deemed to be reasonable for the proper functioning of primary schooling.
Basic organizational features of schooling
The basic organizational features of schooling that operate within schools have always been of great interest to educational planners. These features must be managed properly in order to optimize the quality of the educational environment for pupils. In the SACMEQ project questions were asked of school heads about total enrolments, class sizes, availability of classroom space for pupils, and staffing ratios. The results of the analysis of these questions and their linkages to the standards specified by the Ministry of Education have been presented below.
42

(a) Total school enrolment
In Zanzibar, schools are classified according to three categories of size: Grade A, Grade B, and Grade C and above. A Grade A school has one or two streams with 7 to 14 classes. However, a large proportion of schools in Zanzibar have a range from Standard 1 of primary school to Form 2 of secondary school. Therefore a ‘standard’ size school will have 10 double-stream classes in two shifts. Although there is no official benchmark for ‘total school enrolment’, an enrolment of between 720 and 900 pupils could be regarded as ‘that which was expected’.
In Table 4.1, column 1 shows the percentage of Standard 6 pupils who were in schools that satisfied the total school enrolment benchmark of ‘an enrolment of 900 or fewer pupils’. For Zanzibar, only 25.7 percent of Standard 6 pupils were in schools that satisfied the benchmark and the percentages varied across the regions. This meant that 74.3 percent of pupils were in schools which had more pupils in them than there should have been. The Urban/West region had the lowest percentage of pupils in schools meeting the benchmark.
Policy Suggestion 4.2: The Department of Planning and Finance should examine the situation concerning large schools in the Urban/West region with the aim of establishing whether there is a need for more schools.
(b) Class size
The Ministry’s norm for primary school class size was 45 pupils. The percentage of Standard 6 pupils in classes that satisfied the Ministry’s benchmark have been listed in Table 4.1 The percentage for Zanzibar overall was 52.6 percent. That is, about half of the Standard 6 pupils were taught in classes that were ‘overcrowded’ according to the Ministry’s own definition. From the table, it can be seen that some 60 to 80 percent of pupils in four regions were in classes that satisfied the Ministry’s benchmark. However, in the Urban/West region only 28 percent of pupils were in classrooms that satisfied the benchmark.
Policy Suggestion 4.3: The Ministry should take measures to address the problem of overcrowding in classrooms in the Urban/West region.
(c) Classroom space
A measure of the amount of classroom space available for students was calculated by taking the total classroom floor area for a whole school, and then dividing this by the total school enrolment of the largest shift attending the school. Most schools operate on double shift, therefore the enrolment for the largest shift was used. The benchmark applied for classroom space was ‘at least 1.25 square metres per pupil’. It must be noted that this measure was probably an overestimate of the space per pupil, because in some classrooms there was furniture (teacher table and chair, movable chalkboard) that took up space. The percentage of Standard 6 pupils attending schools that satisfied the Ministry’s classroom space benchmark for Zanzibar overall was 28.4 percent. Problems in this area were found in North and South Pemba and Urban/West regions.
43

0 M
vi g . -
m
F
3
9 m
- a cc,
44
---.

(d) Staffing ratio
Staffing ratio is often referred to as pupil/teacher ratio. This measure is to be distinguished from class size. The staffing ratio is the total number of pupils in the school divided by the number of full-time-equivalent teachers posted to that school. In a sense it reflects the ‘wealth’ of that school in terms of human resources. In Zanzibar the benchmark used was four teachers for every three classes. To convert this regulation into a ratio, the benchmark of 4.5 pupils per class was multiplied by three and divided by four teachers. The resulting benchmark ratio was then 34 pupils per teacher. The percentages of Standard 6 pupils in schools that have satisfied the Ministry’s staffing ratio benchmark have been presented as the final variable in Table 4.1. Overall, around 73 percent of Grade 6 pupils were in schools which satisfied the benchmark figures for staffing ratios. The percentages for regions varied a great deal from a low of 44.2 in North Unguja to a high of 98.1 in South Pemba. These major differences were difficult to explain because all schools in Zanzibar are required to come under the same ratio regulations.
Policy Suggestion 4.4: The Ministry should examine the official policies for posting teachers to schools in order to obtain a more equitable distribution in terms of staffing ratio among and within regions.
Classroom furniture and supplies
There were nine areas related to classroom furniture and classroom supplies that were employed in benchmark comparisons. The results of these analyses have been reported in Tables 4.2 a& 4.3. There were no published benchmark levels in these two areas for Zanzibar and therefore it was decided to apply the benchmark that had been agreed to by the SACMEQ national research co-ordinators. These benchmarks were derived from ‘common- sense’ judgements concerning the minimal levels of provision that would be acceptable in most school systems of the Southern Africa sub-region. In several cases, the benchmarks tended to be rather low by world standards because they were derived as a consensus position by a group of educational planners who were working in relatively poor countries.
Table 4.2. Percentages and sampling errors for benchmarks related to classroom furniture
Region Sitting places Writing places tone P.P.) (one P.P.>
% SE % SE
Chalkboard (one p.cl.)
% SE
North Pemba 48.6 2.62 31.0 2.42 77.3 2.20
South Pemba 39.2 2.44 26.1 2.20 77.7 2.08
North Unguja 81.0 2.44 48.8 2.64 61.9 3.03
Urban/West 46.3 1.58 29.9 1.45 73.3 1.41
South Unguja 98.6 0.85 77.1 2.55 93.8 1.44
Zanzibar 55.6 0.85 37.2 1.01 75.9 1.06
45

(a) Classroom furniture
In Zanzibar most primary schools have a shortage of furniture. Even in a class where there is furniture, it is normally the situation that sitting places will be crowded. The current practice is to have ‘double-seater’ desks which accommodate three pupils per desk. The calculation for this study was made by identifying the number of children in each classroom and then determining if there were enough sitting and writing places. A classroom should have at least one usable chalkboard.
The percentages of Standard 6 pupils in classrooms meeting the classroom furniture benchmarks have been presented in Table 4.2. Levels of provision for these three items were not satisfactory. Only 55.6 percent of the Standard 6 pupils had their own sitting places. Worse still was the situation for writing places, where over 60 percent of Standard 6 pupils were in classrooms not meeting the ‘writing places’ benchmark. It was only in the South Unguja region that the situation was better. These acute shortages of furniture are detrimental to learning and to the health of the pupils. Furthermore, around 25 percent of pupils were in classrooms without a usable chalkboard. In North Unguja, 38 percent of pupils were in classrooms without chalkboards. It is indeed difficult for teachers to teach without a chalkboard.
Policy Suggestion 4.5: The Ministry should reinforce the plan to improve classroom furniture supplies through a ‘partnership scheme’ with school communities.
(b) Classroom supplies
There are no official benchmarks for classroom supplies in Zanzibar, except that it is widely agreed that pupils should have at least one exercise book for each subject taken at any one time. Therefore, as for classroom furniture, the SACMEQ general standards were used. In recent years, the Ministry has supplied at least seven exercise books per pupil per year and the rest have had to be provided by parents.
The percentages of Standard 6 pupils in classrooms with supplies that satisfied the benchmark figures have been presented in Table 4.3 for five of these items. The benchmarks were one per pupil (indicated by ‘one p.p,’ in the table) except for pencils - where it was three per pupil (indicated as ‘three p.p.’ in the table).
The overall pattern of provision of classroom supplies was not good. Only a little over half of the Standard 6 pupils had exercise books and ballpoint pens. Only 5 percent of Grade 6 pupils indicated that they had pencils, but this may have been because many pupils used ballpoint pens and had only one pencil, and not three, at any one point of time.
46
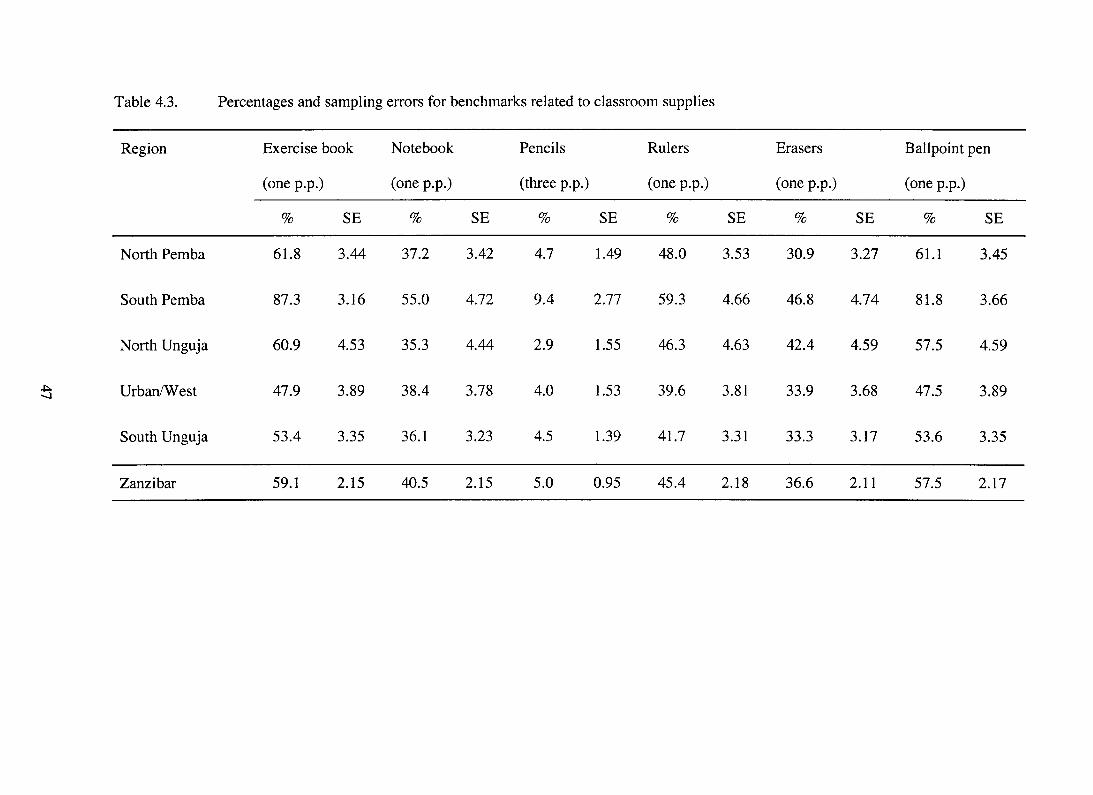
47
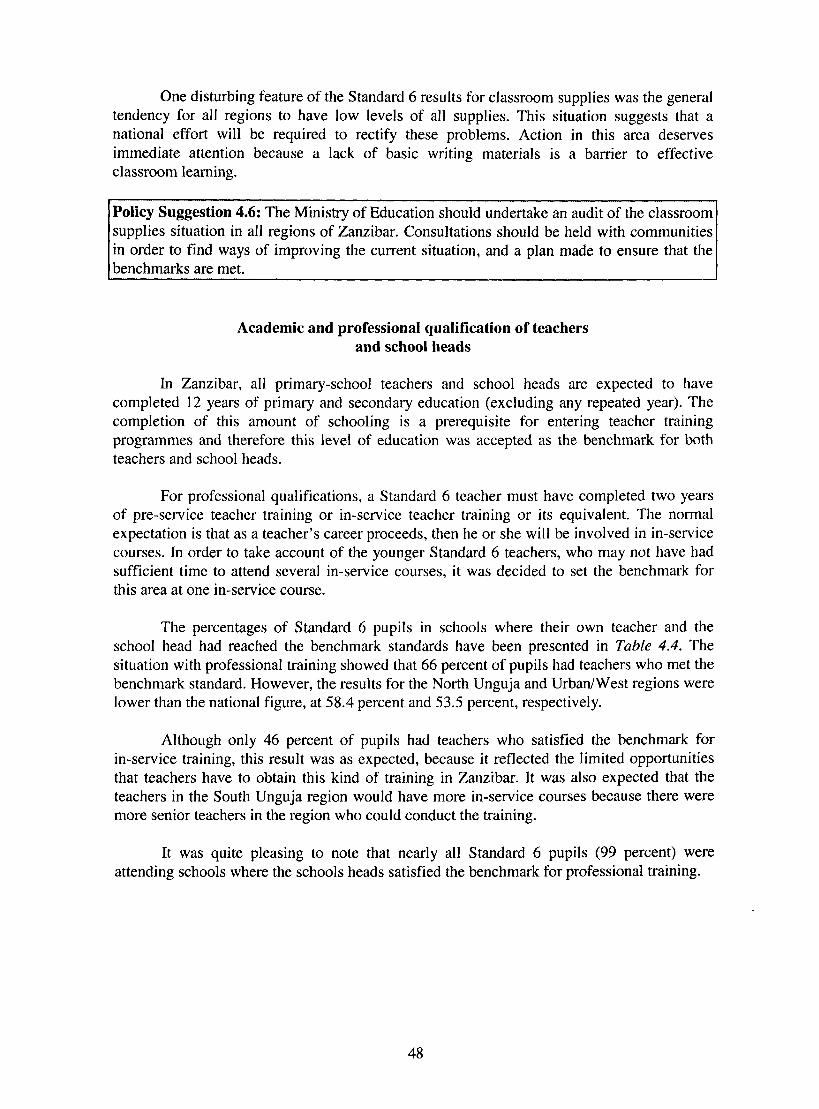
One disturbing feature of the Standard 6 results for classroom supplies was the general tendency for all regions to have low levels of all supplies. This situation suggests that a national effort will be required to rectify these problems. Action in this area deserves immediate attention because a lack of basic writing materials is a barrier to effective classroom learning.
Policy Suggestion 4.6: The Ministry of Education should undertake an audit of the classroom supplies situation in all regions of Zanzibar. Consultations should be held with communities in order to find ways of improving the current situation, and a plan made to ensure that the benchmarks are met.
Academic and professional qualification of teachers and school heads
In Zanzibar, all primary-school teachers and school heads are expected to have completed 12 years of primary and secondary education (excluding any repeated year). The completion of this amount of schooling is a prerequisite for entering teacher training programmes and therefore this level of education was accepted as the benchmark for both teachers and school heads.
For professional qualifications, a Standard 6 teacher must have completed two years of pre-service teacher training or in-service teacher training or its equivalent. The normal expectation is that as a teacher’s career proceeds, then he or she will be involved in in-service courses. In order to take account of the younger Standard 6 teachers, who may not have had sufficient time to attend several in-service courses, it was decided to set the benchmark for this area at one in-service course.
The percentages of Standard 6 pupils in schools where their own teacher and the school head had reached the benchmark standards have been presented in Table 4.4. The situation with professional training showed that 66 percent of pupils had teachers who met the benchmark standard. However, the results for the North Unguja and Urban/West regions were lower than the national figure, at 58.4 percent and 53.5 percent, respectively.
Although only 46 percent of pupils had teachers who satisfied the benchmark for in-service training, this result was as expected, because it reflected the limited opportunities that teachers have to obtain this kind of training in Zanzibar. It was also expected that the teachers in the South Unguja region would have more in-service courses because there were more senior teachers in the region who could conduct the training.
It was quite pleasing to note that nearly all Standard 6 pupils (99 percent) were attending schools where the schools heads satisfied the benchmark for professional training.
48

B 0
49

Conclusion
This chapter has examined the conditions of schooling in Zanzibar based on either a comparison with the benchmark standards set down by the Ministry, or based on a comparison with benchmark standards established by the SACMEQ national research co-ordinators. Where benchmarks did not exist in Zanzibar, it was suggested that the Ministry create them and, at the same time, reconsider the existing benchmarks. The approach taken was to group a range of indicators of the general conditions of schooling under three main headings: basic organizational features of schools, classroom furniture and supplies, and the academic and professional qualification of teachers and school heads.
The four indicators under basic organizational features dealt with total school enrolment, class size, classroom space and staffing ratio. The percentages of pupils in the sample in schools meeting the benchmarks were 25.7, 52.6, 28.4, and 72.7, respectively. This is clearly an unsatisfactory situation and specific policy suggestions were prepared for examining the possible need for new schools in the Urban/West region, and the conduct of an investigation into overcrowded classrooms.
The indicators under classroom furniture and supplies dealt with the availability of sitting and writing places, chalkboards, exercise books, pencils and other classroom supplies needed by Standard 6 pupils. The policy suggestions in this area focused on the national shortages of both furniture and supplies.
The indicators of professional qualifications of teachers showed room for improvement. The provision of in-service courses for teachers was extremely uneven across the regions, and at the national level also deserved attention. In contrast, the situation for school heads was very pleasing - almost all of them satisfying the official benchmark for professional qualifications.
50
Chapter 5
Have educational inputs to primary school been allocated in an equitable fashion?
Introduction
Strategies for the democratization and expansion of education which characterized the main thrust of education policy during the early days of the Zanzibar Revolution have now given way to the new mission of quality enhancement. The political consideration of giving equality of educational opportunity to all is an issue that goes beyond giving every child access to school education. It also involves giving all those who are in school an equal opportunity to learn. One way to do this is to ensure that there is an equitable distribution of resource inputs among all Zanzibar schools, such that parents are prepared to send their children to any school in the country because they know that all schools provide an equal chance for children to achieve to the best of their abilities.
It is widely known that performance levels of pupils in Zanzibar vary from school to school and region to region. However, the notion that this variation in pupil performance would be associated with differences in the availability of certain key resource inputs is not well understood.
If steps are to be taken to address the issue of equity it is important to know the ‘location’ of differences or variations in resource inputs to schools. For example, are these variations more pronounced among regions, or more among schools within regions? An answer to this question provides guidance not only about which resources are distributed evenly or unevenly, but also suggests the level at which a decision must be taken (national or regional) to address any major inequities.
In exploring questions of equity, it must be recognized that there is a need to examine allocation patterns in association with actual levels of provision. Such information is necessary because it enables the policy-maker to identify which resources require attention, and also to have some feeling for the amounts of supplementary resources that may be needed to achieve a more equitable distribution of resources.
This chapter concentrates mainly on an examination of inequities in the distribution of educational resources and not upon absolute resource levels. Therefore, it should be read in conjunction with the two previous chapters, which concentrated on baseline and benchmark resource allocations.
Two approaches to the measurement of equity
(a) Variation among regions
A statistic called the coefficient of intraclass correlation (rho) may be used to divide the variation in resource inputs into two components: (a) among regions, and (b) among schools within regions. Rho can range from around zero to 1.00. When used in this way, rho is a ratio that measures the percentage of total variation among schools that can be attributed
51

to variations among regions. The residual figure measures the average variation among schools within regions.
To appreciate the meaning of rho it is useful to consider two hypothetical school systems: system A and system B. In -school system A resources are allocated equally, or nearly equally, to all schools and therefore when one calculates average resource levels for regions in the system, one finds that these are more or less the same except perhaps for some minor chance deviations. For such a school system, the value of rho would be low because the variation among schools is associated with chance differences among schools within regions. That is, the among-region variation in this case is negligible.
On the other hand, consider school system B where, because of administrative decisions, historical factors, or geographical differentiation of social class groups, there are large variations among regions. The majority of the variation among schools in this case would be due to variations among regions and there would be little variation among schools within regions.
The above examples are two extremes that serve to illustrate the interpretation of rho. In practical terms, if the interpretation is to judge whether the variation is more among regions or more among schools within regions, a rho of, say, 0.2 means that 80 percent of the differences are among schools within regions and 20 percent among regions. In contrast, a rho of 0.8 would indicate that 80 percent of differences were among regions and 20 percent among schools within regions.
(b) Variation among schools within regions
It is also possible to quantify the differences among schools within a particular region by making a comparison with the variation among schools at the national level. This can be done by using the formula below:
Standard deviation for schools in a region x 100
Standard deviation for schools in the nation
The standard deviation of an indicator for a particular region measures the amount of variation among schools within that region, whereas the standard deviation for the whole country measures the amount of variation among schools for the nation. The ratio of the standard deviation of an indicator for a region to the standard deviation for the nation, expressed as a percentage, provides a measure of the degree of equity within a region compared with the national picture.
To illustrate the interpretation of these ratio values it is helpful to consider two hypothetical regions: region A and region B. Assume that resource levels are measured by an indicator that has a ratio of 50 percent for Region A and 150 percent for Region B. That is, the variation in resource levels among schools in Region A is 50 percent less than the variation in resource levels for the whole nation, and the variation in Region B is 50 percent higher than that for the nation. From these ratio values it can be said that the officer responsible in Region A should be reasonably satisfied that, compared with the national picture, there has been an equitable allocation among schools with Region A. In contrast, the
52

officer responsible for Region B should be concerned, because there is clear evidence of major inequities among schools in Region B when compared with differences among schools for the whole country.
Equity calculations for material resource inputs
This section focuses on the extent of variation among regions for the material resource inputs to schools. Table 5.2 presents the results of the analysis. The final column of figures in the table, entitled ‘Variation among regions’, shows the value of rho as a measure of the among-region variation for each of the indicators presented. It can be seen from the rho values that there was considerable variation among regions in the school resources index (34 percent), but that there was less than 10 percent variation among regions for the other inputs.
It is important to note here that the value of rho was focused on variation and not on absolute levels. That is, low rho values suggest few inequities among regions - but provide no guarantee that absolute levels of the indicators are at a satisfactory level. However, in the case of Zanzibar, it is known from Chupter 3 that the inputs have a low level for a number of variables. Thus the rho may be low, but that could mean that all regions have equally low levels.
The value of rho for the School resource index in Table 5.1 was extremely high at around 35. As observed in previous discussion, this served to indicate that there were major inequities across regions - as well as the general problem of low resource levels.
There were 26 items in the School resources index. With only one or two schools having some of the items, it can safely be said that the following 12 items did not exist: cafeteria, computers in schools, duplicators, fax machines, film projectors, school halls, overhead projectors, photocopiers, radios, tape recorders, TVs, and VCRs. Most of these items require electricity for operation - but it was known that only 19 percent of Standard 6 pupils were in schools where electricity was available. This lack of electricity must obviously prevent school heads from motivating communities to provide finance to obtain at least two or three of these important aids to learning. The Ministry needs to agitate for a major change in this area - perhaps by forming an alliance with other ministries to ensure the wider availability of electricity. The fact that there is no, or virtually no, provision means that both the Ministry and the regions (that is, a dual responsibility) have to make every effort to ensure that they are made available in all schools.
What can be said about the other items? The overall provision for Zanzibar can be seen in Table 3.14 in Chapter 3. Below, the regions which were particularly high or low with regard to their possession of items are listed for each of the items.
School garden: 80 percent of Standard 6 pupils were in schools with a school garden, but in North Unguja there were 95 percent, and in Urban/West only 75 percent.
School head’s ofice: Overall, 80 percent of Standard 6 pupils were in schools with a head’s office, but in North Unguja the figure was only 50 percent.
53

School Library: Just over 40 percent of Standard 6 pupils were in schools with school libraries. In North Pemba there were no pupils in schools with libraries, while in North and South Unguja, 70 percent of pupils were in schools with school libraries. The availability of books is highly related to reading achievement and this input showed substantial variation among regions. This is a case where the Ministry of Education will need to take action. At the same time, it should be remembered that classroom libraries are more important than school libraries at the primary-school level. However, in the absence of classroom libraries, school libraries must exist.
Playground: Around 60 percent of Grade 6 pupils were in schools with playgrounds, but South Pemba had fewer than other regions.
Secretary’s o&e: The overall provision was very low at 7 percent, but Urban/West and North Unguja had slightly higher provision.
Sports’ area: Around 32 percent of pupils were in schools with a sports’ area, and in North and South Unguja this value reached 50 percent.
Staff room: Just over 40 percent of children were in schools with a staff room. However, in North Unguja and North Pemba only 8 and 20 percent, respectively, were in schools with staff rooms.
Storeroom: The overall provision was high, with 83 percent of pupils being in schools with storerooms, but in North Unguja the figure was 65 percent.
Telephone: Around 24 percent of pupils were in schools with a telephone, but nearly all of these were in the Urban/West region. In North and South Unguja there were no telephones.
Typewriter: Only children in the Urban/West region were in schools with a typewriter. This was distressing because it is a machine that can be useful to teachers when preparing teaching/learning materials.
Water: There was less piped water in schools in South Pemba and South Unguja, but schools in these regions tended to have access to well water. There was more piped water but less well water in the Urban/West region.
The analyses presented above suggested that there was substantial inequity among regions with respect to school resources. This problem of inequity was compounded by the generally low level of provision for individual resources which were considered to provide fundamental support to the teaching function. Clearly, the results suggest that it is time for the Ministry to undertake a major audit of the general condition of schooling in Zanzibar - with special reference to both levels and equity in resource allocations. This audit should then be used to prepare a long-range plan to attend rapidly to the worst cases and then to gradually improve the overall situation.
Policy Suggestion 5.1: The Ministry should undertake a major audit of the general conditions of schooling, and also prepare long-range plans to improve these conditions.
54


The first five columns of figures in Table 5.1 have presented the standard deviations among schools within each region, expressed as a percentage of the standard deviations among schools at the national level. For example, the value 73 percent for North Pemba on the Classroom furniture index showed that the variation among schools in North Pemba on this index was round 27 percent less than the variation among schools for the nation as a whole. In contrast, the value of around 112 percent for the same index in Urban/West showed that the opposite situation applied, with the variation among schools being around 12 percent more in South Unguja than for the national picture.
There were three figures that exceeded 120 percent in the table: Classroom library in North Unguja and Urban/West; and Teacher housing quality in South Unguja.
Policy Suggestion 5.2: The regions of North Unguja and Urban/West should take steps to reduce the variation among schools in the provision of classroom libraries; and South Unguja should review the variations in the quality of teacher housing.
Equity calculations for human resource inputs
In Table 5.2 results have been presented for the assessment of equity in human resource inputs (a) among schools within regions, and (b) among regions. In the final column of figures in Table 5.2, values of rho (multiplied by 100) have been listed. These figures provided a measure of the variation among regions.
The figures in the table indicated that the Ministry of Education has achieved its policy of distributing teachers with professional and academic qualifications in an equitable fashion among regions.
There was some variation among regions for the experience levels of school heads, inspectors’ visits, and pupil/teacher ratio. However, this variation was not high and was of the order of 12 to 15 percent among regions.
Within regions there were three figures of note: teacher academic qualifications in Urban/West, school head academic qualifications in Urban/West, and school head experience in South Unguja. Given the doubts about the way in which school heads and teachers answered the questions about academic qualifications (see Chapter 3), nothing further will be said about this until the Ministry has conducted a detailed audit. However, South Unguja should diminish the variation on school heads’ experience.
Policy Suggestion 5.3: The Ministry should pay attention to the inequity among regions with respect to the experience of school heads, inspectors’ visits, and pupil/teacher ratio. South Unguja should diminish the large amount of variation associated with the experience of school heads in its region.
56
-

57

Conclusion
This chapter has explored the concept of equity of resource allocation for groups of certain material and human resources and along two main dimensions of variation (among regions and among schools within regions). The general picture that emerged was that there was high inequity among regions with respect to school resources. There was also some noticeable variation among regions related to the experience of school heads, inspectors’ visits, and pupil/teacher ratio.
It was in the area of school resources that there was the greatest problem. At the same time, it was pointed out that there was low provision for several items in all regions and several suggestions were made about what the Ministry might do about these deficiencies.
Within regions there were some examples of regions having much greater variation than for the country as a whole and these were pointed out, and the suggestion made that the Ministry should take steps to review the situation. Action in this area may call for education regions having the freedom to plan the distribution of their own resources, and the opportunity to make their own priorities. The results also indicated that further investigation is needed to study the pattern of inequities among schools within districts.
Policy Suggestion 5.4: Education regions should be allowed to plan their own resource allocation according to their priority needs. They should also periodically conduct audits within the districts in their jurisdiction to check the equitable distribution of resources.
58

Chapter 6
What is the level of achievement for Standard 6 pupils overall and in the three domains of reading literacy?
Introduction
This chapter attempts to answer the following question: what is the level of reading for Standard 6 pupils overall and in the three domains of reading literacy? The question is addressed by initially presenting a brief explanation of the structure and content of the test that was used to assess the reading performance of Standard 6 pupils in Zanzibar. This is followed by a description of how the reading specialists of the Ministry of Education identified the cut-off scores on the test which corresponded to ‘minimum’ and ‘desirable’ levels of reading achievement. The results for the percentages of pupils achieving the minimum and desirable levels of mastery are then presented. The chapter concludes with an examination of pupil performance in three key domains of reading literacy: narrative, expository and documents.
The structure of the reading test
The reading test was constructed by the SACMEQ NRCs. The test was designed to provide a valid measure of basic literacy skills for Standard 6 pupils, not only in Zanzibar, but also in the other countries participating in the SACMEQ project. The test items were constructed so as to conform to the reading syllabi for Standard 6 in the different countries. Reading specialists in the different countries also reviewed the items. The items were trial-tested, and a final test of 59 items was assembled after due account was taken of the content that the items were expected to measure, and the psychometric characteristics of the items.
(1)
(2)
(3)
The 59 test items covered three main domains of reading as follows:
Narvutive (21 items). Based on continuous texts in which the aim was to tell a story, whether fact or fiction.
Expository (23 items). Based on continuous texts that were designed to describe, explain, or otherwise convey factual information or an opinion to the reader.
Documents (1.5 items). Based on structured information presented in the form of tables, maps, graphs, lists, or sets of instructions. The pupils were requested to search, locate, and process selected facts rather than read every word of a continuous text.
The original version of the test had 16 items in the ‘documents’ domain. However, in Zanzibar, one item in Documents was, after the item analysis, considered to be an inappro- priate item and was dropped. Hence, there were only 15 items in this sub-score.
In Table 6.1 the structure of the reading test has been summarized. In the first column the names of the topics used for the passages in the reading test have been listed, followed by an indication of the dimension in which the topic was located. In the next three columns the
59

passage has been allocated to one of the three dimensions of reading. In the final two columns the total number of questions for each topic and the number of questions that were nominated as being ‘essential’ according to the procedures outlined below, have been given. For example, the topic of the first passage in the test was a story about a little boy called Tembo. This was a narrative passage which was linked to a total of five questions, of which four were considered essential.
The Ministry established two panels whose task it was to identify those items in the test that they deemed essential for Standard 6 pupils to master if they were to be able to study effectively in Standard 7. The first panel consisted of two inspectors and two curriculum development specialists in reading. The second panel consisted of Standard 6 teachers. The panels identified 44 items (listed in the last column of Table 6.1 as essential).
Table 6.1. The structure of the reading test (Topics, Dimensions, Total questions, and Essential questions)
Reading test topics Dimensions Total questions Essential questions
N E D
Tembo
Bird
Island
Joseph
Oranges
Maria
Quicksand
Empty bottles
Carrots
Temperature
Maize
Grandpa
Tree
J
J
J
J
J
J
J
J
J
J
5
5
4
5
4
J 3
3
4
5
4 4
6
6
5
J
4
4
1
5
4
2
2
1
5
3
5
5
3
Total items 59 44
Note: N = narrative, E = expository, and D = documents.
60
-

The construction of five test scores
(a) The total score on the 44 essential test scores
The first score that was constructed was a total test score on the 44 essential items that composed the test. Pupils were given a score of ‘ 1’ for each correct item and ‘0’ for each incorrect item - the total score was then calculated as the sum of these values.
(b) Two mastery scores based on standards set by the Ministry reading specialists and Standard 6 reading teachers
Two mastery scores were constructed from the subset of 44 ‘essential’ items selected by two panels from the original 59-item test. The panels agreed on what would be a ‘minimum’ level and a ‘desirable’ level of performance on these 44 essential test items. To achieve the minimum level of performance a pupil was required to obtain correct answers for 24 of the 44 items. To achieve the desiruble level of performance a pupil was expected to obtain correct answers for 33 of the 44 items. Thus, the first and second test scores were dichotomous designations of mastery at two levels of performance.
(c) Three sub-scale scores based on three sub-dimensions of reading
A further three test scores were based on the three sub-dimensions described above. That is, the total pool of 59 items was split into three subsets: Narrative (21 items); Expository (23 items); and Documents (15 items). The scores for each subset designated the respective number of correct responses. Table 6.1 presents the reading test topics and the 59 items as divided into the three subsets.
Analyses of overall mastery levels
In the first column of figures in Table 6.2 the mean score on the essential items of the reading test for Zanzibar have been listed. For Zanzibar overall this figure was 19.1 out of a maximum possible score of 44. This level of performance was lower than expected because the combined efforts of the national research co-ordinators during the construction of the test took every possible precaution to design the test to suit the skills of average Standard 6 pupils. The mean scores ranged from 16.4 in North Unguja to 20.5 in Urban/West.
In Table 6.2 the percentages of Grade 6 pupils reaching the minimum and desirable levels of mastery have been presented. These percentages have been given along with the values of the relevant sampling errors (SE), which provide information with which to place error limits around the sample estimates of population characteristics.
61

Table 6.2. Mean performance on 44 essential items and percentages of pupils reaching minimum and desirable levels of mastery
Region Performance on 44 essential items
Percentage reaching Percentage reaching minimum level of desirable level of
mastery mastery
Mean SE % SE % SE
North Pemba 19.7 0.43 52.3 2.63 5.7 1.22
South Pemba 18.2 0.35 38.6 2.43 3.1 0.87
North Unguja 16.4 0.46 32.3 2.93 2.0 0.88
Urban/West 20.5 0.26 52.9 1.56 7.8 0.84
South Unguja 17.2 0.44 36.8 3.02 1.1 0.66
Zanzibar 19.1 0.17 46.1 1.04 5.2 0.46
To illustrate, consider the two percentages of 46.1 and 5.2 in the final row of Table 6.2 which refer to the overall percentages of Zanzibar pupils reaching the minimum and desirable levels of mastery.
Using these figures and their standard errors, it was possible to make the following statements about the reading performance of the total population of Standard 6 pupils in Zanzibar.
(4 The percentage of the total population of Standard 6 pupils in Zanzibar that reached the minimum level of mastery in the reading test was (with 95 percent confidence) located between 46.1 + 2(1.04) percent. That is, between 44.02 percent and 48.18 percent.
(b) The percentage of the total population of Standard 6 pupils in Mauritius that reached the desirable level of mastery in the reading test was (with 95 percent confidence) located between 5.2 + 2(0.46) percent. That is between 4.28 percent and 6.12 percent.
These figures may be looked at in another way by subtracting the percentages from 100 percent in order to calculate the percentages of pupils who have not reached the minimum or desirable mastery levels. Thus, we may be very confident that between 51.82 percent and 55.98 percent of Standard 6 pupils did not reach the minimum level of mastery; and we may be very confident that between 93.88 and 95.72 percent of pupils did not reach the desirable level,
These results presented a very gloomy picture concerning the reading performance of Standard 6 pupils in Zanzibar. By converting the percentages into ‘counts’ it was possible to obtain a numerical picture of the problems facing the Zanzibar primary education system. TO illustrate, in 1995 there were 11,588 Standard 6 pupils in Zanzibar, and therefore we can be
62

quite confident in saying that between 6,005 pupils (51.82 percent) and 6,487 pupils (55.98 percent) had not reached the minimum level of mastery in reading. Further, between 10,879 pupils (93.88 percent) and 11,092 pupils (95.72 percent) had not reached the desirable level of mastery in reading.
. These figures highlight the need for a review of Ministry policy concerning the acquisition of literacy skills at the upper-primary-school level. Many reasons could be given to explain why the performance of Standard 6 pupils was so poor. For example, it might have been a shortage of readers and other forms of reading materials, or perhaps the teaching skills of teachers, or it might have been the poor home conditions of the pupils.
Policy Suggestion 6.1: The Ministry should establish a Task Force consisting of experienced teachers and reading/language specialists in order to examine alternative strategies for improving the reading achievement of Standard 6 pupils.
The generally disappointing overall performance of Standard 6 pupils on the 44 essential items was repeated in all regions. However, at the minimum level of mastery North Pemba and Urban/West region pupils had the best performance, with 52.3 percent and 52.9 percent, respectively. The pupils from the same two regions also performed slightly better at reaching the desirable level, with 7.8 percent of the pupils in Urban West and 5.7 percent of the pupils in North Pemba.
From the results reported above it can be concluded that the reading-literacy levels of Standard 6 pupils in Zanzibar in 1995 were poor when judged against the mastery standards set down by the Ministry’s own experts. In fact, the overall picture suggests that there is an educational crisis related to pupil literacy which needs to be addressed by a major educational intervention.
Policy Suggestion 6.2: The Ministry should undertake a national investigation with respect to reading policy and the mastery of basic literacy.
Another issue that needs to be addressed by the Ministry is to establish exactly ‘where’ the pupils had problems on the 59-item SACMEQ reading test. This will require curriculum experts to examine the item analysis statistics and to sort the items into three broad groups: (a) those items where the students had ‘no problems’; (b) those items that the students found ‘rather difficult’; and (c) those items that the students found ‘very difficult’. A second analysis is then required of the precise reading skills that are required to address the second two areas. This analysis should provide clues as to which parts of the reading curriculum are being poorly addressed by the existing teaching programme. Suggestions should also be made about whether the solution to these problems is to be found in improving teaching materials, teaching practices, or perhaps both.
Policy Suggestion 6.3: The Ministry should be asked to examine pupil performance on each of the 59 items of the reading test in order to identify those aspects of the teaching of reading that need to be reviewed and/or improved.
63
Analysis of mastery levels for sub-groups
In Table 6.3 the results for the minimum and desirable levels of mastery for certain sub-groups of pupils have been presented. The first sub-groups examined were boys and girls. The second sub-groups were different socio-economic groups, these were based on the index of possessions in the home, as presented in Chapter 3. The third sub-groups reported were different school locations ranging from isolated areas to urban areas.
The boys tended to perform slightly better than the girls, with 47.0 percent of boys reaching the minimal level in comparison with 45.3 percent of girls. At the desirable level, the results were 5.6 percent and 4.8 percent for boys and girls, respectively. These differences were of an order that fell within the bounds of sampling error. That is, there were no significant gender differences in reading-literacy levels.
A list of ‘possessions in the home’ as described in Chapter 3 was used as a surrogate measure of the socio-economic circumstances of the homes from which the pupils came. Each pupil was given a score from O-14 depending upon the number of possessions located in his or her home. A ‘very low’ socio-economic level was defined for those pupils coming from homes having nothing (0) at home; the ‘low’ level as l-2 possessions; the ‘moderately low’ level as 3 possessions; the ‘moderately high’ level as 4 possessions; the ‘high’ level as 5-7 possessions; and the ‘very high’ level as 8- 14 possessions. It can be seen from the final column of Table 6.3 that this classification divided the total sample of 2,286 pupils into six groups ranging in size from around 262 to 556 pupils.
There were only 26.3 percent of children in the ‘very low socio-conomic group’ who reached minimum mastery, and a negligible amount, 1.3 percent, that reached the desirable level. The percentage of children reaching the minimum mastery level rose dramatically as socio-economic levels ascended. A particularly striking feature of this table was that the percentage of pupils reaching the minimum level was twice as high for the ‘very high’ socio-economic level as it was for the ‘very low’ socio-economic level. Furthermore, for the desirable mastery results, the difference between the two socio-economic groups rose to a factor of around seven.
The third set of figures presented in Table 6.3 showed that there were also major differences in reading performance between categories when the pupils were classified according to whether a school was located in an isolated rural area, a rural area, a small town, or a city. Major increases in differences were observed as the school location categories changed from ‘isolated’ school settings towards ‘urban’ settings. It is important to note that care must be exercised in interpreting these ‘location’ trends because of the possibility that those with lower socio-economic status also lived in more isolated locations.
64

Table 6.3. Percentages of pupils reaching minimum and desirable mastery levels for sub-groups of pupils
Minimum mastery Desirable mastery Sample level level size
% SE % SE
Gender
Boys
Girls
47.0 1.51 5.6 0.70 1062
45.3 1.42 4.8 0.61 1224
Socio-economic level
Very low (0)
Low (l-2)
Moderately low (3)
Moderately high (4)
High (5-7)
Very high (8- 14)
26.3 2.59 1.3 0.66 288
45.3 2.07 3.6 0.78 556
48.2 2.78 3.4 1.01 325
49.8 3.13 5.2 1.39 262
50.0 2.17 7.7 1.16 520
53.4 2.78 9.0 1.59 335
School location
Isolated
Rural
Small town
Large city
32.5 5.23 1.4 1.31 88
40.2 1.49 3.4 0.55 1105
48.6 1.92 4.9 0.83 681
60.6 2.45 11.4 1.59 413
Zanzibar 46.1 1.04 5.2 0.46 2286
Analysis of Narrative, Expository and Document sub-scales
As described above, there were three sub-scales that made up the literacy test: Narrative (21 items); Expository (23 items); and Documents (15 items). The mean scores and sampling errors on each of the three dimensions of the reading achievement for the different regions of Zanzibar have been presented in Table 6.4.
Each sub-scale had different numbers of items. Hence, a better picture is obtained if the average scores are converted into percentages. The overall situation for Zanzibar was then as follows: in the narrative sub-scale 47.6 percent (10 out of 21 items) of responses were correct, in the expository sub-scale 36.5 percent (8.4 out of 23 items), and in the document sub-scale 40.6 percent (6 out of 15 items) of responses were correct. The slightly lower score for expository reading can probably be traced to the fact that there are fewer examples of
65

expository prose in the curriculum and textbooks. To some extent the same is true of document texts since there is a preponderance of narrative texts in the textbooks. These results suggest that an analysis of the textbooks should be undertaken to examine whether they need to be modified in order to include the various types of texts.
Policy Suggestion 6.4: The Ministry should re-examine the types of texts cited in the curriculum and used in the textbooks and, where necessary, modify the texts to include a balance of narrative prose, expository prose, and the document-tvpe texts.
Table 6.4. The means and sampling errors of pupils on the three dimensions of reading achievement
Narrative Expository Document Total test
(21 items) (23 items) (15 items) (59 items)
Mean SE Mean SE Mean SE Mean SE
North Pemba 10.8 0.25 8.7 0.23 5.7 0.14 25.2 0.54
South Pemba 9.3 0.20 8.0 0.18 5.7 0.13 23.0 0.44
North Unguja 8.2 0.26 7.2 0.24 5.2 0.17 20.6 0.58
Urban/West 10.6 0.16 9.1 0.13 6.8 0.10 26.5 0.34
South Unguja 9.0 0.25 7.5 0.24 5.3 0.16 21.8 0.55
Zanzibar 10.0 0.10 8.4 0.09 6.1 0.06 24.5 0.21
In Table 6.5 the narrative, expository and document scores have been presented for the sub-groups listed in Table 6.3. For the sub-classes the same pattern of results emerged, as was evident from the analysis of minimum and desirable mastery levels.
There were no important differences between boys and girls on any of the three scores. Pupils from higher socio-economic backgrounds had much higher scores in each domain than pupils from lower socio-economic backgrounds. Finally, pupils from urban areas scored higher than pupils from rural areas who, in turn, scored higher than pupils from isolated areas in all three domains of reading.
In the above discussion, the reading performance of various sub-groups of pupils was examined. However, a critical question in such an examination is to consider to what extent the patterns of differences among the sub-groups were stable or changing over time? For example: is the superior performance of pupils from urban areas over pupils from rural areas consistent - or is it expanding or contracting with time? Will the emerging improved economic conditions result in a reduction of performance disparities among socio-economic groups? These are very important questions in Zanzibar as rural areas acquire more amenities, and as accessibility from one place to another is being increased due to improvement in transport systems.
66

In order to have access to the information required to answer these kinds of important questions about the quality of education, the Ministry will need to begin planning for the establishment of a strong database related to literacy levels in primary schools.
Policy Suggestion 6.5: The Ministry should design and implement a continuous system for monitoring literacy levels in primary schools, which should feature a detailed analysis of sub-groups of students broken down by variables such as district, gender, socio-economic level, and school location.
Table 6.5. Means and sampling errors of different sub-groups of pupils
Sub-groups Narrative Expository Documents
Mean SE Mean SE Mean SE
Gender
Boys 9.9 0.14 8.4 0.13 6.2 0.09
Girls 10.0 0.14 8.5 0.11 6.0 0.08
Socio-economic level
Very low (0)
Low (l-2)
Moderately low (3)
Moderately high (4)
High (5-7)
Very high (8- 14)
7.7 0.25 6.7 0.24 4.5 0.14
9.7 0.18 8.2 0.16 5.9 0.12
9.8 0.25 8.3 0.22 6.0 0.16
10.7 0.27 8.8 0.25 6.5 0.18
10.5 0.21 9.1 0.18 6.6 0.14
10.9 0.28 9.2 0.24 6.7 0.17
School location
Isolated
Rural
Small town
Large city
8.8 0.45 7.3 0.42 5.4 0.30
9.3 0.14 7.9 0.12 5.6 0.09
10.1 0.18 8.6 0.15 6.3 0.11
11.7 0.25 9.7 0.21 7.1 0.16
Zanzibar 10.0 0.10 8.4 0.09 6.1 0.06
67
Conclusion
A detailed examination of the reading-literacy levels of Standard 6 pupils in Zanzibar has been presented.
Two key points concerning this examination need to be restated: (a) the test used to assess Standard 6 literacy levels was prepared in a scientific manner in order to ensure its validity for this purpose, and (b) the ‘minimum’ and ‘desirable’ performance levels were specified by Zanzibar reading specialists before the data were collected and analyzed.
These two key points, when taken in combination with overall poor performance of the pupils in Zanzibar and the extremely poor performance of certain sub-groups of pupils, suggest that the time has come for a searching and rigorous review of the quality of the reading/language curriculum, as well as of the quality of teachers and their teaching methods. Several starting points have been suggested in this chapter. However, the magnitude of the challenge suggests that a serious attack on this area will require the Ministry to undertake some serious research in order to identify appropriate solutions, and then to allocate sufficient resources to develop strategies for implementing those solutions.
68

Chapter 7
An Agenda for Action
Introduction
It has been seen that the conditions of schooling in Standard 6 are far from ideal. It would not be an exaggeration to say that there is a crisis in primary education in Zanzibar. There are problems with school buildings in that many are seen to be in need of major repair; there is a lack of classroom furniture and supplies; only 10 per cent of pupils have their own textbooks, and only 50 per cent have exercise books; most classrooms do not have a classroom library and many of the schools do not have a school library; and, many of the teachers do not have the minimum teacher training and insufficient have had in-service teacher training.
There would appear to be a lack of national policy for several key factors to do with education. Indeed, there was a lack of benchmarks in the Ministry itself for various aspects of school conditions. There was an unequal distribution of some supplies to different regions and this appears to have gone unnoticed until this present survey was undertaken.
All of the above lead to the conclusion that there is a crisis in primary education in Zanzibar and that there needs to be a re-awakening within the Ministry itself as well as in the communities. Some educational facilities can be provided by the Ministry but co-operation between all partners involved in the educational process is necessary if the quality of education is to be improved. It is not sufficient for parents to pay something towards education. They must also be part of it, see the relevance of it for their children, and want high standards of education to be established and maintained. The school should be one of the key focal points of the community. This state of affairs does not happen by magic. The Ministry and school personnel can do much to make it happen.
Many of the suggestions that are listed at the end of this chapter will demand a high level of co-operation between the communities and the Ministry as represented by its regional and district officers. These persons must have the determination to make things happen in the first place. In particular, the Ministry must ensure, through systematic planning, that the standards of school conditions and the quality of education are improved and maintained. An enormous effort will be needed to make the required changes in the system of education.
The policy suggestions presented in earlier chapters have been written in provocative terms with the aim of generating widespread discussion and debate. It is to be hoped that officials and decision-makers within the Ministry will join this process of review and then take steps to prepare a realistic plan of action - bearing in mind that at the beginning something akin to a national campaign for educational reform will be needed. It is not appropriate to assume that aid agencies will provide ‘simple solutions via the cheque book’. Zanzibar must be self-reliant and the government must persuade parents to do much more in support of their children’s education than has been achieved up to this point of time. It is for these reasons that many of the policy suggestions will require action by communities, in collaboration with the Ministry, although there are also many steps suggested that the Ministry itself should undertake.
69

Classification of policy suggestions
There was a total of 37 policy suggestions made in the previous chapters of this report. These suggestions were prepared on the basis of a careful interpretation of the results of the data analyses, and with the added benefit of consultations with decision-makers at different levels of the education system. It would not have been helpful for the Ministry of Education to receive these policy suggestions as a simple list. This approach would not have recognized the different nature of many of the suggestions and would have ignored differences in time and costs related to their implementation. Instead, it was decided to undertake a systematic classification of the suggestions according to their operational implications for the Ministry. It was considered that this form of classification would facilitate a more coherent debate concerning the prioritization of the suggestions and the subsequent selection of realistic avenues of action. Five main groups of policy suggestions emerged from this analysis. The following discussion lists the suggestions according to group membership, provides a short statement of the operational implications associated with each group, and gives three examples of actions required.
Group 1: Consultations with staff, community, and experts. The four policy suggestions (3.6, 3.18, 3.19 and 6.1) which have been included under this heading required consultations with staff in regional offices and schools, with parents, and with experts in the appropriate fields. For example, consultations with the major stakeholders in the education system to agree on the use of standardized Kiswahili in schools; a conference with inspectors, focusing on their new role in the monitoring of quality of education; discussions with teachers on their job satisfaction; and discussions with teachers, inspectors, and parents to devise strategies to improve the reading achievement of Standard 6 pupils.
Group 2: Reviews of existing planning and policy procedures. The 10 policy suggestions (3.2, 3.5, 3.10, 3.12, 3.16, 3.17, 4.1, 4.4, 5.3 and 5.4) included under this heading identified established practices in the policy and planning area which need to be evaluated and reviewed. These suggestions required desk studies to develop new policies related to certain current practices. For example, a review of entrance age, and criteria for repetition at the primary level; redeployment of children’s mobile libraries to service those areas in Zanzibar where homes have relatively few books; establishment of a national policy in the amount and frequency of homework for different grades and a structure for its monitoring; a review of the criteria for posting and transfer of teachers and head teachers - especially in rural schools; maintenance of a programme of regular meetings with parents; establishment of benchmarks for the educational environment to ensure proper functioning of primary schools; and the delegation of more autonomy at regional level for the prioritization of needs and subsequent allocation of resources.
Group 3: Data collection for planning purposes. The six policy suggestions (3.3, 3.13, 3.15, 4.2, 4.6 and 5.1) under this heading required the Ministry to establish a data-collection strategy which would be useful for planning purposes. For example, a national audit of the additional infrastructure requirements required to universalize primary education; the identification of untrained/unqualified Standard 6 teachers; an audit of existing educational materials and equipment; and the identification of needs for more schools.
Group 4: Educational policy research projects. The 10 policy suggestions (3.1, 3.4, 3.7, 3.8, 3.9, 3.11, 6.2, 6.3, 6.4 and 6.5) listed under this heading identified an educational policy
70

research programme for the Ministry. For example, a follow-up survey of the same target population employed during the SACMEQ’s initial project; studies to validate gender differences in participation rates; a survey on absenteeism of pupils; and a survey on private tuition; a study on linkages (if any) between repetition and improved performance.
Group 5: Investment in infrastructure and human resources. The seven policy suggestions (3.14, 3.20, 3.21, 3.22, 4.3, 4.5 and 5.2) included under this heading highlighted several areas requiring the improvement of diverse educational inputs such as teacher professional development competencies, and the provision of materials, furniture, and physical structures. This required the Ministry to mobilize/reallocate funds for their implementation; for example, the formulation and implementation of a plan to mobilize/reallocate funds for the provision of resources to schools.
In Table 7.1 each of the 37 policy suggestions, grouped under the five categories above, was linked to the relevant implementing agency/unit of the Ministry. In addition broad estimates for the implementation time and costs were included. The headings used in the table are explained below.
Relevant department: The name of the unit, branch, department or special group within the Ministry that should be given responsibility for initiating action with respect to each policy suggestion.
Implementation time: A very approximate time estimate for implementing each policy suggestion based on a three-point scale: ‘short’ - around three to nine months; ‘medium’ - around one to two years; and ‘long’ - around three to five years.
Estimated costs: An approximate cost estimate for implementing each policy suggestion according to a three-point scale: ‘low’ for initiatives that required no increased expenditure and could be accommodated within existing budgets through redeployment of staff, more efficient use of resources, and redefining existing procedures; ‘moderate’ for activities that needed to be funded in addition to current Ministry operations; and ‘high’ for large-scale investments in capital works and human resources.
From policy suggestions to action
It is useful to think of policy suggestions first in terms of the time it will take to accomplish some of the tasks and, second, in terms of their implied costs. A list was made of categories that could be used for summarizing the many policy suggestions that were listed in previous chapters. There were suggestions that could be implemented more or less immediately and completed in a relatively short period of time; these have been called ‘short term’. There were other policy suggestions that will require a lead-in period before the action can be taken and, although they should be addressed immediately, it will be some two to three years before they can be completed; these have been called ‘medium term’. Then there were those policy suggestions that will either take some four or five years to complete or will need to go on for a longer term; these have been called ‘long term’.
It must be emphasized that even for the ‘medium-term’ and ‘long-term’ categories, the work should begin immediately. It will just take longer to accomplish. At the same time it is
71
recognized that it will be difficult to deal with all suggestions at the same time and that some setting of priorities will be required. In this case, it would be desirable that the basic essentials should be given the highest priority. These include all classrooms having a useable chalkboard, chalk and some furniture, and the pupils having a textbook and exercise book and the wherewithal to write. When these basic requirements have been satisfied, then work can begin on other problems, such as the major repairs to school buildings. The setting of priorities is a matter for the Ministry to take up as soon as this report is made public.
72
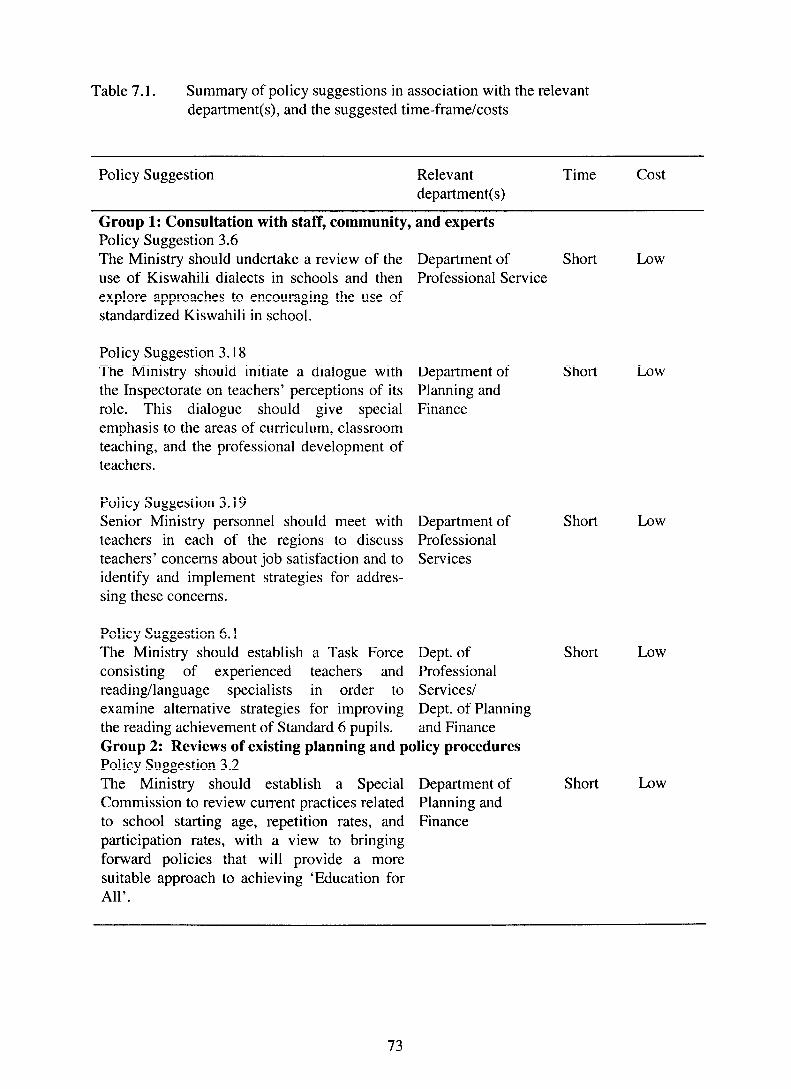
Table 7.1. Summary of policy suggestions in association with the relevant department(s), and the suggested time-frame/costs
Policy Suggestion Relevant department(s)
Time cost
Group 1: Consultation with staff, community, and experts Policy Suggestion 3.6 The Ministry should undertake a review of the Department of Short Low use of Kiswahili dialects in schools and then Professional Service explore approaches to encouraging the use of standardized Kiswahili in school.
Policy Suggestion 3.18 The Ministry should initiate a dialogue with Department of the Inspectorate on teachers’ perceptions of its Planning and role. This dialogue should give special Finance emphasis to the areas of curriculum, classroom teaching, and the professional development of teachers.
Short Low
Policy Suggestion 3.19 Senior Ministry personnel should meet with Department of teachers in each of the regions to discuss Professional teachers’ concerns about job satisfaction and to Services identify and implement strategies for addres- sing these concerns.
Short Low
Policy Suggestion 6.1 The Ministry should establish a Task Force Dept. of consisting of experienced teachers and Professional reading/language specialists in order to Services/ examine alternative strategies for improving Dept. of Planning the reading achievement of Standard 6 pupils. and Finance Group 2: Reviews of existing planning and policy procedures Policy Suggestion 3.2 The Ministry should establish a Special Department of Commission to review current practices related Planning and to school starting age, repetition rates, and Finance participation rates, with a view to bringing forward policies that will provide a more suitable approach to achieving ‘Education for All’.
Short Low
Short Low
73

Table 7.1 (continued)
Policy Suggestion Relevant department(s)
Time cost
Policy Suggestion 3.5 Given the low numbers of books in the homes Dept. Library of many children and the known relationship Services between book availability and reading achieve- ment, the Ministry should encourage children’s mobile libraries to visit those areas of Zanzibar where homes have relatively few books.
Short Low
Policy Suggestion 3.10 The Ministry should establish a national policy Department of on the frequency and amount of homework for Professional different grades in school. The Inspectorate Services should then ensure that this policy is imple- mented by schools.
Short Low
Policy Suggestion 3.12 The Ministry should design a policy for the Department of distribution of teachers to schools and develop Education a reward system for female teachers to teach, and continue to teach, in rural schools.
Short Medium
Policy Suggestion 3.16 The Ministry should establish a common Inspectorate policy on the regularity of giving written tests to pupils in order to ensure greater uniformity across regions in this important area of the educational environment.
Short Low
Policy Suggestion 3.17 The Ministry should introduce instruction on Department of ‘meeting parents’ into teacher training pro- Education/ grammes, and should also ask school heads to Department of ensure that teachers meet with parents on a Professional regular basis to discuss the progress of pupils. Services
Short Low
Policy Suggestion 4.1 The Ministry should review and, if necessary, Department of establish benchmark standards for the educa- Education/ tional environment that are deemed to be Department of reasonable for the proper functioning of Planning and primary schooling. Finance
Short Low
74

Table 7.1 (continued)
Policy Suggestion Relevant department(s)
Time cost
Policy Suggestion 4.4 The Ministry should examine the official Department of policies for posting teachers to schools in order Education to obtain a more equitable distribution in terms of staffing ratio among and within regions.
Short Low
Policy Suggestion 5.3 The Ministry should pay attention to the Department of inequity among regions with respect to the Professional experience of school heads, inspectors’ visits, Services and pupil/teacher ratio. South Unguja should diminish the large amount of variation associated with the experience of school heads in its region.
Short Low
Policy Suggestion 5.4 Education regions should be allowed to plan Department of Short Low their own resource allocation according to their Administration and priority needs. They should also periodically Civil Services conduct audits within the districts in their jurisdiction to check the equitable distribution of resources.
Group 3: Data collection for planning Policy Suggestion 3.3 The Ministry should, as a matter of urgency, Department of identify the number of classrooms required in Planning and each school in order to enrol all primary- Finance school-aged children and mount a campaign for communities to work with government to build and maintain these classrooms.
Short High/ Medium
Policy Suggestion 3.13 The Ministry should identify the unqualified Department of Standard 6 teachers and then establish a long- Professional term plan to provide them with supplementary Services training up to the official requirement of two years of teacher education.
Short Medium
75
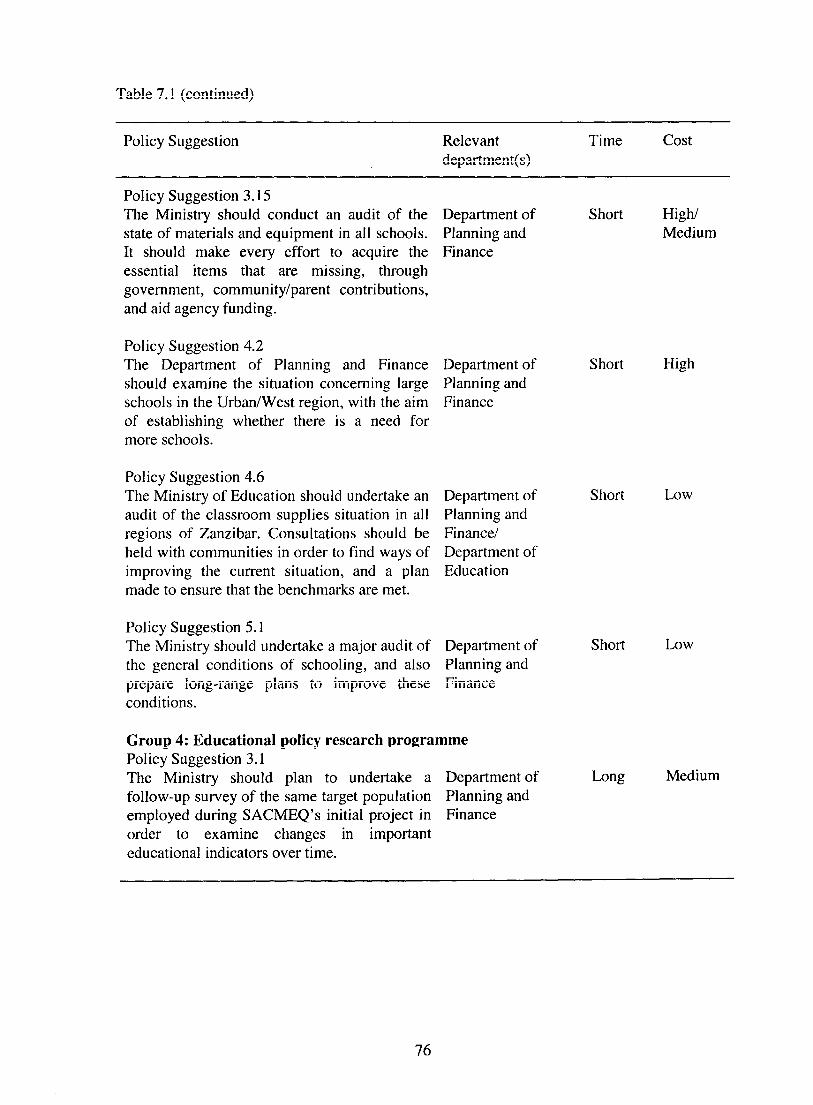
Table 7.1 (continued)
Policy Suggestion Relevant department(s)
Time cost
Policy Suggestion 3.15 The Ministry should conduct an audit of the Department of state of materials and equipment in all schools. Planning and It should make every effort to acquire the Finance essential items that are missing, through government, community/parent contributions, and aid agency funding.
Short High/ Medium
Policy Suggestion 4.2 The Department of Planning and Finance Department of should examine the situation concerning large Planning and schools in the Urban/West region, with the aim Finance of establishing whether there is a need for more schools.
Short High
Policy Suggestion 4.6 The Ministry of Education should undertake an Department of audit of the classroom supplies situation in all Planning and regions of Zanzibar. Consultations should be Finance/ held with communities in order to find ways of Department of improving the current situation, and a plan Education made to ensure that the benchmarks are met.
Short Low
Policy Suggestion 5.1 The Ministry should undertake a major audit of Department of the general conditions of schooling, and also Planning and prepare long-range plans to improve these Finance conditions.
Short Low
Group 4: Educational policy research programme Policy Suggestion 3.1 The Ministry should plan to undertake a Department of follow-up survey of the same target population Planning and employed during SACMEQ’s initial project in Finance order to examine changes in important educational indicators over time.
Medium
76
.- - -

Table 7.1 (continued)
Policy Suggestion Relevant department(s)
Time cost
Policy Suggestion 3.4 The Ministry should conduct two case studies, Department of using the regional education officers in North Planning and Pemba and Urban/West, in order to validate Finance gender differences observed in participation rates, and then identify the causes of these disparities, with a view to taking immediate action to achieve equity in this area.
Short Low
Policy Suggestion 3.7 The Ministry should conduct a small study on Department of the extent of absenteeism in schools and the Education reasons for it. It should then establish regula- tions that lower absenteeism. It is suggested that this study be conducted in 1998 and the new regulations be put in place in 1999.
Short Low
Policy Suggestion 3.8 The Ministry should conduct a small-scale Department of investigation of extra tuition in primary Education schools, in order to establish which pupils are receiving tuition, under what conditions, and for what levels of payment.
Short Low
Policy Suggestion 3.9 The Ministry should conduct a small-scale Department of investigation in several schools in order to Education discover the effectiveness of the extra tuition as it is now given.
Medium Low
Policy Suggestion 3.11 The Ministry should undertake a study to Department of examine the criteria used by schools to identify Education pupils for grade repetition and also to test whether repetition is linked with improved performance by the pupils who repeat.
Short Low
Policy Suggestion 6.2 The Ministry should undertake a national Department of investigation with respect to reading policy and Professional the mastery of basic literacy. Services
I-w3 Medium
77
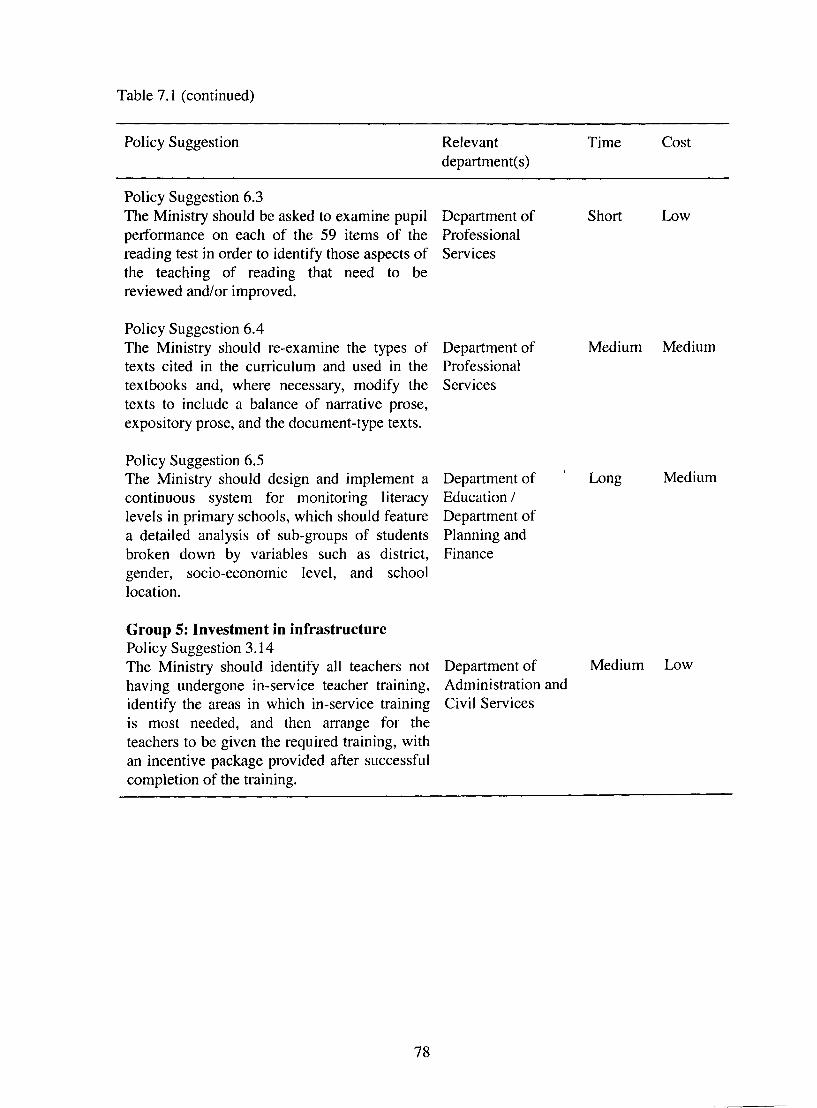
Table 7.1 (continued)
Policy Suggestion Relevant department(s)
Time cost
Policy Suggestion 6.3 The Ministry should be asked to examine pupil Department of performance on each of the 59 items of the Professional reading test in order to identify those aspects of Services the teaching of reading that need to be reviewed and/or improved.
Short Low
Policy Suggestion 6.4 The Ministry should re-examine the types of Department of texts cited in the curriculum and used in the Professional textbooks and, where necessary, modify the Services texts to include a balance of narrative prose, expository prose, and the document-type texts.
Medium Medium
Policy Suggestion 6.5 The Ministry should design and implement a Department of continuous system for monitoring literacy Education / levels in primary schools, which should feature Department of a detailed analysis of sub-groups of students Planning and broken down by variables such as district, Finance gender, socio-economic level, and school location.
’ Long Medium
Group 5: Investment in infrastructure Policy Suggestion 3.14 The Ministry should identify all teachers not Department of Medium Low having undergone in-service teacher training, Administration and identify the areas in which in-service training Civil Services is most needed, and then arrange for the teachers to be given the required training, with an incentive package provided after successful completion of the training.
78

Table 7.1 (continued)
Policy Suggestion Relevant department(s)
Time cost
Policy Suggestion 3.20 The Ministry should: (a) encourage and strengthen community participation to undertake repairs of school buildings; (b) inculcate within the school community the culture of preventive maintenance in order to prevent an acceleration of damage to buildings; and (c) identify the different kinds of repairs needed and produce a IO-year plan for undertaking this work.
Policy Suggestion 3.2 1 The Ministry should develop a priority list of general school facilities and then prepare a strategy for working with major funding agencies to obtain the most essential items for schools.
Policy Suggestion 3.22 The Ministry should devise strategies to improve access to books through the provision of school and classroom libraries. Measures should be taken to ensure that, where school and classroom libraries are available, the pupils can borrow books and take them home to read.
Policy Suggestion 4.3 The Ministry should take measures to address the problem of overcrowding in classrooms in the Urban/West region.
Policy Suggestion 4.5 The Ministry should reinforce the plan to improve classroom furniture supplies through a ‘partnership scheme’ with school communities.
Policy Suggestion 5.2 The regions of North Unguja and Urban/West should take steps to reduce the variation among schools in the provision of classroom libraries; and South Unguja should review the variations in the quality of teacher housing.
Department of Education / Department of Planning and Finance
Department of Planning and Finance
Short
Department of Education / Funding Agency
I-Q%
Department of Education
Medium
District Offices and Medium School Councils
Department of Education
Medium
High
High
High
High
LOW
High
79

Some general comments on implementing the policy suggestions
Short-term and low-cost policy suggestions
1. Initiate a data collection on selected variables. There appeared to be doubt about some of the teacher and school head qualification data, as well as on the availability of toilets in some schools. Further accurate data are required in each of these important areas. The district education officers should be given a small set of questions which they should ask teachers and school heads in their districts to complete, when they visit their schools. The cost for this data collection should be small, in that the Ministry can prepare the questionnaire and the data can be entered and analyzed using the hardware and software at the Ministry. Depending on the results, the Ministry may or may not have to take action.
2. IdentifL extra classrooms that are needed. It was suggested earlier in this report that there were still problems in having all primary-school-aged children enrolled in schools, and that the major problem was that there were insufficient places in the existing classrooms, in part because of the policy of grade repetition, and that more classrooms were needed. It is suggested that when the district education officers undertake the small data collection mentioned above, they should also hold discussions with the teachers and heads in their schools in order to identify the perceived number of primary-school-aged children who are not enrolled in the catchment area for the school. The extent of overcrowding in the existing classrooms should be noted and all of these data reported to the Ministry. The Ministry will then be able to plan for the extra classrooms needed. In some cases, it should be possible to have the community build on an extra classroom to the school and, in other cases, the Ministry will have to organize the building and materials needed. In all cases, the Ministry will have to plan for the textbooks needed, as well as the teachers needed to man the new classrooms. A five-year plan should be developed such that by the early years of the next millennium, all primary-school-aged children are in primary school.
3. IdentifL the reasons for the disparity in the enrolment of boys and girls in the North Pemba and UrbanlWest regions. It was only in the regions of North Pemba and Urban/West that there were disparities in the enrolments of boys and girls. The district education officers in these two regions should ask school heads and teachers in these regions as to why this is so. If these interviews uncover the reasons, then a policy can be developed to ensure that no disparities occur. If they do not provide useful information, then the Ministry should organize a household survey in the two regions in order to discover the reasons for the disparities.
4. Develop a national policy on homework. The results of this present survey showed that there appeared to be an insufficient amount of homework being given to pupils in Standard 6. There is a wealth of research that shows that homework is always beneficial for improving achievement within all social groups in school. However, the homework must be given regularly and in reasonable amounts. It must also be marked by the teachers and then worked through with the pupils. It is suggested that the inspectors should meet with groups of Standard 6 teachers in each of the regions in order to develop a national policy for Grade 6 homework. The inspectors may wish to take this further and develop a national policy for all subjects in each standard in primary school. The policy should then be promulgated by the Ministry and the Inspectorate should ensure that it is adhered to.
80
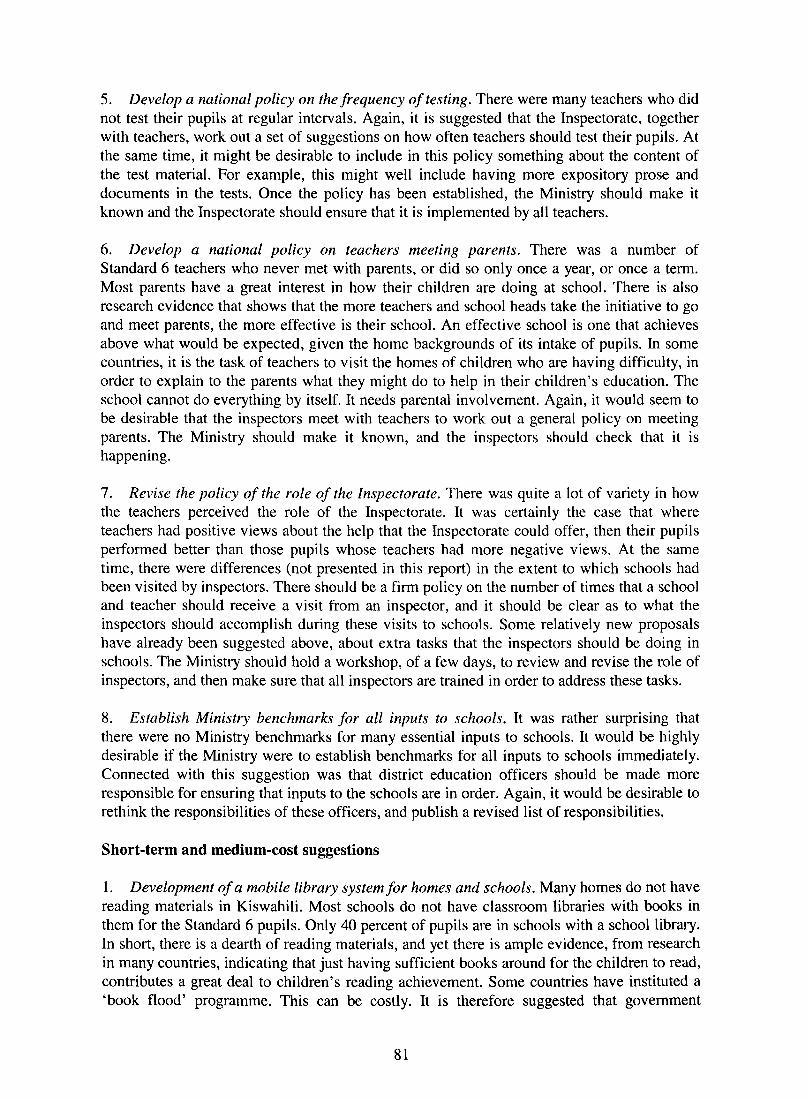
5. Develop a national policy on the frequency of testing. There were many teachers who did not test their pupils at regular intervals. Again, it is suggested that the Inspectorate, together with teachers, work out a set of suggestions on how often teachers should test their pupils. At the same time, it might be desirable to include in this policy something about the content of the test material. For example, this might well include having more expository prose and documents in the tests. Once the policy has been established, the Ministry should make it known and the Inspectorate should ensure that it is implemented by all teachers.
6. Develop a national policy on teachers meeting parents. There was a number of Standard 6 teachers who never met with parents, or did so only once a year, or once a term. Most parents have a great interest in how their children are doing at school. There is also research evidence that shows that the more teachers and school heads take the initiative to go and meet parents, the more effective is their school. An effective school is one that achieves above what would be expected, given the home backgrounds of its intake of pupils. In some countries, it is the task of teachers to visit the homes of children who are having difficulty, in order to explain to the parents what they might do to help in their children’s education. The school cannot do everything by itself. It needs parental involvement. Again, it would seem to be desirable that the inspectors meet with teachers to work out a general policy on meeting parents. The Ministry should make it known, and the inspectors should check that it is happening.
7. Revise the policy of the role of the Inspectorate. There was quite a lot of variety in how the teachers perceived the role of the Inspectorate. It was certainly the case that where teachers had positive views about the help that the Inspectorate could offer, then their pupils performed better than those pupils whose teachers had more negative views. At the same time, there were differences (not presented in this report) in the extent to which schools had been visited by inspectors. There should be a firm policy on the number of times that a school and teacher should receive a visit from an inspector, and it should be clear as to what the inspectors should accomplish during these visits to schools. Some relatively new proposals have already been suggested above, about extra tasks that the inspectors should be doing in schools. The Ministry should hold a workshop, of a few days, to review and revise the role of inspectors, and then make sure that all inspectors are trained in order to address these tasks.
8. Establish Ministry benchmarks for all inputs to schools. It was rather surprising that there were no Ministry benchmarks for many essential inputs to schools. It would be highly desirable if the Ministry were to establish benchmarks for all inputs to schools immediately. Connected with this suggestion was that district education officers should be made more responsible for ensuring that inputs to the schools are in order. Again, it would be desirable to rethink the responsibilities of these officers, and publish a revised list of responsibilities.
Short-term and medium-cost suggestions
1. Development of a mobile library system for homes and schools. Many homes do not have reading materials in Kiswahili. Most schools do not have classroom libraries with books in them for the Standard 6 pupils. Only 40 percent of pupils are in schools with a school library. In short, there is a dearth of reading materials, and yet there is ample evidence, from research in many countries, indicating that just having sufficient books around for the children to read, contributes a great deal to children’s reading achievement. Some countries have instituted a ‘book flood’ programme. This can be costly. It is therefore suggested that government
81
provides a mobile library system for homes - especially in the rural areas - and that this is run in parallel with a mobile library for schools. Homes should be able to borrow books for a nominal sum, and schools should be able to borrow books free of charge. However, when the pupils borrow books to take home and they are damaged, parents should be required to pay for the damage to the book. If the book is lost, then the parents should pay for the replacement of the book. It is suggested that the service begins with one van and driver on a trial basis, and the system be made to run smoothly before more extensive implementation.
2. Identify teacher concerns. It is clear from the results that teachers have several concerns about the strengths and weaknesses of the operation of the current system. It would be desirable to convene a two-day workshop of selected teachers from rural and urban areas to discuss the concerns of teachers about teaching/learning conditions and, at the same time, expand these suggestions with more concrete detail. The concerns should be addressed by the Ministry in terms of what it can do to improve matters, either through direct inputs or through teacher training or modifications to the curriculum.
Short-term and high-cost suggestions
1. Improve classroom supplies. There is a paucity of both supplies and furniture in the classrooms in Standard 6. Even though the data in this report refer to Standard 6, there is no reason to believe that the situation is any better in other classrooms. There are certain items that will cost money and cannot be produced by parents or others in the community, but there are some items of furniture that could be produced relatively cheaply by parents.
The first step is for the Ministry to have the district education officers collect data from all schools in their districts concerning the availability of essential inputs (textbooks, exercise books, writing materials, usable chalkboards and chalk) that are needed in each classroom in each school. This would provide a census audit of the situation. Following this, the Ministry should calculate the amount of money needed to ensure that children have the textbooks, and the classrooms have the basic equipment needed for children to learn. Without these basic supplies and equipment, it becomes an impossible task to teach effectively. It is suggested that the Ministry then decides how much money can be provided by the Ministry, and how much is needed from aid agencies. It may be necessary to purchase supplies over a period of a few years if all children are to have the required items.
2. Improve classroom furniture. At the same time, bookshelves, cupboards, and a teacher’s desk are needed in each classroom. It is quite reasonable to expect communities to provide these items free of charge to the schools and their classrooms. There are carpenters in the communities who could do the work, but the parents could pay for the wood and other material required. This is basically a ‘one-off’ undertaking because once the classrooms have these items they should last a long time. The Ministry can mount a large-scale campaign, and with some effort the classrooms should be able to have the basic equipment within a year. It is, of course, paramount that the communities do support their schools if aid agencies are to be asked to help.
82

Medium-term and low-cost suggestions
1. Conduct a study on absenteeism. It has been suggested that, in general, the absenteeism rate is unacceptably high, even though the figures did not come from this present survey. The first thing is to check the absenteeism figures, and this can be done as part of the district officers’ work. If absenteeism is high, then the Ministry should mount a small study to identify the causes of absenteeism and then take the necessary action according to the results of the study.
2. Conduct a study on extra tuition. Nearly half of the children in Standard 6 were undertaking some form of extra tuition, although the exact form was not known. The Ministry should conduct a small study on extra tuition in order to find out: (a) which kinds of children are taking extra tuition; (b) who gives it to them; (c) how much is paid for it; and (d) if it has an effect on general achievement. This is a complicated study and should be undertaken with care. In Mauritius, for example, about 75 percent of Standard 6 children have extra tuition and it is effective in the sense that it has been shown to compensate for other variables, such as not speaking English at home, poor home conditions, and so on. However, there is the fear that teachers split the curriculum into what is taught during school hours and that taught in private tuition sessions. In other words, the parents are simply subsidizing education in that the state pays for the morning part of education, and the parents pay directly for the afternoon part of education. Whether this should be the case or not is a political matter. However, for Zanzibar, this small study should first be carried out, and carried out well, so that the facts can first be ascertained, and then decisions taken on the best way to use extra tuition for the good of the total system.
3. Conduct a study on grade-repetition. Twenty-five percent of Standard 6 pupils have repeated a grade at least once. This results in nearly a quarter of the children using up classroom places in the beginning grades of primary school. It also means that more teachers and more textbooks are required than foreseen. Grade repetition also tends to increase the standard deviation of achievement of an age group, but decrease it of a grade group. There are many systems that practise automatic promotion without, apparently, any ill effects. What, therefore, is the exact situation in Zanzibar? The Ministry should undertake a study to assess the following: (a) how are decisions taken about the promotion of a pupil from one standard to the next? (b) in which standards does the most repetition occur? (c) do children who repeat learn more by repeating than by being promoted? and (d) what are the resultant standard deviations in achievement for an age and a grade group? On the basis of the results, the Ministry can then decide on leaving the system as it now is, or on modifying it.
Medium-term and medium-cost suggestions
1. Mod& the reading textbooks. The general level of reading literacy at the Standard 6 level was low. The range of scores on the 59-item test was from 0 to 56. Nearly 18 percent of the pupils scored at around the ‘guessing’ level. The score on narrative prose was better than for expository and documents. The first question to ask is: do the textbooks require children to understand the prose they read? A second question is: is the difficulty level of the textbooks appropriate? The third question is: do sufficient examples of expository prose and documents appear in the textbooks? The Curriculum Division should re-examine the textbooks with the above questions in mind and then undertake modifications, if required. At the same time, it is important that the teachers give sufficient emphasis to understanding the text. This should be
83

emphasized in their teaching and in the types of questions they pose in their teacher-devised tests. Again, if it is deemed to be necessary, these kinds of issues can be dealt with in the pre- and in-service teacher training programmes. However, it is up to the Curriculum Division to make sure that these issues are taken up by the trainers of the teachers.
1. Supply supplementary readers to Standard 6 classes. This point is related to the issue about mobile libraries and more reading materials for the pupils. If at all possible, the Ministry should provide supplementary texts in Kiswahili to selected Standard 6 classrooms. This should begin in the Unguja regions, where there was felt to be a need.
2. Allocate more Kiswahili teachers to the Unguju regions. This is related to the relatively poor achievement in the Unguja regions, where it was felt that there was a need for further good teachers of Kiswahili. It is up to the Ministry to decide on the best ways of allocating teachers to schools, and having enough enticements to ensure that they stay there. This is not an easy matter and will need careful thought.
3. Distribution of more female teachers to rural schools. In general, female teachers tend to have better results with their pupils’ reading achievement than do male teachers in primary schools. It was seen in Chapter 3 that nearly 90 percent of the teachers in Urban/West were female, but only 30 percent of the teachers in the Unguja regions were female. Either more females from the rural areas should be trained to be teachers (on condition that they return to their regions) or female teachers will have to be posted from the urban to the rural areas.
Medium-term and high-cost suggestions
1. Identify, and train all unqualified teachers. There is still a considerable number of teachers in the system who appear not to have the minimum qualifications. These teachers are known to the Ministry. The Ministry should organize short courses that will ensure that these teachers receive the extra training deemed to be necessary. The Ministry should decide on the content of the training, develop the course, and then ensure that over a three-year period all of these teachers receive the further training they need. The plan for the content of this training and the holding of the various courses should be established immediately.
2. Provide in-service training courses for all teachers who have not yet participated in them. The Ministry has now established a system for in-service training. Priority for participation in this programme should be given to teachers in the regions of North and South Pemba and Urban/West. The plan to do this should be established immediately.
3. Provide all schools with some basic equipment. It was seen in Chapter 3 that there were very many schools that did not have basic equipment. It was also seen in Chapter 5 that there was inequity in the distribution of school resources between and within regions, and that the Ministry needed to take action to ensure that there was more equity. From the various items of equipment, the following items have been selected as having to do with learning in general. It is deemed that a machine should be in every school for teachers to reproduce their own learning materials and tests. It is also suggested that there should be a typewriter in each school so that teachers can type their materials or have someone else at the school type them. Thirdly, there should be an overhead projector. This of course assumes that there is electricity in the school and that there is at least a white wall that can be used as a screen. Finally, where foreign languages are being taught, it is useful to have a tape recorder to allow pupils to hear
84

the foreign language and to test their own efforts by hearing themselves speak. However, it is the reproducing machine and typewriter that are most important. The Ministry should calculate the cost of purchasing these items and then work out a three- to five-year plan whereby the items can be placed in all schools.
Long-term and medium-cost suggestions
1. Repair and rebuild school buildings. It was seen that 50 percent of pupils were in schools where the school heads perceived that the school buildings were in need of major repair or complete rebuilding. In South Pemba and North Unguja these percentages were 79.4 and 61.3 respectively. It is suggested that the Ministry have an audit carried out (perhaps starting in South Pemba and North Unguja) in order to list the repairs to be made to all schools in at least the two regions mentioned. Major rebuilding may well require government funding and action. But, there will be a series of smaller repairs that should be able to be undertaken by the communities. The Ministry will need to discuss with the community leaders what it is reasonable to expect the communities to do. Following these discussions, a detailed plan should be drawn up to show which repairs will be carried out by which bodies, according to which deadlines. A maintenance plan should also be drawn up for a lo-year period.
2. Initiate parent-teacher workshops. As already mentioned, education is really a co-operative effort between homes and schools. It is suggested that the Ministry identify those schools that have particularly low scores in reading -- even in Standards 1 and 2 - and then initiate parent-teacher workshops in those schools. In some countries schools have initiated parent-teacher workshops where the mothers (often illiterate) come to the school and work with the teachers. Ostensibly the mothers are helping the teacher make flash cards and other materials for the classroom. But, behind all of this, the teachers are trying to get two messages across to the mothers. They attempt to have the mothers change their parental behaviour in the home, and as far as reading is concerned, the mothers should do two things: (a) ask their children to read to them the story that the children happen to be reading; and (b) ask the children to tell them the story that they, the children, have just finished reading. It has been found that these kinds of behaviours in the homes help to increase the children’s reading achievement.
3. Conduct sample surveys of achievement in different subject areas at five-year intervals. The sample survey reported in this publication was the first time that such an exercise was conducted in Zanzibar. It has provided a wealth of information - some of which confirmed the Ministry’s impressions and some of which was new. In particular, it included a test of reading literacy and it explained the relationships between various factors and pupil performance on this test. If the Ministry is to know what is happening in the system in an objective manner, it is essential that these sample surveys form part of an ongoing programme of educational policy review. It is, therefore, suggested that the Ministry establish a budget line and unit for the conduct of such surveys for the foreseeable future.
85
A final word
In education there is no such thing as unicausality. There are many factors that determine how children learn and how well they learn. Based on Zanzibar’s data from the SACMEQ’s Initial Project, it has been seen that there are many factors from the home as well as from the school that affect the reading literacy of pupils. The conditions in Zanzibar’s schools were shown to be extremely poor, and it was recognized that all the needed resources are not immediately available to put all of these deficiencies in order at once. In many ways it is difficult to know where to begin, and the Ministry will have to be very careful in the priorities it sets. Some suggestions have been given above about priorities, but in the end the Ministry must decide. Probably the first step is to have a meeting of the heads of divisions within the Ministry to discuss and rework the above suggestions. What is clear from this survey, however, is that there is a crisis in the primary school education system in Zanzibar and that an enormous effort is needed to improve the whole education programme that is being offered. This is a matter for the whole country and the whole population must be mobilized to help in this all-out effort. The Ministry’s role will be to act as both a catalyst and facilitator in bringing together all possible sources of support and ensuring that efforts are directed towards clearly defined and agreed goals for Zanzibar’s education system.

References
Buretta, B.N.V. (1994). Tanzania: system of education In: Hu&n, T. and Postlethwaite, T.N. * International Encyclopedia of Education. p. 5903. Oxford: Pergamon.
Elley, W. (1992). How in the world do students read? The Hague: International Association for the Evaluation of Educational Achievements.
Pollitt, E. (1990). Malnutrition and infection in the classroom. Paris: UNESCO.
Postlethwaite, T.N. ; Ross, K.N. (1992). EfSective schools in reading: implications for educational planners. The Hague: International Association for the Evaluation of Educational Achievement.
Ross, K.N. (1991). Sampling Manual for the IEA international study of reading literacy. The Hague: International Association for the Evaluation of Educational Achievement.
Schleicher, A. (1995). Data Entry Manager (DEM) User’s Guide. Paris: UNESCO/IIEP.
87
-.

IIEP Publications and Documents
More than 1,200 titles on all aspects of educational planning have been published by the International Institute for Educational Planning. A comprehensive catalogue, giving details of their availability, includes research reports, case studies, seminar documents, training materials, occasional papers and reference books in the following subject categories:
Economics of education, costs and financing.
Manpower and employment.
Demographic studies.
Location oj’schools (school map) and micro-planning.
Administration and management.
Curriculum development and evaluation.
Educational technology.
Primary, secondary and higher education.
Vocational and technical education.
Non-formal, out-of-school, adult and rural education.
Disadvantaged groups.
Copies of the catalogue may be obtained from ZZEP Publications on request.

The International Institute for Educational Planning
The International Institute for Educational Planning (IIEP) is an international centre for advanced training and research in the field of educational planning. It was established by UNESCO in 1963 and is financed by UNESCO and by voluntary contributions from Member States. In recent years the following Member States have provided voluntary contributions to the Institute: Denmark, Germany, Iceland, India, Ireland, Norway, Sweden, Switzerland and Venezuela.
The Instituteus aim is to contribute to the development of education throughout the world, by expanding both knowledge and the supply of competent professionals in the field of educational planning. In this endeavour the Institute co-operates with interested training and research organizations in Member States. The Governing Board of the IIEP, which approves the Instituteus programme and budget, consists of a maximum of eight elected members and four members designated by the United Nations Organization and certain of its specialized agencies and institutes.
Chairman :
Lennart Wohlgemuth (Sweden), Director, The Nordic Africa Institute, Uppsala, Sweden.
Designated Members:
Car-Los Fortin, Deputy to the Secretary-General, United Nations Conference on Trade and Development (UNCTAD), Geneva, Switzerland.
David de Ferranti, Director, Human Development Department (HDD), The World Bank, Washington, D.C., USA.
Miriam J. Hirschfeld, Director, Division of Human Resources Development and Capacity Building, World Health Organization (WHO), Geneva, Switzerland.
Jeggan C. Senghor, Director, United Nations African Institute for Economic Development and Planning (IDEP), Dakar, Senegal.
Elected Members:
Datokiah bt. Abu Samah (Malaysia), Corporate Advisor, Lang Education, Land and General Berhad, Kuala Lumpur, Malaysia.
Klaus Hiifner (Germany), Professor, Freie Universitat Berlin, Berlin, Germany.
Faiia Kefi (Tunisia), President, National Union of Tunisian Women, Tunis, Tunisia.
Tamas Kozma (Hungary), Director-General, Hungarian Institute for Educational Research, Budapest, Hungary.
Teboho Moja (South Africa), Special Adviser to the Minister of Education, Pretoria, South Africa.
Yolanda M. Rojas (Costa Rica), Professor, University of Costa Rica, San Jose, Costa Rica.
Michel VerniSres (France), Professor, University of Paris I, Pantheon-Sorbonne, Paris, France.
Enquiries about the Institute should be addressed to:
The Office of the Director, International Institute for Educational Planning,
7-9 rue Eugene-Delacroix, 75 1 16 Paris, France.