THE PUBLIC, PARENTS, AND K 12 EDUCATION
73
THE PUBLIC, PARENTS, AND K – 12 EDUCATION APRIL 2021 © 2020 Morning Consult, All Rights Reserved. A National Polling Report
Transcript of THE PUBLIC, PARENTS, AND K 12 EDUCATION

THE PUBLIC, PARENTS,
AND K–12 EDUCATION
A P R I L 2 0 2 1
© 2020 Morning Consult, All Rights Reserved.
A National Polling Report
2
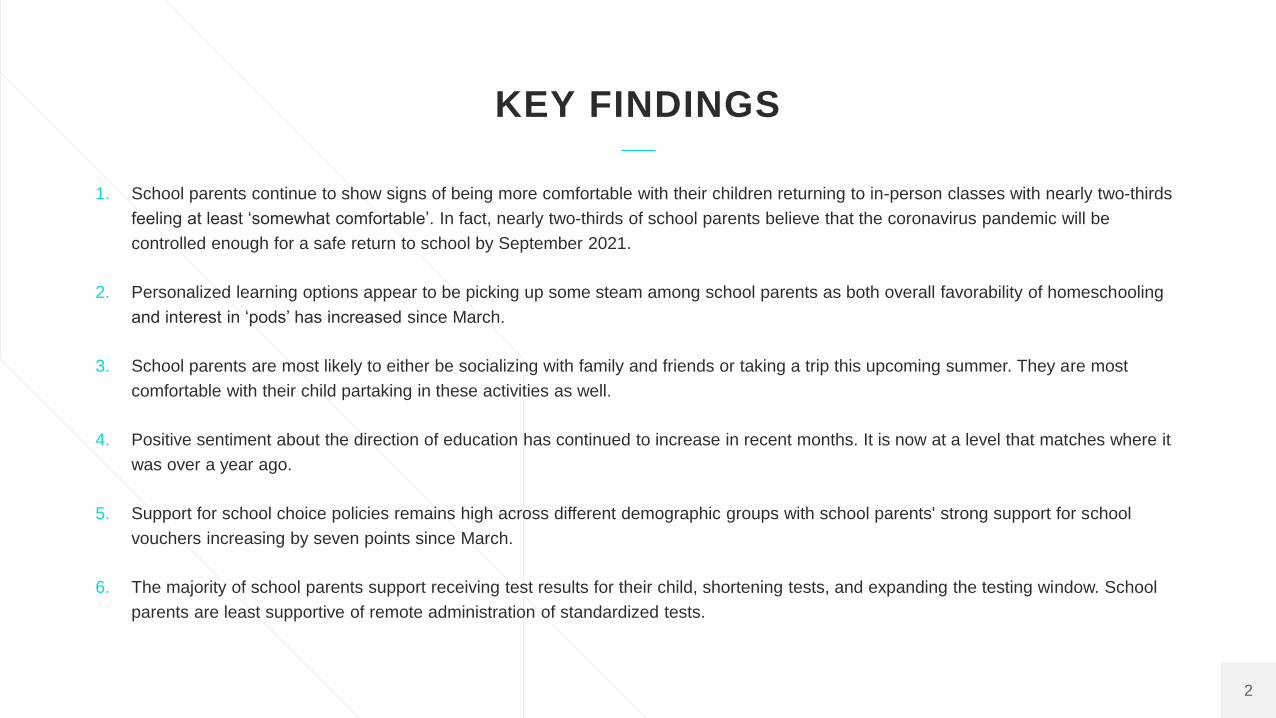
KEY FINDINGS
1. School parents continue to show signs of being more comfortable with their children returning to in-person classes with nearly two-thirds
feeling at least ‘somewhat comfortable’. In fact, nearly two-thirds of school parents believe that the coronavirus pandemic will be
controlled enough for a safe return to school by September 2021.
2. Personalized learning options appear to be picking up some steam among school parents as both overall favorability of homeschooling
and interest in ‘pods’ has increased since March.
3. School parents are most likely to either be socializing with family and friends or taking a trip this upcoming summer. They are most
comfortable with their child partaking in these activities as well.
4. Positive sentiment about the direction of education has continued to increase in recent months. It is now at a level that matches where it
was over a year ago.
5. Support for school choice policies remains high across different demographic groups with school parents' strong support for school
vouchers increasing by seven points since March.
6. The majority of school parents support receiving test results for their child, shortening tests, and expanding the testing window. School
parents are least supportive of remote administration of standardized tests.

AG E N D A
COVID-19 AND SCHOOLING
SCHOOL CHOICE POLICIES
VIEWS ON K-12 EDUCATION
SURVEY PROFILE AND DEMOGRAPHICS
4
0
50,000
100,000
150,000
200,000
250,000
300,000
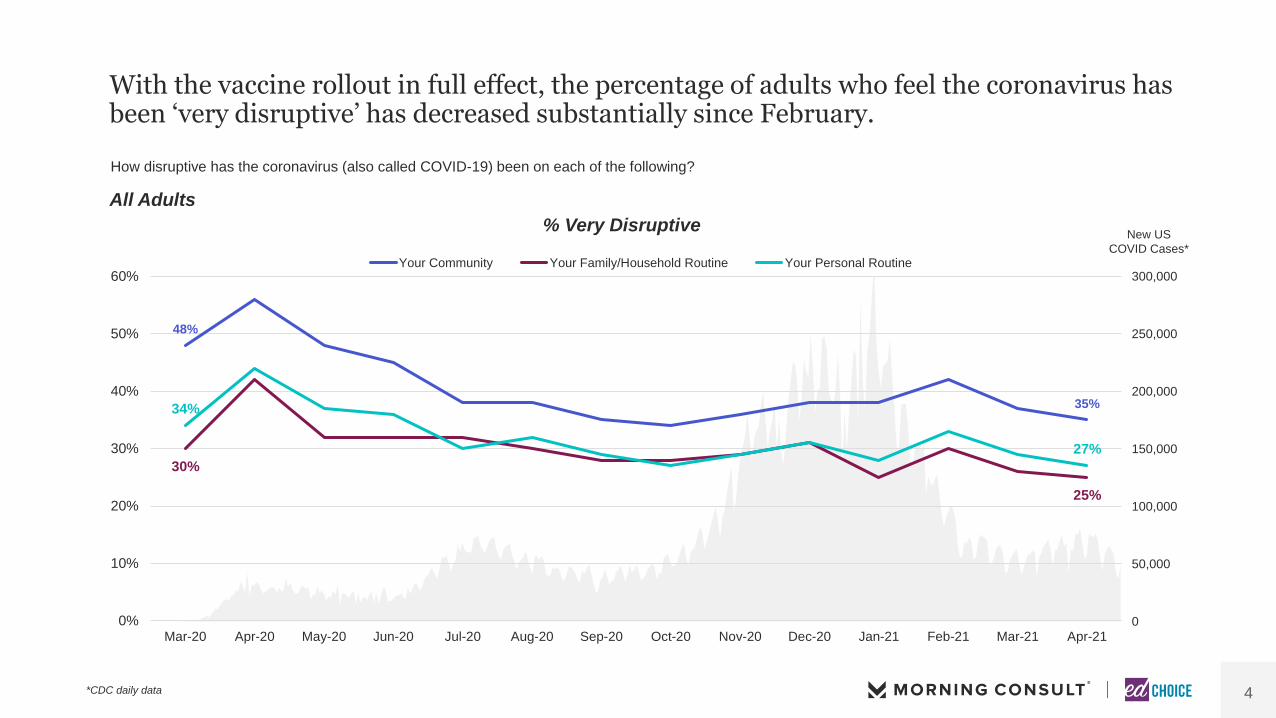
With the vaccine rollout in full effect, the percentage of adults who feel the coronavirus has been ‘very disruptive’ has decreased substantially since February.
How disruptive has the coronavirus (also called COVID-19) been on each of the following?
All Adults
*CDC daily data
New US
COVID Cases*
48%
35%
30%
25%
34%
27%
0%
10%
20%
30%
40%
50%
60%
Mar-20 Apr-20 May-20 Jun-20 Jul-20 Aug-20 Sep-20 Oct-20 Nov-20 Dec-20 Jan-21 Feb-21 Mar-21 Apr-21
% Very Disruptive
Your Community Your Family/Household Routine Your Personal Routine
5
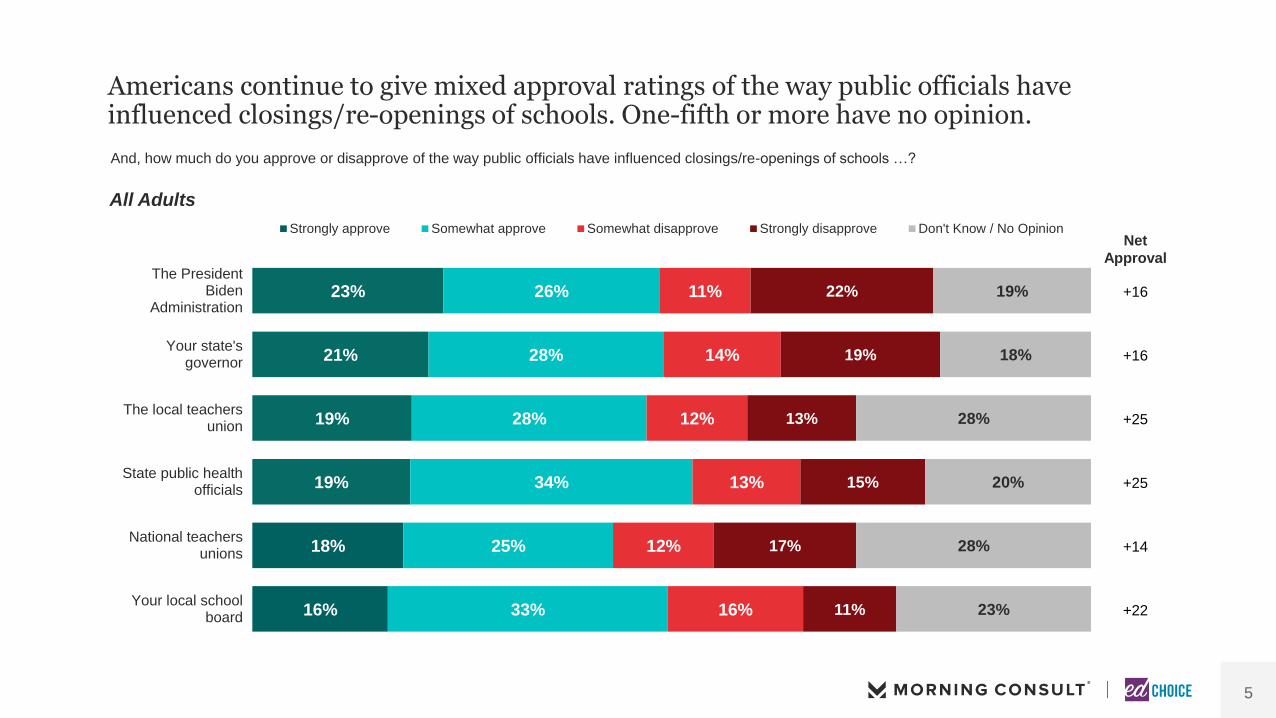
Americans continue to give mixed approval ratings of the way public officials have influenced closings/re-openings of schools. One-fifth or more have no opinion.
And, how much do you approve or disapprove of the way public officials have influenced closings/re-openings of schools …?
All Adults
+16
+16
+25
+25
+14
+22
23%
21%
19%
19%
18%
16%
26%
28%
28%
34%
25%
33%
11%
14%
12%
13%
12%
16%
22%
19%
13%
15%
17%
11%
19%
18%
28%
20%
28%
23%
The PresidentBiden
Administration
Your state'sgovernor
The local teachersunion
State public healthofficials
National teachersunions
Your local schoolboard
Strongly approve Somewhat approve Somewhat disapprove Strongly disapprove Don't Know / No OpinionNet
Approval
6
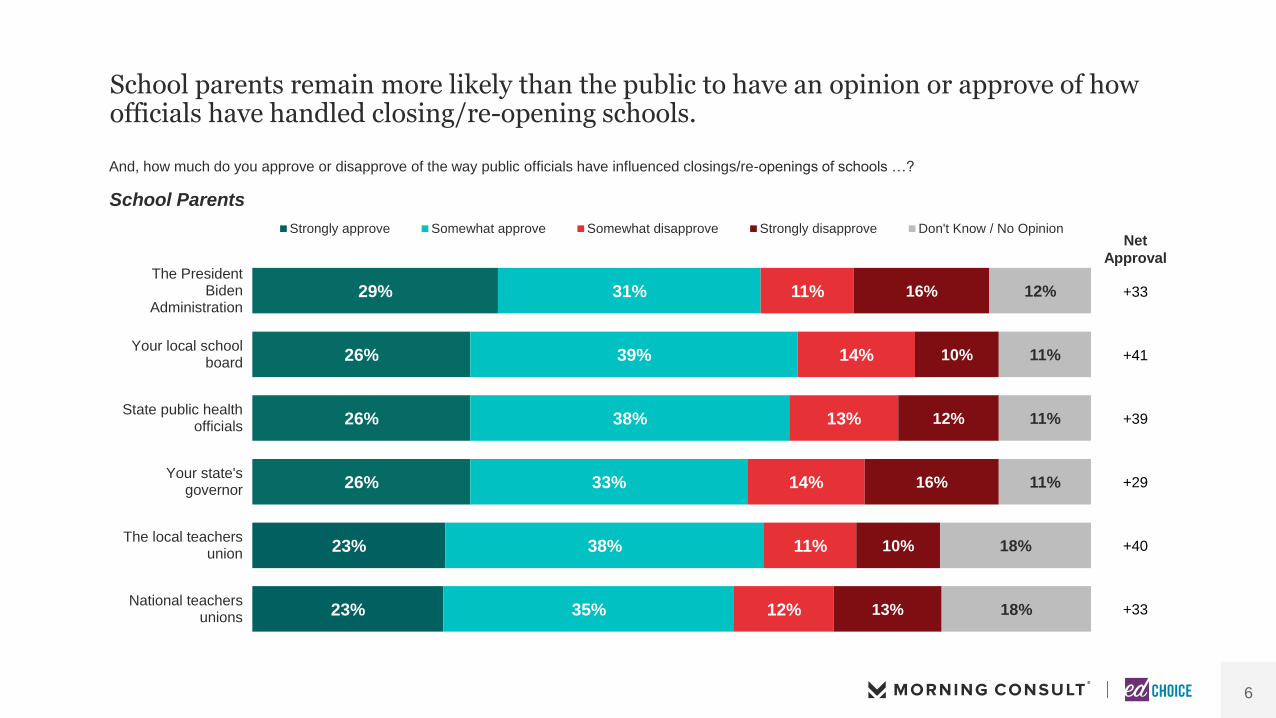
School parents remain more likely than the public to have an opinion or approve of how officials have handled closing/re-opening schools.
And, how much do you approve or disapprove of the way public officials have influenced closings/re-openings of schools …?
School Parents
+33
+41
+39
+29
+40
+33
29%
26%
26%
26%
23%
23%
31%
39%
38%
33%
38%
35%
11%
14%
13%
14%
11%
12%
16%
10%
12%
16%
10%
13%
12%
11%
11%
11%
18%
18%
The PresidentBiden
Administration
Your local schoolboard
State public healthofficials
Your state'sgovernor
The local teachersunion
National teachersunions
Strongly approve Somewhat approve Somewhat disapprove Strongly disapprove Don't Know / No OpinionNet
Approval

7
The general public continues to give middling ratings to various institutions for how they’ve responded to the coronavirus pandemic.
Based on what you have seen, read, or heard so far, how would you rate the following institutions on their response to the coronavirus (COVID-19) outbreak?
16%
14%
13%
13%
13%
12%
12%
12%
11%
26%
21%
19%
21%
20%
22%
17%
19%
16%
33%
27%
33%
31%
31%
33%
28%
28%
34%
7%
13%
11%
11%
10%
11%
14%
9%
11%
4%
14%
10%
10%
13%
9%
16%
19%
10%
14%
12%
13%
14%
13%
13%
12%
12%
17%
Local, small businesses
State government
Schools
School districts
Local news media/organizations
Local government
Federal government
National news media organizations
National, multi-national corporations
Excellent Above Average Average Below Average Poor Don't Know/No Opinion
All Adults
8
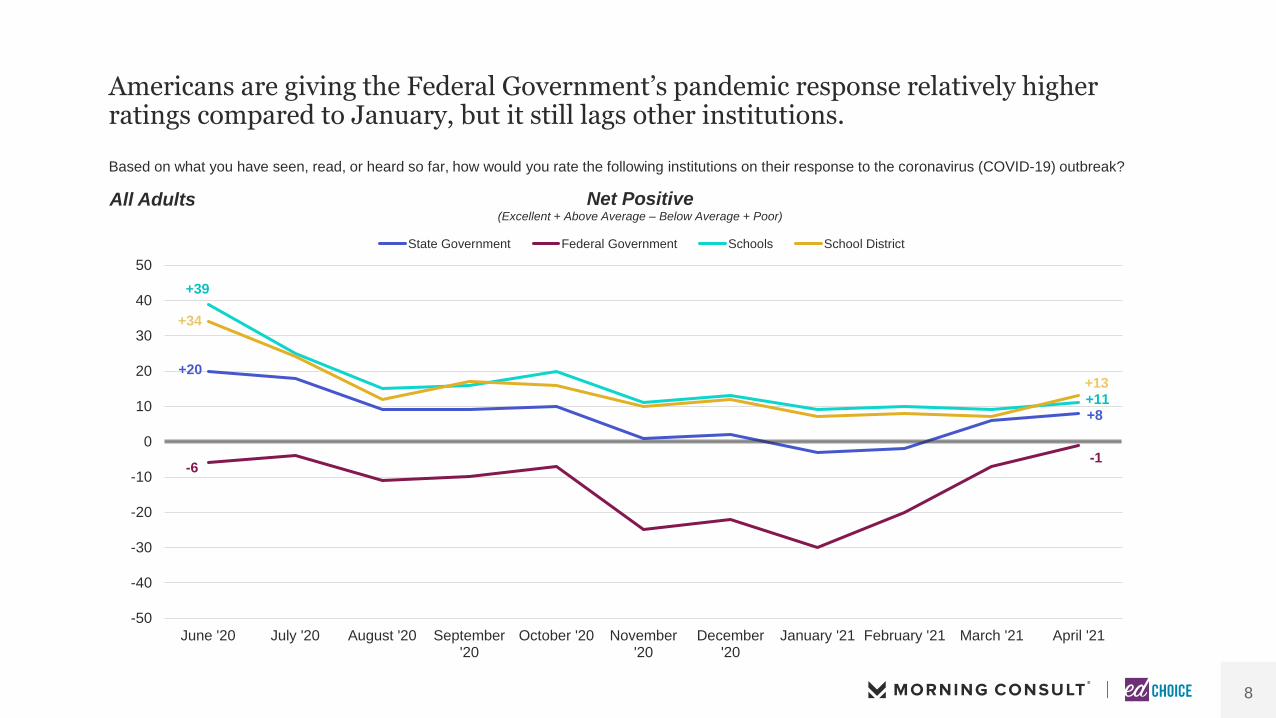
+20
+8
-6-1
+39
+11
+34
+13
-50
-40
-30
-20
-10
0
10
20
30
40
50
June '20 July '20 August '20 September'20
October '20 November'20
December'20
January '21 February '21 March '21 April '21
Net Positive(Excellent + Above Average – Below Average + Poor)
State Government Federal Government Schools School District
Americans are giving the Federal Government’s pandemic response relatively higher ratings compared to January, but it still lags other institutions.
Based on what you have seen, read, or heard so far, how would you rate the following institutions on their response to the coronavirus (COVID-19) outbreak?
All Adults
9
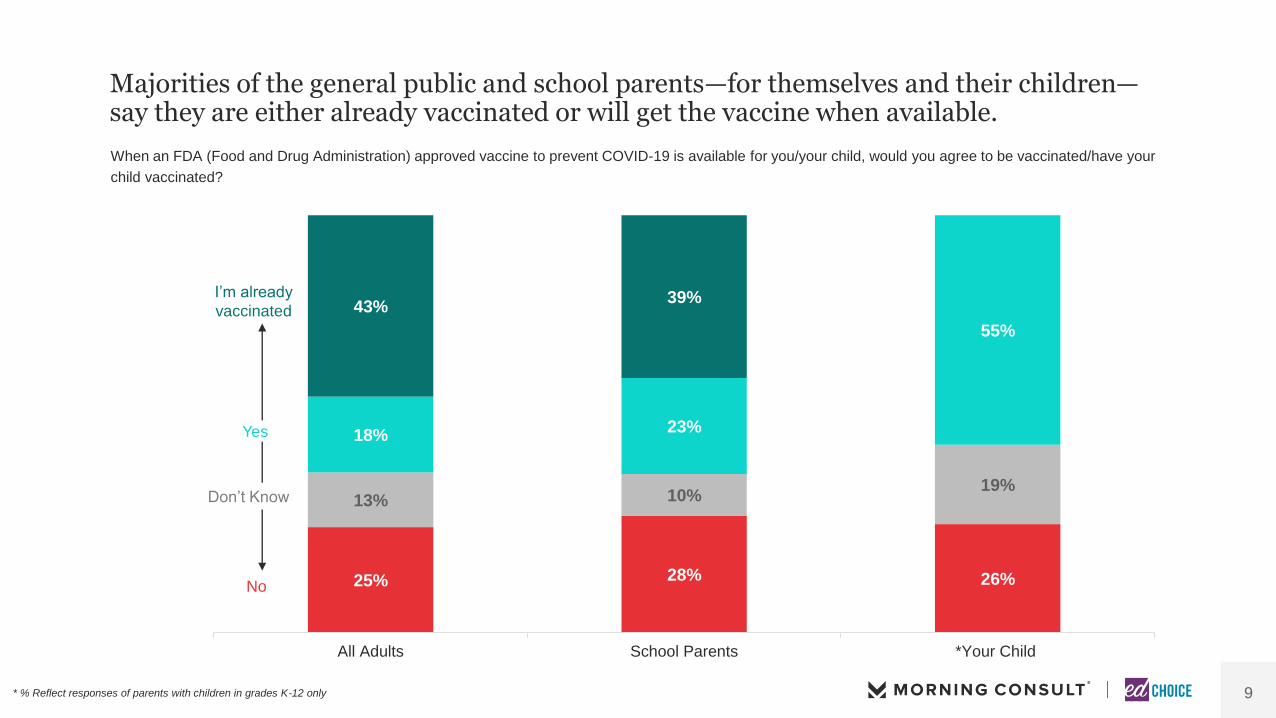
Majorities of the general public and school parents—for themselves and their children—say they are either already vaccinated or will get the vaccine when available.
When an FDA (Food and Drug Administration) approved vaccine to prevent COVID-19 is available for you/your child, would you agree to be vaccinated/have your
child vaccinated?
25% 28% 26%
13% 10%19%
18%23%
55%
43%39%
All Adults School Parents *Your Child
No
Don’t Know
* % Reflect responses of parents with children in grades K-12 only
Yes
I’m already
vaccinated
10
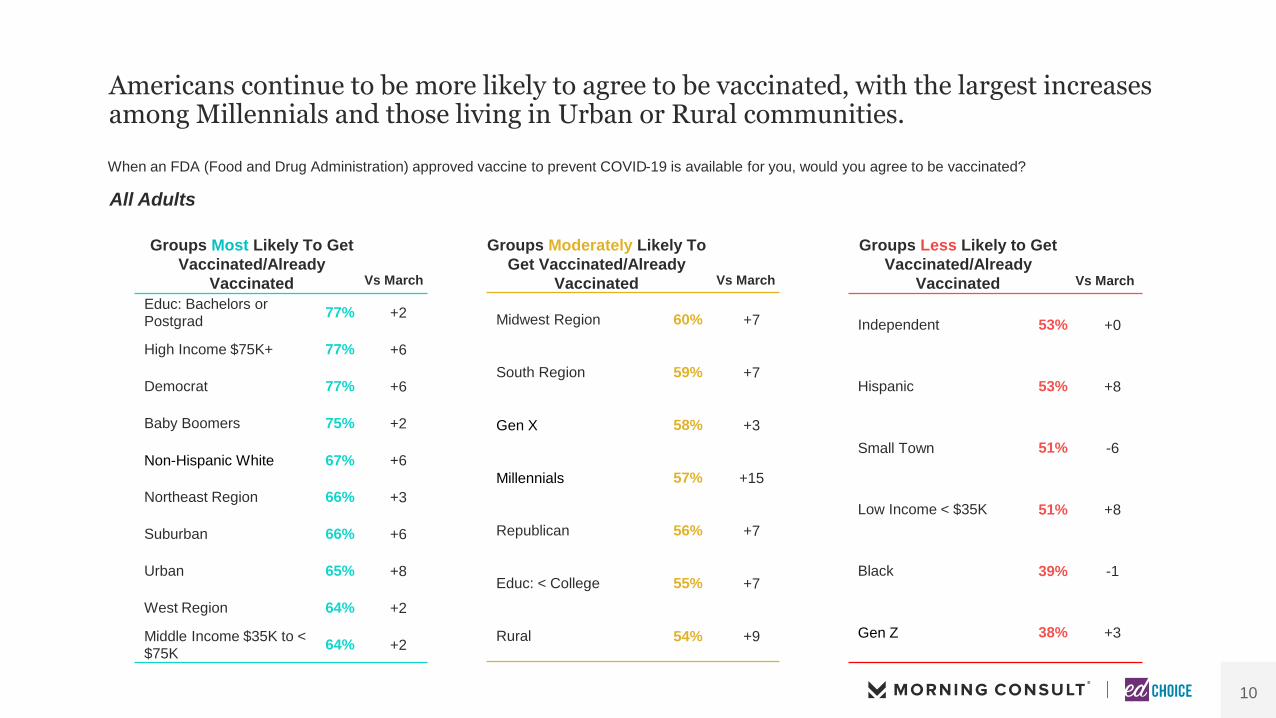
Americans continue to be more likely to agree to be vaccinated, with the largest increases among Millennials and those living in Urban or Rural communities.
When an FDA (Food and Drug Administration) approved vaccine to prevent COVID-19 is available for you, would you agree to be vaccinated?
Groups Most Likely To Get
Vaccinated/Already
Vaccinated
Groups Moderately Likely To
Get Vaccinated/Already
Vaccinated
Groups Less Likely to Get
Vaccinated/Already
Vaccinated
Educ: Bachelors or
Postgrad77% +2
High Income $75K+ 77% +6
Democrat 77% +6
Baby Boomers 75% +2
Non-Hispanic White 67% +6
Northeast Region 66% +3
Suburban 66% +6
Urban 65% +8
West Region 64% +2
Middle Income $35K to <
$75K64% +2
Midwest Region 60% +7
South Region 59% +7
Gen X 58% +3
Millennials 57% +15
Republican 56% +7
Educ: < College 55% +7
Rural 54% +9
Independent 53% +0
Hispanic 53% +8
Small Town 51% -6
Low Income < $35K 51% +8
Black 39% -1
Gen Z 38% +3
Vs March Vs March Vs March
All Adults
11
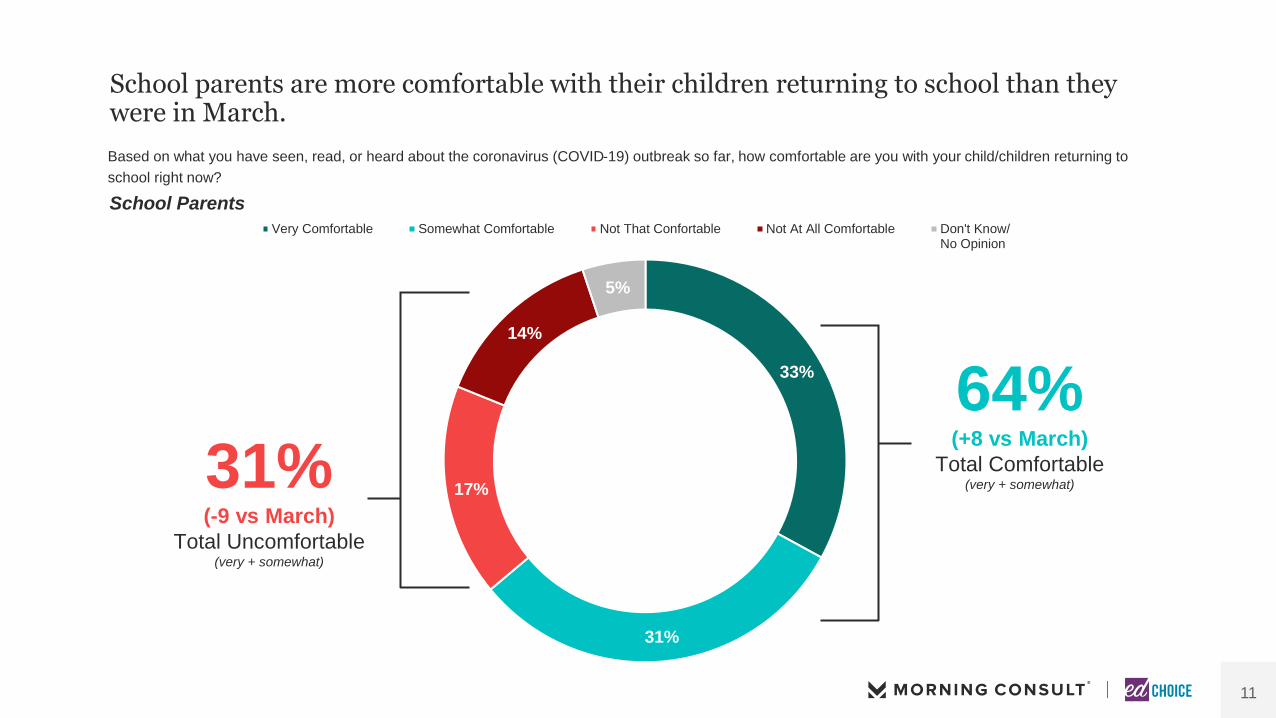
33%
31%
17%
14%
5%
Very Comfortable Somewhat Comfortable Not That Confortable Not At All Comfortable Don't Know/No Opinion
School parents are more comfortable with their children returning to school than they were in March.
Based on what you have seen, read, or heard about the coronavirus (COVID-19) outbreak so far, how comfortable are you with your child/children returning to
school right now?
School Parents
31%(-9 vs March)
Total Uncomfortable(very + somewhat)
64%(+8 vs March)
Total Comfortable(very + somewhat)
12
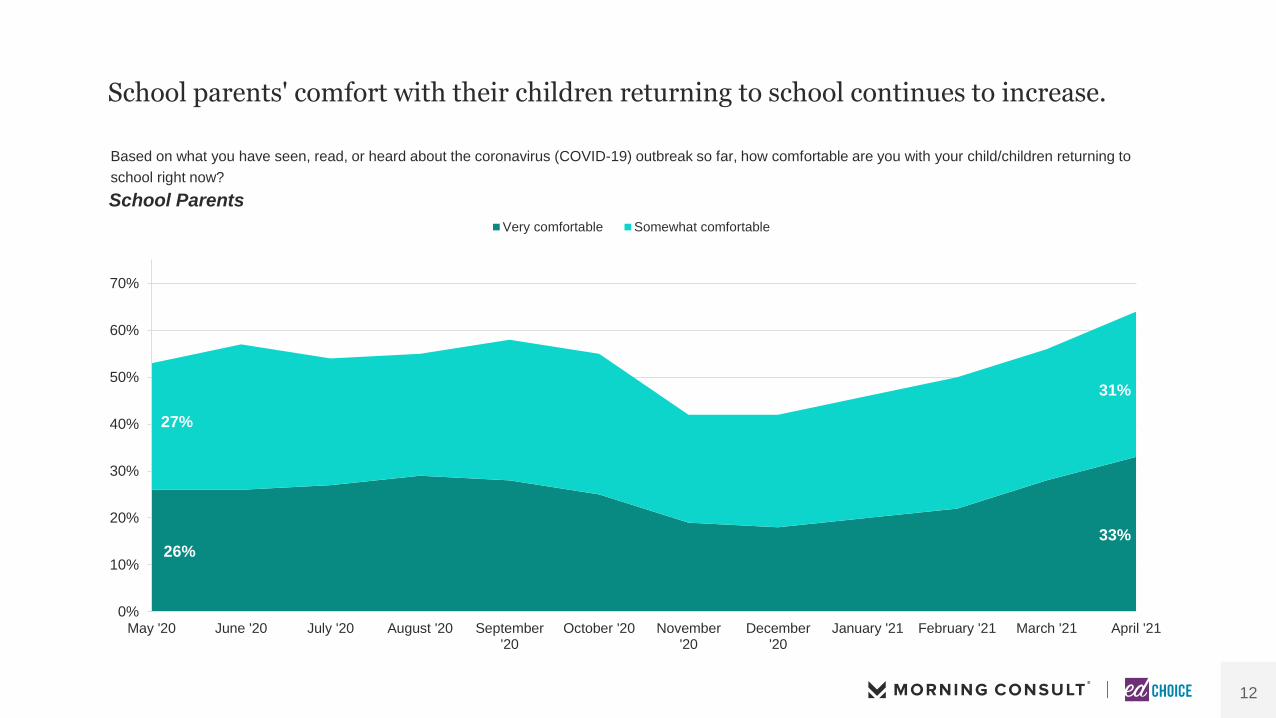
School parents' comfort with their children returning to school continues to increase.
Based on what you have seen, read, or heard about the coronavirus (COVID-19) outbreak so far, how comfortable are you with your child/children returning to
school right now?
School Parents
26%33%
27%
31%
0%
10%
20%
30%
40%
50%
60%
70%
May '20 June '20 July '20 August '20 September'20
October '20 November'20
December'20
January '21 February '21 March '21 April '21
Very comfortable Somewhat comfortable

13
Six out of ten school parents believe the outbreak will be controlled enough to send students to school in-person by September.
When do you expect the coronavirus outbreak to be controlled enough that it will be safe to send children to school for in-person classes in your community?
61%Believe it will be safe to send
children back to school for in-
person classes by September.
School Parents
14
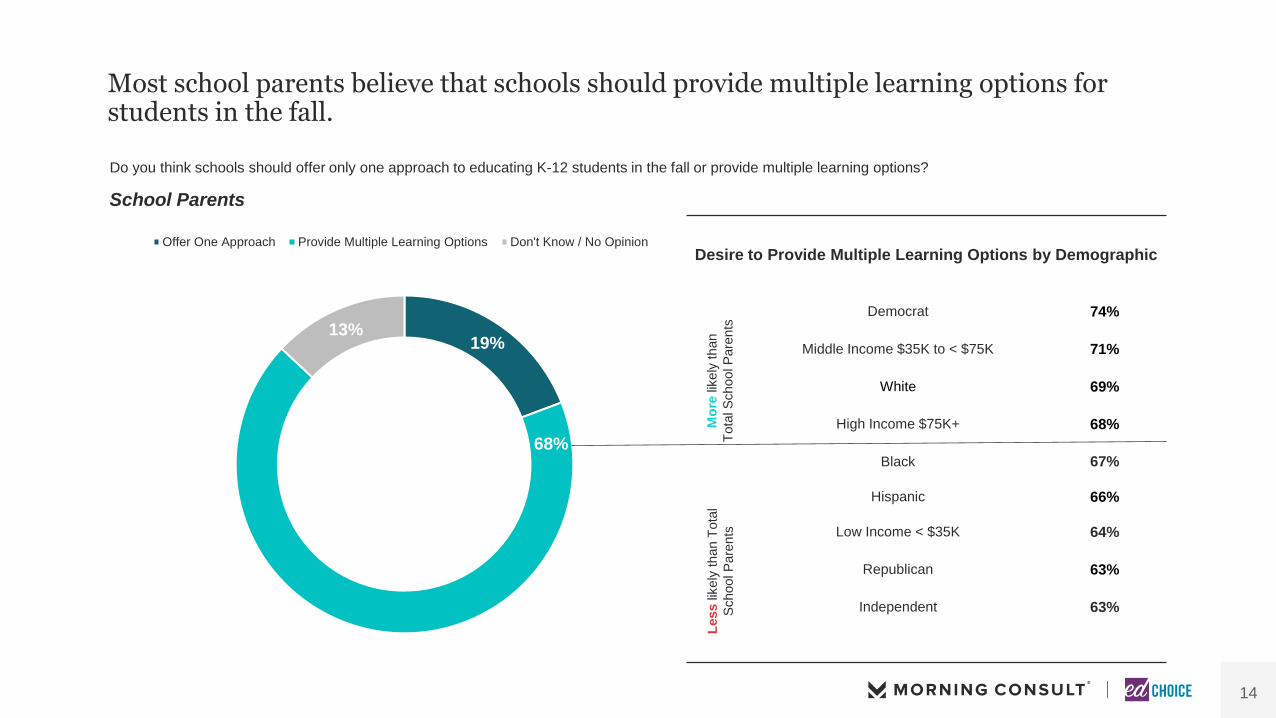
Most school parents believe that schools should provide multiple learning options for students in the fall.
Do you think schools should offer only one approach to educating K-12 students in the fall or provide multiple learning options?
School Parents
19%
68%
13%
Offer One Approach Provide Multiple Learning Options Don't Know / No OpinionDesire to Provide Multiple Learning Options by Demographic
Mo
re lik
ely
than
Tota
l S
chool P
are
nts
Democrat 74%
Middle Income $35K to < $75K 71%
White 69%
High Income $75K+ 68%
Black 67%
Less
likely
than T
ota
l
School P
are
nts
Hispanic 66%
Low Income < $35K 64%
Republican 63%
Independent 63%
15
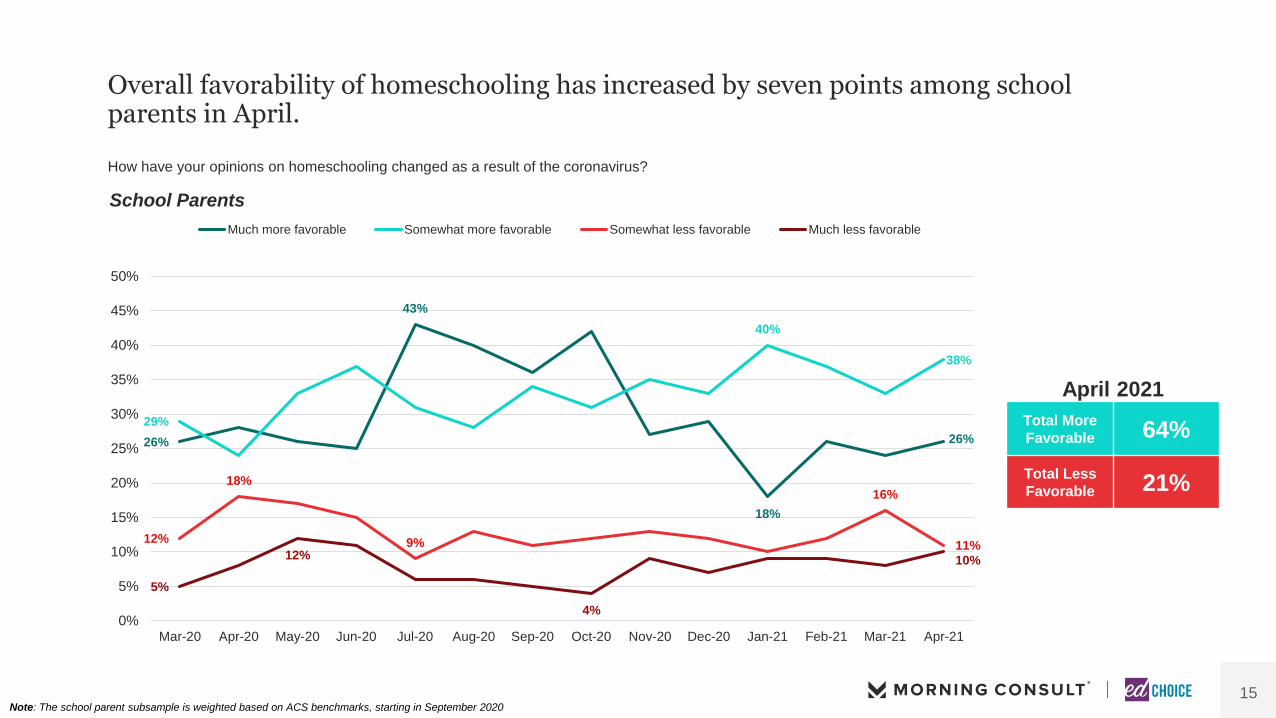
Overall favorability of homeschooling has increased by seven points among school parents in April.
How have your opinions on homeschooling changed as a result of the coronavirus?
School Parents
Note: The school parent subsample is weighted based on ACS benchmarks, starting in September 2020
Total More
Favorable 64%
Total Less
Favorable 21%
April 2021
26%
43%
18%
26%
29%
40%
38%
12%
18%
9%
16%
11%
5%
12%
4%
10%
0%
5%
10%
15%
20%
25%
30%
35%
40%
45%
50%
Mar-20 Apr-20 May-20 Jun-20 Jul-20 Aug-20 Sep-20 Oct-20 Nov-20 Dec-20 Jan-21 Feb-21 Mar-21 Apr-21
Much more favorable Somewhat more favorable Somewhat less favorable Much less favorable
16
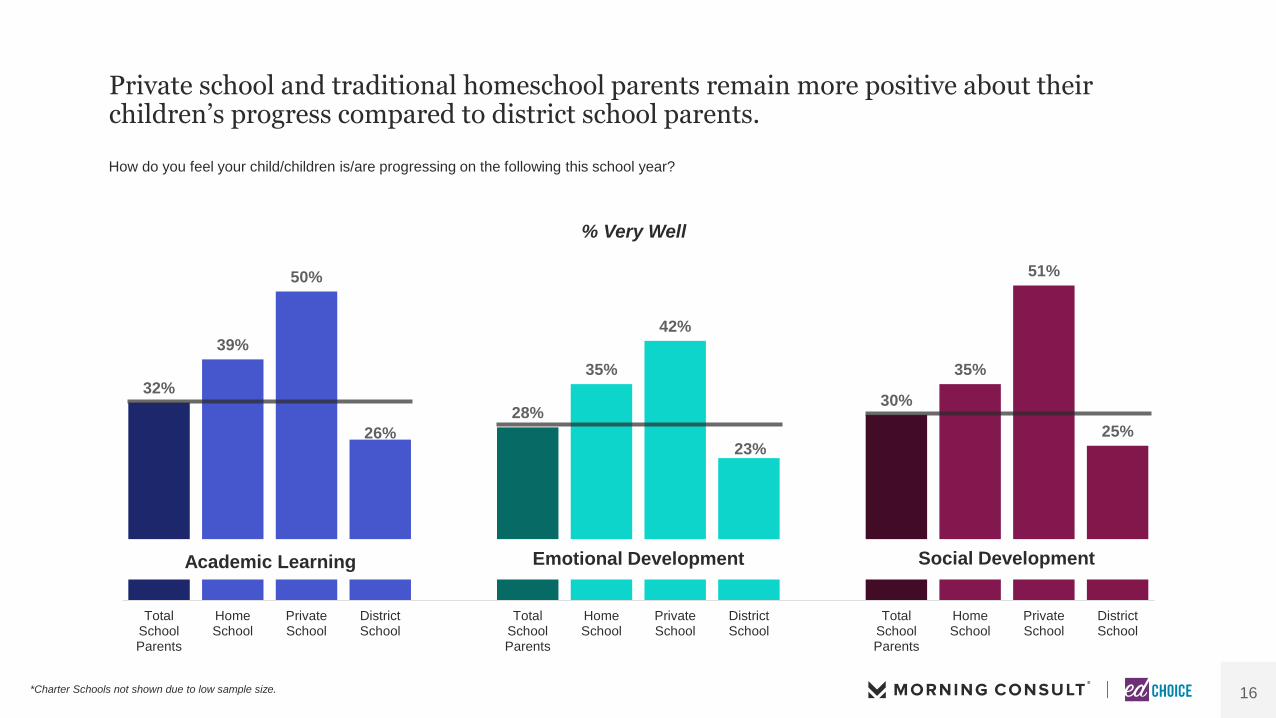
Private school and traditional homeschool parents remain more positive about their children’s progress compared to district school parents.
How do you feel your child/children is/are progressing on the following this school year?
32%
39%
50%
26%
28%
35%
42%
23%
30%
35%
51%
25%
TotalSchoolParents
HomeSchool
PrivateSchool
DistrictSchool
TotalSchoolParents
HomeSchool
PrivateSchool
DistrictSchool
TotalSchoolParents
HomeSchool
PrivateSchool
DistrictSchool
Academic Learning Emotional Development Social Development
% Very Well
*Charter Schools not shown due to low sample size.

17
School parents are satisfied with their experiences across different school sectors. Private school parents are more satisfied than district school parents.
To what extent are you satisfied or dissatisfied with your child's/children's experiences with the following types of schooling?
School Parents
91%
90%
86%
82%
66%
54%
51%
41%
25%
36%
35%
41%
5%
7%
9%
9% 8%
4%Private School
*Public CharterSchool
Home School
District School
Very Satisfied Somewhat Satisfied Somewhat Dissatisfied Very Dissatisfied Don't Know / No OpinionTotal
Satisfaction
*The base size for Public Charter School is N=88, data are considered directional.
18
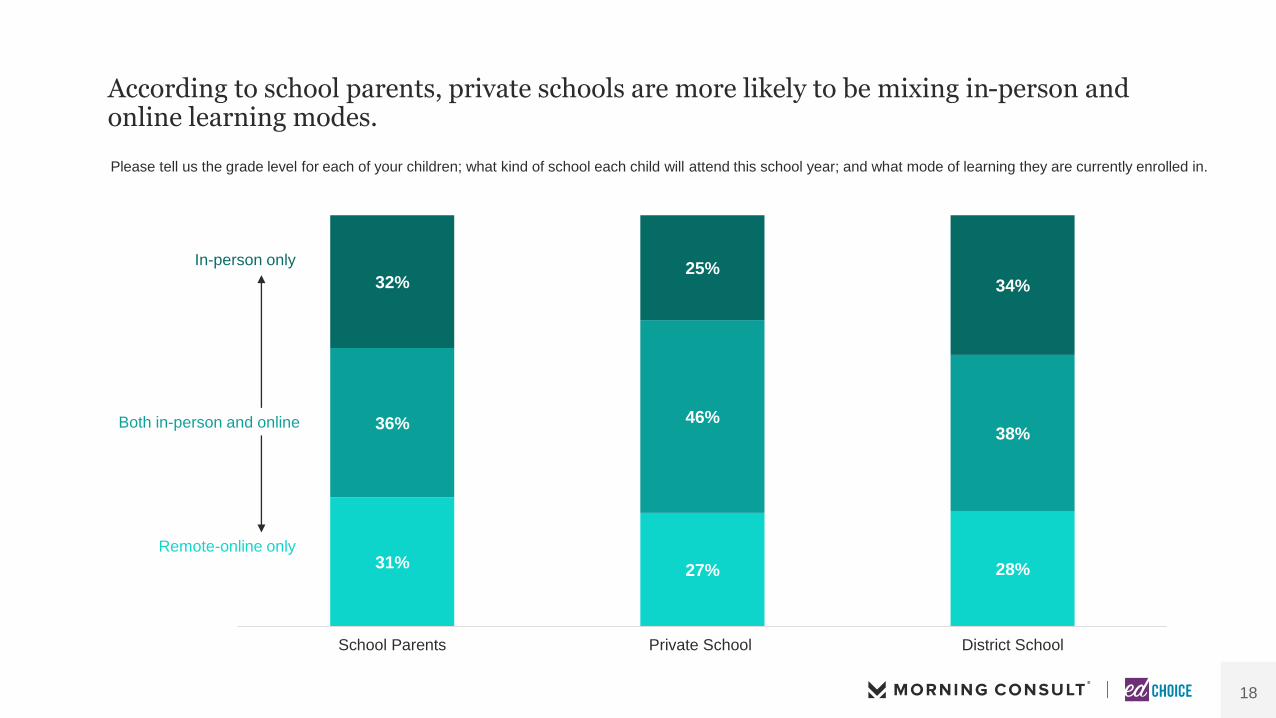
According to school parents, private schools are more likely to be mixing in-person and online learning modes.
Please tell us the grade level for each of your children; what kind of school each child will attend this school year; and what mode of learning they are currently enrolled in.
31% 27% 28%
36% 46%38%
32%25%
34%
School Parents Private School District School
In-person only
Remote-online only
Both in-person and online

19
District parents are more likely to prefer schooling completely outside of the home than private school parents.
After the pandemic, if given the option, to what extent would you prefer schooling to be scheduled each week at home with a parent or tutor to provide the best education
for your child?
16% 14% 13%
7% 14%
5%
14%
18%
15%
16%
20%
14%
7%
10%
7%
39%
25%
47%
School Parents Private School Parents District School Parents
Completely outside of
the home
Completely at home
4 days at home
3 days at home
2 days at home
1 day at home
vs. March
(-4)
(-1)
(+1)
(+2)
(+0)
(+1)
(-2)
(+0)
(-2)
(+3)
(-2)
(+3)
(-2)
(-2)
(+0)
(+4)
(+1)
(+0)

20
Just over two-fifths of school parents say their family is participating in or looking to form/join a learning 'pod'.
As a result of the coronavirus pandemic, are you currently participating in a 'pod' with other families?
School Parents
Yes, we’re currently
participating in a ‘pod’
No, but we're looking
to form or join a 'pod'
22%
No, we're not planning to
participate in a 'pod'
20% 58%
42% currently participating in a ‘pod’ or looking to join/form a ‘pod’
21
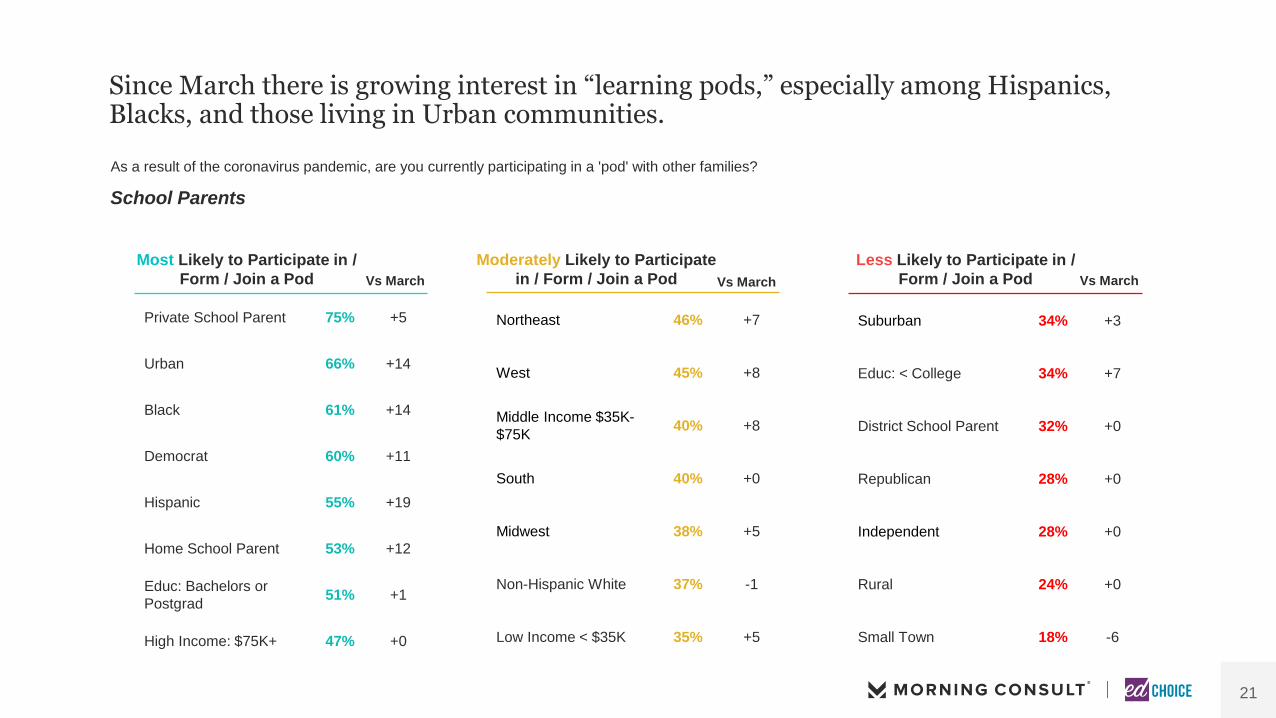
Since March there is growing interest in “learning pods,” especially among Hispanics, Blacks, and those living in Urban communities.
As a result of the coronavirus pandemic, are you currently participating in a 'pod' with other families?
Most Likely to Participate in /
Form / Join a Pod
Moderately Likely to Participate
in / Form / Join a Pod
Less Likely to Participate in /
Form / Join a Pod
Private School Parent 75% +5
Urban 66% +14
Black 61% +14
Democrat 60% +11
Hispanic 55% +19
Home School Parent 53% +12
Educ: Bachelors or
Postgrad51% +1
High Income: $75K+ 47% +0
Northeast 46% +7
West 45% +8
Middle Income $35K-
$75K40% +8
South 40% +0
Midwest 38% +5
Non-Hispanic White 37% -1
Low Income < $35K 35% +5
Suburban 34% +3
Educ: < College 34% +7
District School Parent 32% +0
Republican 28% +0
Independent 28% +0
Rural 24% +0
Small Town 18% -6
Vs March Vs March Vs March
School Parents
22
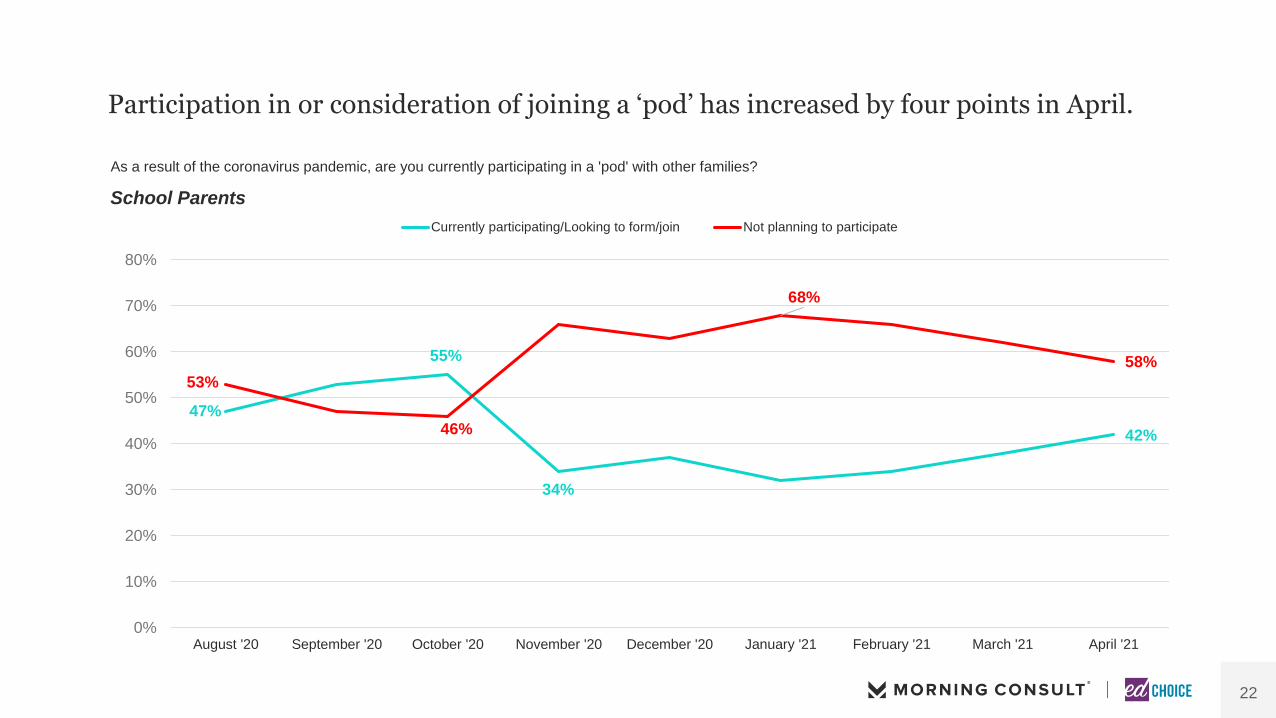
Participation in or consideration of joining a ‘pod’ has increased by four points in April.
As a result of the coronavirus pandemic, are you currently participating in a 'pod' with other families?
School Parents
47%
55%
34%
42%
53%
46%
68%
58%
0%
10%
20%
30%
40%
50%
60%
70%
80%
August '20 September '20 October '20 November '20 December '20 January '21 February '21 March '21 April '21
Currently participating/Looking to form/join Not planning to participate

23
School parents that are interested/participating in a ‘pod’ believe they are good for socialization and will keep their children up to speed with curriculum, while those that oppose ‘pods’ believe they are unsafe, too costly or unnecessary for their children.Why are you participating in a ‘pod’? Why are you looking to form or join a ‘pod’? Why aren’t you planning to participate in a ‘pod’?
“To give my child additional
learning opportunities and
social opportunities.”
“
“For continuing the learning
process during the pandemic
and it also helps develop
social norms.”
“
“To keep my children
learning with kids their age.”
“
“It seems like a viable option
for my child in order for her to
have some consistency.”
“
“They are still dangerous
because of COVID and are
also very costly.”
“
“My kids are doing great
academically so I don’t think
they need to be in a pod.”
“
WHY PARTICIPATINGIN A ‘POD’
WHY LOOKING TO FORM OR JOIN A ‘POD’
WHY NOT PLANNING TO PARTICIPATE IN A ‘POD’
“It enriches our child’s learning, and we get to know other
parents and families. It also keeps us more connected and
in the loop.
“ “I want to make sure my son
isn’t falling behind.”“ “I believe that schooling of the
child is best done in a controlled environment at school with a
teacher that is there to teach the grade they were assigned.”
“

24
70% 30%
‘Pods’ continue to be primarily used in addition to regular schooling and are less likely to be a substitute for regular school.
You said you're currently participating in a 'pod', is that…? You said you're looking to form a 'pod', would that be…?
School Parents
among those that
looking to join a ‘pod’
among those that are
participating in a ‘pod’76% 24%
In addition and supplementing
regular schooling A substitute for attending regular
school or virtual/remote learning
In addition and supplementing
regular schooling
A substitute for attending regular
school or virtual/remote learning
Yes, we’re currently
participating in a ‘pod’
No, but we're looking
to form or join a 'pod'
22%
20%

25
The amount school parents are willing to pay to participate in a ‘pod’ increased in April.
What would you be able and willing to spend, on a monthly basis, to participate in a single learning pod per child?
School Parentsamong those interested in or participating in a ‘pod’
$592on average
Per child / per month
$0minimum
per child /
per month
$1,000maximum
per child / per
month
+$68vs. March
Average Willing to Spend Per Child/Per
Month By Demographic
Inco
me *Low Income < $35K $520
*Middle Income $35K to < $75K $654
High Income $75K+ $620
Po
liti
cal
Aff
ilia
tio
n Democrat $604
Independent $589
Republican $572
Reg
ion
*West $660
*Midwest $617
South $558
*Northeast $602
*indicates base size <n=100
26
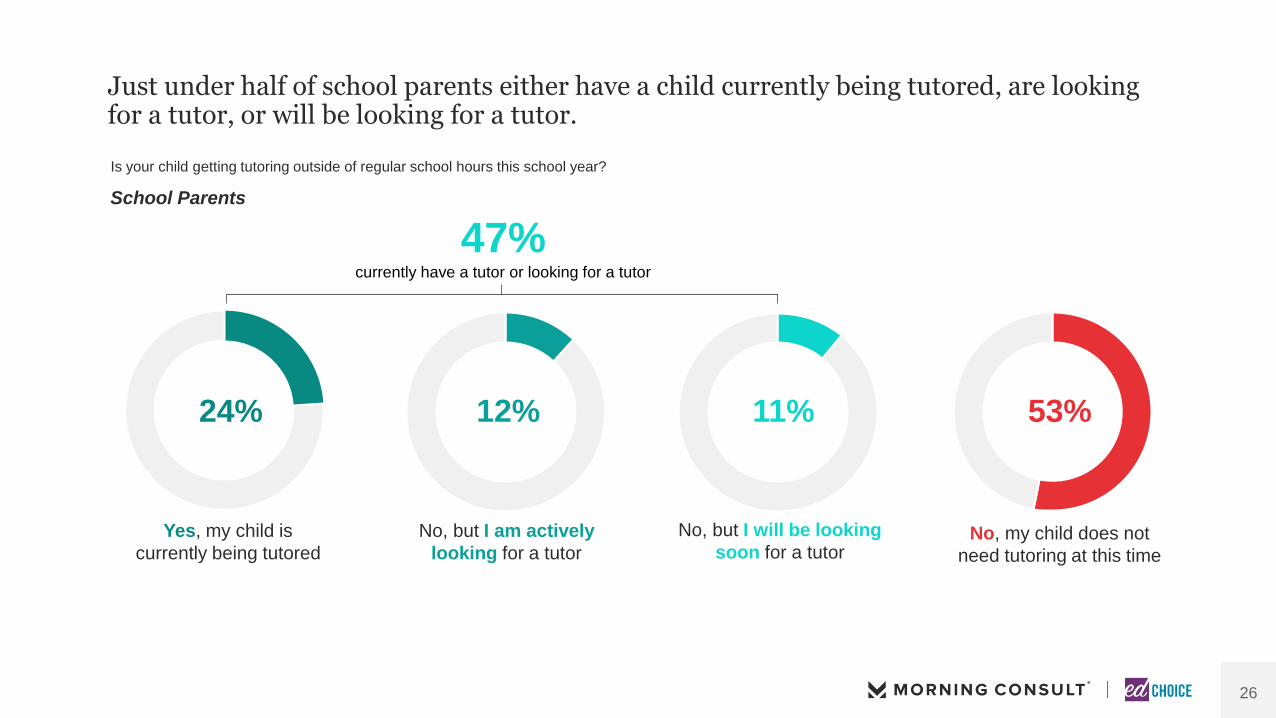
Just under half of school parents either have a child currently being tutored, are looking for a tutor, or will be looking for a tutor.
Is your child getting tutoring outside of regular school hours this school year?
School Parents
Yes, my child is
currently being tutored
No, but I am actively
looking for a tutor
24%
No, but I will be looking
soon for a tutor
12% 11%
No, my child does not
need tutoring at this time
53%
47% currently have a tutor or looking for a tutor

27
Since March there is growing interest in tutoring, especially among traditional homeschoolers, Blacks, and those living in Urban communities.
Is your child getting tutoring outside of regular school hours this school year?
Groups Most Likely To
Already Being / Looking
to be Tutored
Groups Moderately Likely
To Already Being /
Looking to be Tutored
Groups Less Likely to
Already Being /
Looking to be Tutored
Private School Parent 73% +2
Urban 67% +9
Black 65% +9
Democrat 59% +7
Educ: Bachelors or
Postgrad56% +1
High Income: $75K+ 55% +7
Home School Parent 54% +11
South 51% +2
Hispanic 51% +8
West 49% +6
Northeast 47% +7
Non-Hispanic White 45% +1
Low Income < $35K 41% +1
Midwest 41% +5
Republican 40% +3
Educ: < College 40% +4
Middle Income $35K-
$75K40% +0
District School Parent 39% -1
Suburban 39% +3
Independent 36% +2
Small Town 34% +5
Rural 31% -4
Vs March Vs March Vs March
School Parents

28
Those with higher incomes, independents, and those living in either the South or Northeast are the most likely to spend more on tutoring for their child.
What would you be able and willing to spend, on a monthly basis, per child for tutoring outside of school hours?
School Parentsamong those interested in or participating in a tutoring
$281on average
Per child / per month
$0minimum
per child /
per month
$1,000maximum
per child / per
month
Average Willing to Spend Per Child/Per
Month By Demographic
Inco
me *Low Income < $35K $284
*Middle Income $35K to < $75K $268
High Income $75K+ $298
Po
liti
cal
Aff
ilia
tio
n Democrat $269
Independent $305
Republican $276
Reg
ion
*West $262
*Midwest $276
South $288
*Northeast $293
*indicates base size <n=100
-$15vs. March

29
School parents are most likely to feel comfortable with their child socializing with family and friends this upcoming summer. They are most uncomfortable with their child signing up for summer camp or going to a live event.
Thinking about this upcoming summer how comfortable are you with your child participating in each of the following activities?
School Parents
+59
+38
+31
+34
+38
+14
+28
+10
38%
31%
29%
27%
27%
26%
23%
23%
39%
35%
33%
35%
35%
27%
32%
29%
12%
15%
16%
17%
16%
21%
14%
21%
6%
13%
15%
11%
8%
18%
13%
21%
5%
6%
7%
11%
14%
8%
19%
6%
Socializing withfamily/friends
Taking a trip/vacation
Enrolling your child ina sports league
Enrolling your child insummer school
classes
Signing your child upfor tutoring
Signing your child upfor summer camp
Having your child joina learning 'pod'
Going to a live event
Very comfortable Somewhat comfortable Somewhat uncomfortable Very uncomfortable Don't know/No opinionNet Comfort

30
54%
50%
24%21%
17% 16%14% 14%
12%
Socializing withfamily/friends
Taking a trip/vacation Enrolling your child in asports league
Going to a live event Signing your child upfor summer camp
Enrolling your child insummer school classes
Signing your child upfor tutoring
Having your child join alearning 'pod'
None of the above
School parents are more likely to socialize with family and friends or take a trip/vacation this upcoming summer, compared to other kinds of activities.
Do you plan on doing any of the following this upcoming summer?
School Parents

31
School Parents are much more likely to value afterschool tutoring, individualized learning plans, high-speed internet, and providing laptops/tablets – compared to other resources.
How helpful do you think each of the following will be in helping students/your child/children next school year following the COVID-19 outbreak?
60%
58%
57%
55%
54%
51%
47%
34%
29%
68%
68%
68%
64%
69%
58%
50%
46%
42%
0% 10% 20% 30% 40% 50% 60% 70% 80%
All Adults School ParentsOffering additional afterschool tutoring
programs
Individualized learning plans for each
student based on their needs
Providing all students with high-speed
internet
Offering additional counseling or mental
health support for students and staff
Providing all students with laptops or tablets
Additional summer school offerings
Allowing parents the option of having their
child repeat a grade level if needed
Offering additional school days on the
weekend to provide more time for instruction
Longer school days to provide more time for
instruction
Total Helpful(Extremely + Somewhat Helpful)

AG E N D A
COVID-19 AND SCHOOLING
SCHOOL CHOICE POLICIES
VIEWS ON K-12 EDUCATION
SURVEY PROFILE AND DEMOGRAPHICS
33
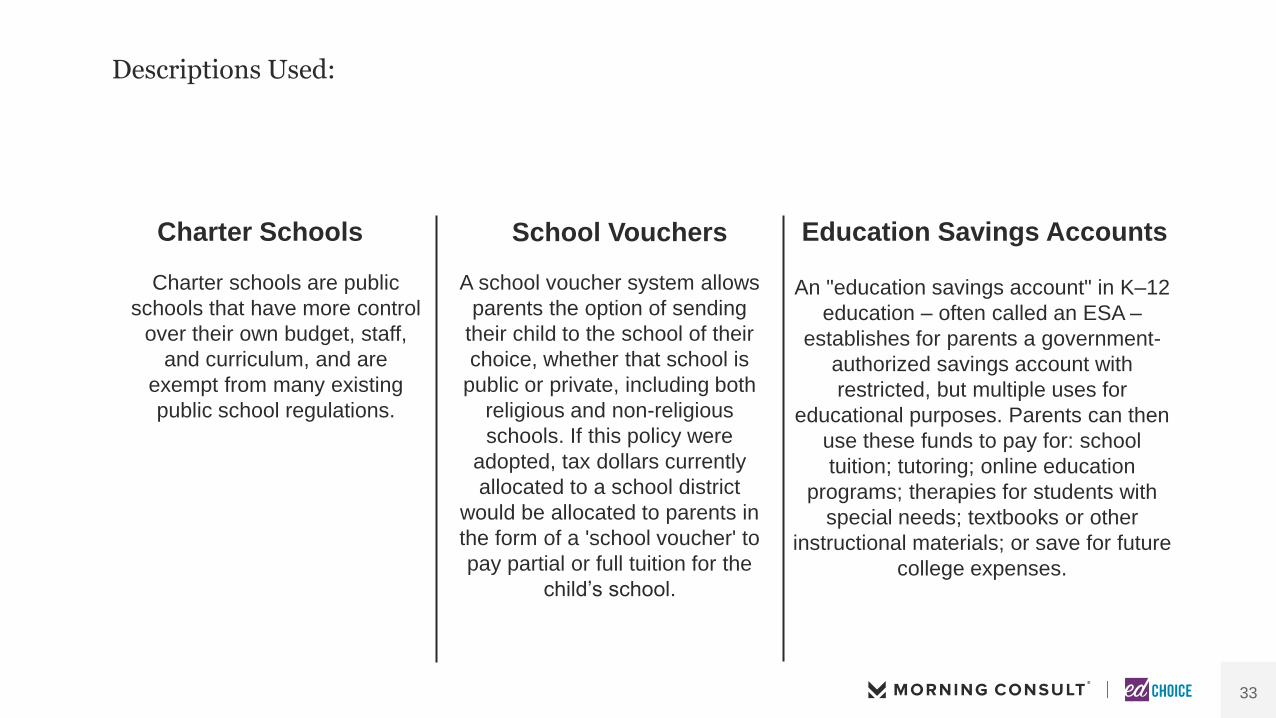
Descriptions Used:
A school voucher system allows
parents the option of sending
their child to the school of their
choice, whether that school is
public or private, including both
religious and non-religious
schools. If this policy were
adopted, tax dollars currently
allocated to a school district
would be allocated to parents in
the form of a 'school voucher' to
pay partial or full tuition for the
child’s school.
School Vouchers
Charter schools are public
schools that have more control
over their own budget, staff,
and curriculum, and are
exempt from many existing
public school regulations.
Charter Schools
An "education savings account" in K–12
education – often called an ESA –
establishes for parents a government-
authorized savings account with
restricted, but multiple uses for
educational purposes. Parents can then
use these funds to pay for: school
tuition; tutoring; online education
programs; therapies for students with
special needs; textbooks or other
instructional materials; or save for future
college expenses.
Education Savings Accounts

34
All school choice policies continue to see a lift in support when people are given a description.
45%42%
51%
64%
59%61%
ESAs School Vouchers Charter Schools
Total Support(Strongly Support + Somewhat Support)
Without Description With Description
All Adults
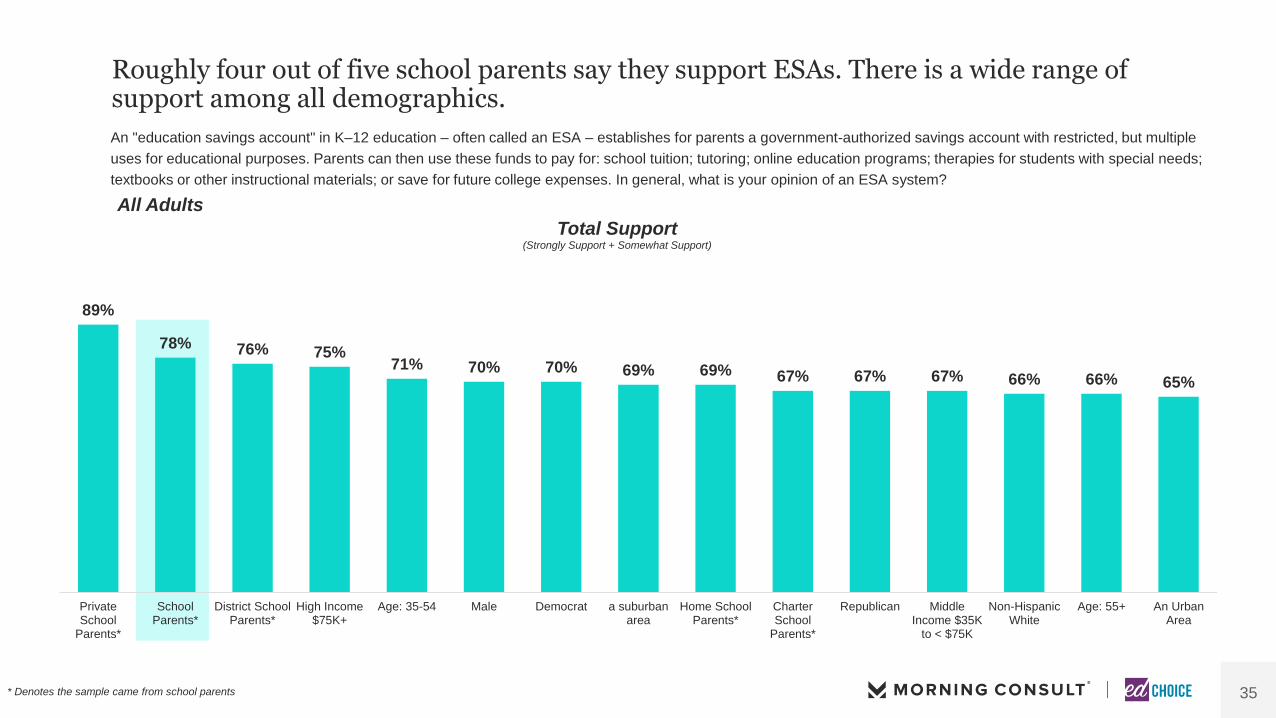
35
89%
78% 76% 75%71% 70% 70% 69% 69% 67% 67% 67% 66% 66% 65%
PrivateSchool
Parents*
SchoolParents*
District SchoolParents*
High Income$75K+
Age: 35-54 Male Democrat a suburbanarea
Home SchoolParents*
CharterSchool
Parents*
Republican MiddleIncome $35K
to < $75K
Non-HispanicWhite
Age: 55+ An UrbanArea
Total Support(Strongly Support + Somewhat Support)
Roughly four out of five school parents say they support ESAs. There is a wide range of support among all demographics.
An "education savings account" in K–12 education – often called an ESA – establishes for parents a government-authorized savings account with restricted, but multiple
uses for educational purposes. Parents can then use these funds to pay for: school tuition; tutoring; online education programs; therapies for students with special needs;
textbooks or other instructional materials; or save for future college expenses. In general, what is your opinion of an ESA system?
All Adults
* Denotes the sample came from school parents

36
Support of ESAs remains high across demographics despite large decreases among GenZers, Independents, and those living in rural communities. An "education savings account" in K–12 education – often called an ESA – establishes for parents a government-authorized savings account with restricted, but multiple
uses for educational purposes. Parents can then use these funds to pay for: school tuition; tutoring; online education programs; therapies for students with special needs;
textbooks or other instructional materials; or save for future college expenses. In general, what is your opinion of an ESA system?
High Income $75K+ 75% +0
Educ: Bachelors or
Postgrad74% -3
Democrat 70% +2
Male 70% +2
Gen X 69% +2
Suburban 69% +2
Millennial 67% +0
Republican 67% +2
Middle Income $35K-
$75K67% +3
Non-Hispanic White 66% +0
South 65% -1
Urban 65% -1
Baby Boomer 65% -1
West 64% -1
Northeast 64% -5
Hispanic 61% -1
Midwest 61% +1
Educ: < College 60% +0
Small Town 59% -4
Female 59% -4
Independent 57% -8
Black 56% -3
Low Income < $35K 54% -6
Rural 53% -7
Gen Z 46% -11
Vs March Vs March Vs March
Most Supportive
All Adults
37
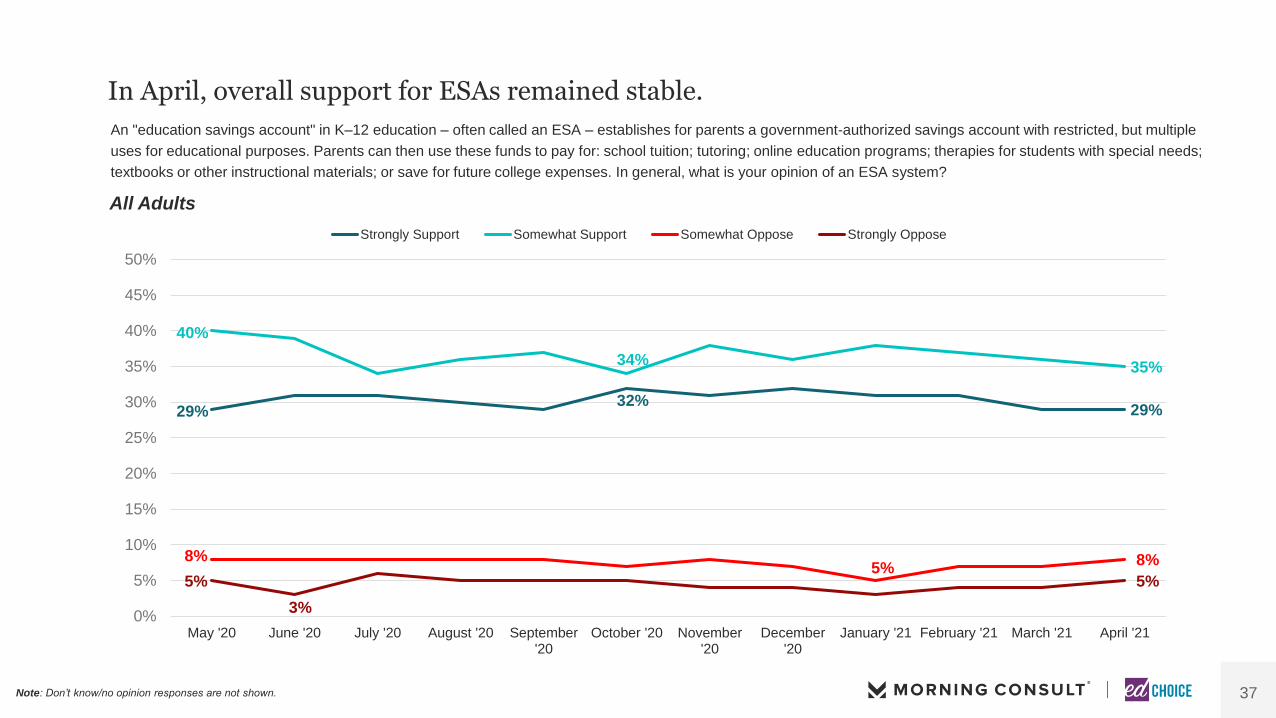
In April, overall support for ESAs remained stable.
An "education savings account" in K–12 education – often called an ESA – establishes for parents a government-authorized savings account with restricted, but multiple
uses for educational purposes. Parents can then use these funds to pay for: school tuition; tutoring; online education programs; therapies for students with special needs;
textbooks or other instructional materials; or save for future college expenses. In general, what is your opinion of an ESA system?
All Adults
29%32%
29%
40%
34%35%
8%5%
8%
5%
3%
5%
0%
5%
10%
15%
20%
25%
30%
35%
40%
45%
50%
May '20 June '20 July '20 August '20 September'20
October '20 November'20
December'20
January '21 February '21 March '21 April '21
Strongly Support Somewhat Support Somewhat Oppose Strongly Oppose
Note: Don’t know/no opinion responses are not shown.

38
Among school parents, overall support for ESAs held steady in April.
An "education savings account" in K–12 education – often called an ESA – establishes for parents a government-authorized savings account with restricted, but multiple
uses for educational purposes. Parents can then use these funds to pay for: school tuition; tutoring; online education programs; therapies for students with special needs;
textbooks or other instructional materials; or save for future college expenses. In general, what is your opinion of an ESA system?
School Parents
3%
7%2%
8% 6% 7%
40%
43%
33%
39%
36%
42%
39%
0%
5%
10%
15%
20%
25%
30%
35%
40%
45%
50%
May '20 June '20 July '20 August '20 September'20
October '20 November'20
December'20
January '21 February '21 March '21 April '21
Strongly Oppose Somewhat Oppose Somewhat Support Strongly Support
Note: Don’t know/no opinion responses are not shown.
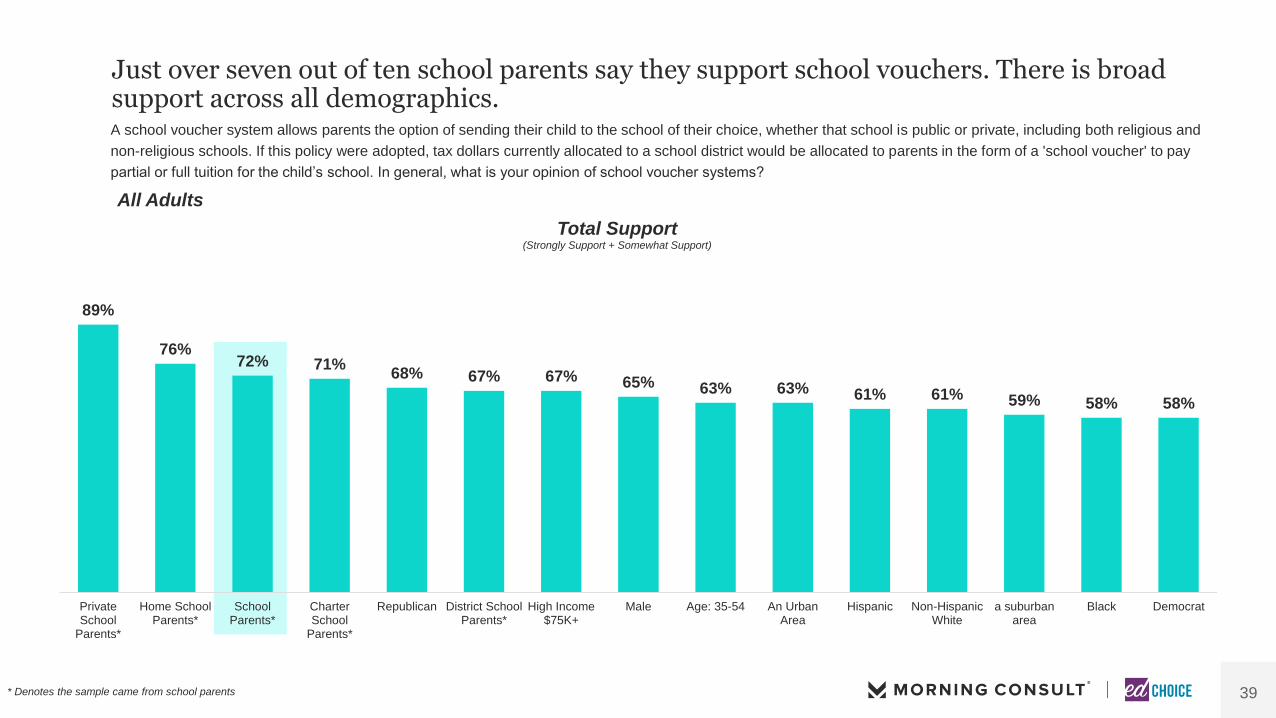
39
89%
76%72% 71%
68% 67% 67% 65% 63% 63% 61% 61% 59% 58% 58%
PrivateSchool
Parents*
Home SchoolParents*
SchoolParents*
CharterSchool
Parents*
Republican District SchoolParents*
High Income$75K+
Male Age: 35-54 An UrbanArea
Hispanic Non-HispanicWhite
a suburbanarea
Black Democrat
Total Support(Strongly Support + Somewhat Support)
Just over seven out of ten school parents say they support school vouchers. There is broad support across all demographics.A school voucher system allows parents the option of sending their child to the school of their choice, whether that school is public or private, including both religious and
non-religious schools. If this policy were adopted, tax dollars currently allocated to a school district would be allocated to parents in the form of a 'school voucher' to pay
partial or full tuition for the child’s school. In general, what is your opinion of school voucher systems?
All Adults
* Denotes the sample came from school parents

40
Support of school vouchers held steady across the majority of demographic groups in April. A school voucher system allows parents the option of sending their child to the school of their choice, whether that school is public or private, including both religious and
non-religious schools. If this policy were adopted, tax dollars currently allocated to a school district would be allocated to parents in the form of a 'school voucher' to pay
partial or full tuition for the child’s school. In general, what is your opinion of school voucher systems?
Republican 68% +2
Millennials 67% +2
High Income $75K+ 67% +2
Educ: Bachelors or
Postgrad66% +4
Male 65% +3
Urban 63% +2
Hispanic 61% +0
Non-Hispanic White 61% +2
West 60% +5
Gen X 59% -4
South 59% -3
Suburban 59% -1
Midwest 59% +4
Democrat 58% -1
Black 58% -2
Middle Income $35K-
$75K58% +1
Baby Boomer 58% +4
Independent 57% +3
Northeast 57% -3
Small Town 57% +0
Educ: < College 56% -1
Low Income < $35K 55% -2
Rural 54% +1
Female 54% -2
Gen Z 45% -4
Vs March Vs March Vs March
Most Supportive
All Adults
41
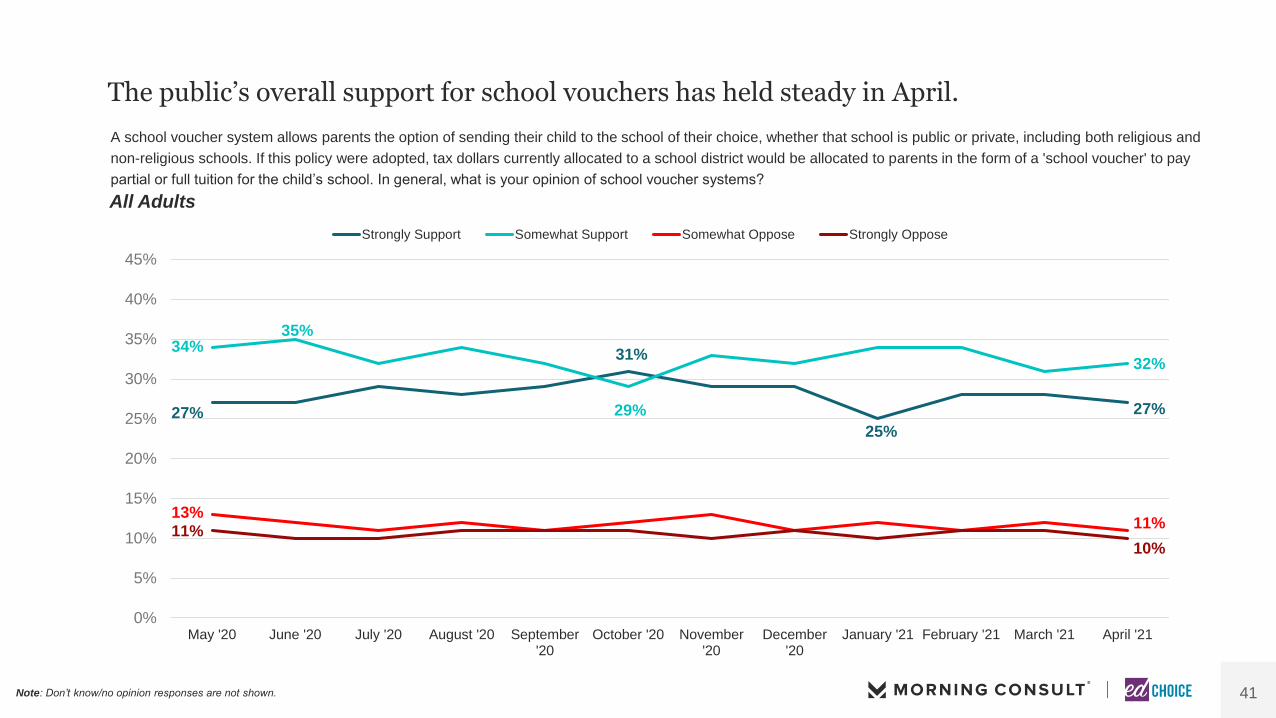
The public’s overall support for school vouchers has held steady in April.
A school voucher system allows parents the option of sending their child to the school of their choice, whether that school is public or private, including both religious and
non-religious schools. If this policy were adopted, tax dollars currently allocated to a school district would be allocated to parents in the form of a 'school voucher' to pay
partial or full tuition for the child’s school. In general, what is your opinion of school voucher systems?
All Adults
27%
31%
25%
27%
34%35%
29%
32%
13%11%
11%10%
0%
5%
10%
15%
20%
25%
30%
35%
40%
45%
May '20 June '20 July '20 August '20 September'20
October '20 November'20
December'20
January '21 February '21 March '21 April '21
Strongly Support Somewhat Support Somewhat Oppose Strongly Oppose
Note: Don’t know/no opinion responses are not shown.

42
School parents' strong support for school vouchers increased by seven points in April.
A school voucher system allows parents the option of sending their child to the school of their choice, whether that school is public or private, including both religious and
non-religious schools. If this policy were adopted, tax dollars currently allocated to a school district would be allocated to parents in the form of a 'school voucher' to pay
partial or full tuition for the child’s school. In general, what is your opinion of school voucher systems?
School Parents
10%
5%
12%9% 12%
34%
41%
32%33%
31%
40%
0%
5%
10%
15%
20%
25%
30%
35%
40%
45%
50%
May '20 June '20 July '20 August '20 September'20
October '20 November'20
December'20
January '21 February '21 March '21 April '21
Strongly Oppose Somewhat Oppose Somewhat Support Strongly Support
Note: Don’t know/no opinion responses are not shown.

43
89%
77%72% 70% 69% 68% 68% 67% 67% 66%
63% 63% 63% 61% 60%
PrivateSchool
Parents*
CharterSchool
Parents*
SchoolParents*
Home SchoolParents*
High Income$75K+
Republican Age: 35-54 District SchoolParents*
Male An UrbanArea
MiddleIncome $35K
to < $75K
Non-HispanicWhite
Age: 55+ a suburbanarea
Democrat
Total Support(Strongly Support + Somewhat Support)
Just under three-fourths of school parents say they support public charter schools. There continues to be widespread support across demographics.
Charter schools are public schools that have more control over their own budget, staff, and curriculum, and are exempt from many existing public school regulations. In
general, what is your opinion of public charter schools?
All Adults
* Denotes the sample came from school parents

44
Among Hispanics and GenZers, support of charter schools decreased in April.
Charter schools are public schools that have more control over their own budget, staff, and curriculum, and are exempt from many existing public school
regulations. In general, what is your opinion of public charter schools?
Most Supportive
Educ: Bachelors or
Postgrad70% +2
High Income $75K+ 69% +1
Republican 68% +0
Male 67% +2
Urban 66% +2
Millennials 64% -1
Gen X 64% +2
Baby Boomer 64% +5
Middle Income $35K to
< $75K63% +1
Non-Hispanic White 63% +1
Northeast 62% -5
South 62% +3
Suburban 61% -3
Democrat 60% +0
West 59% -4
Small Town 58% +0
Midwest 58% +0
Educ: < College 57% -1
Independent 56% -4
Rural 55% +2
Hispanic 55% -10
Female 55% -2
Low Income < $35K 53% -4
Black 49% -5
Gen Z 40% -15
Vs March Vs March Vs March
All Adults
45
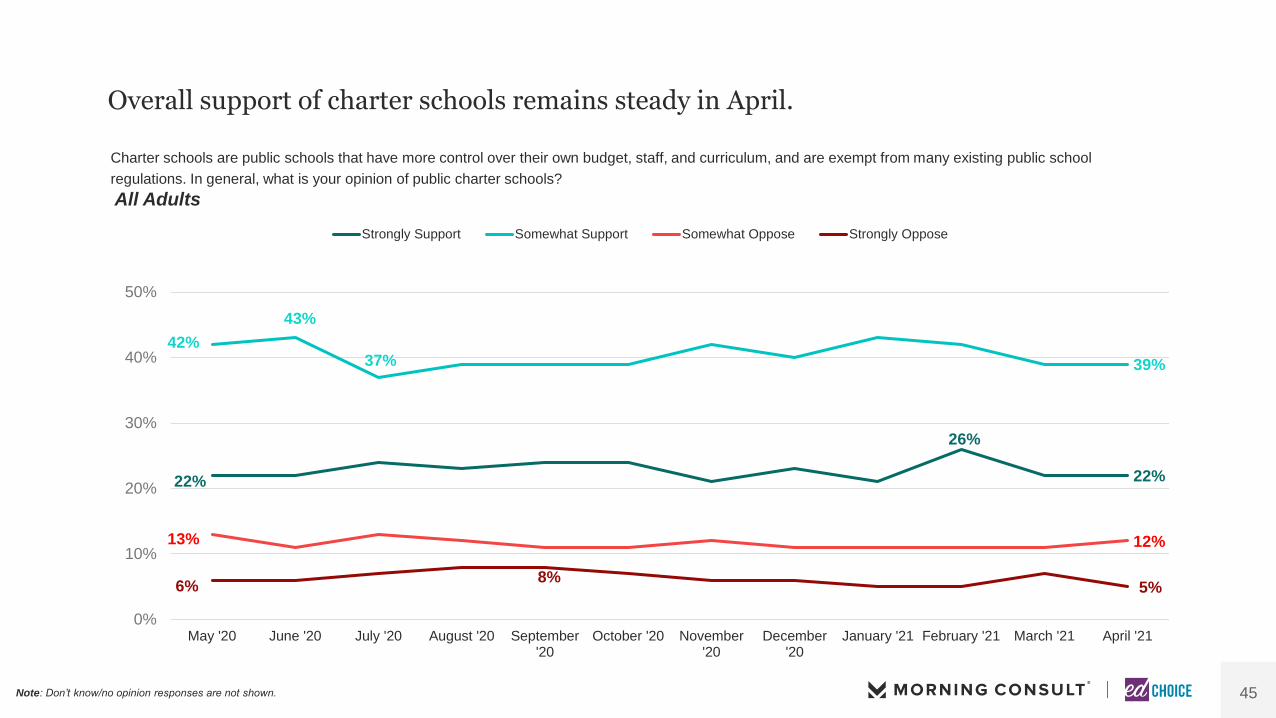
Overall support of charter schools remains steady in April.
Charter schools are public schools that have more control over their own budget, staff, and curriculum, and are exempt from many existing public school
regulations. In general, what is your opinion of public charter schools?
All Adults
22%
26%
22%
42%
43%
37% 39%
13% 12%
6%8%
5%
0%
10%
20%
30%
40%
50%
May '20 June '20 July '20 August '20 September'20
October '20 November'20
December'20
January '21 February '21 March '21 April '21
Strongly Support Somewhat Support Somewhat Oppose Strongly Oppose
Note: Don’t know/no opinion responses are not shown.
46
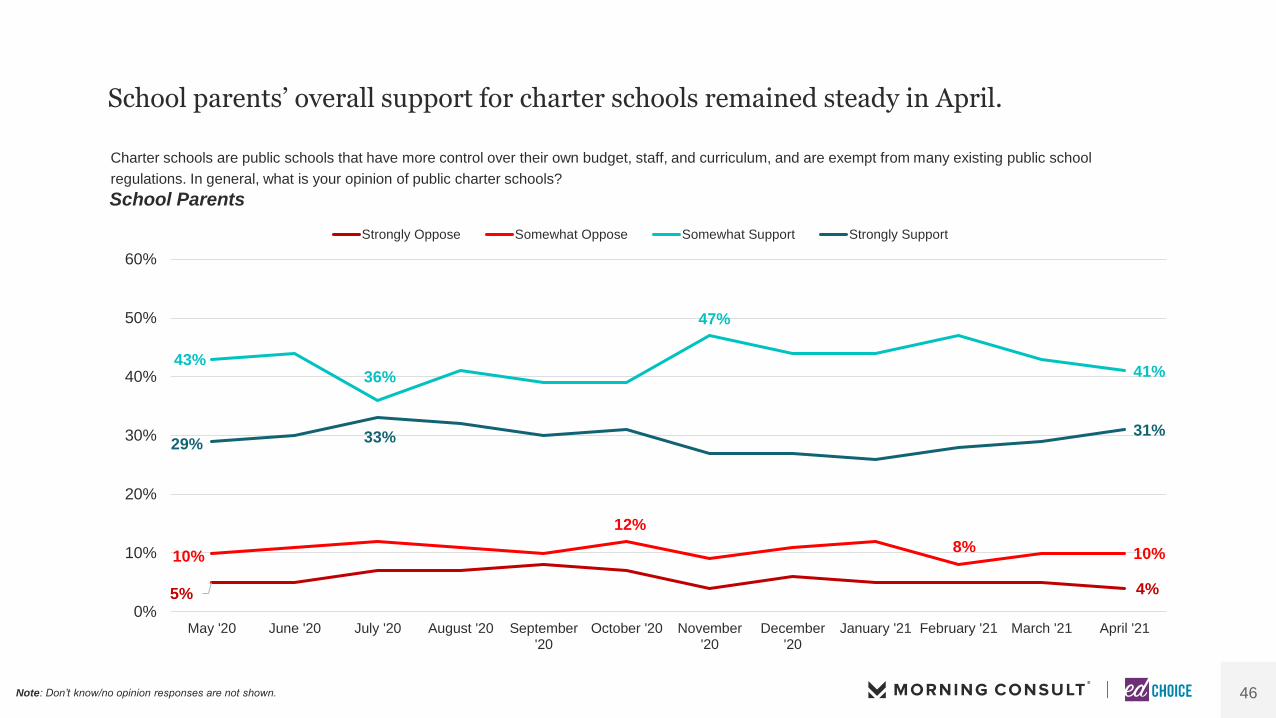
School parents’ overall support for charter schools remained steady in April.
Charter schools are public schools that have more control over their own budget, staff, and curriculum, and are exempt from many existing public school
regulations. In general, what is your opinion of public charter schools?
School Parents
5% 4%
10%
12%
8% 10%
43%36%
47%
41%
29% 33% 31%
0%
10%
20%
30%
40%
50%
60%
May '20 June '20 July '20 August '20 September'20
October '20 November'20
December'20
January '21 February '21 March '21 April '21
Strongly Oppose Somewhat Oppose Somewhat Support Strongly Support
Note: Don’t know/no opinion responses are not shown.

COVID-19 AND SCHOOLING
SCHOOL CHOICE POLICIES
VIEWS ON K-12 EDUCATION
SURVEY PROFILE AND DEMOGRAPHICS
AG E N D A

48
School parents tend to be more optimistic about the direction of K-12 education—especially parents of younger children.
Do you feel things in K-12 Education are generally going in the right direction, or do you feel things have generally gotten off on the wrong track?
In your local school district In your stateNationwide
% Right Direction
61%
66%
57%
53%
35%
Total SchoolParents
K-4 Parents
5-8 Parents
9-12 Parents
Non-Parents
56%
61%
51%
48%
33%
Total SchoolParents
K-4 Parents
5-8 Parents
9-12 Parents
Non-Parents
48%
51%
48%
41%
29%
Total SchoolParents
K-4 Parents
5-8 Parents
9-12 Parents
Non-Parents
49
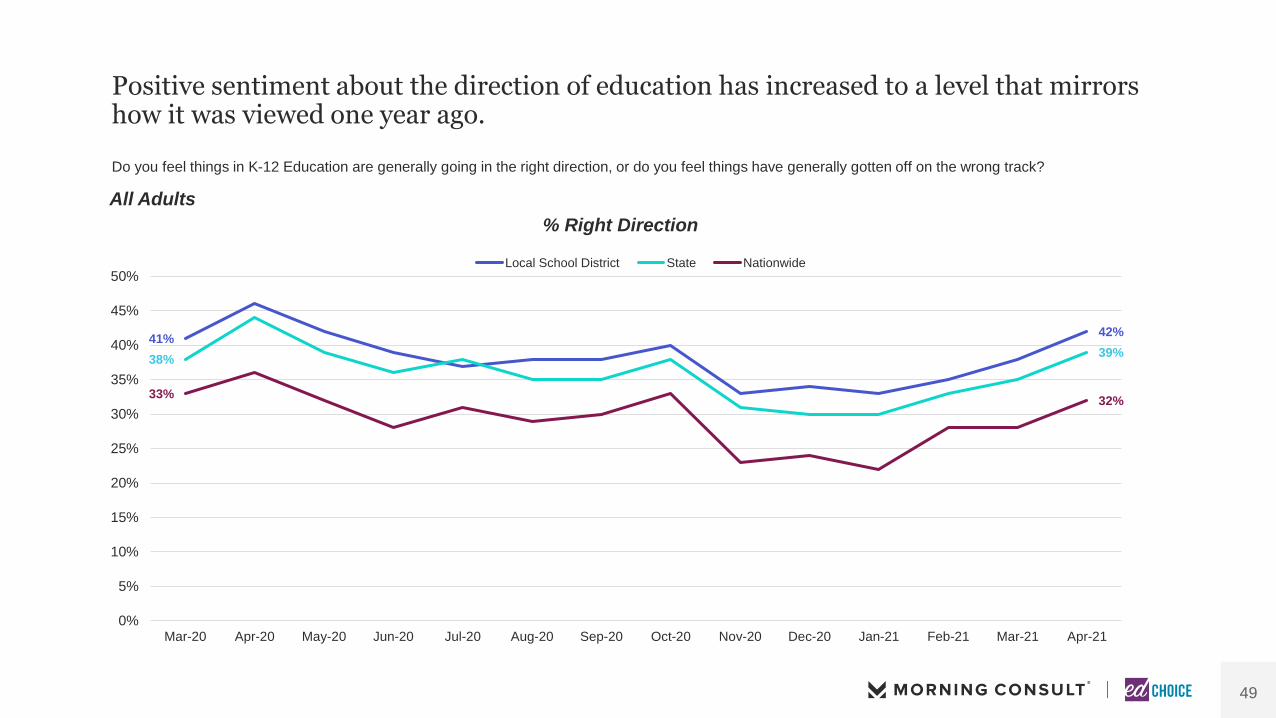
Positive sentiment about the direction of education has increased to a level that mirrors how it was viewed one year ago.
Do you feel things in K-12 Education are generally going in the right direction, or do you feel things have generally gotten off on the wrong track?
All Adults
41%42%
38%39%
33%32%
0%
5%
10%
15%
20%
25%
30%
35%
40%
45%
50%
Mar-20 Apr-20 May-20 Jun-20 Jul-20 Aug-20 Sep-20 Oct-20 Nov-20 Dec-20 Jan-21 Feb-21 Mar-21 Apr-21
% Right Direction
Local School District State Nationwide
50
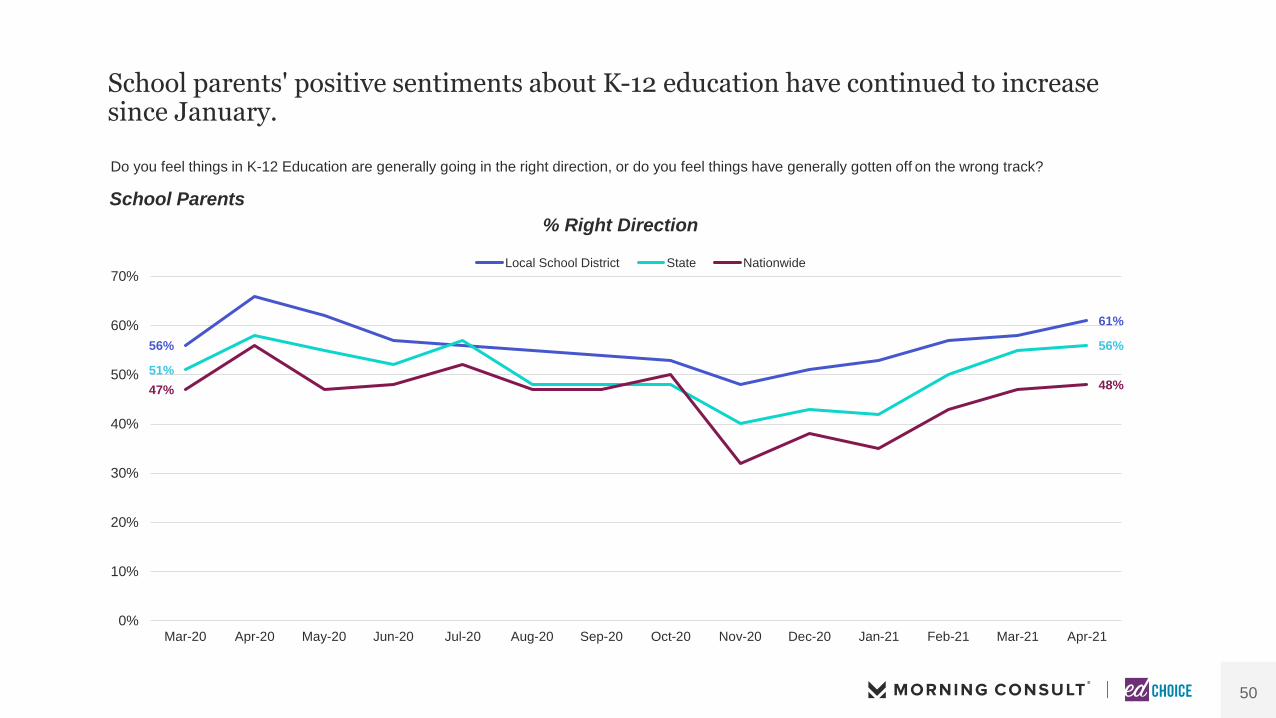
School parents' positive sentiments about K-12 education have continued to increase since January.
Do you feel things in K-12 Education are generally going in the right direction, or do you feel things have generally gotten off on the wrong track?
School Parents
56%
61%
51%
56%
47% 48%
0%
10%
20%
30%
40%
50%
60%
70%
Mar-20 Apr-20 May-20 Jun-20 Jul-20 Aug-20 Sep-20 Oct-20 Nov-20 Dec-20 Jan-21 Feb-21 Mar-21 Apr-21
% Right Direction
Local School District State Nationwide
51
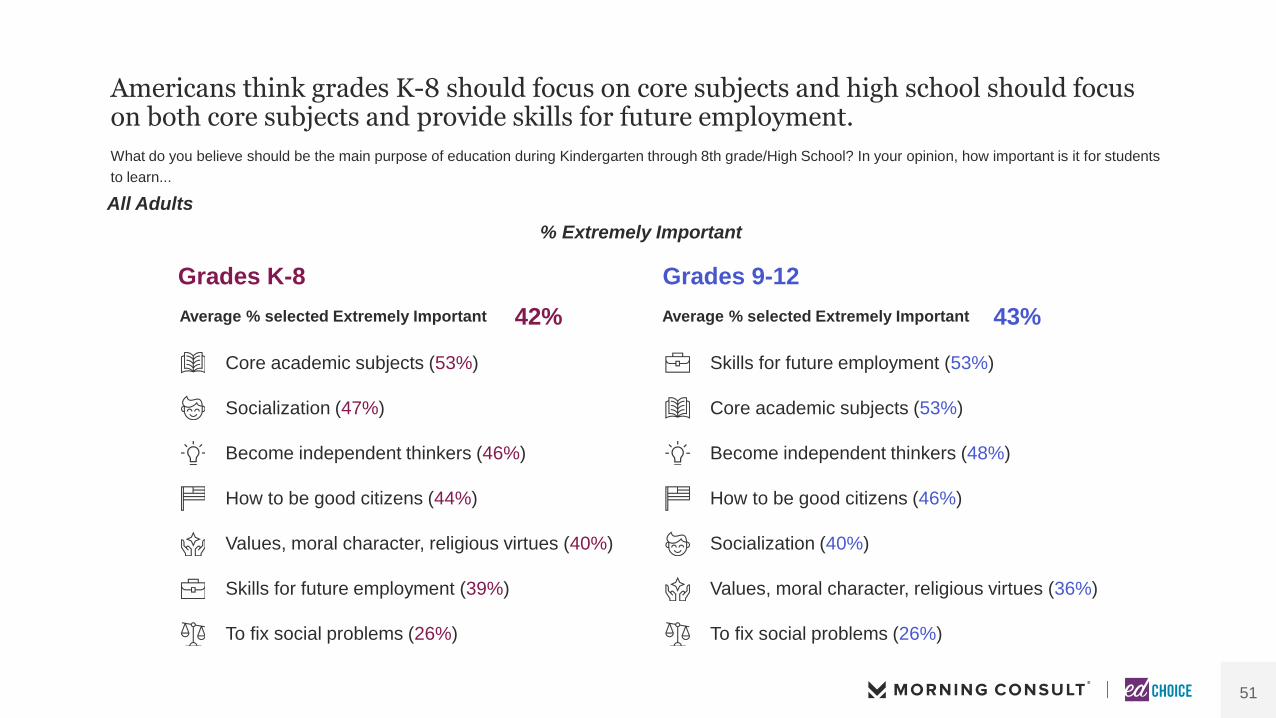
Americans think grades K-8 should focus on core subjects and high school should focus on both core subjects and provide skills for future employment.
What do you believe should be the main purpose of education during Kindergarten through 8th grade/High School? In your opinion, how important is it for students
to learn...
Grades K-8 Grades 9-12
Core academic subjects (53%) Skills for future employment (53%)
Socialization (47%) Core academic subjects (53%)
Become independent thinkers (46%) Become independent thinkers (48%)
How to be good citizens (44%) How to be good citizens (46%)
Values, moral character, religious virtues (40%) Socialization (40%)
Skills for future employment (39%) Values, moral character, religious virtues (36%)
To fix social problems (26%) To fix social problems (26%)
Average % selected Extremely Important 42% Average % selected Extremely Important 43%
% Extremely Important
All Adults

52
School parents are most likely to say learning academic subjects is an extremely important purpose of K-8 education.
What do you believe should be the main purpose of education during Kindergarten through 8th grade? In your opinion, how important is it for students to learn...
School Parents
58%
50%
49%
49%
47%
43%
35%
26%
31%
28%
31%
25%
30%
27%
12%
11%
12%
12%
17%
17%
23%
5%
4%
5%
5%
6% 4% 4%
Core academic subjects
To become independent thinkers
How to be good citizens
Socialization
Skills for future employment
Values, moral character, orreligious virtues
To fix social problems
Extremely Important Very Important Somewhat Important Not That Important Not At All Important Don't Know/No Opinion
53
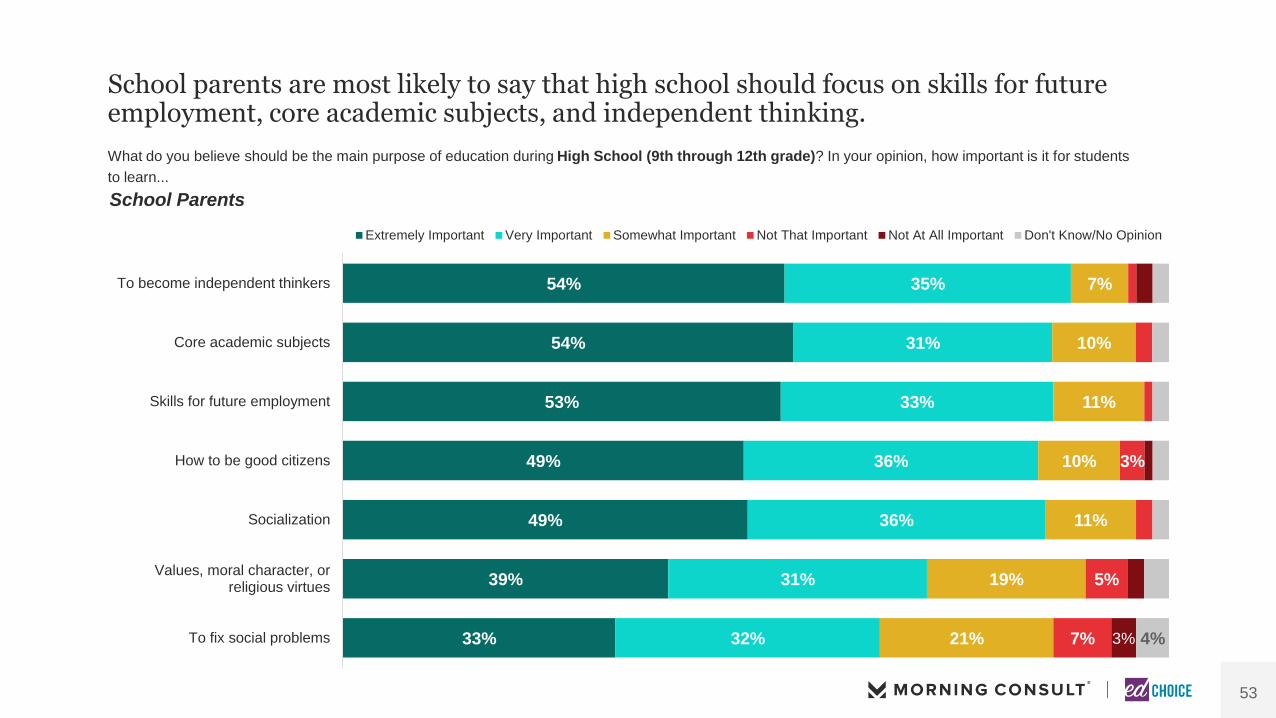
School parents are most likely to say that high school should focus on skills for future employment, core academic subjects, and independent thinking.
What do you believe should be the main purpose of education during High School (9th through 12th grade)? In your opinion, how important is it for students
to learn...
54%
54%
53%
49%
49%
39%
33%
35%
31%
33%
36%
36%
31%
32%
7%
10%
11%
10%
11%
19%
21%
3%
5%
7% 3% 4%
To become independent thinkers
Core academic subjects
Skills for future employment
How to be good citizens
Socialization
Values, moral character, orreligious virtues
To fix social problems
Extremely Important Very Important Somewhat Important Not That Important Not At All Important Don't Know/No Opinion
School Parents
54
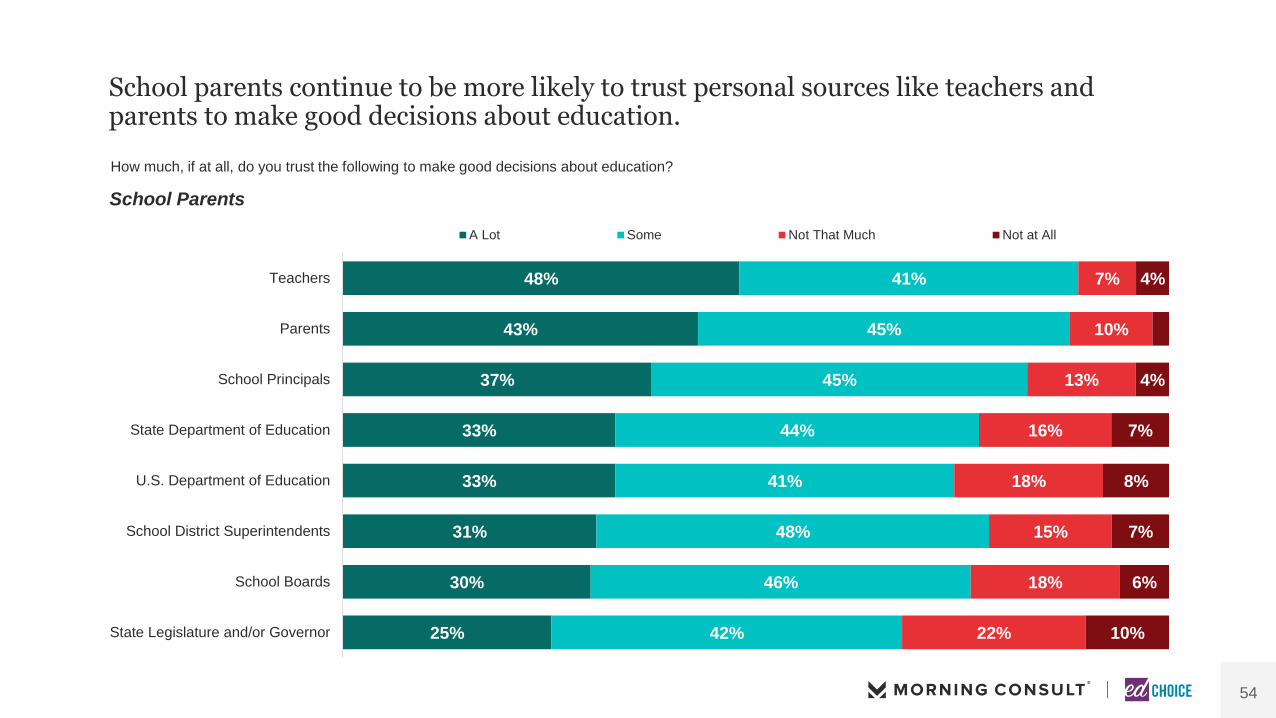
School parents continue to be more likely to trust personal sources like teachers and parents to make good decisions about education.
How much, if at all, do you trust the following to make good decisions about education?
School Parents
48%
43%
37%
33%
33%
31%
30%
25%
41%
45%
45%
44%
41%
48%
46%
42%
7%
10%
13%
16%
18%
15%
18%
22%
4%
4%
7%
8%
7%
6%
10%
Teachers
Parents
School Principals
State Department of Education
U.S. Department of Education
School District Superintendents
School Boards
State Legislature and/or Governor
A Lot Some Not That Much Not at All
55
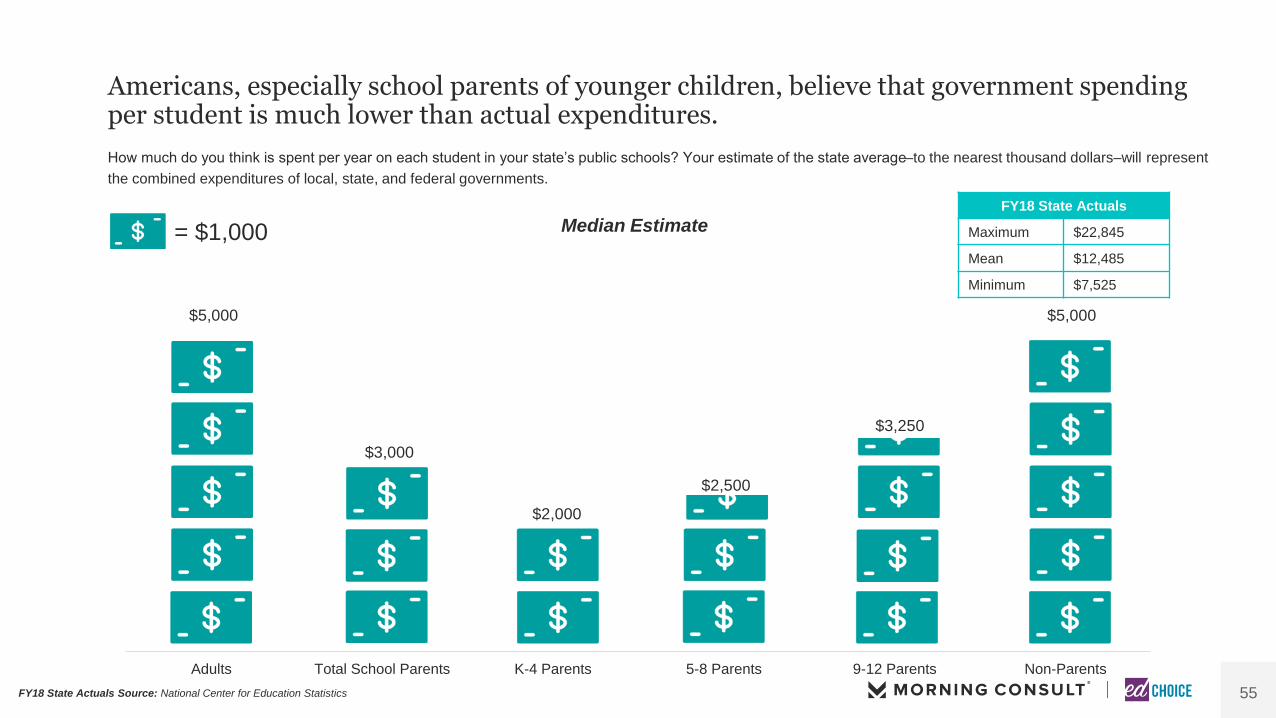
Americans, especially school parents of younger children, believe that government spending per student is much lower than actual expenditures.
How much do you think is spent per year on each student in your state’s public schools? Your estimate of the state average–to the nearest thousand dollars–will represent
the combined expenditures of local, state, and federal governments.
FY18 State Actuals Source: National Center for Education Statistics
= $1,000 Median Estimate
$5,000
$3,000
$2,000
$2,500
$3,250
$5,000
Adults Total School Parents K-4 Parents 5-8 Parents 9-12 Parents Non-Parents
FY18 State Actuals
Maximum $22,845
Mean $12,485
Minimum $7,525

56
Americans are less likely (-14 points) to say their state’s per-student spending is “too low” when given a publicly reported statistic.
Do you believe public school funding in [STATE] is:
46%
46%
48%
40%
40%
41%
14%
14%
11%
Adults
Total SchoolParents
Non-Parents
32%
34%
33%
43%
44%
44%
25%
22%
23%
Adults
Total SchoolParents
Non-Parents
Without Information With Information
On average, [STATE] spends $____ per student attending public
school each year. Do you believe public school funding is:
State Per Pupil Spending Source: National Center for Education Statistics

57
The percentage of Americans who believe public school funding is “too low”—whether they received information or not—decreased since March.
Do you believe public school funding in [STATE] is:
On average, [STATE] spends $____ per student attending public school each year. Do you believe public school funding is:
All Adults
54%
46%
31%
32%
0%
10%
20%
30%
40%
50%
60%
70%
80%
May '20 June '20 July '20 August '20 September'20
October '20 November'20
December'20
January '21 February '21 March '21 April '21
% Too Low
Without Information With Information
58
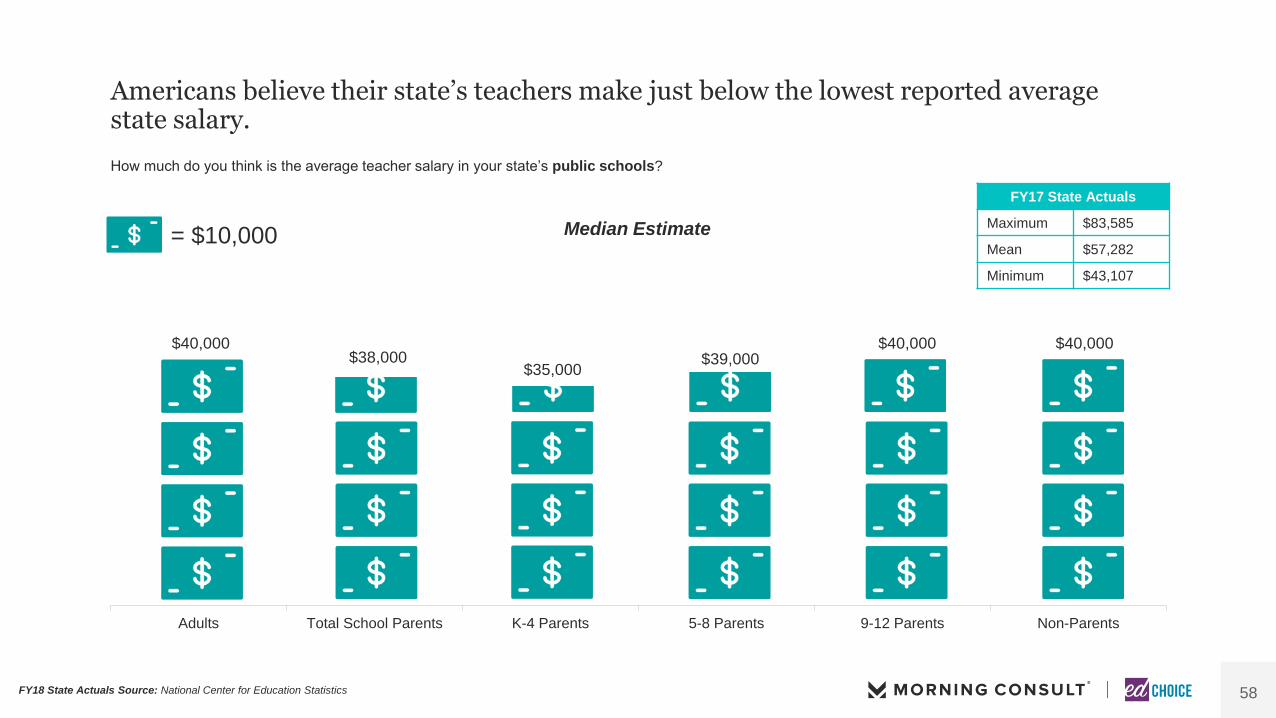
$40,000 $38,000
$35,000 $39,000
$40,000 $40,000
Adults Total School Parents K-4 Parents 5-8 Parents 9-12 Parents Non-Parents
Americans believe their state’s teachers make just below the lowest reported average state salary.
How much do you think is the average teacher salary in your state’s public schools?
FY17 State Actuals
Maximum $83,585
Mean $57,282
Minimum $43,107
FY18 State Actuals Source: National Center for Education Statistics
= $10,000 Median Estimate

59
Americans are less likely (-17 points) to say teacher salaries should increase when given a publicly reported statistic.
Do you think that public school teacher salaries
in your state should:
61%
61%
60%
33%
34%
33%
6%
4%
7%
Adults
Total SchoolParents
Non-Parents
44%
50%
41%
44%
38%
46%
12%
12%
12%
Adults
Total SchoolParents
Non-Parents
Without Information With Information
On average, public school teachers in [STATE] are paid an annual
average salary of $____ per student attending public school each year.
Do you think that public school teacher salaries in your state should:
State Teacher Salary Source: National Center for Education Statistics
60
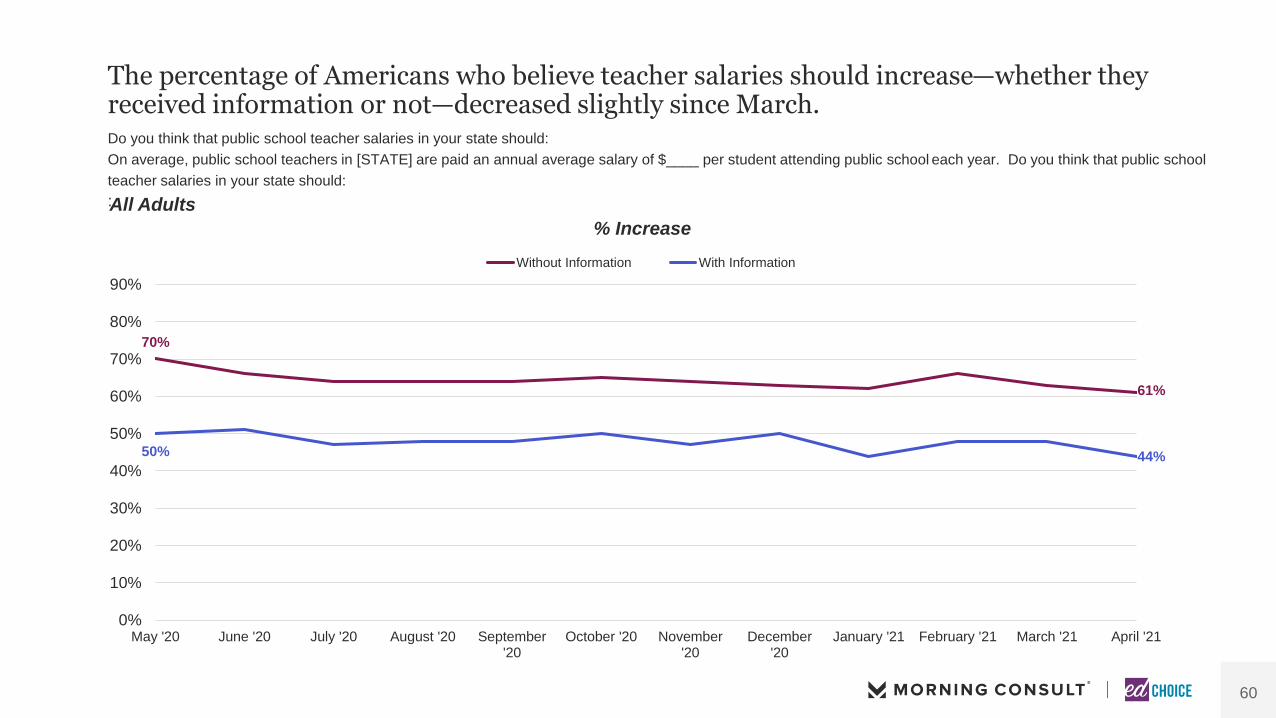
The percentage of Americans who believe teacher salaries should increase—whether they received information or not—decreased slightly since March.Do you think that public school teacher salaries in your state should:
On average, public school teachers in [STATE] are paid an annual average salary of $____ per student attending public school each year. Do you think that public school
teacher salaries in your state should:
:All Adults
70%
61%
50% 44%
0%
10%
20%
30%
40%
50%
60%
70%
80%
90%
May '20 June '20 July '20 August '20 September'20
October '20 November'20
December'20
January '21 February '21 March '21 April '21
% Increase
Without Information With Information
61
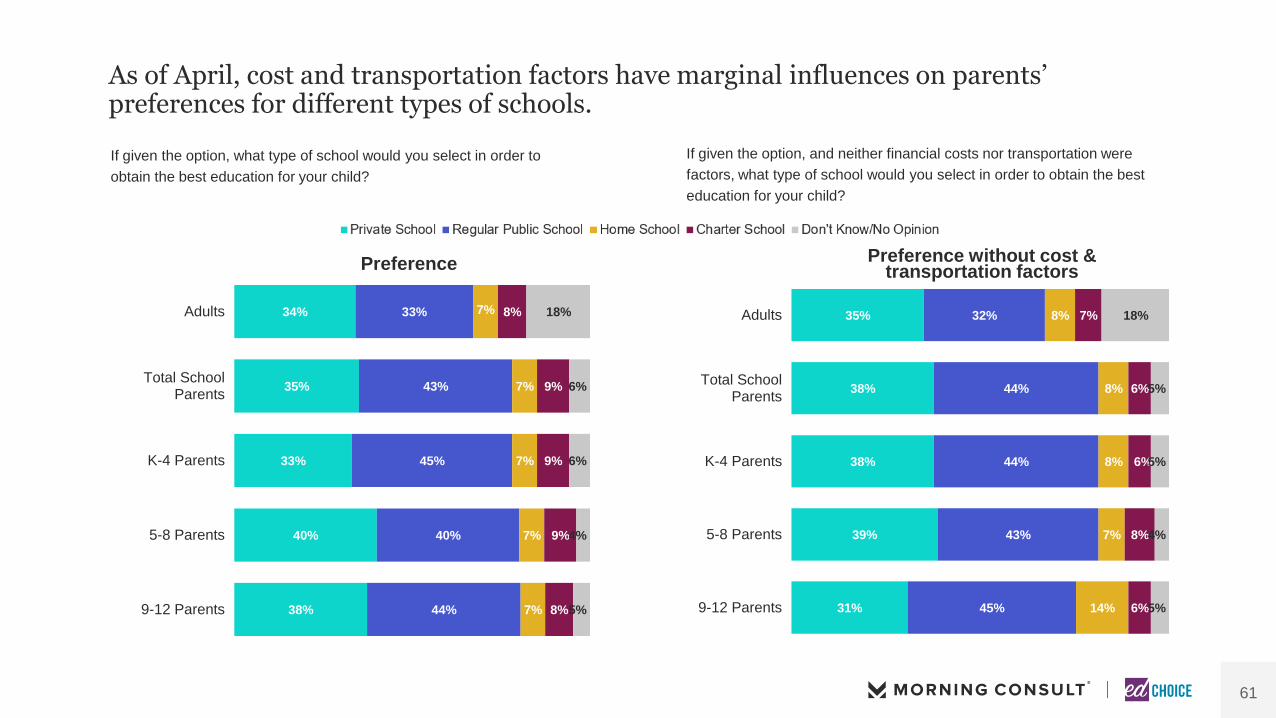
As of April, cost and transportation factors have marginal influences on parents’ preferences for different types of schools.
If given the option, what type of school would you select in order to
obtain the best education for your child?
If given the option, and neither financial costs nor transportation were
factors, what type of school would you select in order to obtain the best
education for your child?
35%
38%
38%
39%
31%
32%
44%
44%
43%
45%
8%
8%
8%
7%
14%
7%
6%
6%
8%
6%
18%
5%
5%
4%
5%
Adults
Total SchoolParents
K-4 Parents
5-8 Parents
9-12 Parents
34%
35%
33%
40%
38%
33%
43%
45%
40%
44%
7%
7%
7%
7%
7%
8%
9%
9%
9%
8%
18%
6%
6%
4%
5%
Adults
Total SchoolParents
K-4 Parents
5-8 Parents
9-12 Parents
Preference Preference without cost & transportation factors
62
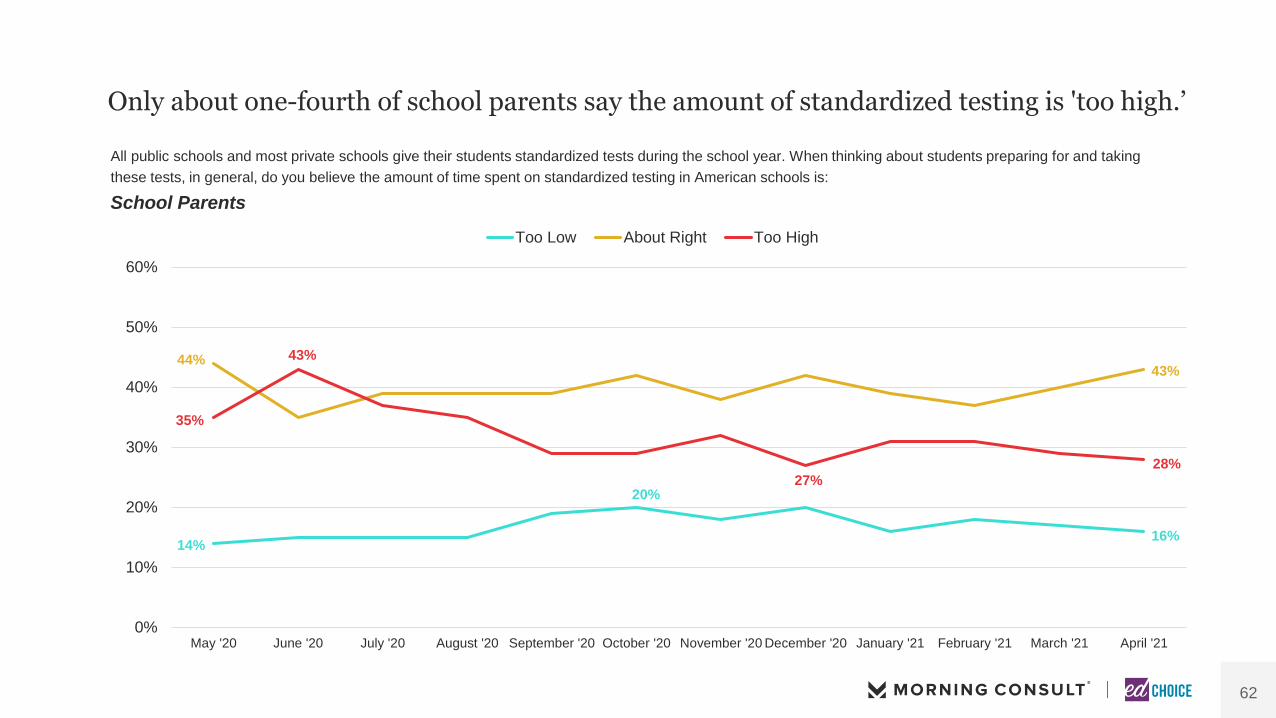
Only about one-fourth of school parents say the amount of standardized testing is 'too high.’
All public schools and most private schools give their students standardized tests during the school year. When thinking about students preparing for and taking
these tests, in general, do you believe the amount of time spent on standardized testing in American schools is:
School Parents
14%
20%
16%
44%43%
35%
43%
27%
28%
0%
10%
20%
30%
40%
50%
60%
May '20 June '20 July '20 August '20 September '20 October '20 November '20 December '20 January '21 February '21 March '21 April '21
Too Low About Right Too High

63
School parents are far more likely to support directly receiving standardized test results of their children compared to other kinds of actions or uses of testing.
How much do you support or oppose each of the following as it relates to K-12 standardized testing this year?
School Parents
87%
71%
74%
69%
68%
67%
60%
57%
34%
32%
32%
31%
30%
26%
30%
37%
42%
37%
37%
37%
34%
5%
14%
11%
12%
13%
13%
16%
5%
7%
7%
10%
8%
6%
10%
11%
12%
11%
9%
16%
Providingparents/guardians
test results
Shorteningstandardized tests
Extending the testingwindow
Holding individualschools accountable
for test results
Holding schooldistricts accountable
for test results
Schools administeringstandardized tests
this spring
Remoteadministration of
standardized tests
Strongly Support Somewhat Support Somewhat Oppose Strongly Oppose Don't Know/ No OpinionTotal Support

COVID-19 AND SCHOOLING
SCHOOL CHOICE POLICIES
VIEWS ON K-12 EDUCATION
SURVEY PROFILE AND DEMOGRAPHICS
AG E N D A

65
Survey Profile, 1
Dates April 16-26, 2021
Survey Data Collection
& Quality Control Morning Consult
Survey Sponsor EdChoice
Population General Population (Adults, Age 18+)
Sampling Frame National sample of adults (age 18+) living in the United States,
including the District of Columbia, with an oversample of school
parents
Sampling Method Non-Probability, Stratified (based on Age, Gender)
Mode Online Survey
Language English

66
Survey Profile, 2
Survey Time Gen Pop Median = 11.88 minutes, Oversample Median = 12.32
minutes
Sample Size N = 2,200 General Population
N= 1,134 Total School Parents
Oversampling N = 700 School Parents
Quotas Age, Gender
Weighting Age, Race, Ethnicity, Gender, Education, Census Region
Measure of Precision
(adjusted for weighting) ± 2.62 percentage points (Gen Pop), ± 2.22 percentage points
(Oversample)
Participation Rate 32.31% (Gen Pop), 23.08% (Oversample)
Methods Page https://edchoice.morningconsultintelligence.com/methodology/
Project Contact Paul DiPerna, [email protected]

67
DemographicsUnweighted
(N = )
Hispanic 128
White 1893
Non-Hispanic White 1821
Black 147
Other 67
Generation Z 164
Millennial 481
Generation X 545
Boomers 888
Male 1066
Female 1134
< College 1275
College + 925
Northeast 506
Midwest 488
South 834
West 372
DemographicsUnweighted
(N = )
Total School Parents* 1134
K-4 Parents* 630
5-8 Parents* 518
9-12 Parents* 366
Non-Parents 851
Liberal 633
Moderate 639
Conservative 777
Democrat 841
Independent 529
Republican 698
Urban 564
Suburban 1000
Small Town 224
Rural 412
Low Income <$35K 751
Middle Income $35K to <$75K 728
High Income $75K+ 721
* Denotes the sample came from school parents
68
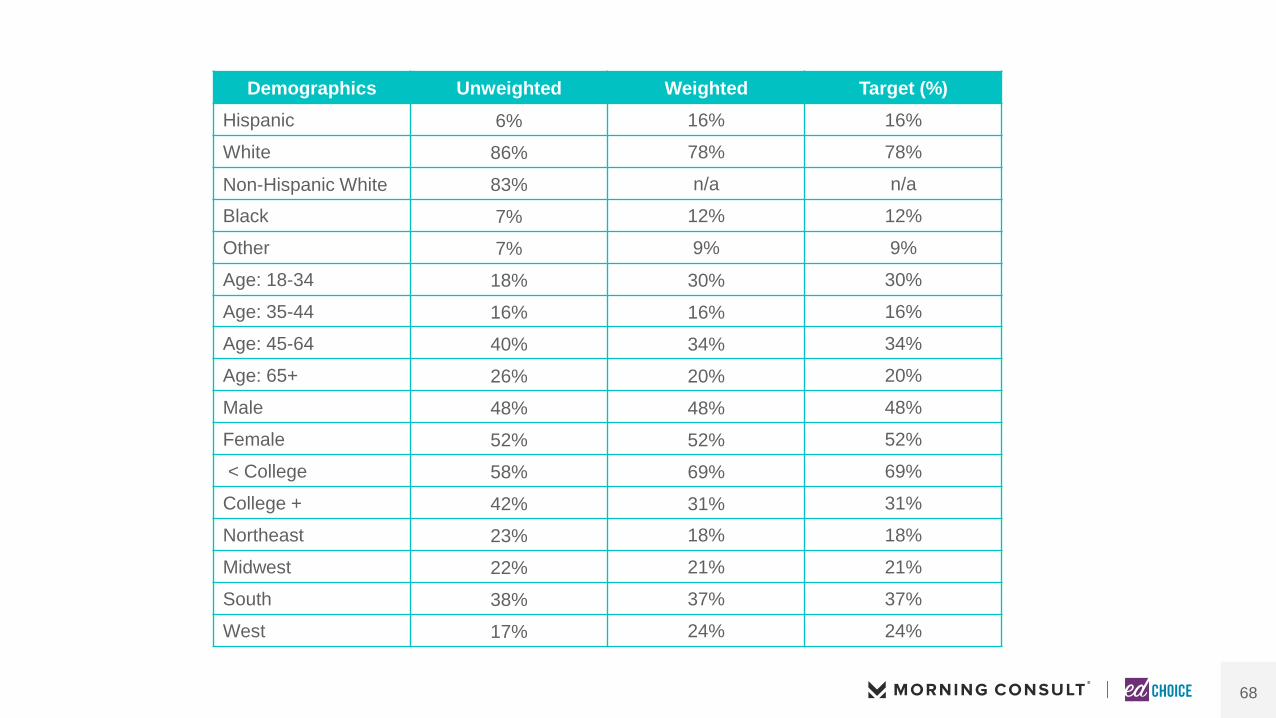
Demographics Unweighted Weighted Target (%)
Hispanic 6% 16% 16%
White 86% 78% 78%
Non-Hispanic White 83% n/a n/a
Black 7% 12% 12%
Other 7% 9% 9%
Age: 18-34 18% 30% 30%
Age: 35-44 16% 16% 16%
Age: 45-64 40% 34% 34%
Age: 65+ 26% 20% 20%
Male 48% 48% 48%
Female 52% 52% 52%
< College 58% 69% 69%
College + 42% 31% 31%
Northeast 23% 18% 18%
Midwest 22% 21% 21%
South 38% 37% 37%
West 17% 24% 24%
69
Methodology Update
In addition to the monthly general population polling, Morning Consult has
begun oversampling K-12 school parents, among a national sample of parents
living in the United States (including the District of Columbia). The sample is
collected via stratified sampling based on race and ethnicity quota targets
derived from the U.S. Census Bureau’s 2016 Current Population Survey.
Approximately 700 additional K-12 school parents are interviewed in English
each month comprising the oversample. The completed K-12 school parent
interviews are weighted to population totals obtained from the 2016 Current
Population Survey on the following demographic variables: age, gender, region,
race/ethnicity, and educational attainment. Morning Consult has also
implemented a pre-administration quota to ensure at least 65 percent of K-12
parent respondents had at least one child attending a public district school.
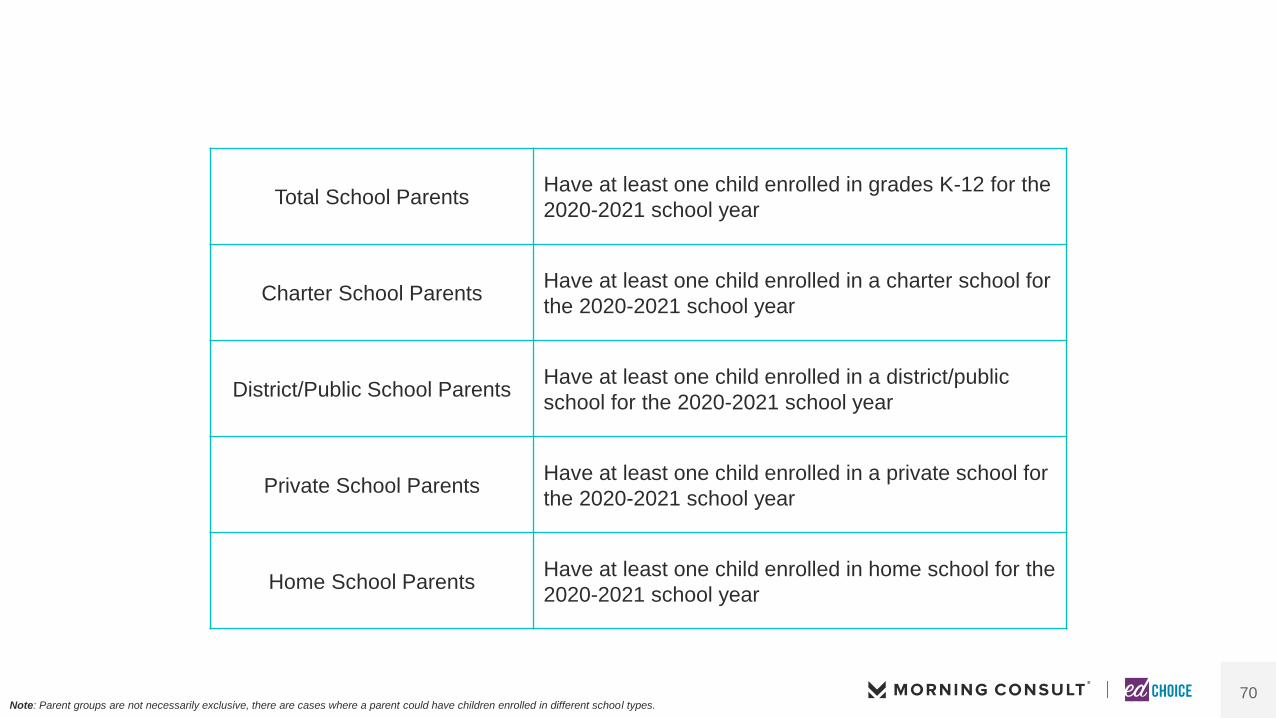
70
Total School ParentsHave at least one child enrolled in grades K-12 for the
2020-2021 school year
Charter School ParentsHave at least one child enrolled in a charter school for
the 2020-2021 school year
District/Public School ParentsHave at least one child enrolled in a district/public
school for the 2020-2021 school year
Private School ParentsHave at least one child enrolled in a private school for
the 2020-2021 school year
Home School ParentsHave at least one child enrolled in home school for the
2020-2021 school year
Note: Parent groups are not necessarily exclusive, there are cases where a parent could have children enrolled in different school types.

71
65%
24%
11%
6%
District School Parents Private School Parents Home School Parents Charter School Parents
(N = 740) (N = 275) (N=123) (N = 72)
Based on enrollment for the 2020-2021 school year
Note: Parent groups are not necessarily exclusive, there are cases where a parent could have children enrolled in different school types.
W H O W E AR E
Morning Consult is a global data intelligence company
delivering insights on what people think in real time.
By surveying tens of thousands across the globe every
day, Morning Consult is unmatched in scale and speed:
It determines the true measure of what people think and
how their decisions impact business, politics and the
economy.
Industry leaders rely on Morning Consult’s proprietary
technology and analysis for real-time intelligence to
transform information into a competitive advantage.
EdChoice is a 501(c)(3) nonprofit, nonpartisan
organization. Our team is driven by the shared mission
to advance freedom and choice in K-12 education
where all families, regardless of race, origin or family
income, are free to choose a learning environment—
public or private, near or far, religious or secular—that
works best for their children.
Learn more at: EDCHOICE.ORG

© 2020 Morning Consult, All Rights Reserved.
MORNINGCONSULT.COM