The Promotion World According to Retail
43
. . . . . . . . . . . . . . . . . . . teaching research executive education a food industry management program publication The Promotion World According to Retail A Look at Manufacturer Promotional Programs from the Retail Perspective John L. Park Gene A. German $25 per copy Copies may be purchased from: Food Industry Management Program, 113 Warren Hall Cornell University, Ithaca, NY 14853-7801 Phone: (607) 255-1622 Fax: (607) 255-4776 January 1999
Transcript of The Promotion World According to Retail

. . . . . . . . . .
. . . . . . . . .
t each ing • r e sea rch • execu t ive educa t ion
a food industry management program publication
The Promotion World According to Retail
A Look at Manufacturer Promotional Programs from the Retail Perspective
John L. Park Gene A. German
$25 per copy Copies may be purchased from:
Food Industry Management Program, 113 Warren Hall Cornell University, Ithaca, NY 14853-7801
Phone: (607) 255-1622 Fax: (607) 255-4776
January 1999

© 1999, Food Industry Management Program, Cornell University. All rights are reserved.

executive summary In an effort to ease communication between packaged goods manufacturers and retailers, this report
investigates the preferences retailers have concerning the various promotional programs used in their
stores. Through the use of a mail survey, retail executives from supermarket, drug, and mass
merchandise companies shared their perceptions of 22 specific promotional programs regarding their
use, effectiveness, and attractiveness for future support. Some significant findings were:
• The most commonly used promotions overall were in-store demonstrations and
sampling and shipper displays.
• Targeted direct mail and shipper displays shared the highest rating of all promotions
evaluated for their ability to increase product movement.
• Targeted direct mail received the highest rating of all promotions evaluated for their
ability to increase overall store sales.
• More than any other promotional program, retail executives indicated that in-store or
in-ad coupons would be the most likely to obtain a retailer’s display support.
• When asked which programs they would negotiate to increase funding, retail
executives indicated targeted direct mail more than any other promotional program.
Clear and consistent performers include targeted direct mail, shipper displays, in-store coupons, in-
ad coupons, and in-store demos and sampling. However, it is noted that the use and perceived
effectiveness of these programs may not always seem consistent. For example, retailers felt
promotions tied to local charities are relatively ineffective at increasing product movement or overall
store sales, and yet this promotional tool is used by 91% of retailers surveyed. On the other hand,
frequent shopper programs received favorable marks regarding program effectiveness, and yet is not
commonly used by retailers in this survey. Ultimately, the value a retailer places on any given
promotion is a function of its ability to meet stated retail objectives, which may extend beyond any
hard sales statistics.

acknowledgments The research contained in this report would not have been possible without the generosity of the
numerous industry executives who participated in the survey process. Not only did these individuals
patiently complete surveys, but also many of them answered questions and provided insights that
shaped this research into a valuable source of information. Many individuals did this purely out of
friendship for Cornell University and the Food Industry Management Program, but all participated
out of a sincere desire to improve communication between packaged goods manufacturers and
retailers. Thank you to our many friends and colleagues who made this report a success. Finally,
thank you to TradeZone for sponsoring this research and providing a truly enlightening research
opportunity.
John L. Park Research Associate
Cornell University
Gene A. German The Robert G. Tobin Professor of Marketing
Cornell University

foreword As the packaged goods marketing community increases its emphasis and spending on account level
co-marketing campaigns, the need for a better understanding of the marketing and promotional
landscape of their retail partners has increased dramatically. Unfortunately the communication
protocols and processes within many packaged goods marketing companies is not developed enough
to facilitate an accurate and regular flow of this type of information from field sales organization to
the drawing boards of the marketing department. As a result many account level marketing programs
are designed without the input and perspective of the retailer. The result is a proliferation of
marketing campaigns that receive a cool reception at retail or miss the mark completely.
The purpose of this research report is to provide marketers with a better summary understanding of
the marketing and promotional preferences of retailers. The ultimate goal, of course, is to help
marketers and retailers build co-marketing programs that better achieve their joint business
objectives.
While some of the findings simply confirm things that most marketers assume to be true (i.e. display
shippers and in-store sampling move incremental product) there are others that are truly enlightening.
We invite you to read and digest the information in this report and urge you to use it and any other
pertinent information you gather to develop better co-marketing efforts with your retail and packaged
goods marketing partners.
Tim Hawkes President
TradeZone, LLC

table of contents Executive Summary....................................................................................................................................iii
Acknowledgments ..................................................................................................................................... iv
Foreword....................................................................................................................................................... v
Table Of Contents ...................................................................................................................................... vi
List Of Tables And Figures...................................................................................................................... vii
Introduction.................................................................................................................................................. 1
The Promotional Preference Survey ....................................................................................................... 2
Survey Results ............................................................................................................................................ 4
Current Status............................................................................................................................4
Program Effectiveness...............................................................................................................5
Retail Support ............................................................................................................................6
The Big Picture .......................................................................................................................................... 10
General Comments On Results...............................................................................................10
A Realistic Look At Effective Promotions ................................................................................12
Comments On Specific Promotional Programs.......................................................................12
Comments On Specific Channels Of Trade ............................................................................15
Concluding Remarks ...............................................................................................................15
Appendix A: The Promotional Preference Survey.............................................................................. 17
Appendix B: A Glossary of Terms ......................................................................................................... 21
Appendix C: Detailed Survey Responses ............................................................................................ 23
Additional Publications............................................................................................................................ 35

list of tables and figures Figure 1. Respondents reporting program use in their company’s stores. ......................................4
Figure 2. Rating programs for their ability to increase product movement. .....................................5
Figure 3. Rating programs for their ability to increase overall store sales. ......................................6
Figure 4. Top three promotional programs most likely to obtain display support. ...........................7
Figure 5. I would negotiate to increase this program’s funding........................................................7
Table 1. Funding and Performance of Selected Activities ...............................................................9
Table 2. Getting the Big Picture – A Look at the Overall Results ..................................................11


. . . . . . ..
The Promotion World According to Retail A Look at Manufacturer Promotional Programs from the Retail Perspective
introduction According to AC Nielsen1, manufacturers currently spend about $70 billion annually on trade
promotions. Further, the trend has been for packaged goods manufacturers to spend a larger share of
their advertising budget on promotional activities. Thus, it is increasingly important for them to
understand what retailers perceive are effective and desirable promotional programs. This need is
further exemplified by the contrasting goals manufacturers and retailers set for the same promotion.
According to AC Nielsen, the top three reasons manufacturers engage in trade promotion are:
1. Increase Sales Volume
2. Maintain Volume/Share
3. Increase Market Share
And yet these motivations are in stark contrast to the most important reasons given by retailers for
implementing promotions:
1. Increase Store Traffic
2. Improve Category Profitability
3. Increase Customer Loyalty
While the promotional program of a packaged goods manufacturer may readily achieve their stated
goals, it may not achieve goals established by the retailer. Further, if the retailer is dissatisfied with
the promotion, just how effective will the promotion be at reaching the customer as intended? In this
light, a manufacturer would be greatly served by an understanding of retailer perceptions and
preferences of the available promotional tactics. This study seeks to fill this lack of knowledge.
1 AC Nielsen. Eighth Annual Survey of Trade Promotion Practices, 1998.

the promotional preference survey � 2
the promotional preference survey This report details the results of a survey conducted by the Food Industry Management Program at
Cornell University for TradeZone, LLC. The survey was mailed directly to retail executives from
supermarket, discount drug, and mass merchandise companies. The key executives who responded to
this survey represent 48 companies and divisions whose operational coverage extend to over 19,000
retail stores operating in all 50 United States. Responses were elicited from these executives
regarding 22 specific promotional programs used in retail stores. These programs were:
• Chain-wide Sweepstakes
• Co-op Radio Advertising
• Co-op Television Advertising
• Frequent Shopper Programs
• In-Ad Coupons
• In-Store Advertising
• In-Store Coupons
• In-Store Demos and Sampling
• Instant Redeemable Coupons
• Internet Programs
• Manufacturer Purchased
Display Space
• Manufacturer Shelf Talkers
• National Sweepstakes
• Near Pack Offers
• Paperless Coupons
• Premium Giveaways
• Promotion Tied to a Local
Organization or Charity
• Retailer Cross-Ruff
• Retailer Shelf Talkers
• Shipper Displays
• Targeted Direct Mail
• Tear Pads
Specifically, executives answered questions concerning the use, effectiveness, and support of these
promotional tools. The goal of this survey, then, was threefold:
1. Identify current retail practices in terms of promotion.
2. Evaluate the various forms of promotions for their ability to affect product movement
and overall store sales.
3. Identify the promotional programs that retailers would like see receive increased
support.
In general, the survey could be described as an inquiry into what programs are being used, which ones
work, and which ones retailers would like to see increased in the future? Surprisingly, the answers to
these three questions may be quite different. A comparison of these answers then, will provide
valuable insights into retail promotional preferences.
To this end, a mail survey, dubbed the Promotional Preference Survey, was conducted from January
to June 1998. The survey was prefaced by personal interviews with various retail executives to
develop a meaningful line of questions. After pretesting with those executives, the resulting survey
was distributed to Cornell’s own proprietary list of retail executives. A copy of the Promotional

the promotional preference survey � 3
Preference Survey is exhibited in Appendix A. Further discussions with industry executives
provided additional insights and validation of the survey results. Obviously, this report owes its
success to the generous time spent by these various retail executives at all stages of the survey
process.
In the course of preparing this survey, it became evident that familiarity with the terminology
involved with promotional use can vary from one retailer to the next. Furthermore, the meaning of
some terms may be situational. Thus, executives who responded to the Promotional Preference
Survey were also presented with a glossary of terms, defining the 22 promotional programs. That
glossary is presented in Appendix B.

survey results � 4
survey results This section presents the general results of the Promotional Preference Survey. The interested reader
is referred to Appendix C for more detailed results. A word of caution – by no means are these
results meant to quantify the performance of one promotional tool over another, or one store format
over another. Rather, these results offer trends and insights that are crucial to understanding the way
retail executives value the promotional programs offered by their manufacturer partners. The results
of the survey will be presented topically, with the responses from all executives presented first and
any prominent differences across channels of trade presented second.
Current Status
In general, strong support was indicated for increased spending on account specific promotion and co-
marketing by manufacturers. On a five-point scale (1=do not support, 5=extremely supportive),
respondents across all retail formats indicated an average score of 4.4. Drug store executives
seemingly led this charge with an average score of 5.0. Meanwhile wholesale grocery executives
were less enthusiastic in their response with an average score of 3.8.
The top ten most commonly used promotional programs are exhibited in figure 1. The most prevalent
programs used in retail stores are shipper displays and in-store demonstrations and sampling, with
94% of executives indicating their companies use these programs. These were closely followed by
promotions tied to local charities, with 91% of executives indicating their companies use this
program. Eighty-nine percent of respondents indicated their companies use co-op radio advertising,
in-store coupons, retail generated shelf talkers, and targeted direct mail. Further, 83% indicated their
companies use in-store advertising, and 74% use in-ad coupons and tear pads. Looking toward the
bottom of the list, we find a discrepancy among channels of trade. Overall, national sweepstakes are
little used by the retailers in this survey. However, discount drug stores did not always follow this
pattern. More so than their counterparts in other channels of trade, drug store executives indicated that
74%
74%
83%
91%
94%
94%
89%
89%
89%
89%
50% 60% 70% 80% 90% 100%
Tear Pads
In-Ad Coupons
In-Store Advertising
Targeted Direct Mail
Retailer Shelf Talkers
In-Store Coupons
Co-op Radio Advertising
Promotions for Local Charities
Shipper Displays
In-Store Demos and Sampling
Percent of Repspondents
Figure 1. Respondents reporting program use in their company’s stores.
In-store demonstrations and sampling as well as shipper displays were the most commonly reported programs in use by retail stores.
Not shown here, manufacturer shelf talkers and national sweepstakes were the least commonly used programs by the group as a whole.

survey results � 5
their stores commonly use both chain-wide and national sweepstakes.
Program Effectiveness
Product Movement
Respondents were asked to evaluate the promotional programs in terms of their ability to move
product. Each promotional program was rated on a five-point scale where 1=ineffective, and 5=
extremely effective. The top ten programs rated in terms of product movement are shown in figure 2.
Two programs, shipper displays and targeted direct mail, tied for the top rating, each with an average
score of 4.1. Frequent shopper programs and in-store demonstrations and sampling follow closely,
each with an average score of 4.0. Next were paperless coupons and retail shelf talkers (each with an
average score of 3.9) followed by various methods of couponing. Discount drug stores, once again,
prove to be an exception. Not only were discount drug and mass merchandise executives less
enthusiastic about paperless couponing, but drug store executives in particular failed to respond to
this question. Drug store companies appear to lack experience with paperless couponing.
Asking respondents to indicate the top three most effective programs in terms of their ability to move
product further refined these results. More than any other program, 64% of respondents placed in-ad
or in-store coupons among the top three most effective programs. Shipper displays and retailer shelf
talkers placed next with 38% and 34% of respondents indicating these programs respectively. In
relation to the group as a whole, mass merchandisers prized more the use of targeted direct mail, and
drug store executives were more favorable toward instant redeemable coupons.
Overall Store Sales
Ineffective
3.5
3.6
4.0
4.1
4.1
3.7
3.7
3.9
3.9
4.0
1 2 3 4 5
Instant Redeemable Coupons
In-Store Coupons
In-Ad Coupons
Purchased Display Space
Retailer Shelf Talkers
Paperless Coupons
In-Store Demos and Sampling
Frequent Shopper Programs
Shipper Displays
Targeted Direct Mail
Extremely EffectiveMean Response
Figure 2. Rating programs for their ability to increase product movement.
Targeted direct mail and shipper displays topped the list of promotional programs rated for their ability to move product.
These programs are grouped in a narrow range of scores, however, when respondents were forced to choose the top three most effective programs, the use of in-ad or in-store coupons was listed far more than any other program.
Shipper displays and retailer shelf talkers followed to round out the top three.

survey results � 6
In terms of a program’s ability to increase overall store sales, the top rated programs are listed in
figure 3. Executive respondents rated these programs on a five-point scale, where 1=ineffective at
increasing overall store sales and 5=extremely effective at increasing overall store sales. The top rated
program in this regard was targeted direct mail with an average score of 4.2. Frequent shopper
programs, in-store demonstrations and sampling, and retailer shelf talkers followed with average
scores of 4.0, 3.9, and 3.9 respectively. There was general agreement by executives from all channels
of trade concerning the programs that comprise the top ten. However, we found that mass
merchandise executives rated shipper displays (ranked fifth overall) as their top rated program. Other
programs were not numbered among the top ten rated programs, and yet were given a high rating by
executives in specific channels. For example, in-store advertising was rated very high by mass
merchandisers (who gave it a score of 4.5) compared to the rating from all executives (a combined
score of 2.8). Similar results were seen for instant redeemable coupons (given a high rating by
discount drug and mass merchandise executives) and premium giveaways (given a high rating by
drug store executives).
Asking executives to indicate which programs comprise the top three in terms of increasing overall
store sales further refines these results. Once again, the use of in-ad or in-store coupons clearly rose to
the top of the list. Frequent shopper programs and targeted direct mail followed. The responses from
mass merchandise executives differed from these overall results in that they also showed strong
support for co-op radio advertising.
Retail Support
Ineffective
3.4
3.5
3.6
3.6
3.7
3.7
4.0
4.2
3.9
3.9
1 2 3 4 5
Co-op TV Advertising
Co-op Radio Advertising
Shipper Displays
In-Store Coupons
In-Ad Coupons
Paperless Coupons
In-Store Demos and Sampling
RetailerShelf Talkers
Frequent Shopper Programs
Targeted Direct Mail
Extremely EffectiveMean Response
Figure 3. Rating programs for their ability to increase overall store sales.
Once again, targeted direct mail topped the list of promotional programs rated for their ability to increase overall store sales.
As with the previous question, when respondents were forced to choose the top three most effective programs, the use of in-ad or in-store coupons was chosen more than any other program.
Frequent shopper programs and targeted direct mail followed to round out the top three.

survey results � 7
Retail executives also indicated which three programs were most likely to obtain a retailer’s display
support (figure 4). There was general agreement across all executives that in-ad or in-store coupons,
manufacturer purchased display space, and shipper displays comprised the top three programs most
likely to obtain display support. Mass merchandisers were the exception to the rule, however – these
executives placed a greater emphasis on co-op radio and television advertising.
Respondents indicated the programs for which they would negotiate increased funding (figure 5).
There was a general consensus on the subject with targeted direct mail receiving the most votes for
increased funding. Eighty-nine percent of executives indicated they would negotiate increasing funds
for this program. This was followed by in-store demonstrations and sampling with 87% of executives
indicating they would negotiate to increase funds for this activity. Meanwhile, 70% of executives
indicated they would negotiate to increase funds for each co-op radio advertising and shipper
displays. Frequent shopper programs rounded out the top five with 68% of executives voting to
13%
49%
46%
35%
16%
9%
18%
18%
29%
33%
0% 10% 20% 30% 40% 50% 60%
Retailer Shelf Talkers
Chain-w ide Sw eepstakes
Targeted Direct Mail
Frequent Shopper Programs
Co-op Radio Advertising
Co-p TV Advertising
In-Store Demos and Sampling
Shipper Displays
Purchased Display Space
In-Ad or In-Store Coupons
Percent of Repspondents Placing Among Top 3
Figure 4. Top three promotional programs most likely to obtain display support.
Aside from rating programs based on their effectiveness, respondents were asked to give an indication of which programs are the most likely to obtain a retailer’s display support.
Each respondent listed the top three programs in this regard. For the programs presented at left, we show the percentage of respondents who placed that particular program among the top three.
In-ad or in-store coupons placed first followed by manufacturer purchased display space and shipper displays.
4%
70%
70%
89%
87%
68%
23%
26%
15%
15%
0% 10% 20% 30% 40% 50% 60% 70% 80% 90% 100%
National Sw eepstakes
Tear Pads
Premium Giveaw ays
Manufacturer Shelf Talkers
Near Pack Offers
Frequent Shopper Programs
Shipper Displays
Co-op Radio Advertising
In-Store Demos and Sampling
Targeted Direct Mail
Percent of Repspondents
Figure 5. I would negotiate to increase this program’s funding.
Perhaps the bottom line is – which programs would retailers like to see receive additional resources?
We asked retail executives to tell us the programs for which they would negotiate increased funding. Both the top and bottom five responses are shown here.
Targeted direct mail came out on top followed closely by in-store demos and sampling. Meanwhile, national sweepstakes received little attention.

survey results � 8
increase funds for this program. Once again, discount drug store executives showed slightly different
priorities, as evidenced by their strong support for near pack offers and premium giveaways – both
were found among the bottom five programs based on the average response of all retailers.
For selected activities, respondents were asked to indicate the parties responsible for performing that
activity, as well as the parties who generally fund these activities (table 1). For in-store
demonstrations and sampling, retailers, manufacturers, and other third parties all seem to participate
in the performance of these activities, while manufacturers provide the bulk of funds. Retailers play
the lead role in performing and funding in-store signage. Manufacturers play the lead role in
performing and funding instant redeemable coupon stickering. Retailers and manufacturers both play
a role in conducting local promotional events, with retailers taking a slightly larger role in the
performance of these events and manufacturers providing slightly more funds. Finally, manufacturers
play the major role in the use of manufacturer shelf talkers and tear pads, and retailers play the major
role in the use of retailer shelf talkers.

survey results � 9
Table 1. Funding and Performance of Selected Activities
Program Who Pays? Who Performs?
In-Store Demonstrations and Sampling
Retailer 11%
Manufacturer 89%
Other 0%
Split between the three groups.
In-Store Signage
Retailer 84%
Manufacturer 16%
Other 0%
The retailer, by far.
Instant Redeemable Coupon Stickering
Retailer 6%
Manufacturer 92%
Other 2%
Primarily the manufacturer.
Local Promotional Events
Retailer 44%
Manufacturer 54%
Other 1%
The retailer and manufacturer, in a
2:1 ratio.
Manufacturer Shelf Talkers
Retailer 7%
Manufacturer 89%
Other 3%
Primarily the manufacturer.
Retailer Shelf Talkers
Retailer 86%
Manufacturer 14%
Other 0%
Primarily the retailer.
Tear Pads
Retailer 6%
Manufacturer 93%
Other 1%
Primarily the manufacturer.

the big picture � 10
the big picture
General Comments on Results
Now that the results of the Promotional Preference Survey have all been presented, its time to take a
step back and look at the big picture. Table 2 provides a summary of the overall results. This table
summarizes the rankings of the various promotions in regards to use, effectiveness, and retail support.
Just a brief glance at the table is required to identify those programs that are valued by retail
executives. Clearly, targeted direct mail, shipper displays, and coupon use in general stand out from
other promotional programs in the minds of retail executives as valued promotional programs.
The promotions that stand out in this survey tend to build and strengthen ties between retailer and
customer. Retailers want more than to sell product – they want to bring customers into their stores
week after week to do their shopping. Not surprisingly, customers are a central part of the
promotional philosophy expressed by retailers. In general, the programs being used and supported by
the retail executives in this survey share a common theme: customer relationships. In the course of
our survey a number of retailers commented to this point.
“We need to convert monies available to go directly to the customer in order to generate store traffic.”
“The canned programs do very little to allow a retailer to differentiate itself from all other competitors.”
“Customers are looking for value. We have to make it easy for them to achieve the value on savings.”
“Sweepstakes are nice, but most customers don’t see a value. Keep the customer in mind.”
“Keep the customer in mind” seems to be an appropriate motto to retailers who don’t particularly care
about what specific products their customers buy compared to how much they buy. Further, they are
seeking to become the primary shopping destination for their customers. They are seeking to
differentiate themselves from competitors across all channels of trade. And so, retailers are
increasingly seeking a customized approach to promotion from their manufacturing partners. As one
retailer said, “Promotions need to be channel and chain specific.” Thus, retailers report a high level of
support for increased spending on account specific marketing.

the big picture � 11
Table 2. Getting the Big Picture – A Look at the Overall Results
Program Characteristics
Promotional Program C
omm
only
Use
d
Effe
ctiv
e at
P
rodu
ct
Mov
emen
t
Pro
duct
M
ovem
ent
Top
3
Effe
ctiv
e at
In
crea
sing
Sto
re
Sal
es
Incr
easi
ng S
tore
S
ales
T
op 3
Like
ly to
Obt
ain
Dis
play
Sup
port
Wou
ld N
egot
iate
to
Incr
ease
F
unds
Chain-wide Sweepstakes + +
Co-op Radio + + + + + + + +
Co-op Television + + + + + + +
Frequent Shopper Programs + + + + + + + + + +
In-Ad Coupons + + + + + + + + + + + + +
In-Store Advertising +
In-Store Coupons + + + + + + + + + + + + + +
In-Store Demos/Sampling + + + + + + + + + + + +
Instant Redeemable Coupon (IRC) Stickers + + +
Internet Programs +
Manufacturer Purchased Display Space + + + +
Manufacturer Shelf Talkers
National Sweepstakes
Near Pack Offers
Paperless Coupons + + + + + + + +
Premium Giveaways
Promotion Tied to Local Charity + +
Retailer Cross-Ruff
Retailer Shelf Talkers + + + + + + + + + + +
Shipper Displays + + + + + + + + + + + + + + +
Targeted Direct Mail + + + + + + + + + + + + + + + +
Tear Pads +
KEY: + Placed in the top 10. + + Placed in the top 5. + + + Placed first.

the big picture � 12
A Realistic Look at Effective Promotions
The Promotional Preference Survey elicited responses on the “effectiveness” of the various
promotional tools. Our measure of effectiveness then, does not involve a comparison of actual sales
or profitability, but the opinion of retail executives. As such, it is not meant to provide a comparative
evaluation of promotional programs as much as it describes the retailers who use them. In addition,
what retail executives report as “effective” may not correspond to what they use, or where they want
to devote future resources.
Effectiveness vs. Use
Retailers may use various promotional programs even though the promotions do little to improve
sales or traffic. There is evidence from this survey that promotions tied to local organizations and
charities fall into this category. While a promotion that ties in with local charities is the third most
commonly used promotion of the 22 included in this survey, retailers rate this promotion relatively
low in terms of its effectiveness in either increasing either individual product movement or in
increasing overall store sales. Tear pads and in-store advertising have similar characteristics – they
are commonly used, but retailers are reluctant to provide in-store support for these programs.
However, the reasons retailers use these programs in spite of their lack of effectiveness differ.
Retailers use charitable promotions to play the role of a good citizen and participate in the affairs of
the communities in which they operate. In-store advertising is used as an additional source of
revenue. Further, tear pads are often allowed as a service or convenience to customers.
It is also important to note that some programs are rated relatively high in terms of performance, and
yet are not commonly used. Paperless couponing and frequent shopper programs are chief among
programs of this type. It should be noted however, that retailers were relatively supportive of
increasing funds for these programs. In this regard, paperless coupons and frequent shopper programs
represent growing opportunities for co-marketing activities among retailers and manufacturers.
Effectiveness vs. Desired Funding
In-ad and in-store coupons were rated relatively high in terms of their performance, and yet retail
executives did not show the same level of interest for increasing funds for these programs. Apparently
retailers are comfortable administering these programs on their own. On the other hand, retailers
showed interest in one program with seemingly sub-par performance, namely, internet programs.
While this relatively new form of marketing has yet to be proven or tested, it is generating interest
among retail executives who would like to explore its potential.
Comments on Specific Promotional Programs
Chain-Wide Sweepstakes
While receiving a moderate rating in terms of ability to increase overall store sales or obtaining a
retailer’s support, chain-wide sweepstakes were rated relatively low in all other categories. The

the big picture � 13
concern, as one retailer stated, is that the sweepstake needs to reward the shoppers in each store. In
other words, a retailer with multiple stores wants a sweepstake that awards shoppers in each store.
Co-op Radio Advertising
Retailers suggested this commonly used program is effective at increasing overall store sales. Further,
they showed interest in supporting this type of promotion n their stores.
Co-op Television Advertising
Similar to co-op radio advertising, retailers also indicated that this program is somewhat effective at
product movement.
Frequent Shopper Programs
This program compared favorably to others in terms of its ability to increase product movement or
overall store sales. Also retailers are favorable to supporting this promotion, which is reportedly used
by 62% of all retailers. Frequent shopper programs, therefore, represent an attractive promotional
opportunity for the future.
In-Ad and In-Store Coupons
These programs are solid performers and rate very favorably with retail executives. In retailers’ eyes,
they could easily be placed in the top five promotions overall.
In-Store Advertising
In-store advertising is commonly used although it rates relatively low in terms of increasing overall
store sales. So why do retailers use this type of promotion? It can generate revenue from otherwise
unusable store space (e.g. shopping carts or uniforms).
In-Store Demos and Sampling
This continues to be a very commonly used promotion that is also viewed as a good performer. There
are no indications that use of in-store demonstrations and sampling will lessen. Often, retail
excitement can be generated with such a tactic. Even so, retailers have expressed concern that the
benefits to the manufacturer may exceed those to the retailer. While demonstrations and sampling
may affect sales of an individual product, retailers recognize that it is not a promotion that will bring
customers into the store and keep them coming back.
Instant Redeemable Coupons (IRCs)
While this promotion is somewhat effective at moving product, it was not rated high overall. Even so,
retail executives indicated some interest in more funding for instant redeemable coupons. As one
retailer pointed out, the use of this type of promotion is often at the discretion of the manufacturer,
giving retailers little control over this promotional activity.

the big picture � 14
Internet Programs
Although retailers rated this one of the least effective performers overall, internet programs represent
potentially new and innovative marketing techniques. As such, retail executives expressed some
interest for increased funding of these types of promotions.
Manufacturer Purchased Display Space
Basically, retailers felt this was an effective means of moving product, but little else. And yet a
manufacturer would be very likely to obtain a retailer’s support when purchasing display space.
Again, retailers are mindful that a profitable store takes advantage of revenue-generating activities
beyond the customer.
Manufacturer Shelf Talkers, National Sweepstakes, Near Pack Offers, Premium Giveaways, and Retailer Cross-Ruff
Overall, these programs have the unfortunate distinction of being the least attractive promotional
programs studied in this survey. Aside from their effectiveness (or lack thereof), they may represent
awkward promotional logistics for the retailer, or fail to provide enough of a value to the retailer’s
immediate customers.
Paperless Coupons
Paperless coupons appear to be an up-and-coming type of promotion. Retailers gave it good ratings
overall. Further, with the potential connections to internet programs or frequent shopper programs,
paperless coupons could be an increasingly attractive promotional tool.
Promotion Tied to Local Organization or Charity
Although promotions for charitable organizations received low marks overall, they are a commonly
used form of promotion. Retailers will continue to use this type of promotion as they seek to develop
and maintain a community presence. For retailers, this is purely an investment in customer
relationships.
Retailer Shelf Talkers
Retailer generated shelf talkers received solid marks overall. As opposed to manufacturer generated
shelf talkers, these provide the retailer a consistent appearance throughout the store and the flexibility
to adapt promotions to individual stores.

the big picture � 15
Shipper Displays
Shipper displays are an extremely high-performing promotion according to the retailers responding to
this survey. Further, larger chains are likely to reap the most benefits from shipper displays as they
develop the ability to cross-dock ready-made displays.
Targeted Direct Mail
Perhaps the number one promotion overall, targeted direct mail is an activity that recognizes the
importance of the customer. It is a way in which the retailer may truly “keep the customer in mind.”
Tear Pads
Other than being a commonly used program, retailers showed little enthusiasm for tear pads. The use
of tear pads is presumably an easy way for retailers to provide service and opportunities for their
customers, and yet retailers indicate that this promotion contributes little to increasing store sales.
Comments on Specific Channels of Trade
If we could develop a spectrum of retailer promotional preferences and behavior, perhaps
supermarkets would be at one end, with discount drug stores at the opposite end of the spectrum.
Meanwhile grocery wholesalers and mass merchandisers would fall somewhere in-between. The
differences may stem from the product mix offered in each channel of trade. Thus, supermarkets,
which heavily concentrate on food items benefit greatly from in-store demonstrations and sampling –
it’s an enjoyable sensory process that allows consumers to easily evaluate the product quality.
Obviously, that would not work as well in a drug store. Furthermore differences may exist in
consumer shopping habits among the various retail channels. Consumers go to drugstores with
completely different objectives and expectations that when they go to the supermarket. Although
consumers may shop the supermarket a few times each week, visits may be spaced differently for
mass merchandisers or drug stores. Such differences only highlight the fact that manufacturers must
treat each retailer differently, and tailor retail promotions to the needs and situation of the retailer.
Concluding Remarks
Of the twenty-two promotional programs that retail executives were asked to evaluate regarding use,
effectiveness (to increase product movement or overall store sales), and support, ten consistently rose
to the top of the list. Likewise, there were another ten that were consistently perceived as average or
below average promotional programs. Each group is listed alphabetically below.

the big picture � 16
Shining Promotions
• Co-op Radio
• Co-op Television
• Frequent Shopper Programs
• In-Ad Coupons
• In-Store Coupons
• In-Store Demos and Sampling
• Paperless Coupons
• Retail Shelf Talkers
• Shipper Displays
• Targeted Direct Mail
Lackluster Promotions
• Chain-Wide Sweepstakes
• In-Store Advertising
• Internet Programs
• Manufacturer Shelf Talkers
• National Sweepstakes
• Near Pack Offers
• Premium Giveaways
• Promotions Tied to Local Charities
• Retailer Cross-Ruff
• Tear Pads
It is important to note that the frequency of use does not necessarily relate to the retailer’s evaluation
of the promotion’s effectiveness in moving product or in increasing overall store sales. It must be
assumed that these are promotions that are frequently offered, are easy to implement, and match the
company’s promotional strategy.
Another significant note: the promotional program that was identified as the least effective of all
twenty-two promotions by executives from all three retail groups was national sweepstakes.
Perhaps the bottom line is to ask, “where should the money go?” And so, we asked retail executives
“which programs would you negotiate to increase (or decrease) funding?” The following were
identified as the top five promotions for which retail executives would try to negotiate a funding
increase:
• Targeted Direct Mail
• In-Store Demos and Sampling
• Shipper Displays
• Co-op Radio
• Frequent Shopper Programs
Consistent with previous results, we can see that the ratings reflect the buyer’s beliefs regarding the
effectiveness of the promotions as well as the ease with which the promotion can be implemented.
This choice is also an indication of the trends in marketing strategy now being employed by leading
retail firms.

appendix a � 17
appendix a
The Promotional Preference Survey

appendix a � 18

appendix a � 19

appendix a � 20

appendix b � 21
appendix b
A Glossary of Terms

appendix b � 22
Chain-wide sweepstakes – a sweepstakes promotion offered in all stores through a retail chain.
Co-op media – promotional advertising for a manufacturer’s product that appears on a retailer’s television or radio ad and is funded by the manufacturer.
Frequent shopper programs – the support by manufacturers of promotions offered by the retailer through its loyalty card program (i.e., discounts - paperless coupons, etc.)
In-ad coupons – coupons for manufacturers’ products that appear in the print ad of one retail company and are redeemable only through that one company.
In-store advertising – point of sale advertising in the retail store; on shopping carts, aisle markers, in-store radio or TV, etc.
In-store coupons – coupons that are distributed in the retail store.
In-store demos/sampling – the sampling of products in the retail store.
Instant redeemable coupons (IRC) – coupons that are attached to products in the retail store.
Internet programs – promotional programs that are offered to consumers through the retailer’s web page.
Manufacturer purchased display space – special displays that are built in the retail store in space that is paid for by the manufacturer.
National sweepstakes – a sweepstakes promotion advertised and promoted by a national organization and available through various types of retail stores throughout the country.
Near pack offers – premiums that are offered by manufacturers as an incentive for purchasing a product and are available in the store.
Paperless coupons – coupons that are made available to consumers through a frequent shopper program or some type of card marketing program.
Premium giveaways – any promotion that offers a premium to consumers as an incentive for purchase a product, often a mail-in offer. This promotion can also be one that offers a premium to a store or department manager.
Promotion tied to local organization or charity – a special promotion where the retailer and manufacturer agree to contribute a portion of the sales to a local group.
Retailer cross-ruff – promotions or coupons delivered on one product (national brand) that are good on another product (retailer brand).
Shelf talkers – point-of-sale signage designed to hang over the edge of a shelf and deliver a promotional message. They may be produced by the retailer (usually price oriented) or by the manufacturer (usually product oriented).
Shipper displays – product that arrives at the store in its own display unit.
Targeted direct mail – promotional mailings sent to specific customers or a retail store encouraging the purchase of a specific product or brand.
Tear pads – promotional information in the form of a tear pad that is posted in the store - either by the product or at a central location such as a bulletin board.

appendix c � 23
appendix c
Detailed Survey Responses

appendix c � 24
Question 1A – Does your company use this program in your stores?
Channel of Trade
Supermarket
Promotional Program Self
Distributed Wholesale Distributed
All Supermarket
Wholesale Grocery
Discount Drug
Mass Merchandise
All Responses
% indicating “yes”
Chain-wide Sweepstakes 64% 38% 58% 67% 100% 67% 62%
Co-op Radio 100% 78% 95% 75% 67% 67% 89%
Co-op Television 82% 44% 73% 75% 67% 33% 70%
Frequent Shopper Programs
71% 56% 68% 50% 33% 33% 62%
In-Ad Coupons 64% 89% 70% 75% 100% 100% 74%
In-Store Advertising 89% 67% 84% 75% 67% 100% 83%
In-Store Coupons 89% 88% 89% 100% 67% 100% 89%
In-Store Demos/Sampling
96% 89% 95% 75% 100% 100% 94%
Instant Redeemable Coupon (IRC) Stickers
75% 67% 73% 75% 67% 67% 72%
Internet Programs 75% 38% 67% 33% 100% 100% 69%
Manufacturer Purchased Display Space
79% 56% 73% 75% 33% 67% 70%
Manufacturer Shelf Talkers
36% 63% 42% 67% 33% 33% 42%
National Sweepstakes 43% 38% 42% 50% 100% 33% 45%
Near Pack Offers 75% 56% 70% 50% 67% 33% 66%
Paperless Coupons 61% 56% 59% 25% 0% 0% 49%
Premium Giveaways 59% 50% 57% 75% 67% 67% 60%
Promotion Tied to Local Organization or Charity
96% 78% 92% 75% 100% 100% 91%
Retailer Cross-Ruff 52% 17% 45% 33% 67% 67% 48%
Retailer Shelf Talkers 93% 89% 92% 75% 100% 67% 89%
Shipper Displays 100% 78% 95% 75% 100% 100% 94%
Targeted Direct Mail 89% 75% 86% 100% 100% 100% 89%
Tear Pads 86% 67% 81% 25% 33% 100% 74%
appendix c � 25
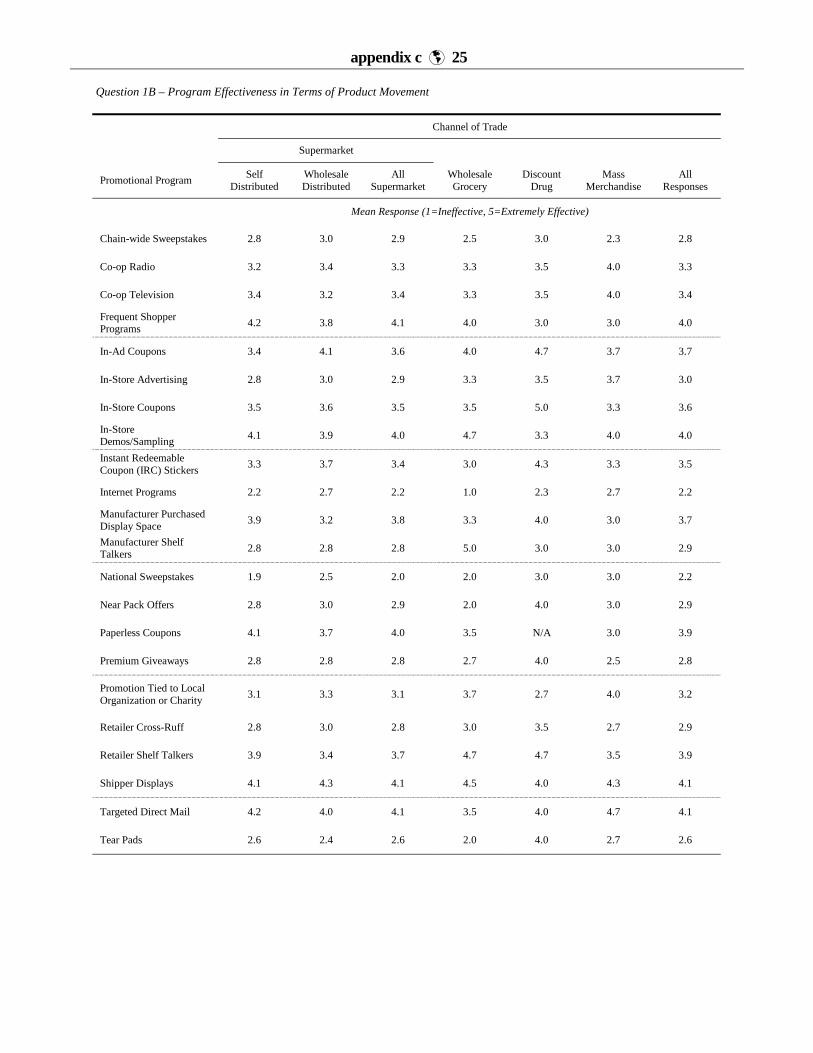
Question 1B – Program Effectiveness in Terms of Product Movement
Channel of Trade
Supermarket
Promotional Program Self
Distributed Wholesale Distributed
All Supermarket
Wholesale Grocery
Discount Drug
Mass Merchandise
All Responses
Mean Response (1=Ineffective, 5=Extremely Effective)
Chain-wide Sweepstakes 2.8 3.0 2.9 2.5 3.0 2.3 2.8
Co-op Radio 3.2 3.4 3.3 3.3 3.5 4.0 3.3
Co-op Television 3.4 3.2 3.4 3.3 3.5 4.0 3.4
Frequent Shopper Programs
4.2 3.8 4.1 4.0 3.0 3.0 4.0
In-Ad Coupons 3.4 4.1 3.6 4.0 4.7 3.7 3.7
In-Store Advertising 2.8 3.0 2.9 3.3 3.5 3.7 3.0
In-Store Coupons 3.5 3.6 3.5 3.5 5.0 3.3 3.6
In-Store Demos/Sampling
4.1 3.9 4.0 4.7 3.3 4.0 4.0
Instant Redeemable Coupon (IRC) Stickers
3.3 3.7 3.4 3.0 4.3 3.3 3.5
Internet Programs 2.2 2.7 2.2 1.0 2.3 2.7 2.2
Manufacturer Purchased Display Space
3.9 3.2 3.8 3.3 4.0 3.0 3.7
Manufacturer Shelf Talkers
2.8 2.8 2.8 5.0 3.0 3.0 2.9
National Sweepstakes 1.9 2.5 2.0 2.0 3.0 3.0 2.2
Near Pack Offers 2.8 3.0 2.9 2.0 4.0 3.0 2.9
Paperless Coupons 4.1 3.7 4.0 3.5 N/A 3.0 3.9
Premium Giveaways 2.8 2.8 2.8 2.7 4.0 2.5 2.8
Promotion Tied to Local Organization or Charity
3.1 3.3 3.1 3.7 2.7 4.0 3.2
Retailer Cross-Ruff 2.8 3.0 2.8 3.0 3.5 2.7 2.9
Retailer Shelf Talkers 3.9 3.4 3.7 4.7 4.7 3.5 3.9
Shipper Displays 4.1 4.3 4.1 4.5 4.0 4.3 4.1
Targeted Direct Mail 4.2 4.0 4.1 3.5 4.0 4.7 4.1
Tear Pads 2.6 2.4 2.6 2.0 4.0 2.7 2.6

appendix c � 26
Question 2 – Indication of Top 3 Most Effective Programs in Terms of Product Movement
Channel of Trade
Supermarket
Promotional Program Self
Distributed Wholesale Distributed
All Supermarket
Wholesale Grocery
Discount Drug
Mass Merchandise
All Responses
% of respondents placing among the top 3
Chain-wide Sweepstakes 11% 11% 11% 0% 33% 0% 11%
Co-op Radio 7% 0% 5% 0% 0% 33% 6%
Co-op Television 21% 11% 19% 0% 0% 33% 17%
Frequent Shopper Programs
21% 22% 22% 11% 0% 0% 19%
In-Ad Coupons or In-Store Coupons
47% 100% 60% 33% 100% 67% 64%
In-Store Advertising 0% 0% 0% 0% 0% 0% 0%
In-Store Demos/Sampling
29% 22% 27% 22% 0% 33% 28%
Instant Redeemable Coupon (IRC) Stickers
11% 11% 11% 0% 67% 0% 13%
Internet Programs 0% 0% 0% 0% 0% 0% 0%
Manufacturer Purchased Display Space
14% 11% 14% 0% 0% 0% 11%
Manufacturer Shelf Talkers
0% 0% 0% 11% 0% 0% 2%
National Sweepstakes 0% 0% 0% 0% 33% 0% 2%
Near Pack Offers 0% 0% 0% 0% 0% 0% 0%
Paperless Coupons 29% 11% 24% 0% 0% 0% 19%
Premium Giveaways 0% 0% 0% 11% 0% 0% 2%
Promotion Tied to Local Organization or Charity
0% 0% 0% 0% 0% 0% 0%
Retailer Cross-Ruff 4% 0% 3% 0% 0% 0% 2%
Retailer Shelf Talkers 36% 22% 32% 33% 33% 0% 34%
Shipper Displays 39% 44% 41% 11% 33% 33% 38%
Targeted Direct Mail 32% 22% 30% 0% 0% 100% 30%
Tear Pads 0% 0% 0% 0% 0% 0% 0%

appendix c � 27
Question 3 – Indication of Top 3 Programs Most Likely to Obtain Retailer Display Support
Channel of Trade
Supermarket
Promotional Program Self
Distributed Wholesale Distributed
All Supermarket
Wholesale Grocery
Discount Drug
Mass Merchandise
All Responses
% of respondents placing among the top 3
Chain-wide Sweepstakes 11% 11% 11% 0% 33% 33% 13%
Co-op Radio 14% 11% 14% 0% 0% 100% 18%
Co-op Television 36% 11% 30% 0% 0% 67% 29%
Frequent Shopper Programs
18% 22% 19% 25% 0% 0% 18%
In-Ad Coupons or In-Store Coupons
40% 33% 38% 100% 100% 33% 49%
In-Store Advertising 0% 0% 0% 0% 0% 0% 0%
In-Store Demos/Sampling
29% 33% 30% 75% 0% 33% 33%
Instant Redeemable Coupon (IRC) Stickers
0% 22% 5% 0% 0% 0% 4%
Internet Programs 0% 0% 0% 0% 0% 0% 0%
Manufacturer Purchased Display Space
54% 33% 49% 50% 33% 0% 46%
Manufacturer Shelf Talkers
0% 11% 3% 0% 33% 0% 4%
National Sweepstakes 0% 0% 0% 0% 33% 0% 2%
Near Pack Offers 7% 0% 5% 0% 0% 0% 4%
Paperless Coupons 14% 0% 11% 0% 0% 0% 9%
Premium Giveaways 4% 0% 3% 0% 0% 0% 2%
Promotion Tied to Local Organization or Charity
7% 0% 5% 0% 33% 0% 7%
Retailer Cross-Ruff 0% 0% 0% 0% 0% 0% 0%
Retailer Shelf Talkers 7% 11% 8% 25% 0% 0% 9%
Shipper Displays 36% 44% 38% 25% 33% 0% 35%
Targeted Direct Mail 11% 33% 16% 0% 0% 33% 16%
Tear Pads 0% 11% 3% 0% 0% 0% 2%

appendix c � 28
Question 4 – General Support of Increased Spending on Account Specific Marketing
Channel of Trade Level of Support
(1=do not support, 5=extremely supportive)
Supermarkets
Self Distributed 4.4
Wholesale Distributed 4.1
All Supermarkets 4.4
Wholesale Grocery 3.8
Drug Stores 5.0
Mass Merchandisers 4.3
All Responses 4.4

appendix c � 29
Question 5A – Percent of Respondents Who Would Negotiate for Decreased Funding
Channel of Trade
Supermarket
Promotional Program Self
Distributed Wholesale Distributed
All Supermarket
Wholesale Grocery
Discount Drug
Mass Merchandise
All Responses
% who indicated they would negotiate to decrease funding
Chain-wide Sweepstakes 61% 33% 54% 50% 67% 33% 53%
Co-op Radio 14% 0% 11% 25% 33% 0% 13%
Co-op Television 21% 11% 19% 50% 33% 0% 21%
Frequent Shopper Programs
11% 0% 8% 25% 0% 33% 11%
In-Store Advertising 50% 33% 46% 25% 33% 0% 40%
In-Ad Coupons 50% 0% 38% 0% 0% 33% 32%
In-Store Coupons 39% 0% 30% 0% 33% 33% 28%
In-Store Demos/Sampling
4% 0% 3% 0% 0% 0% 2%
Instant Redeemable Coupon (IRC) Stickers
32% 0% 24% 25% 0% 0% 21%
Internet Programs 14% 0% 11% 25% 0% 0% 11%
Manufacturer Purchased Display Space
25% 11% 22% 0% 33% 67% 23%
Manufacturer Shelf Talkers
64% 22% 54% 25% 67% 33% 51%
National Sweepstakes 75% 56% 70% 75% 33% 100% 70%
Near Pack Offers 54% 44% 51% 50% 0% 33% 47%
Paperless Coupons 18% 11% 16% 25% 0% 33% 17%
Premium Giveaways 64% 33% 57% 75% 0% 100% 57%
Promotion Tied to Local Organization or Charity
25% 33% 27% 0% 33% 0% 23%
Retailer Cross-Ruff 46% 11% 38% 50% 33% 33% 38%
Retailer Shelf Talkers 14% 11% 14% 0% 33% 0% 13%
Shipper Displays 14% 0% 11% 0% 33% 0% 11%
Targeted Direct Mail 4% 0% 3% 0% 0% 0% 2%
Tear Pads 64% 22% 54% 50% 67% 33% 53%

appendix c � 30
Question 5A – Percent of Respondents Who would Negotiate for Increased Funding
Channel of Trade
Supermarket
Promotional Program Self
Distributed Wholesale Distributed
All Supermarket
Wholesale Grocery
Discount Drug
Mass Merchandise
All Responses
% who indicated they would negotiate to increase funding
Chain-wide Sweepstakes 21% 22% 22% 25% 33% 67% 26%
Co-op Radio 79% 56% 73% 50% 33% 100% 70%
Co-op Television 75% 56% 70% 50% 33% 67% 66%
Frequent Shopper Programs
71% 67% 70% 75% 67% 33% 68%
In-Ad Coupons 29% 78% 41% 100% 100% 67% 51%
In-Store Advertising 25% 11% 22% 50% 0% 67% 26%
In-Store Coupons 39% 67% 46% 100% 67% 33% 51%
In-Store Demos/Sampling
86% 89% 87% 100% 100% 67% 87%
Instant Redeemable Coupon (IRC) Stickers
46% 56% 49% 50% 100% 67% 53%
Internet Programs 61% 33% 54% 50% 67% 67% 55%
Manufacturer Purchased Display Space
54% 67% 57% 50% 33% 0% 51%
Manufacturer Shelf Talkers
21% 22% 22% 50% 0% 33% 23%
National Sweepstakes 4% 0% 3% 0% 33% 0% 4%
Near Pack Offers 21% 11% 19% 25% 100% 33% 26%
Paperless Coupons 68% 56% 65% 50% 67% 33% 62%
Premium Giveaways 11% 11% 11% 0% 100% 0% 15%
Promotion Tied to Local Organization or Charity
50% 22% 43% 75% 33% 100% 49%
Retailer Cross-Ruff 25% 0% 19% 0% 67% 33% 21%
Retailer Shelf Talkers 64% 33% 57% 75% 67% 67% 60%
Shipper Displays 68% 89% 73% 75% 67% 33% 70%
Targeted Direct Mail 89% 78% 87% 100% 100% 100% 89%
Tear Pads 18% 11% 16% 0% 0% 33% 15%

appendix c � 31
Question 5B – Program Effectiveness in Terms of Increasing Overall Store Sales
Channel of Trade
Supermarket
Promotional Program Self
Distributed Wholesale Distributed
All Supermarket
Wholesale Grocery
Discount Drug
Mass Merchandise
All Responses
Mean Response (1=Ineffective, 5=Extremely Effective)
Chain-wide Sweepstakes 2.7 3.0 2.8 2.3 3.0 3.3 2.8
Co-op Radio 3.4 3.4 3.4 3.3 3.0 4.3 3.5
Co-op Television 3.4 3.3 3.3 3.5 2.5 4.5 3.4
Frequent Shopper Programs
4.1 4.2 4.1 4.0 5.0 3.0 4.0
In-Ad Coupons 3.1 4.3 3.4 4.5 4.3 3.7 3.7
In-Store Advertising 2.6 2.3 2.6 3.0 3.0 4.5 2.8
In-Store Coupons 3.4 3.8 3.5 4.0 4.3 3.5 3.6
In-Store Demos/Sampling
3.6 4.3 3.8 4.3 4.0 4.5 3.9
Instant Redeemable Coupon (IRC) Stickers
3.0 3.8 3.2 3.0 4.0 4.5 3.3
Internet Programs 2.5 2.5 2.5 2.0 3.3 4.5 2.7
Manufacturer Purchased Display Space
3.3 3.2 3.2 3.3 3.0 1.5 3.1
Manufacturer Shelf Talkers
2.6 3.0 2.6 3.7 3.0 3.0 2.8
National Sweepstakes 1.8 2.0 1.8 1.7 3.0 2.5 2.0
Near Pack Offers 2.5 2.3 2.4 2.7 3.7 3.5 2.7
Paperless Coupons 3.9 3.8 3.9 2.7 4.0 3.5 3.7
Premium Giveaways 2.2 2.3 2.2 3.0 4.0 2.0 2.4
Promotion Tied to Local Organization or Charity
2.9 2.8 2.9 3.7 2.7 4.0 3.0
Retailer Cross-Ruff 2.5 2.0 2.5 2.3 3.5 1.5 2.5
Retailer Shelf Talkers 3.8 3.8 3.8 4.3 4.0 3.5 3.9
Shipper Displays 3.3 4.4 3.5 3.5 4.0 5.0 3.6
Targeted Direct Mail 4.2 4.5 4.2 3.8 4.0 4.3 4.2
Tear Pads 2.3 3.0 2.4 2.3 2.0 3.0 2.4

appendix c � 32
Question 6 – Indication of Top 3 Most Effective Programs at Increasing Store Sales
Channel of Trade
Supermarket
Promotional Program Self
Distributed Wholesale Distributed
All Supermarket
Wholesale Grocery
Discount Drug
Mass Merchandise
All Responses
% of respondents placing among the top 3
Chain-wide Sweepstakes 7% 11% 8% 25% 33% 0% 11%
Co-op Radio 14% 22% 16% 0% 33% 100% 22%
Co-op Television 32% 11% 27% 0% 0% 67% 26%
Frequent Shopper Programs
54% 44% 51% 75% 0% 0% 48%
In-Ad Coupons or In-Store Coupons
39% 78% 49% 75% 100% 67% 57%
In-Store Advertising 0% 0% 0% 0% 0% 0% 0%
In-Store Demos/Sampling
21% 33% 24% 0% 0% 0% 20%
Instant Redeemable Coupon (IRC) Stickers
0% 11% 3% 0% 33% 0% 4%
Internet Programs 0% 0% 0% 0% 0% 33% 2%
Manufacturer Purchased Display Space
14% 0% 11% 0% 0% 0% 9%
Manufacturer Shelf Talkers
0% 0% 0% 0% 0% 0% 0%
National Sweepstakes 0% 0% 0% 0% 33% 0% 2%
Near Pack Offers 0% 0% 0% 0% 0% 0% 0%
Paperless Coupons 21% 11% 19% 0% 0% 0% 15%
Premium Giveaways 0% 0% 0% 0% 0% 0% 0%
Promotion Tied to Local Organization or Charity
0% 0% 0% 0% 0% 0% 0%
Retailer Cross-Ruff 0% 0% 0% 0% 0% 0% 0%
Retailer Shelf Talkers 18% 11% 16% 50% 33% 0% 20%
Shipper Displays 18% 22% 19% 25% 33% 0% 20%
Targeted Direct Mail 50% 44% 49% 50% 0% 33% 46%
Tear Pads 0% 0% 0% 0% 0% 0% 0%
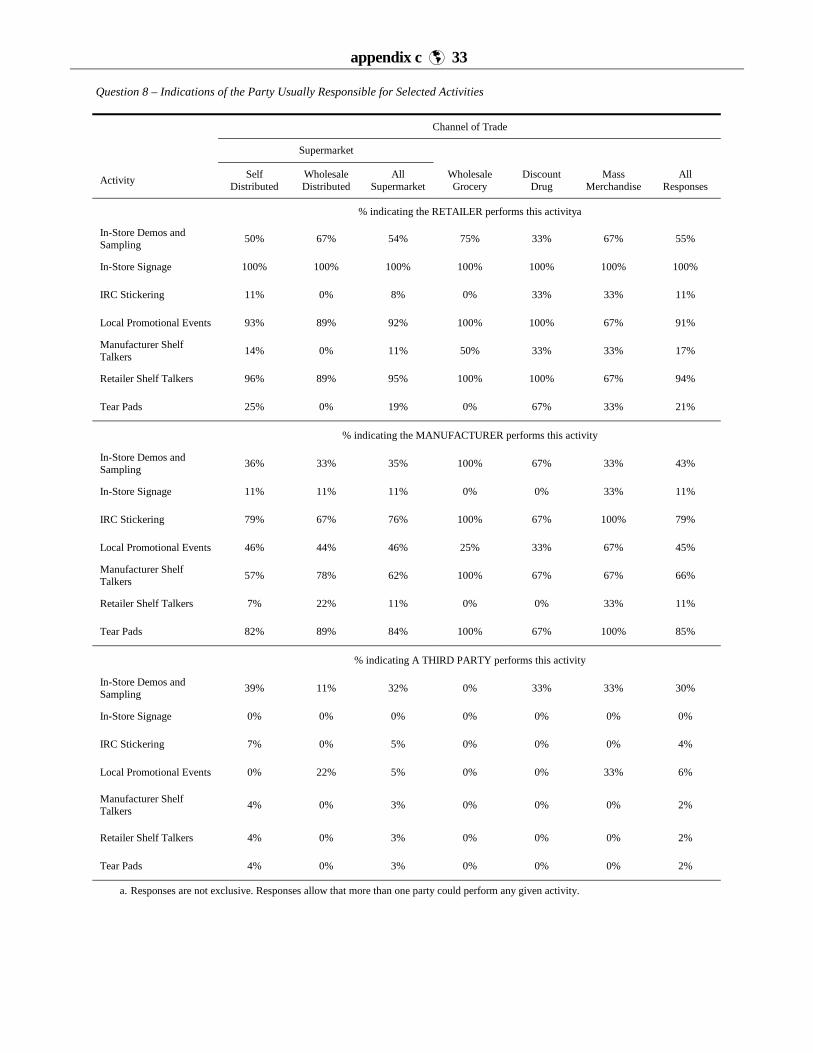
appendix c � 33
Question 8 – Indications of the Party Usually Responsible for Selected Activities
Channel of Trade
Supermarket
Activity Self
Distributed Wholesale Distributed
All Supermarket
Wholesale Grocery
Discount Drug
Mass Merchandise
All Responses
% indicating the RETAILER performs this activitya
In-Store Demos and Sampling
50% 67% 54% 75% 33% 67% 55%
In-Store Signage 100% 100% 100% 100% 100% 100% 100%
IRC Stickering 11% 0% 8% 0% 33% 33% 11%
Local Promotional Events 93% 89% 92% 100% 100% 67% 91%
Manufacturer Shelf Talkers
14% 0% 11% 50% 33% 33% 17%
Retailer Shelf Talkers 96% 89% 95% 100% 100% 67% 94%
Tear Pads 25% 0% 19% 0% 67% 33% 21%
% indicating the MANUFACTURER performs this activity
In-Store Demos and Sampling
36% 33% 35% 100% 67% 33% 43%
In-Store Signage 11% 11% 11% 0% 0% 33% 11%
IRC Stickering 79% 67% 76% 100% 67% 100% 79%
Local Promotional Events 46% 44% 46% 25% 33% 67% 45%
Manufacturer Shelf Talkers
57% 78% 62% 100% 67% 67% 66%
Retailer Shelf Talkers 7% 22% 11% 0% 0% 33% 11%
Tear Pads 82% 89% 84% 100% 67% 100% 85%
% indicating A THIRD PARTY performs this activity
In-Store Demos and Sampling
39% 11% 32% 0% 33% 33% 30%
In-Store Signage 0% 0% 0% 0% 0% 0% 0%
IRC Stickering 7% 0% 5% 0% 0% 0% 4%
Local Promotional Events 0% 22% 5% 0% 0% 33% 6%
Manufacturer Shelf Talkers
4% 0% 3% 0% 0% 0% 2%
Retailer Shelf Talkers 4% 0% 3% 0% 0% 0% 2%
Tear Pads 4% 0% 3% 0% 0% 0% 2%
a. Responses are not exclusive. Responses allow that more than one party could perform any given activity.

appendix c � 34
Question 9 – Indications of Sources for Funding Selected Activities
Channel of Trade
Supermarket
Activity
Source for Funding Self Distributed
Wholesale Distributed
All Supermarket
Wholesale Grocery
Discount Drug
Mass Merchandise
All Responses
% of funds coming from the indicated source
In-Store Demos and Sampling
Retailer 13% 7% 12% 1% 0% 27% 11%
Manufacturer 87% 93% 88% 99% 100% 73% 89%
Other 0% 0% 0% 0% 0% 0% 0%
In-Store Signage
Retailer 86% 77% 84% 94% 65% 85% 84%
Manufacturer 14% 23% 16% 6% 35% 15% 16%
Other 0% 0% 0% 0% 0% 0% 0%
IRC Stickering
Retailer 4% 0% 4% 16% 0% 27% 6%
Manufacturer 94% 100% 95% 84% 100% 63% 92%
Other 1% 0% 1% 0% 0% 10% 2%
Local Promotional Events
Retailer 45% 54% 47% 35% 42% 23% 44%
Manufacturer 54% 41% 51% 65% 58% 77% 54%
Other 1% 5% 2% 0% 0% 0% 1%
Manufacturer Shelf Talkers
Retailer 9% 3% 7% 13% 0% 5% 7%
Manufacturer 87% 97% 89% 88% 100% 75% 89%
Other 0% 0% 0% 0% 0% 20% 3%
Retailer Shelf Talkers
Retailer 87% 88% 87% 96% 58% 90% 86%
Manufacturer 13% 12% 13% 4% 42% 10% 14%
Other 0% 0% 0% 0% 0% 0% 0%
Tear Pads
Retailer 5% 0% 4% 13% 0% 40% 6%
Manufacturer 95% 100% 96% 88% 100% 45% 93%
Other 0% 0% 0% 0% 0% 15% 1%
additional publications � 35
additional publications The following publications are available at $25 each. Discounts are available on multiple copies of any
individual report. Direct orders to:
Food Industry Management Program
113 Warren Hall, Cornell University,
Ithaca, NY 14853-7801
Phone: (607) 255-1622
Fax: (607) 255-4776
Structural and Marketing Changes in U.S. Retailing, 1987-1997: Foundation for the Future, Robert
V. Weaver, R.B. 98-09, November 1998.
FreshTrack 1998: Marketing and Performance Benchmarks for the Fresh Produce Industry with a Focus on People, Edward W. McLaughlin, Kristen Park, Debra J. Perosio, and Geoffrey M. Green,
R.B. 98-08, September 1998. (We can only sell this publication to other universities. Other companies
should contact the Produce Marketing Association at 302-738-7100)
A Presentation Guide to the U.S. Food Industry, Geoffrey M. Green, Edward W. McLaughlin, Kristen
Park, E.B. 98-05, May 1998.
FreshTrack 1997: Marketing and Performance Benchmarks for the Fresh Produce Industry,
Edward W. McLaughlin, Kristen Park and Debra J. Perosio, R.B. 97-15, October 1997. (We can only
sell this publication to other universities. Other companies should contact the Produce Marketing
Association at 302-738-7100)
FreshTrack 1997: The Fresh Produce Wholesaling System: Trends, Challenges, and Opportunities,
Edward W. McLaughlin and Kristen Park, R.B.97-16, December 1997. (We can only sell this
publication to other universities. Other companies should contact the Produce Marketing Association
at 302-738-7100)
Retail Logistics & Merchandising, Requirements in the Year 2000, Edward W. McLaughlin, Debra J.
Perosio and John L. Park, R.B. 97-08, May 1997.
Changing Patterns of Fruit and Vegetable Production in New York State, 1970-94, Kristen Park,
Edward W. McLaughlin and Craig Kreider, E.B. 97-01, January 1997.
Supermarket Development in China, Gene A. German, Jane Wu and Ming Li Chia, E.B.96-20,
December 1996.
The Feasibility of a Mid-Hudson Valley Wholesale Fresh Produce Facility, A Buyer Assessment, Craig R. Kreider and Edward W. McLaughlin, R.B. 96-09, August 1996.