THE PRIMARY COPPER INDUSTRY OF ARIZONA IN. 1987
82
THE PRIMARY COPPER INDUSTRY OF ARIZONA IN. 1987 DEPARTMENT OF MINES AND MINERAL RESOURCES BY RICHARD R. BEARD
Transcript of THE PRIMARY COPPER INDUSTRY OF ARIZONA IN. 1987

THE PRIMARY COPPER INDUSTRYOF ARIZONA
IN. 1987
DEPARTMENT OF MINES AND MINERAL RESOURCESBY RICHARD R. BEARD

ARIZONA DEPARTMENT OF MINES AND MINERAL RESOURCES
Leroy E. Kissinger, Director
Phoenix Office:Mineral Building, FairgroundsPhoenix, Arizona 85007(602) 255-3791
Tucson Office:416 W. Congress, Rm 190Tucson, Arizona 85701(602) 628-5399
BOARD OF GOVERNORS
Clifford B. Altfeld - TucsonChairman
Edna Vinck - GlobeVice-Chairman
C. J. Hansen - TucsonMember
Cover - Ball mill, Cyprus Bagdad
Roy Miller - PhoenixSecretary
Donald W. Hart - PhoenixMember
STATE OF ARIZONA
OEPARTMENT OF MINES ANO MINERAL RESOURCES
Phoenix, Arizona
Leroy E. Kissinger, Director
THE PRIMARY COPPER INDUSTRY
OF ARIZONA
1987
Special Report Number 14
By
Richard R. Beard, Mining Engineer
February 1989
ACKNOWLEDGEMENT
The author wishes to express his sincere appreciation to the management and
staff of each of Arizona's mining companies for graciously devoting time and
effort to provide information for this report during this period when the
survival of their industry requires their constant attention.
Lorraine Burgin of the U.S. Bureau of Mines, Dr. George Learning of the Western
Economic Analysis Center of Marana, Arizona and the American Bureau of Metal
Statistics, Inc. of Secaucus, New Jersey also provided vital information.
Thanks are also due to the Arizona Department of Economic Security, the
Arizona Department of Revenue and the staff of the Joint Legislative Budget
Committee for providing statistics and data.
A special gratitude is felt toward the preceding authors for providing the
format and sources of statistical information and to Leroy E. Kissinger,
Director of the Department of Mines and Mineral Resources for providing the
opportunity to author this report.

INTRODUCTI ON
TABLE OF CONTENTSPage
1
COPPER PRODUCTION IN ARIZONA --- 1987 3
1987 OPERATIONS SUMMARy............................................. 4
STATUS AND PROGRESS 5
HIGHLIGHTS OF COMPANY OPERATION IN ARIZONAASARCO Incorporated 9Cyprus Minerals Company.................... 12Inspiration Resources Corporation 14Magma Copper Company....................... 15Phelps Dodge Corporation 17
SEVERENCE TAX ON METALLIFEROUS MINERALS
STATISTICAL TABLES (1
PRODUCTION
Arizona
19
Table I
Table IITable III
Table IV
Table V
Table VI
Tabl e VII
Table VIII
Tabl e IX
Table XTable XI
Un ited States
Tabl e XII
Table XIIITable XIVTable XV
Copper and Molybdenum Production of LargeArizona Copper Mines, 1987 .
Arizona Leach Copper Production, 1978-87 .Rank of Arizona's Copper Companies byProduction of Copper and Molybdenum, 1987
Rank of Arizona's Copper Mines byProduction of Copper and Molybdenum, 1987
Arizona Mine Production of RecoverableCopper by Month and Cumulative Year toDate, 1983-87 .
Average Copper Content of Ore Producedat Arizona Copper Mines, 1978-87 .
Percent Contained Copper Recovered atArizona Copper Mines, 1978-87 .
Stripping Ratios at Arizona Open-PitCopper Mines (Waste:Ore), 1978-87 .
Arizona Production and Value of Copper,Molybdenum, Gold and Silver RecoveredFrom Copper Ore 1972-87 .
Nonfuel Mineral Production in Arizona .Copper Mine Capacity in Arizona .
Mine Production of Copper in theUnited States 1983-87 .
Copper Smelters in North America .Copper Production of Companies in the U.S .Copper Imports of the U.S. by CountriesCopper Exports of the U.S. by Countries ....
ii
2326
28
29
30
31
34
36
384041
4243444650

TABLE OF CONTENTS (CONT)
EMPLOYMENT
Arizona
Table XVI
Tabl e XVII
Table XVIII
United States
Table XIX
INVENTORIESTable XX
PRICESTable XXI
COSTSTabl e XXII
RESERVESTable XXIII
Table XXIV
"Covered Employment" and Wages inArizona Copper Mining and Smelting .
Arizona Industries Covered bySocial Security Year - 1987 .
Direct and Indirect Impacts of the CopperIndustry on the Arizona Economy - 1987 ....
Employment, Earnings and Hours in CopperMining in the United States and Arizona1970-87 .
Graph showing Productivity of ArizonaCopper Workers .
Graph showing Copper Produced (RecoverableContent) .
Refined Copper Inventories at Month End1983-87 .
Average Quoted Price of ElectrolyticCopper Wirebar -- Domestic, Delivered1978-87 .
Average Copper Cash Production Costs forthe United States, 1982-86 .
Copper Reserve Base in Arizona .Copper Reserves - Listed by Company .Arizona and U.S. Copper Mine Production
in Short Tons of Copper, 1874-87 .
54
56
57
58
61
62
63
64
65
6674
75
ILLUSTRATIONSProducing Copper Properties Map 2Copper Reserves Map 73
(1 Throughout this report a "ton" means a short ton (2,000 poundsor 0.90718 metric ton).
Certain specific statistics may vary slightly from Table to Table.This is due to differences in their source.
iii

INTRODUCTION
The Arizona Department of Mines and Mineral Resources presents herein a reportcovering activity in Arizona's copper industry in the calendar year 1987. Abrief review of operational highlights reported by the major developers andproducers in the State, market and price developments that affected copperproduction and discussions of Arizona severance taxes on metalliferousminerals are included.
The contained statistical tables include various production, employment,inventory, import/export, prices, costs and ore reserve numbers for 1987.Production of recoverable copper is given for individual mines and by company.Figures showing the importance of copper in the mining industry are provided,as are data on the by-products of copper mining; gold, silver and molybdenum.In addition, historical compilations are included for leach copper, averagegrade of ore produced, percent copper recovered, open pit mine strippingratios, and employment and earnings. Additional compilations indicatingrefined copper inventories in and out of the United States and average copperprices by month from 1978 through 1987 are provided. Also included are tablesshowing designed mine capacity and copper reserves in Arizona plus averagecopper cash production costs for the United States, 1982-1986.
The Department maintains extensive reference libraries in its Phoenix andTucson offices concerning the copper industry in Arizona. These repositoriesinclude information on individual mines and mining companies, United StatesBureau of Mines and United States Geological Survey publications, otherprofessional publications and periodicals and earlier editions of this report.Additionally, experienced mining engineers are available for consultation, atno charge, on matters germane to the minerals industry. Office hours are 8a.m. to 5 p.m. on all non-holiday weekdays.

Underground Mine
o Open Pit Mine
[jjI
o Leach Plant Only
+ SlDelter
PlllJUCIIIi COPPER PROPEUIES
1987

COPPER PRODUCTION IN ARIZONA - 1987
Arizona's copper industry produced 862,034 tons of copper in 1987 (TableI). This is a decrease of 1.6% below 1986 and 19.6% below the recordproduction of 1981 (Table IX). Arizona's share of the United States total was61.4% (Table XXIV).
The gross value of non-fuel mineral production in Arizona in 1987 was up13% over 1986 to $1,783,380,000 (preliminary) (Table X). Copper productionrepresents 76% of this total and the by-products of copper production (gold,silver and molybdenum) represent an additional 5.4% (Table IX). The totalcontribution of the copper mines was therefore 82.3% of the gross value.
Copper was produced by 5 companies from 12 properties in 1987 andmolybdenum was recovered as a co-product or by-product at 5 of theseproperties (Tables III & IV). Eight properties produced 98.6% of Arizona'scopper and 3 produced 93.7% of the molybdenum. The Morenci-Metcalf mine ofPhelps Dodge led in copper production with 30.8% of the total and theSierrita-Esperanza complex produced 57.2% of the molybdenum.
More than 170,000 tons of copper representing 19.8'h of the total wasproduced by leaching in 1987. Solvent extraction-electrowinning producedalmost 135,000 tons of cathode copper from these leach solutions. Theremaining 36,000 tons were precipitated as cement copper (Table I).
Stripping of waste, including some leachable material, was accomplishedat the 8 operating open pit mines during 1987. The weighted average of thestripping ratios - waste to ore - was 1.21 to 1 (Table VIII). This is anincrease from .96 to 1 in 1986 that probably indicates normal long range mineplanning.
The weighted average grade - percent copper - of sulfide ores mined in1987 was .58% copper (Table VI). This is lower than the average of the last10 years and reflects the confidence of the copper industry.
The estimated capacity to produce copper at each'of Arizona's principaloperations totals 1.042 million tons annually (Table XI). By this estimatethe mines, concentrators and leach facilities operated at 83% of capacity in1987.
The copper reserve base in Arizona by company and property is estimatedin Table XIII. The reserve base as defined in "Mineral Facts and Problems"1985 Edition, Bureau of Mines Bulletin 675, page 3, includes those resourcesthat are currently economic (reserves), marginally economic (marginalreserves) and some of those that are currently sub-economic (sub-economicreserves). The many technical, political, social and economic variablesrender a listing of actual economic reserves inappropriate.
3

1987 OPERATIONS SUMMARY
Operating Properties
Operating Companies
Operating Smelters
Ore Mined (Includes some oxide)
Ore Milled (sulfide)
Waste/Overburden Removed(includes some leach material)
Average Stripping Ratio
Copper Produced
From Sulfide Ores
Average Grade
From Leaching
SX-EW
Precipitation
Molybdenum Produced
Silver Produced
Gold Produced
Average Employment
Average Annual Wage
Productivity
4
12
5
3
166,113,000 tons
146,016,000 tons
182,460,000 tons
1. 21: 1
862,034 tons - 61.4% of U.S.
691,113 tons - 80.2% of AZ
.58% copper
170,921 tons - 19.8% of AZ
134,953 tons - 79.0% of Leached
35,968 tons - 31.0% of Leached
25,861,000 pounds
3,217,000 troy ounces
48,991 troy ounces
10,340
$28,946
120 pounds of copper per man-hour
11.5 tons of ore per man-hour

STATUS AND PROGRESS
In 1987 the trends started in 1985 and pursued through 1986 continued.At the start of the year the price remained low and the only hope for survivalappeared to be cost reduction. The continued decrease in stocks had littleeffect on the price until it became apparent that there was no excessproduction capacity that could be brought on line qUickly. By the end of theyear the price was well over a dollar a pound and seemed to be stabilizing.Although high prices were welcome they elicited no rush to develop any majornew domestic properties because of the planned expansion of foreignproduction. Such projects as the Escondida porphyry in Chile which isexpected to add over 300,000 tons of copper to the market in 1991, amongothers, keep the domestic producers conservative. Meanwhile 1988 appearsdestined to be a banner year.
No producing properties were shut down in 1987, nor were any developedor reactivated. Virtually all, however, were able to establish long termmining plans with some degree of confidence.
OPEN PIT MINING
The majority of the copper is produced by open pit mining methods. Sofar most of the improved efficiency has been the result of consolidation,preplanned maintenance, scheduling and utilization of equipment. The computerdispatching at Morenci is but one example of this. Now, however, majorchanges in operating methods are being considered.
At Morenci, Phelps Dodge has gone from an all rail haulage system to asystem using trucks to service the shovels and haul to in-pit transfer pointsfor rail haulage to the concentrators and distant dumps. With the purchase ofthe conveyor system from Anamax's closed Twin Buttes mine, rail haulage willbe phased out completely.
Magma has brought its open pit mine for the oxide ore overlying the mainsulfide orebody at San Manuel on line and it is now in production.
Cyprus has acquired Duval's properties and is increasing production atthe Sierrita-Esperanza property to add to its continuing production at Bagdad.
Asarco purchased the Ray Mines Division from Kennecott to supplement itsin-house production of concentrates to feed its Hayden Smelter.
UNpERGROUND MINING
At San Manuel, the only operating underground copper mine in Arizona,Magma is showing signs of optimism by continuing to invest in the developmentof the Kalamazoo ore body. Development of Asarco's underground ore body atSacaton and Phelps Dodge's Safford property has been suspended indefinitelyand no other underground development is under consideration in Arizona.
5

STATUS AND PROGRESS (CONT)
IN-SITU MINING
In-situ leaching of rubbleized copper bearing material remalnlng in minedout underground stopes has long been practiced in Arizona. At San Manuel,Magma is developing a more formalized program of leaching mined out blockcaving stopes and is approaching production status. During the last few yearsall of the production from the Lakeshore property has been from a similarsystem developed by Noranda. Cyprus is continuing this project as well as thetests initiated by Noranda into in-situ leaching of non-rubbleized or virginground. Kocide Chemical is also planning to produce copper from the Van Dykeproperty at Miami in this fashion, taking advantage of the test work conductedby Oxymi n.
The U.S. Bureau of Mines is funding tests of in-situ leaching of virginground in Arizona. Science Applications International Corporation has beenawarded a contract to identify analytical procedures and develop computeralgorithms that could be used to select the best in-situ mining method for anyspecific copper oxide deposit. Cyprus is cooperating in this study at CyprusCasa Grande (Lakeshore) and Asarco is cooperating at the Santa Cruz propertynear Casa Grande. The Santa Cruz ore body is a deep seated oxide depositwhich is owned by Asarco and Freeport McMoran on a 50-50 basis.
CONCENTRATION
The overwhelming majority of copper mineralization in Arizona is of thesulfide type and is not amenable to leaching without extraordinary means.Inspiration has had success with its heap leach-ferric cure process on mixedoxide-sulfide ores and Kennecott pioneered the use of bacteria to convertsulfides to oxides in low grade dumps. However, as shown in Table I, about80% of the copper was produced by the flotation method of concentration. Inaddition much of the leached copper produced is from dumps of "waste" whichwas stripped from open pit mines to provide access to sulfide ore. Anotheraspect of the flotation process that makes it viable at some properties is therecovery of molybdenum by selective flotation. Molybdenum provides asignificant portion of the revenues from some properties. Also, any preciousmetals in the ore follow the copper through the flotation process and smeltingto the electrolytic refinery where they can be recovered from the anodeslimes.
There are currently 8 flotation concentrators in operation in Arizona.Asarco is operating 2 - Ray and Mission, Cyprus is operating 2 - Bagdad andSierrita, Magma is operating 2 - San Manuel and Pinto Valley and Phelps Dodgeis operating 2 at Morenci-Metcalf. Five are on standby. They are Asarco's atSilver Bell, Cyprus' at Mineral Park and Esperanza, Inspiration's at Miami andPhelps Dodge's at Ajo.
Although efficiency is constantly being improved, the flotation processis not cheap. It requires crushing and grinding the ore, separation of theore minerals from the gangue minerals in the flotation cells, smelting theconcentrate and refining the copper anodes from the smelter. The mostsignificant development in flotation is the column flotation cell beinginstalled in most concentrators.
6

STATUS AND PROGRESS (CONT)
SOLVENT EXTRACTION
Traditionally the copper produced from leach solutions has been extractedby the cementation process (precipitation from solution by the replacement ofcopper in solution by metallic iron). This has been a source of relativelycheap copper but the cement copper produced must be smelted and refined alongwith the flotation concentrates.
During the 60's Ranchers Exploration and Development Corporationpioneered the use of solvent extraction-electrowinning to produce copper fromits Bluebird property near Miami. The obvious advantage of this method isthat cathode copper of salable quality can be produced directly from leachsolutions. Smelting, with its pollution problems, and further refining aretherefore not required.
During the relatively good years experienced by the industry afterRanchers' introduction of solvent extraction-electrowinning, interest in theprocess grew gradually. The di sastrous 80' s have prompted an acceleratedinterest in it, however. Nine plants operated during 1987, one was moved fromCyprus Johnson to Cyprus Sierrita and the plant at Morenci came on line.Several expansions or new plants are planned and the cementation process isbeing phased out except as a subsidiary method.
SMELTING
Of the 6 smelters rema1n1ng in Arizona in 1987 only 3 operated. Asarco'sHayden smelter and Inspiration's smelter at Miami have been brought intocompliance with air pollution constraints and Ma9ma's smelter at San Manuel isbeing retrofitted with an OutoKumpu flash furnace to bring it into compliance.The Ray smelter at Hayden that Asarco acquired from Kennecott met allsignificant environmental constraints when last operated in 1982 and isavailable if needed. Phelps Dodge's smelters at Ajo and Morenci will requireextensive retrofitting before they can be operated and their smelter atDouglas has been permanently shut down in lieu of retrofitting. Phelps Dodgeis shipping concentrates to is Hidalgo smelter at Playas, New Mexico and tothe Chino smelter at Hurley, New Mexico that was recently acquired fromKennecott. Excess concentrates are being sold.
As an alternative to smelting, Cyprus Casa Grande is planning toreactivate the Roast-Leach-Electrowinning (RLE) plant built by Hecla at theLakeshore property. In this process flotation concentrates are roasted tomake them acid soluble, leached with sulfuric acid and salable cathode copperis extracted from solution by electrowinning. Acid is produced from theroaster gases and the process is essentially pollution free. A portion of theconcentrates from Sierrita will be processed at this plant.
PROGNOSTI CATION
An advantage of publishing the 1987 report so late, for which Iapologize, 1S that hindsight can be used to produce the 1988 "forecast". Iwill not take advantage of that but will instead try my luck at forecasting1989.
7

STATUS AND PROGRESS (CONT)
Suffice it to say that 1988 brought broad smiles but furrowed brows tothe industry. While the high prices of copper being experienced bring welcomerelief, they also raise the spectre of "substitution". Once a market is lostto another commodity, it is very difficult to reclaim. However, with thepredicted demand, the current worldwide production capacity and the expectedexpansion of that capacity over the next few years, the price of copper shouldremain at a level that is not conducive to substitution. Any upset in theworld economy whether inflationary or recessionary will bring difficult timesback to the industry, however.
8
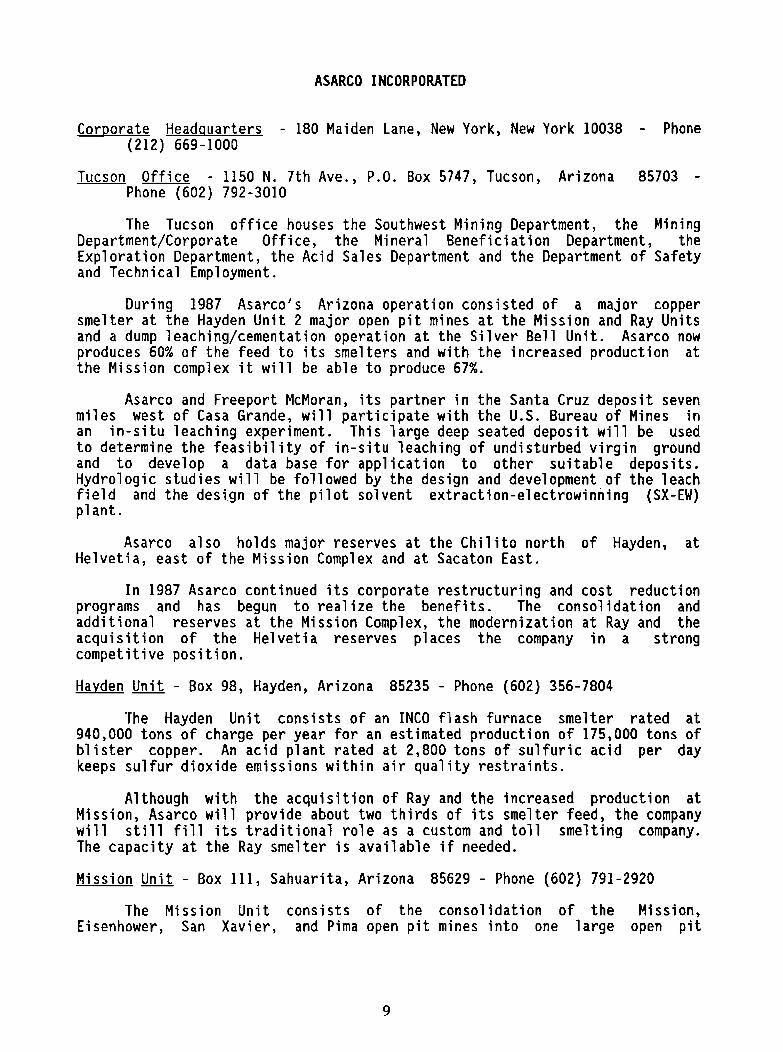
ASARCO INCORPORATED
Corporate Headquarters - 180 Maiden Lane, New York, New York 10038 - Phone(212) 669-1000
Tucson Office - 1150 N. 7th Ave., P.O. Box 5747, Tucson, Arizona 85703 Phone (602) 792-3010
The Tucson office houses the Southwest Mining Department, the MiningDepartment/Corporate Office, the Mineral Beneficiation Department, theExploration Department, the Acid Sales Department and the Department of Safetyand Technical Employment.
During 1987 Asarco's Arizona operation consisted of a major coppersmelter at the Hayden Unit 2 major open pit mines at the Mission and Ray Unitsand a dump leaching/cementation operation at the Silver Bell Unit. Asarco nowproduces 60% of the feed to its smelters and with the increased production atthe Mission complex it will be able to produce 67%.
Asarco and Freeport McMoran, its partner in the Santa Cruz deposit sevenmiles west of Casa Grande, will participate with the U.S. Bureau of Mines inan in-situ leaching experiment. This large deep seated deposit will be usedto determine the feasibility of in-situ leaching of undisturbed virgin groundand to develop a data base for application to other suitable deposits.Hydrologic studies will be followed by the design and development of the leachfield and the design of the pilot solvent extraction-electrowinning (SX-EW)plant.
Asarco also holds major reserves at the Chilito north of Hayden, atHelvetia, east of the Mission Complex and at Sacaton East.
In 1987 Asarco continued its corporate restructuring and cost reductionprograms and has begun to realize the benefits. The consolidation andadditional reserves at the Mission Complex, the modernization at Ray and theacquisition of the Helvetia reserves places the company in a strongcompetitive position.
Hayden Unit - Box 98, Hayden, Arizona 85235 - Phone (602) 356-7804
The Hayden Unit consists of an INCO flash furnace smelter rated at940,000 tons of charge per year for an estimated production of 175,000 tons ofblister copper. An acid plant rated at 2,800 tons of sulfuric acid per daykeeps sulfur dioxide emissions within air quality restraints.
Although with the acquisition of Ray and the increased production atMission, Asarco will provide about two thirds of its smelter feed, the companywill still fill its traditional role as a custom and toll smelting company.The capacity at the Ray smelter is available if needed.
Mission Unit - Box Ill, Sahuarita, Arizona 85629 - Phone (602) 791-2920
The Mission UnitEisenhower, San Xavier,
consists of the consolidation of the Mission,and Pima open pit mines into one large open pit
9

ASARCO INCORPORATED (CONT)
referred to as the Mission Complex. Also included is the smaller San XavierNorth pit. The acquisition of the rest of the Eisenhower in April and of theMineral Hill deposit adjacent to the Pima section of the open pit late in 1987increased reserves and facilitates further efficiencies in pit design and mineplanning.
Mining is conducted by electric shovels with truck haulage to theprimary crusher and waste dumps. Some areas of the pit are back to finallimits allowing some waste dumping in pit. The stripping ratio in 1987 was1.05:1, waste to ore.
The concentrator capacity is being increased from 29,000 tons per day to41,000 tons per day. This is being accomplished by lengthening the 10.5 footdiameter ball mills from 15 feet to 18 feet, installing 2 new ball millssalvaged from the Sacaton mill, converting some of the cleaner flotation cellsto roughers and installing six 8x52 foot column flotation cells for cleaners.
Ray Unit - P.O. Box 9, Hayden, Arizona 85235 - Phone (602) 356-7811
The Ray Unit consists of an open pit mine, dump leach and heap leachoperations and a SX-EW plant at Ray and a 26,000 ton per day concentrator atHayden. The 400,000 ton per year smelter and 900 ton per day acid plant atHayden are on stand-by status.
Mining is conducted by electric shovels supplemented by front-endloaders utilizing truck haulage. The production rate is 100,000 tons per dayof which 26,000 tons are sulfide ore sent to the mill, 10,000 tons aresilicate ore which is crushed and sent to the leach heaps and the remainder islow grade sent to leach dumps or waste sent to waste dumps. The mine plansare predicated on the sulfide operation and therefore silicate ore isstockpiled when in excess and fed from the stockpile to the crushers whenshort.
Sulfide ore is hauled to the primary crusher at Ray where it is crushedand transferred to trains for the 20 mile haul to the mill.
Silicate ore is hauled to the primary crusher then further reduced tominus 3/4 inch by secondary and tertiary crushers. It is then transported byconveyor where it is agglomerated with sulfuric acid while in transit to theheap leach area. Final haulage and placement on the heaps is by end-dumptrucks.
Low grade muck is hauled to prepared leaching areas and non-mineral muckis hauled to waste dumps by end dump trucks. All leach solution are now fedto the SX-EW plant.
Previously stockpiled native copper ore is being reclaimed and fed tothe mill in small proportions as is smelter slag.
New tailings dams are being built on the west side of the Gila Riveracross from the present tailings dams.
10

ASARCO INCORPORATED (CONT)
Silver Bell Unit - Marana, Arizona 85653 - Phone (602) 622-6551
The Silver Bell Unit consists of an open pit copper mine and an 11,000ton per day concentrator that are both on stand by status. The dump leachingoperation and precipitation plant are in operation.
11

CYPRUS MINERALS COMPANY
Corporate Headquarters - 9100 E. Mineral Circle, P.O. Box 3299, Englewood,Colorado 80112 - Phone (303) 643-5000
Cyprus has continued to grow. In July of 1987 it added Noranda'sLakeshore property south of Casa Grande as Cyprus Casa Grande. In March 1988they entered into a 15 year lease of the Twin Buttes property formerlyoperated by Anamax and in July 1988 they acquired the entire Inspirationproperty at Miami including the mines, concentrator (inactive), SX-EW plant,smelter, acid plant, electrolytic refinery and rod plant. Cyprus was thethird largest producer of copper in 1987 and with the new acquisitions itshould move into the second position. It will continue to be the largestproducer of molybdenum.
In addition to its copper-molybdenum properties, Cyprus operatesArizona's largest gold mine, the Copperstone north of Quartzsite, and hasentered into a joint venture agreement with Magma to explore the old Mammothmine, which is a part of Magma's San Manuel property, as a possible goldoperation. Cyprus would be the operating partner.
Cyprus Bagdad - P.O. Box 245, Bagdad, Arizona 86321 - Phone (602) 633-2241
The Bagdad operation consists of an open pit copper-molybdenum mine, a54,000 ton per day concentrator, a dump leach operation and an SX-EW plant.Copper concentrates were shipped to Inspiration, Magma and Japan during 1987and the SX-EW cathodes and molybdenum oxide are sent directly to market.
Mining is conducted by electric shovels using truck haulage to theprimary crusher and dumps. The stripping ratio in 1987 was 0.77 to I, wasteto ore.
The sulfide ore is transported from the primary crusher at the mine, adistance of 6,400 feet to the coarse ore stockpile at the concentrator, byconveyor belts. There it is crushed further, ground by autogenous and ballmills and copper and molybdenum concentrates are produced. Column cells areutilized in the molybdenum flotation circuit.
Dual process ore (sulfide ore with an unusually high oxide content) isplaced in heaps and leached for 60 days before being sent to the concentrator.
Pregnant solutions from the leach dumps are collected behind dams andpumped to the SX-EW plant at approximately 1.8 grams of copper per liter. Thebarren solutions are returned to the dumps after the copper has beenextracted.
Cyprus Casa Grande - P.O. Box C-9, Casa Grande, Arizona 85222 - Phone (602)623-1539
The Casa Grande operation consists of an in-situ leaching operation andan SX-EW plant. The block caved stopes in the oxide orebody are being leachedand development of a leaching operation in virgin ground is underway using
12

CYPRUS MINERALS COMPANY (CONT)
high pressure pumps to inject sulfuric acid solution into holes drilled fromthe old underground workings. Pregnant solutions are collected in sumpsunderground and pumped to the SX-EW plant.
The roasters and acid plant of the Roast-Leach-Electrowinning (RLE)plant built by Hecla have been refurbished and should be in operation in 1988.Cyprus plans to treat concentrates from Sierrita at the plant. The pregnantsolutions will go to the SX-EW plant and the acid produced from the roastergases will be used for the leaching operations.
Cyprus Mineral Park - P.O. Box 6249, Kingman, Arizona 86401 - Phone (602)565-2226
The Mineral Park property consists of an open pit copper-molybdenum mineand a 15,000 ton per day concentrator which are both on stand by status. Thedump leaching operation and the precipitation plant are in operation and somein-pit leaching is also being conducted.
Cyprus Sierrita - P.O. Box 527, Green Valley, Arizona 85622 - Phone (602)791-2950 &(602) 625-4800
The Cyprus Sierrita property consists of an open pit copper-molybdenummine, a 100,000 ton per day concentrator, a ferromolybdenum plant, a rheniumplant, a dump leaching operation, precipitation plant and an SX-EW plant. TheEsperanza pit and 17,500 ton per day concentrator were inactive during 1987with the exception of the crushers that were used to supplement the Sierritamill crushers.
Mining is conducted using electric shovels and truck haulage to thecrushers and dumps. The stripping ratio in 1987 was 0.40:1, waste to ore.Dump leaching and precipitation began in the early 1960's.
When production ceased at Johnson Camp the SX-EW plant was moved toSierrita to replace the precipitation plant. Lead anodes, titanium cathodes,extractants and other equipment and reagents were brought from Battle Mountainand Anamax to complete the installation and startup.
13

INSPIRATION RESOURCES CORPORATION
Corporate Headquarters - 250 Park Avenue, New York, New York 10197 - Phone(212) 503-3100
Inspiration Consolidated Copper Co. - P.O. Box 4444, Claypool, Arizona 85532- Phone (602) 473-7006
The Inspiration properties consist of 3 open pit copper minescollectively called Inspiration Mines, a 24,000 ton per day concentrator whichis currently on standby status, a 380,000 ton per year electric furnacesmelter, acid plant, SX-EW plant, electrolytic refinery and a 135,000 ton peryear rod plant.
The ore is mined at the rate of 93,000 tons per day with electricshovels and hauled by truck to high grade, low grade and waste dumps. Thestripping ratio in 1987 was 2.04:1, waste to ore. Leach solutions from thelow grade dumps are acidified and passed through the high grade dumps toproduce a pregnant solution containing 5.6 grams per liter of copper to feedthe SX-EW plant. The solvent extraction plant is being doubled in size from4500 to 9000 gallons per minute to permit the use of lower grade solutionwithout decreasing production.
Essentially all feed to the smelter is either purchased or tolledmaterial. In 1987, 350,000 tons of concentrates and 67,000 tons ofprecipitates were treated. Custom anodes are cast to shapes required bycustomer.
The tank house has a combined capacity of 85,000 tons per year ofelecrorefined and electrowon copper and is being expanded to 107,500 tons peryear. Cathodes from both sections are fed to the continuous cast rod plant toproduce 5/16" copper rod on reels holding three and one-third miles of rodeach.
The Reymert mine west of Superior was operated for smelter flux andcontributed 347,000 ounces of silver in 1987.
In July of 1988, Cyprus purchased all of Inspiration's copperproperties, plants and equipment to operate under the name of Cyprus Miami.
14

Corporate Headquarters(602)385-3100
MAGMA COPPER COMPANY
P.O. Box M, San Manuel, Arizona 85631 Phone
In March 1987 after nearly 20 years as a wholly owned subsidiary ofNewmont Mining Corporation, Magma once again became an independentcorporation. As such it has continued implementing an extensive expansion andmodernization program to meet all environmental constraints and to becomecompetitive in the copper market. As part of this program the company housingin the town of San Manuel is being sold.
Magma's operations are divided into the San Manuel Division and thePinto Valley Division including the Pinto Valley Unit and the Miami Unit. Theoriginal Magma Mine at Superior was closed in 1982 and remains inactive.
Magma also operates a 29 mile railroad from San Manuel and a 28 milerailroad from Superior. Both connect to the Santa Fe Southern Pacific system.
San Manuel Division - P.O. Box M, San Manuel, Arizona 85631 - Phone (602)385-3100
The San Manuel Division consists of a block-caving underground coppermolybdenum mine, a 62,000 ton per day concentrator, an open pit oxide coppermine, pad leach, in-situ leach, SX-EW plant, an 800,000 ton per year smelterwith a 2000 ton per day acid plant and a 300,000 ton per year electrolyticrefinery and a 150,000 ton per year rod plant.
After development of the grizzly and haulage levels, caving is initiatedby undercutting the ore block. The caved ore is drawn through the grizzliesto the haulage level. Haulage to the production shafts is by 23 ton trolleylocomotives pulling ten 15-17 ton ASEA cars or fifteen 12-13 ton rotary dumpcars. After hoisting to the surface the ore is hauled by rail to the mill in100 ton cars in groups of 35 to 40 pulled by 125 ton diesel-electriclocomotives.
The 62,000 ton per day concentrator is being modernized by installinglarger but fewer cyclones, by replacing controls with programmablecontrollers, by replacing small flotation cells with nine 2000 cubic footMaxwell cells and seventy-two 300 cubic foot machines in the rougher circuitand by replacing conventional cells with column cells in the cleaner circuit.
At the smelter the reverberatory furnaces are being replaced with anOutokumpu Flask Smelting Furnace. At a design capacity of 3000 tons ofconcentrate per day, it will be the largest single furnace smelter in theindustry. An oxygen plant and modifications to the acid plant are a part ofthe modernization.
Mining at the Open Pit Oxide Mine is accomplished with hydraulicexcavators and front end loaders and truck haulage to the polyethylene linedleach dumps. Copper is recovered from the leach solutions at the SX-EW plantwhich uses the ISA process of plating the copper on stainless steel sheetsrather than on copper starter sheets.
IS

MAGMA COPPER COMPANY (CONT)
Cathodes from the electrolytic refinery and the SX-EW plant are meltedand cast into continuous rods at the rod plant.
Pinto Valley Division - P.O. Box 100, Miami, Arizona 85631 - Phone (602)425-7611
The Pinto Valley Division consists of the Pinto Valley Unit and theMiami Unit. At the Pinto Valley Unit mining is accomplished with electricshovels and truck haulage to the 60,000 ton per day concentrator. A dumpleaching and a 6000 gpm SX-EW plant are also in operation. The concentratesand cathodes are shipped to San Manuel.
At Miami solutions from the in-situ leaching of the old Miami Copperblock cave area are treated by SX-EW. The project to slurry and leach the oldMiami Copper tailings is still under development.
16

PHELPS DODGE CORPORATION
Corporate Headquarters - 2600 North Central Avenue, Phoenix, Arizona 850043015 - Phone (602) 234-8100
Phelps Dodge is the nation's largest copper producer. In 1987 itaccounted for one third of the nation's copper production at its mines insoutheastern Arizona and southwestern New Mexico. In conjunction with itsArizona operations, Phelps Dodge operates the Hidalgo Smelter near Playas, NewMexico, a mine at Tyrone and the former Kennecott properties near Silver City,New Mexico in which it owns a two-thirds interest. These propertiescontributed 235,000 tons to Phelps Dodge's account.
The Chino Mines Branch consists of an open pit copper mine, a 37,500 tonper day concentrator, a dump leach precipitation plant and a 500,000 ton peryear INCO Flash smelter with an acid plant. A 35,000 ton per year solventextraction-electrowinning plant is planned. The mine and concentrator arelocated at Santa Rita about 15 miles east of Silver City and the smelter islocated about 9 miles south of the mine at Hurley.
At Tyrone, about 10 miles south of Silver City, Phelps Dodge operates anopen pit copper mine and concentrator which produced 123,900 tons of copper inconcentrates and precipitates in 1986. The solvent extraction-electrowinningplant rated at 35,000 tons per year produced an additional 35,400 tons ofcopper in 1986. Expansion of the plant is in progress and further expansionis under consideration.
The Hidalgo smelter near Playas, New Mexico is an OutoKumpo flash furnacerated at 500,000 tons per year. During 1986 the oxygen enrichment plant fromthe Morenci smelter was installed to increase capacity and efficiency. Theresulting increase in sulfur dioxide concentration of the gases improved theoperation of the acid plant as well.
The development of an underground mine at the Dos Pobres property nearSafford, Arizona was suspended in 1982 and allowed to flood in August 1984 andremains inactive. In 1986 Phelps Dodge acquired the nearby Lone Star propertyfrom Kennecott.
At Copper Basin near Prescott, Phelps Dodge has continued to pursue aland trade with the Forest Service. There are no current plans to develop theproperty, however.
Morenci Branch - Morenci, Arizona 85540 - Phone (602) 865-4521
The Morenci Branch consists of the combined Morenci-Metcalf open pitcopper mine, the 60,000 ton per day Morenci concentrator with a molybdenumcircuit, the 40,000 ton per day Metcalf concentrator and a dump leach - SX-EWoperation. The 650,000 ton per year smelter with a 2400 ton per day acidplant remain inactive and will require extensive modifications to meet airquality restraints if ever reactivated. Somitomo Mining Arizona, Inc. holdsan undivided 15% interest in the Morenci branch excluding the inactivesmelter.
17

PHELPS DODGE CORPORATION (CONT)
Mining is conducted with electric shovels and truck haulage utilizing acomputer controlled Modular Mining Truck Dispatching System for maximumefficiency. These will feed the In Pit Crushing and Conveying system (IPCC)which will deliver the crushed ore to a stockpile which will feed bothconcentrators by conveyor belts. Both concentrators are standard flotationmills except that column flotation cells have been installed in the cleanercircuit of each.
All mined material other than ore is classified as leach material and istaken to one of several leach dumps. There are 3 widely spaced solventextraction plants to upgrade the solutions before they are pumped to thecentrally located tank house for electrowinning. The total capacity of theSX-EW system is 30,000 gallons per minute of pregnant leach solution.
Copper Oueen Branch - Highway 92, Bisbee, Arizona 85603 - Phone (602) 432-3621
The Copper Queen facility consists of a dump leaching and precipitationoperation at the mined out Lavender pit.
A drilling program on an area north of the Lavender pit was conducted in1987 to define a possible ore body amenable to treatment by heap leaching andSX-EW. The results of a feasibility study are not yet available.
New Cornelia Branch - Ajo, Arizona 85321 - Phone (602) 387-7451
The New Cornelia Branch consists of an open pit copper mine,ton per day concentrator with a molybdenum circuit and a 190,000 tonsmelter with an acid plant. The mine has been inactive since Augustthe smelter was shut down in April 1985. There are no immediatereactivate the operation.
18
a 30,000per year1984 andplans to

SEVERANCE TAX ON METALLIFEROUS MINERALS
Background
Laws of 1982, Chapter 230, repealed the tax on sales of metalliferous mineralsand enacted a severance tax in its place. Under the provisions of theseverance tax, metalliferous minerals were to be taxed at the time ofproduction, not at the time of sale. All metalliferous minerals producedafter 1982 were to be taxed on the greater of the following 2 values:
I. The "weighted mineral value" which is essentially the cost of extractingthe minerals from the earth and delivering them to the site where theywill be processed, or
2. A specified percentage of the old sales tax base.
The severance tax was to be levied on metalliferous minerals at a rate of 21/2 percent. Unless otherwise provided by law, the tax was to be administeredin the same manner as the sales tax. As a result, severance tax payments weredue on the first day of the second month following the month in which the taxaccrued. From January I, 1983 through June 30, 1983, 40 percent of theseverance tax was to be distributed in the same manner as the transactionprivilege tax (i.e. 25 percent to the cities, 33.6 percent to the counties and41.4 percent to the state). In subsequent fiscal years, a progressivelylarger share of the severance tax was to be distributed in the same manner asthe transaction privilege tax. The balance of severance tax collections,after making this distribution, was to be deposited each year in the state'sgeneral fund. (Effective from and after December 31, 1982.)
Laws of 1983, Chapter 4 changed the due date for payment of the Severance Taxto the twentieth day of the month following the month in which the taxaccrues. Taxes were to be delinquent if not received by the Department ofRevenue on the day preceding the last day of the month in which they were due.(Effective April I, 1983). The law also changed the interest rate ondelinquent tax payments to equal the rate established by Section 6621 of theInternal Revenue Code, compounded annually. (Effective February II, 1983.)
Legal Citation
A.R.S. 42-1461 - 42-1466.
Paid Qy
Persons engaged in the business of extracting substances from the earth thatbecome metalliferous minerals (A.R.S. 42-1461 - 42-1462.)
Exemptions
None.
19

SEVERANCE TAX ON METALLIFEROUS MINERALS (CONT)
The severance tax is 1ev ied on the "net severance base" of all meta11 i ferousminerals produced after 1982 (42-1462). The "net severance base" is thegreater of the following 2 values (42-1464, Laws of 1982, Chapter 230, Section12):
1. The "wei ghted mi nera1 val ue", or
2. A specified percentage of the old sales tax base (the gross value ofproduction less out-of-state processing costs). This value will bereferred to as the "Arizona value" after June 30, 1985.
The "weighted mineral value" is essentially the cost of extracting theminerals from the earth and delivering them to the site where they will beprocessed.
The "weighted mineral value" is determined using the following formula (421464) :
weighted mineral value = mining costs x gross value of productiontotal production costs
where:
mining costs represent the cost of extracting the minerals from theearth and delivering them to the site where they will be processedfurther (42-1461).
total production costs include most of the major costs incurred inmining and processing minerals until the point of sale (42-1461).
gross value of production is determined by multiplying the recoverableunits of a metallic product by the per unit price of the product; theprice per unit does not include the cost of manufacturing, fabricatingor otherwise transforming a refined mineral product, when theseactivities occur prior to sale of the product (42-1461).
Although metalliferous minerals will no longer be taxed on the old sales taxbase, the value of minerals produced after 1982 may not fall below a specifiedpercentage of the old tax value (42-1464, Laws of 1982, Chapter 230, Section12). The old tax value included not only the cost of extracting the mineralsfrom the earth, but most of the major in-state costs of producing theminerals. This value was determined by multiplying the recoverable units of ametallic product by the per unit price and deducting the out-of-stateprocessing costs from the result (42-1464; Laws of 1982, Chapter 230,Section 12; 41-1461). The following table shows the minimum percentage of theold tax value that may be assigned to minerals for severance tax purposes(42-1464; Laws of 1982, Chapter 230, Section 12):
20

SEVERANCE TAX ON METALLIFEROUS MINERALS (CONT)
Period during whichminerals are produced
January I, 1983 - June 30, 1983July 1, 1983 - June 30, 1984July 1, 1984 - June 30, 1985July 1, 1985 and thereafter
Minimum value of mineralsfor purposes of determiningthe severance tax
100% of the old taxable sale value83-1/3% of the old taxable sale value66-2/3% of the old taxable sale value50% of the old taxable sale value
Tax Rate
During fiscal years 1980-81, 1981-82 and 1982-83, businesses that producedmineral products were permitted to claim a tax credit against the SpecialExcise Tax for Education. The tax credit was determined by formula (see "TAXCREDIT" under "SPECIAL EXCISE TAX FOR EDUCATION"). The tax credit could notexceed the taxpayer's Special Excise Tax liability for the year. However, ifa taxpayer had an unused amount of credit for any year in which his productionwas curtailed due to economic conditions, the unused credit could be carriedforward for a period not to exceed three years. Since the Special Excise Taxdoes not apply to metalliferous minerals after December 31, 1982, businessesthat produce metalliferous minerals are authorized to claim this tax creditagainst their severance tax liability, beginning in 1983. In 1982-83, theamount of credit claimed may not exceed 40 percent of the taxpayer's severancetax liability (Laws of 1982, Chapter 228, Section 2; Laws of 1982, Chapter230, Section 15).
Due Date
Collections from the severance tax on metalliferous minerals are due on thetwentieth day of the month following the month in which the tax accrues.Taxes are delinquent if they are not received by the Department of Revenue onthe day preceding the last day of the month in which they are due. The duedate may be extended by the Department of Revenue for good cause, but notbeyond the first day of the third month following the regular due date (421465, 42-1322).
Collecting Agency
Department of Revenue. (42-1462, 42-101)
Dedication or Purpose
To aid in defraying the necessary and ordinary expenses of the state, cities,and counties to reduce or eliminate the annual tax levy on property for state,city and county purposes and to reduce the levy on property for public schooleducation (Laws of 1982, Chapter 230, Section 17).
Yield
No monies will be collected from this tax until fiscal year 1982-83.
21

SEVERANCE TAX ON METALLIFEROUS MINERALS (CONT)
Distribution
Each year, a portion of severance tax collections will be distributed in thesame manner as the transaction privilege tax (i.e. 25 percent to the cities,33.6 percent to the counties and 41.4 percent to the state). The portion ofcollections that is distributed in this manner will increase each fiscal yearuntil 1986-87. The table below shows the amount of severance tax collectionsthat will be distributed in the same manner as transaction privilege taxesduring each fiscal year (42-1465, Laws of 1982, Chapter 230, Section 16).
period during whichcollections are received
January 1, 1983 - June 30, 1983July 1, 1983 - June 30, 1984July 1, 1984 - June 30, 1985July 1, 1985 and thereafter
portion of severance tax collectionsdistributed in the same manner asthe transaction privilege tax
40%48%60%8~
After making this distribution the balance of severance tax collections willbe deposited each year in the state's general fund and is appropriated forpublic educational purposes (42-1465; Laws of 1982, Chapter 230, Section 16).
Source: State of Arizona Tax Handbook - 1983Prepared by the Staff of the Joint Legislative Budget Committee
22

TABLE I
COPPER AND MOLYBDENUM PRODUCTION OF LARGE ARIZONA COPPER MINES
19B7
COMPANY/MINE
ASARCO, INC.
Mission ComplexRay Unit
Dump Leach/CementationDump Leach/SX-EWHeap Leach/SX-EW
Silver BellDump Leach/Cementation
NW Total
TONSCOPPER ORE
MINED
9,926,00011,970,000
21,896,000
TONSCOPPER ORE
MILLED
9,926,0009,709,000
19,635,000
POUNDSRECOVERABLE
COPPER
117,195,000144,803,000
5,156,00014,053,00049,334,000
12,800,000
343,341,000
POUNDSRECOVERABLE
MOLYBDENUM
TO~S
WASTE/OVERBURDENREMOVED
10,379,00023,768,000
34,147,000
CYPRUS MINERALS CO.
Bagdad 21,100,000 21,100,000 165,632,000Dump Leach/SX-EW 16,470,000
Casa Grande In Situ/SX-EW (1 4,145,000Mineral Park Dump Leach/Cementation 4,405,000Sierrita/Esperanza 27,600,000 27,600,000 150,000,000
Dump Leach/Cementation 2,513,000Dump Leach/SX-EW 5,430,000
Total 48,700,000 48,700,000 348,595,000
(1 Includes Noranda's 1987 production prior to 6/31/87.
(continued)
6,087,000
14,800,000
20,887,000
17,000,000
11,160,000
28,160,000

TABLE I (CONT)
COPPER AND MOLYBDENUM PRODUCTION OF LARGE ARIZONA COPPER MINES
1987
N
'"
COMPANY/MINE
INSPIRATION CONSOLIDATED
Heap LeachSX-EWCementation
Total
MAGMA COPPER CO.
San Manuel DivisionSulphideOxide
Heap Leach/SX-EWIn Situ/SX-EW
Pinto Valley DivisionDump Leach/SX-EWIn Situ/SX-EW
Total
TGNSCOPPER ORE
MINED
10,856,000
10,856,000
16,026,0007,439,000
21,452,000
44,917,000
TONSCOPPER ORE
MILLED
16,071,000
21,763,000
37,834,000
(continued)
POUNDSRECOVERABLE
COPPER
92,118,00013,437,000
105,555,000
190,900,000
49,870,0001,408,000
128,376,00013,340,0009,384,000
393,278,000
POUNDSRECOVERABLE
MOLYBDENUM
3,353,000
800,000
4,153,000
TONSWASTE/OVERBURDEN
REMOVED
22,199,000
22,199,000
Block Caving25,752,000
28,330,000
54,082,000

TABLE I (CONT)
COPPER AND MOLYBDENUM PRODUCTION OF LARGE ARIZONA COPPER MINES
1987
t-.JV1
COMPANY/MINE
PHELPS DODGE CORP.
Copper Queen BranchDump Leach/Cementation
Morenci/Metcalf (1Dump Leach/CementationDump Leach/SX-EW
Total
(1 includes Sumitomo's 15%.
TONSCOPPER ORE
MINEO
39,744,000
39,744,000
TONSCOPPER ORE
MILLED
39,847,000
39,847,000
POUNDSRECOVERABLE
COPPER
2,730,000485,320,00030,895,00014,354,000
533,299,000
POUNDSRECOVERABLE
MOLYBDENUM
821,000
821,000
TONSWASTE/OVERBURDEN
REMOVED
43,872,000
43,872,000
--------------------------------------------------------------------------------------------------------------------
TotalsSulphide 147,818,000 146,016,000 1,382,226,000Oxide (Leach) 18,295,000
Dump Leach/Cementation 71,936,000Dump Leach/SX-EW 63,647,000Heap Leach/SX-EW 191,322,000In Situ/SX-EW 14,937,000
Sub Total SX-EW 269,906,000Sub Total Leached 341,842,000
GRAND TOTAL 166,113,000 146,016,000 1,724,068,000
Source: Personal correspondence with individual companies.
25,861,000
25,861,000
134,509,000
182,460,000

TABLE II
ARIZONA LEACH COPPER PRODUCTION (1
(Thousand Pounds)
MINE OPERATION 1978 1979 1980 1981 1982 1983 1984 1985 1986 1987
ANAMAX MINING COMPANYTwin Buttes 71,614 70,343 63,719 67,922 60,796 50,649 50,239 19,824
ASARCO INCORPORATEDSan Xavier 15,183Sil ver Bell 6,267 6,980 4,423 7,950 8,687 10,374 9,152 8,800 6,814 12,800Ray (2 25,013 26,502 25,875 25,788 22,420 20,033 20,457 23,706 56,639 68,543
CYPRUS MINES CORP.Bagdad 14,097 14,337 12,668 13,244 13,173 13,282 14 14,259 13,958 16,470Casa Grande (3 -- - - - - 26,071 45,611 3,244 15,401 13,514 7,100 4,145
N Johnson 10,205 10,032 10,302 10,693 9,702 - - 8,803 6,200a- Sierrita/Esperanza (4 7,469 6,002 9,991 11,566 9,354 6,367 8,500 10,000 8,770 7,943
Mineral Park (4 4,813 3,348 3,690 4,194 3,191 3,101 2,718 3,798 4,251 4,405
INSPIRATION CONSOLIDATEDCOPPER COMPANYInspriation 35,945 16,638 28,958 50,532 50,000 78,988 79,549 85,136 98,747 105,555Ox Hide 4,147 1,178 1,015 761 1,572
MAGMA COPPER CO.Copper Cities 3,806 4,351 3,984 3,622 2,046Pinto Valley/Miami 11,703 12,636 11,184 15,736 26,958 24,632 25,602 23,947 22,252 22,724San Manuel (5 -- -- -- -- -- -- -- -- 21,923 51,278
PHELPS DODGE CORPORATIONCopper Queen Branch 7,932 7,316 6,052 4,600 4,545 5,200 3,493 4,144 3,454 2,730Morenci Branch 51,362 93,983 86,840 96,090 75,735 69,158 60,312 53,228 56,261 45,249New Cornelia Branch - - - - - - - - 661 - - 920 402
(continued)

TABLE II (CONT)
ARIZONA LEACH COPPER PRODUCTION (1
(Thousand Pounds)
MINE OPERATION 1978 1979 1980 1981 1982 1983 1984 1985 1986 1987
RANCHERS EXPLORATION lDEVELOPMENT CORPORATION
(Now HECLA MINING CO.)Bluebird (6 3,926 10,955 13,017 13,328 NROld Reliable -- 1,005 1,128 149
TOTALS 283,482 285,606 282,846 352,246 334,451 285,028 285,160 266,958 300,169 341,842
PERCENT OF PRIMARY COPPERPRODUCED (7 13.9 13.3 16.4 15.0 19.6 18.8 18.0 15.0 17.1 19.8
'".....
(1 Copper recovered by precipitation or by solvent extraction from material dump, heap, vat or in situ leached.(2 Asarco purchased Ray Unit from Kennecott November 18, 1986.(3 Hecla Lakeshore through 3/31/79; Noranda Lakeshore through 6/31/87; Now Cyprus Casa Grande.(4 Cyprus purchased Sierrita/Esperanza and Mineral Park from Duval April 1, 1986.(5 Open Pit, Heap Leach, SX-EW start-up in spring of 1986. Some In Situ test production.(6 Part of Inspiration since July, 1984.(7 Leach Copper compared to total copper produced as reported in this report, Table I.
Source: Arizona Department of Mines and Mineral Resources; This report, Table I-II

Copper
TABLE III
RANK OF ARIZONA'S COPPER COMPANIES
BY PRODUCTION OF COPPER AND MOLYBDENUM
1987
Molybdenum
% of AZ % of AZRank Company Production Rank Company Production
1 Phelps Dodge Corp. 31.0 1 Cyprus Minerals Co. 80.8533,299,000 20,887,000
2 Magma Copper Co. 22.8 2 Magma Copper Co. 16.0393,278,000 4,153,000
3 Cyprus Minerals Co. 20.2 3 Phelps Dodge Corp. 3.2348,595,000 821,000
4 Asarco Inc. 19.9343,341,000
5 Inspiration Cons. 6.1105,555,000
Total 1,724,068,000 100.00 25,861,000 100.00
28
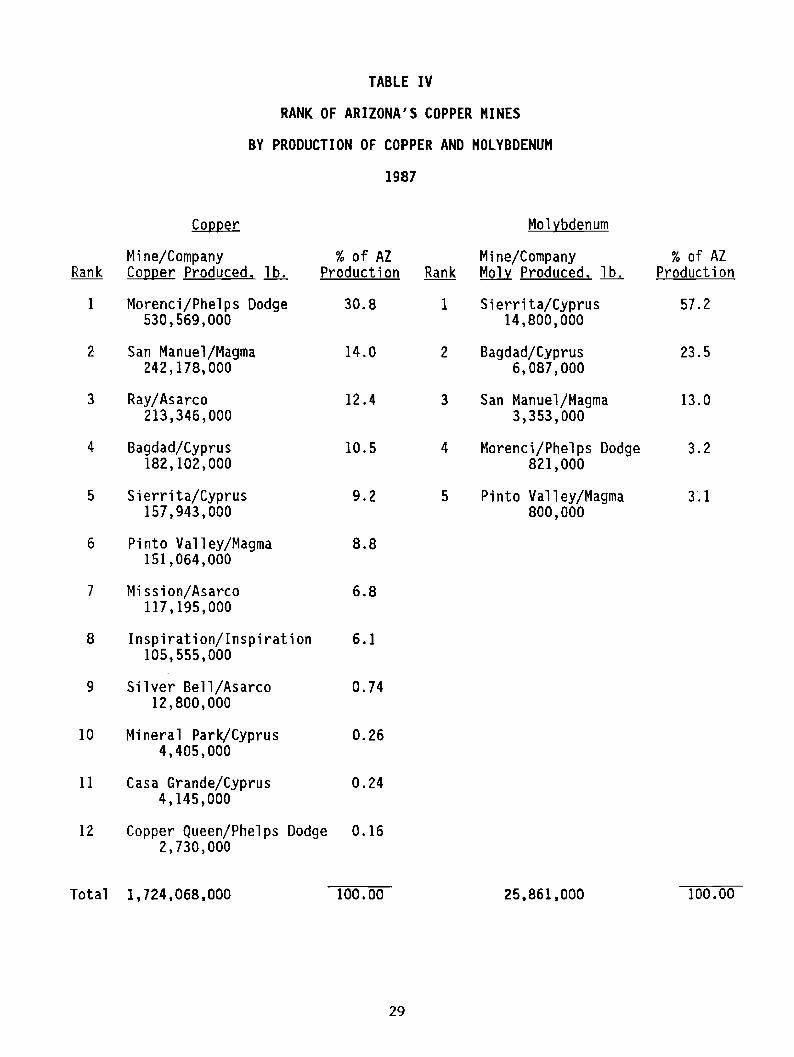
TABLE IV
RANK OF ARIZONA'S COPPER MINES
BY PRODUCTION OF COPPER AND MOLYBDENUM
1987
Copper Molybdenum
Mine/Company % of AZ Mine/Company % of AZRank Copper Produced, 1b. Production Rank Moly Produced, lb. Production
1 Morenci/Phelps Dodge 30.8 1 Sierrita/Cyprus 57.2530,569,000 14,800,000
2 San Manuel/Magma 14.0 2 Bagdad/Cyprus 23.5242,178,000 6,087,000
3 Ray/Asarco 12.4 3 San Manuel/Magma 13.0213,346,000 3,353,000
4 Bagdad/Cyprus 10.5 4 Morenci/Phelps Dodge 3.2182,102,000 821,000
5 Sierrita/Cyprus 9.2 5 Pinto Valley/Magma 3.1157,943,000 800,000
6 Pinto Valley/Magma 8.8151,064,000
7 Mission/Asarco 6.8117,195,000
8 Inspiration/Inspiration 6.1105,555,000
9 Silver Bell/Asarco 0.7412,800,000
10 Mi nera1 Park/Cyprus 0.264,405,000
11 Casa Grande/Cyprus 0.244,145,000
12 Copper Queen/Phelps Dodge 0.162,730,000
Total 1,724,068,000 100.00 25,861,000 100,00
29

TABLE VARIZONA MINE PRODUCTION
OF RECOVERABLE COPPER IN SHORT TONS
1983 1984 1985 1986 1987AMOUNT CHANGE AMOUNT CHANGE AMOUNT CHANGE AMOUNT CHANGE AMOUNT CHANGE
BY MONTH
JANUARY 68,560 (19.0)% 68,096 0.4% 72,508 6.5% 78,138 7.8% 71,375 (8.7)%FEBRUARY 54,455 (30.1 ) 62,432 9.8 67,823 8.6 67,524 (0.4) 65,046 (3.7)MARCH 66,475 (26.5) 66,058 0.4 76,717 16.1 72,834 (5.1 ) 72,226 (0.8)APRIL 61,841 (29.2) 61,076 (0.2) 75,928 24.3 70,306 (7.4) 67,221 (4.4)MAY 63,699 (13.3) 66,125 4.9 76,690 16.0 73,446 (4.2) 69,413 (5.5)JUNE 65,449 (2.6) 71,133 9.8 70,816 (0.4) 72,747 2.7 68,560 (5.8)JULY 54,653 (10.1 ) 70,235 29.9 72,534 3.3 74,009 2.0 67,631 (8.6)AUGUST 52,118 (8.2) 70,019 35.8 74,134 5.9 71 ,488 (3.6) 69,157 (3.3)SEPTEMBER 64,852 15.9 69,528 8.3 70,732 1.7 72,402 2.4 69,057 (4.6)OCTOBER 64,049 4.0 73,316 15.8 74,081 1.0 76,159 2.8 71 ,062 (6.7 )NOVEMBER 69,886 2.8 73,541 6.3 73,129 (0.6) 70,220 (3.6) 74,985 6.8
w DECEMBER 65,366 8.4 68,901 4.8 78,987 14.6 70,635 (10.6) 76,587 8.40
CUMULATIVE YEAR TO DATE
JANUARY 68,560 (19.0)% 68,096 0.4% 72,508 6.5% 78,138 7.8% 71,375 (8.7)%FEBRUARY 126,015 (24.5) 130,528 4.7 140,331 7.5 145,662 3.8 136,421 (6.3)MARCH 192,490 (25.2) 196,586 3.2 217,048 10.4 218,496 0.7 208,647 (4.5)APRIL 254,331 (26.2) 257,662 2.4 292,976 13.7 288,802 (1. 4) 275,868 (4.5)MAY 318,030 (23.9) 323,787 2.9 369,666 14.2 362,248 (2.0) 345,281 (4.7)JUNE 383,479 (21.0) 394,920 4.1 440,482 11.5 434,995 (1. 2) 413,841 (4.9)JULY 438,132 (19.8) 465,155 7.3 513,016 10.3 509,004 (0.8) 481,472 (5.4)AUGUST 490,250 (18.7) 535,174 10.3 587,150 9.7 580,492 (1.1) 550,629 (5.1)SEPTEMBER 555,102 (15.7) 604,702 10.1 657,882 8.8 652,894 (0.8) 619,686 (5.1 )OCTOBER 619,151 (14.1 ) 678,018 10.7 731,963 8.0 729,053 (0.4) 690,748 (5.3)NOVEMBER 689,037 (12.6) 751,559 10.2 805,092 7.1 799,273 (0.7) 765,733 (4.2)DECEMBER 754,403 (11.1) 820,460 9.7 884,079 7.7 869,908 (1. 6) 842,320 (3.2)
AVERAGE MONTH 62,867 (11.1)% 68,372 9.7% 73,673 7.7% 72,492 (1.6) 70,193 3.2
NOTE: Percentage change column shows change from corresponding period in prior year. Parentheses indicate anegative change.
Source: U.S. Department of the Interior, Bureau of MinesPrepared By: State of Arizona Joint Legislative Budget Committee

TABLE VI
AVERAGE COPPER CONTENT OF ORE PRODUCED AT ARIZONA COPPER MINES
(Percent Total Copper)
MINE OPERATION 1978 1979 1980 1981 1982 1983 1984 1985 1986 1987
ANAMAX MINING COMPANYTwin Buttes (I Sulfide 1. 26 0.94 0.82 0.74 0.78 0.67
Oxide 1.26 1.27 1.26 1.20 1.06 0.93 0.86 0.84
ASARCO INCORPORATEDMission (2 Sulfide 0.59 0.60 0.75 0.75 (0.75) (0.75) (0.75) 0.65 0.70 0.67Pima (2 Sulfide - - 0.46 0.49 0.49 0.48Ray Unit (3 (4 Sulfide 0.86 0.88 0.91 0.97 0.80 1.19 1.13 0.99 0.99 0.89
Oxide -- -- -- - - -- -- - - 1.17 1.23 1.15(Sil icate)
w Sacaton Sulfide 0.67 0.68.... San Xavier (2 Sulfide -- 0.80 0.65 0.65 (0.65) (0.51) (0.51)Silver Bell Sulfide 0.65
CYPRUS MINES CORPORATIONBa9dad Sulfide 0.52 0.50 0.50 0.50 0.50 0.50 0.45 0.44 0.45 0.48Esperanza (5 Sulfide - - -- 0.32 0.29 0.29Johnson Oxide 0.44 0.40 0.40 0.40 0.40 0.40 0.71Mineral Park (5 Sulfide 0.26 0.24 0.24 0.32Si errita (5 Sulfide 0.33 0.34 0.34 0.30 0.30 (0.30) 0.34 0.33 0.34 0.33
INSPIRATION CONSOLIDATEDCOPPER CO.
Christmas (OP) Sulfide -- 0.74 0.73 0.62Inspiration Area Sulfide 0.61 0.85 0.58 0.58 0.58 0.53 0.55 0.60 0.54
Oxide - - -- - - - - - - - - 0.50 0.49 0.57 0.59
(continued)

TABLE VI (CONT)
AVERAGE COPPER CONTENT OF ORE PRODUCED AT ARIZONA COPPER MINES
(Percent Total Copper)
MINE OPERATION 1978 1979 1980 1981 1982 1983 1984 1985 1986 1987
MAGMA COPPER COMPANYPinto Valley Sul fide 0.52 0.49 0.49 0.46 0.46 - - 0.44 0.45 0.45 0.36San Manuel Sul fide 0.64 0.63 0.65 0.64 0.66 0.64 0.64 0.61 0.62 0.62
Oxide - - - - - - -- - - - - - - - - 0.58 0.64Superior Sulfide 4.36 4.41 4.32 4.48 4.32
NORANDA LAKESHORE MINES INC.Lakeshore Oxide - - -- -- 1.00 1.00 (1.00) (1.00)
PHELPS DODGE CORPORATIONw Metcalf Sulfide 0.79 0.78 0.69 - - 0.78N Morenci (6 Sulfide 0.80 0.71 0.82 0.74 0.72 0.73 0.81 0.86 0.84 0.82
New Cornelia Sulfide 0.59 0.53 0.51 0.50 0.64 0.60 0.55
RANCHERS EXPLORATION lDEVELOPMENT CORPORATION
(Now HECLA MINING CO.)Bluebird (7 Oxide 0.70 0.40 0.40 0.40
WEIGHTED AVERAGESULFIDE GRADE (8 0.61 0.64 0.58 0.58 0.59 0.65 0.70 0.62 0.61 0.58
(continued)

TABLE VI (CONT)
AVERAGE COPPER CONTENT OF ORE PRODUCED AT ARIZONA COPPER MINES
( ) Percentage in parenthesis is approximate: not used in calculation of weighted average.
(1 Included ANAMAX share of Palo Verde deposit for 1979-1982.
(2 Combined as Mission Complex in 1985.
(3 Ray Unit acquired from Kennecott November 18, 1986.
(4 Grade reported for Ray Unit is an average of oxide and sulfide together through 1982.
(5 Sierrita, Esperanza and Mineral Park acquired from Duval Corp. April 1, 1986.ww (6 Combined Metcalf and Morenci mines production in 1983 et seq.
(7 Bluebird property acquired by Inspiration in 1984.
(8 Weighted average grade of ore milled, based generally on an assay of total copper.
Source: Company annual reports, Form lO-K's and Prospectus; Personal correspondence and ArizonaDepartment of Mines and Mineral Resources.

TABLE VII
PERCENT CONTAINED COPPER RECOVERED AT ARIZONA COPPER MINES (1
(Percent of Total Copper)
(continued)

TABLE VII (CONT)
PERCENT CONTAINED COPPER RECOVERED AT ARIZONA COPPER MINES (1
(Percent of Total Copper)
MINE OPERATION 1978 1979 1980 1981 1982 1983 1984 1985 1986 1987
MAGMA COPPER COMPANYPinto Valley Sulfide 89 84 83 94 95 -- 88 80 84 82San Manuel Sulfi de 85 83 95 87 89 86 90 90 90 85Superior Sulfide 90 91 95 93 (93 est)
PHELPS DODGE CORP.Metcalf Sulfide 61 59 58Morenci (7 Sulfide 77 68 64 69 68 71 70 86 76 74New Cornelia Sulfide 84 80 79 78 85 78 76
w RANCHERS EXPLORATION lVI DEVELOPMENT CORPORATION
(Now HECLA MINING CO.)Bluebird (8 (9 Oxide 85 36 41 156
(1 Recoveries are based on available reported production and average grade of material treated.(2 Recovery includes ANAMAX's share of Palo Verde 1979-1981-1982-1983-1984.(3 Combined as Mission Complex in 1985.(4 Ray Unit acquired from Kennecott, November 18, 1986.(5 Sierrita, Esperanza, and Mineral Park acquired from Duval Corp., April 1, 1987.(6 Percent recovery by leaching since 1986.(7 Includes Metcalf production, 1983-1985.(8 Bluebird property acquired by Inspiration in 1984.(9 Recovery by leaching heaps continued after mining was terminated in July 1981.
Source: Personal correspondence with individual companies.
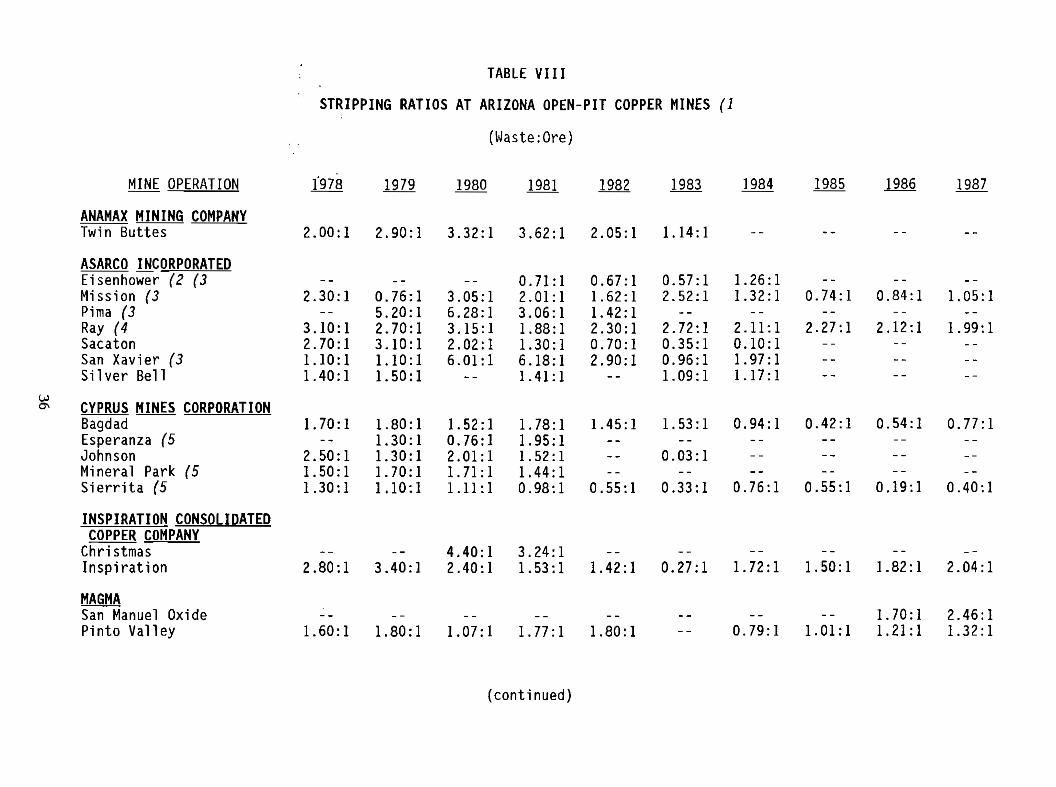
TABLE VI II
STRIPPING RATIOS AT ARIZONA OPEN-PIT COPPER MINES (1
(Waste:Ore)
MINE OPERATION 1'978 1979 1980 1981 1982 1983 1984 1985 1986 1987
ANAMAX MINING COMPANYTwin Buttes 2.00: 1 2.90:1 3.32:1 3.62:1 2.05:1 1.14:1
ASARCO INCORPORATEDEisenhower (2 (3 - - - - - - 0.71: 1 0.67:1 0.57:1 1. 26: 1Mission (3 2.30:1 0.76:1 3.05:1 2.01: 1 1. 62: 1 2.52:1 1. 32: 1 0.74:1 0.84:1 1. 05: 1Pima (3 -- 5.20: 1 6.28: 1 3.06:1 1. 42: 1Ray (4 3.10: 1 2.70:1 3.15: 1 1.88: 1 2.30:1 2.72:1 2.11:1 2.27:1 2.12:1 1.99: 1Sacaton 2.70:1 3.10:1 2.02:1 1. 30: 1 0.70:1 0.35:1 0.10: 1San Xavier (3 1.10:1 1.10:1 6.01:1 6.18: 1 2.90:1 0.96:1 1. 97: 1Silver Bell 1.40: 1 1. 50: 1 - - 1.41:1 - - 1. 09: 1 1.17:1
w
'" CYPRUS MINES CORPORATIONBagdad I. 70: 1 1.80: 1 I. 52: 1 I. 78: 1 I. 45: 1 I. 53: 1 0.94:1 0.42:1 0.54:1 0.77: 1Esperanza (5 -- 1. 30: 1 0.76:1 1. 95: 1Johnson 2.50:1 1. 30: 1 2.01: 1 I. 52: 1 -- 0.03:1Mineral Park (5 I. 50: 1 1. 70: 1 1.71:1 1.44:1Si errita (5 1.30: 1 1.10:1 1.11 :1 0.98: 1 0.55:1 0.33:1 0.76:1 0.55:1 0.19:1 0.40:1
INSPIRATION CONSOLIDATEDCOPPER COMPANY
Christmas -- - - 4.40:1 3.24:1Inspiration 2.80:1 3.40:1 2.40:1 1. 53: 1 1. 42: 1 0.27:1 1. 72: 1 1. 50: 1 1. 82: 1 2.04:1
MAGMASan Manuel Oxide - - - - - - - - - - -- - - - - I. 70: 1 2.46:1Pinto Valley 1.60: 1 I. 80: 1 I. 07: 1 1.77:1 1.80: 1 - - 0.79:1 1.01:1 1.21:1 I. 32: 1
(continued)
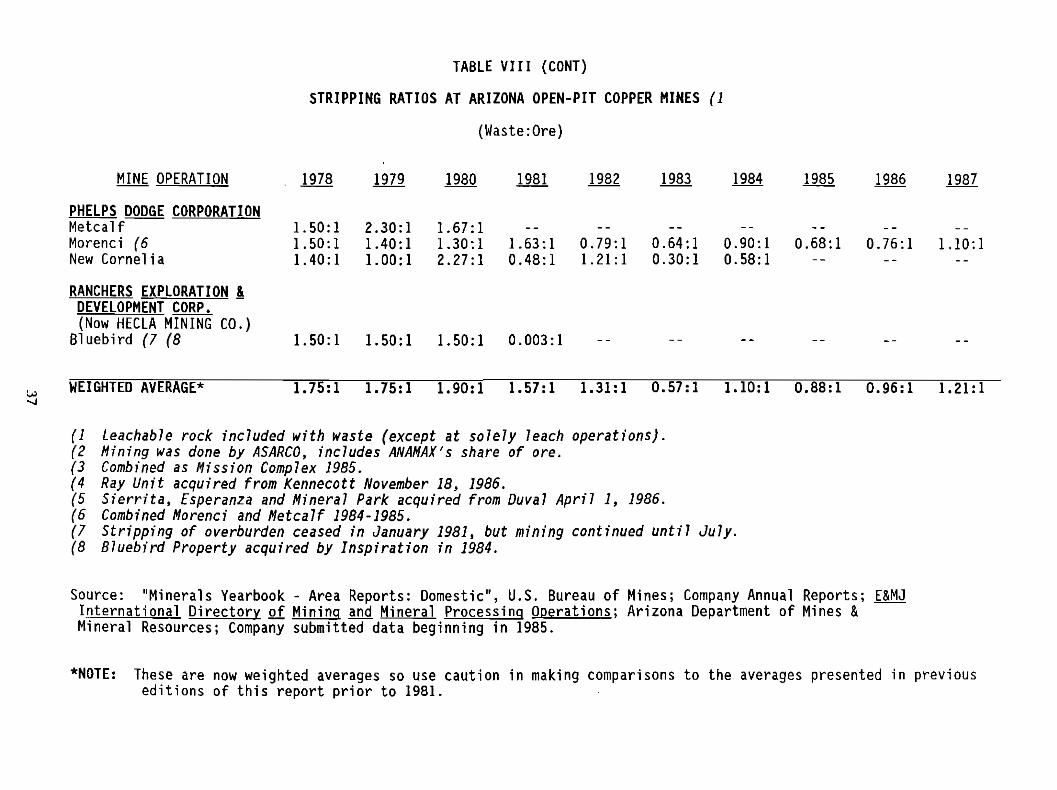
TABLE VIII (CONT)
STRIPPING RATIOS AT ARIZONA OPEN-PIT COPPER MINES (1
W-J
MINE OPERATION
PHELPS DODGE CORPORATIONMetcalfMorenci (6New Cornelia
RANCHERS EXPLORATION lDEVELOPMENT CORP.(Now HECLA MINING CO.)
Bluebird (7 (8
WEIGHTED AVERAGE*
(Waste:Ore)
1978 1979 1980 1981 1982 1983 1984 1985 1986 1987
1. 50: 1 2.30:1 1. 67: 11.50: 1 1.40: 1 1.30: 1 1.63: 1 0.79:1 0.64:1 0.90:1 0.68: 1 0.76:1 1.10:11. 40: 1 1. 00: 1 2.27:1 0.48:1 1.21:1 0.30:1 0.58: 1
1.50:1 1.50:1 1.50:1 0.003:1
1.75:1 1.75:1 1.90:1 1.57:1 1.31:1 0.57:1 1.10:1 0.88:1 0.96:1 1.21:1
(1 Leachable rock included with waste (except at solely leach operations).(2 Mining was done by ASARCO, includes ANAMAX's share of ore.(3 Combined as Mission Complex 1985.(4 Ray Unit acquired from Kennecott November 18, 1986.(5 Sierrita, [speranza and Mineral Park acquired from Duval April 1, 1986.(6 Combined Morenci and Metcalf 1984-1985.(7 Stripping of overburden ceased in January 1981, but mining continued until July.(8 8luebird Property acquired by Inspiration in 1984.
Source: "Minerals Yearbook - Area Reports: Domestic", U.S. Bureau of Mines; Company Annual Reports; E&MJInternational Directory of Mining and Mineral Processing Operations; Arizona Department of Mines &Mineral Resources; Company submitted data beginning in 1985.
*NOTE: These are now weighted averages so use caution in making comparisons to the averages presented in previouseditions of this report prior to 1981.

TABLE IX
ARIZONA PRODUCTION AND VALUE OF COPPER, MOLYBDENUM, GOLD AND SILVER
RECOVERED FROM COPPER ORE
Molybdenum (l ValueGold Sil ver 1,000 1bs. Copper {2 Copper (2 of Copper
Copper Ore Troy Ounces Troy Ounces Value Pounds Lbs. Culton ore Gold, SilverYear Tons Value 1.l Value 11 1..in $1.000) Value Ave. LJ...!h li ~ Molvbdenum
1972 165,914,825 102,526 6,614,957 27,126 1,695,858,000 10.225,987,518 11,143,226 46,791 858,392,446 50.617 922,314,190
1973 181,311,945 102,376 7,164,988 37,657 1,735,012,000 9.5710,013,397 18,325,173 59,372 1,021,314,814 58.865 1, 109,025,384
1974 178,913,296 90,206 6,308,721 28,346 1,609,808,000 9.00
"" 14,488,424 29,701,332 57,067 1,233,901,735 76.649 1,335,158,49100
1975 168,750,152 82,759 6,190,805 25,030 1,502,978,000 8.9113,364,751 27,354,196 61,411 954,917,072 63.535 1,057,047,019
1976 194,136,559 97,961 7,308,395 31,073 1,912,430,000 9.8512,276,473 31,816,805 89,148 1,316,210,823 68.824 1,449,452,101
1977 168,641,401 87,874 6,696,415 34,574 1,705,240,000 10.1113,032,593 30,957,660 120,497 1,122,184,339 65.808 1,166,295,089
1978 178,204,491 92,508 6,611,781 33,029 1,817,670,000 10.2017,905,108 35,709,502 150,142 1,190,755,617 65.510 1,244,520,369
1979 203,977 ,408 99,549 7,454,306 35,101 1,914,501,095 9.3930,622,766 82,699,941 213,065 1,767,735,441 92.334 2,094,081,895
1980 169,650,401 71,533 5,640,703 36,299 1,521,850,812 8.9743,814,606 116,376,559 324,150 1,543,400,219 101.416 2,027,741,384
(continued)

TABLE IX (CONT)
ARIZONA PRODUCTION AND VALUE OF COPPER, MOLYBDENUM, GOLD AND SILVER
RECOVERED FROM COPPER ORE
Mo1ybden urn (1 ValueGold Silver 1,000 lbs. Copper (2 Copper (2 of Copper
Copper Ore Troy Ounces Troy Ounces Value Pounds Lbs. Culton ore Gold, SilverYear Tons Value 11 Value il lin $1.000) Value Ave. Ll!h 1i ~ Mo lvbdenurn
1981 216,787,430 95,496 7,565,368 35,600 2,143,898,000 9.8943,891,299 79,575,340 273,052 1,795,385,941 83.744 2,191,904,580
1982 146,124,870 61,050 6,301,000 22,099 1,697,500,000 11.6222,949,000 50,090,000 100,673 1,261,415,000 74.31 1,435,127,000
1983 152,902,150 61,991 4,492,000 23,934 1,495,208,000 9.78w 26,284,000 51,383,000 79,459 1,144,285,000 76.53 1,301,411 ,000~
1984 145,278,431 51,548 4,093,000 23,184 1,582,549,000 10.8918,591,200 33,320,000 78,827 1,044,483,000 66.00 1,175,151,000
1985 159,547,970 52,053 4,885,000 30,428 1,778,334,456 11.1416,585,000 30,007,000 98,827 1, 166, 571 , 000 65.60 1,311,990,000
1986 153,439,000 63,334 4,202,000 29,382 1,752,525,000 11.4223,370,000 22,987,000 75,607 1,157,543,000 66.05 1,279,507,000
1987 166,113,000 48,991 (P 3,217,000 (P 15,939 1,724,068,000 10.3821,747,000 23,161,000 51,802 1,370,924,000 79.52 1,467,340,000
(1 Molybdenum content of recovered concentrate.(2 Excludes precipitate copper from dump and in-place leaching prior to 1982.(3 At average annual domestic, free market gold price.(4 At E&MJ average annual N.Y. market price for .999 fine silver.(5 At E&MJ average annual price, U.S. Producer Cathode Preliminary.(P Preliminary.

TABLE X
NONFUEL MINERAL PRODUCTION IN ARIZONA (1
19(16 1987 (P
Mineral Quantity Value Quantity Value(thousands) (thousands)
Clays ---------------------~-----------thousand short tons-- 201 $1,366 212 $1,482Copper (recoverable content of ores, etc.) ----metric tons-- 789,175 1,149,193 777,301 1,370,924Gem stones ------------------------------------------------- NA 2,533 NA 2,836Gold (recoverable content of ores, etc.) ------troy ounces-- 63,334 23,370 48,991 21,747Gypsum --------------------------------thousand short tons-- 260 1,820 262 1,832Lead (recoverable content of ores, etc.) ------metric tons-- W WLime ----------------------------------thousand short tons-- 50S 21,016 539 22,431Molybdenum --------------------------------thousand pounds-- 29,382 75,607 15,939 51,802Pumice -----------------------"--------thousand short tons-- 2 30 4 26Sand and gravel (construction) --------------------do------- 40,468 140,004 38,200 (e 140,500 (e
"" Silver (recoverable content of ores, etc.)0 thousand troy ounces-- 4,202 22,987 3,217 23,161
Stone (crushed) -----------------------thousand short tons-- 5,600 (e 25,100 (e 5,200 22,400Combined value of cement, perlite, pyrites (1985), salt(1986-87), sand and gravel (industrial), stone (dimension),and values indicated by symbol W--------------------------- XX 116,379 XX 124,239
Total ------------------------------------------------- XX 1,579,405 XX 1,783,380
(e Estimated.(P Preliminary.NA Not applicable.W Withheld to avoid disclosing company proprietary data; value included in "Combined value" figure.XX Not applicable.(1 Production as measured by mine shipments, sales, or marketable production (including consumption by producers).
Source: "The Mineral Industry of Arizona in 1987" Mineral Industry Surveys, U.S. Bureau of Mines.

TABLE XI
COPPER MINE CAPACITY IN ARIZONA (1(Short tons of Recoverable Copper/Year)
OPERATOR CAPACITY
Phelps DodgeMagmaAsarcoCyprusMagmaCyprusInspirationASARCOPhelps DodgeCyprusCyprusInspirationMagmaMagmaPhelps Dodge
TOTAL
Morenci/MetcalfSan ManuelRaySierrita/EsperanzaPinto ValleyBagdadInspiration AreaMission ComplexNew CorneliaMineral ParkCasa GrandeChristmasMiamiCopper CitiesCopper Queen/Lavender
270,000130,000122,000120,00085,00085,00077,00062,00040,00017,00016,0008,0006,0002,0002,000
1,042,000
1) Figures generally represent a current estimate of the productivecapacity of primary recoverable copper in concentrates,precipitates, and cathodes. Figures do not representsmelter or refinery capacity. The estimates are based onrecent production figures and on capacities of concentratorand leach plant facilities. Other factors affecting actualproduction include, for example, grade of ore and recovery.Some capacities have been published by the reportingcompany.
Source: Arizona Department of Mines &Mineral Resources file data;Company Annual Reports and Form 10-K; Professional Publications.
41

TABLE XII
MINE PRODUCTION OF COPPER IN THE UNITED STATES
Short Tons
1983 1984 1985 1986 1987------------------------------------------------------ ----------------------------------------------------------ARIZONA 747,604 822,823 878,052 869,915 858,769
~ IDAHO 3,920 4,080 3,914 (b) (b)'"
MISSOURI 8,515 6,413 14,782 (b) (b)
MONTANA 36,748 24,109 16,636 (b) (b)
UTAH 187, ll8 (b) (b) (b) (b)
OTHER STATES (a) 160,401 357,996 305,504 394,740 546,337
TOTAL 1,144,306 1,215,421 1,218,888 1,264,655 1,405,104
(a) Includes California, Colorado, Illinois, Michigan, Nevada, New Mexico and Tennessee.(b) Included in "Other States".
Source: American Bureau of Metal Statistics, Inc., Non-Ferrous Metal Data 1987, p. 25.Derived from U.S. Bureau of Mines data.
Company
ASARCO IncorporatedEl Paso SmelterHayden SmelterHayden-Ray Smelter
BP Minerals AmericaKennecott Utah Copper
Chemetco Inc.Copper Range CompanyInspiration Consolidated
Copper CompanyMagma Copper Company
San Manuel DivisionPhelps Dodge Corporation
Tyrone BranchTennessee Chemical CompanyTotal (a)
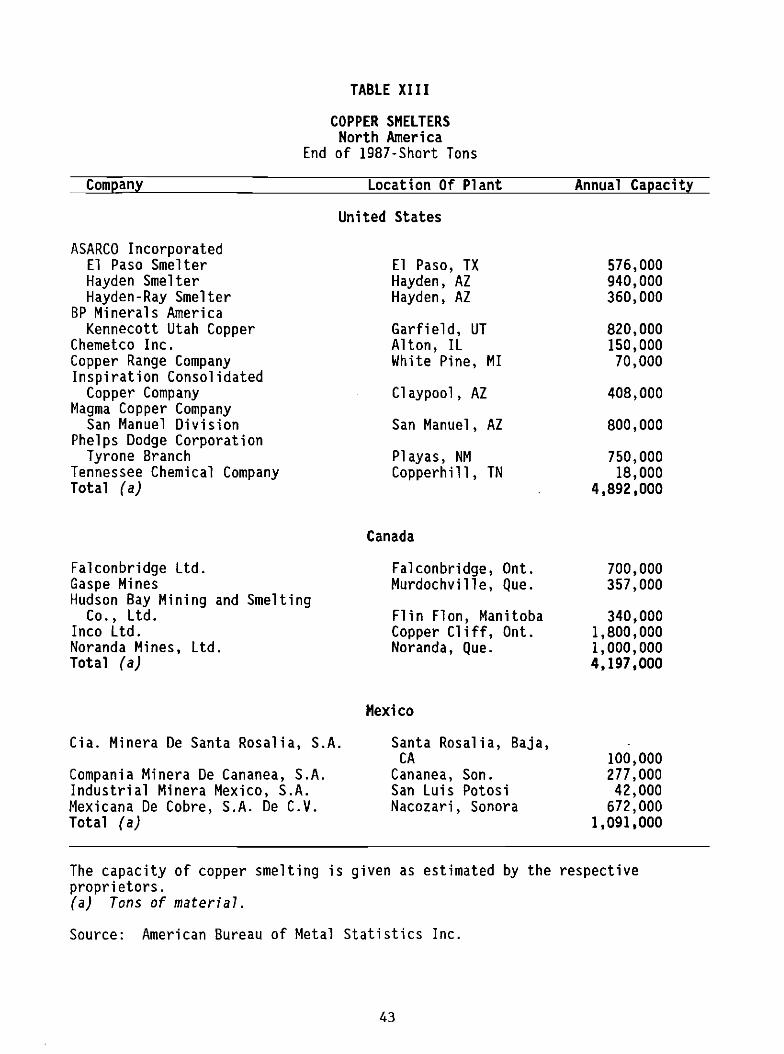
TABLE XIII
COPPER SMELTERSNorth America
End of 1987-Short Tons
Location Of Plant
United States
El Paso, TXHayden, AZHayden, AZ
Garfield, UTAlton, ILWhite Pine, MI
Claypool, AZ
San Manuel, AZ
Playas, NMCopperh ill, TN
Canada
Annual Capacity
576,000940,000360,000
820,000150,00070,000
408,000
800,000
750,00018,000
4,892,000
Falconbridge Ltd.Gaspe MinesHudson Bay Mining and Smelting
Co., Ltd.Inco Ltd.Noranda Mines, Ltd.Total (a)
Cia. Minera De Santa Rosalia, S.A.
Compania Minera De Cananea, S.A.Industrial Minera Mexico, S.A.Mexicana De Cobre, S.A. De C.V.Total (a)
Falconbridge, ant.Murdochville, Que.
Flin Flon, ManitobaCopper Cliff, ant.Noranda, Que.
Mexico
Santa Rosalia, Baja,CA
Cananea, Son.San Luis PotosiNacozari, Sonora
700,000357,000
340,0001,800,0001,000,0004,197,000
100,000277 ,00042,000
672,0001,091,000
The capacity of copper smelting is given as estimated by the respectiveproprietors.(a) Tons of material.
Source: American Bureau of Metal Statistics Inc.
43

TABLE XIV
COPPER PRODUCTION BY COMPANIES (gShort Tons
1983 1984 1985 1986 1987
United States
Anaconda Copper Company(own mines) (d 43,243 14,933
Anamax Mining Company 49,108 25,709 9,864ASARCO Incorporated 110,746 103,710 85,470 98,268 194,682BP Minerals America
(U.S. mines) (7 318,000 303,000 235,000 190,000 60,000Cominco American Incorporated
And Dresser Minerals (e 869 1,045 1,192 1,892 1,925Copper Range Company (f 26,575 24,761 31,298 53,053Cyprus Bagdad Copper Company 81,033 23,876 83,671 86,920 91,340Cyprus Casa Grande (m 879Cyprus Johnson Copper Company 4,859 4,401 3,100 2,436Cyprus Mineral Park 2,203Cyprus Pinos Altos 130Cyprus Sierrita Corporation 71,510 92,204 110,690 56,089 78,985Hecla Mining Company (a 1,283 742 749 346 289Coeur Mi ne (j 56 61 61 62 58Galena Mine (k 307 172 154 141 121Lucky Friday Mine 756 442 534 143 110Sunshine Mine 164 67
Inspiration ConsolidatedCopper Company (f 40,778 44,112 40,402 32,085 35,582
Magma Copper Company (n 99,705 120,345 108,642 112,513 197,013Pinto Valley Division 10,264 56,507 90,839 97,544 75,550San Manuel Division 99,705 120,345 108,642 112,513 121,463
Montana Resources 8,876 30,856Noranda Lakeshore Mines, Inc. (b 18,760 7,701 6,779 3,581Phelps Dodge Corporation(U.S. mines) (b 263,100 331,232 410,076 405,400 468,900
Tennessee Chemical Company 11,725 9,245 8,450 7,475 4,560
Refi ners (c 401,567 451,603 442,705 439,612 447,717AMAX Copper; Inc. 126,799 105,226 28,508ASARCO Incorporated 274,768 346,377 414,197 441,612 447,717
(a Includes Hecla's share of production from each mining property.(b Includes copper produced from purchased ores.(c The totals for these concerns are to a large extent duplications of the reports
of other producers.(d Includes Anaconda's 50% share of Anamax Mining Company.(e Magmont mine.(f Refined production.(g Copper content of mine production unless otherwise noted.
(continued)
44

TABLE XIV (CONT)
(h Mine abandoned in 1979.(i Mine abandoned in 1981.(j Operated by ASARCO - Shows Hecla Mines share of 5%.(k Operated by ASARCO - Shows Hecla Mines share of 25%.(I Reported production of refined copper plus unrefined copper sales. Includes
only Kennecott's share from jointly owned properties.(m Formerly Noranda Lakeshore.(n Refined copper contained in concentrates produced and SX-EW production.
Source: American Bureau of Metal Statistics.
45

TABLE XV
Copper Imports Of The United States By Countries
Copper Content-Short Tons
1983 1984 1985 1986 1987
Ore, Matte &Regulus 102,807 17 ,075 7,710 5,977 12,765Canada 41,304 4,084 2,820 2,147 4,093Mexico 34,350 249 19 6,753Honduras 2,260 254 83Argentina 18Bolivia 26 7Chile 7,596 2,597 77 71Peru 4,407 1,175 1,265 1,431 1,474Venezuela 664Netherlands 433 166India 3Japan 11 218 524 639Phil ippines 9,270 6,313Taiwan 18Botswana 1South Afri ca 363 108Australia 2,786 1,998 2,150 1,671 438
Blister Copper 87,588 66,340 28,635 51,049 47,991Canada 4,547 5 2,559 3,248 15Mexico 10,206 7,610 2,117 20,068 15,457Argentina 1,808Chile 66,255 51,555 19,823 27,409 21,532Peru 3,803 6,902 3,819 2,921Belgium 95Germany, F. R. 19 76 72 269 2,189United Ki ngdomEgypt 854 5,782Zambia 55Other Countries 96 192 245
Refined Cathodes &Shapes 532,399 555,968 415,675 541,990 556,973Canada 100,669 202,957 141,085 219,969 231,078Mexico 1,780 1,419 611Chile 297,368 169,826 167,548 164,436 159,915Peru 34,458 58,509 38,714 59,035 46,716Belgium 6,363 13,359 5,865 2,386 702Finland 78 139 119 59France 20 63 43Germany, F.R. 1,097 441 1,209 34,680Italy 21 20 20Netherlands 40 80 7,043Norway 279 1,959 886 205Sweden 26,788Un ited Kingdom 346 41 3,541 6,381
(continued)
46

TABLE XV (CONT)
1983 1984 1985 1986 1987
Yugoslavia 4,629Japan 10,120 4,163 5,241 661South Korea 3,307 910 2,393Phil ippines 1,050Taiwan 300Congo (Brazzaville) 3,155Ghana 3,816South Africa 15,114 555 6,453 11,101 5,046Zaire 32,082 30,907 30,057 39,688 26,446Zambia 27,221 64,501 9,821 32,714 21,834Australia 3,270 8China 165Other Countries 3,218 912 1,706 75
Waste &Scrap (unalloyed) 25,450 25,362 25,368 29,984 36,510
Waste &Scrap (alloyed) 34,597 34,267 25,591 31,635 36,528
Copper in Rolls, Sheets or Rods 26,620 43,007 41,870 41,473 33,510Canada 6,027 12,014 14,202 10,386 12,466Mexico 188 11 134 137Argentina 100Brazil 2,829 3,792 2,333 2,454 1,338Chile 1,220 1,949 1,486 7,277 2,666Peru 299 662 909 619 747Belgium 226 169 1,068 880 104Finland 1,147 2,715 2,208 2,180 3,087France 2,264 1,916 1,808 704 75Germany, F.R. 4,182 10,020 7,451 6,468 3,466Italy 347 1,401 975 907 391Netherlands 57 50 129 210 308Sweden 1,389 2,408 3,151 2,843 1,572United Ki ngdom 91 166 135 312 258Yugoslavia 883 433 696 479 311Japan 3,392 4,604 3,559 3,664 4,408South Korea 538 213South Africa 265 143 412 528 14Zaire 550Australia 1,038 264 154 535 1,211Other Countries 770 225 1,022 489 88
Copper Seamless Tube &Tubing 27,499 32,694 32,398 42,485 49,416Canada 3,778 5,767 5,502 6,490 6,451Mexico 5,449 3,281 955 6,496 12,180Braz i1 707 224 120Chile 140 151 297 400 315Austria 55Belgium 20Finland 714 970 236 265France 183 219 446 416
(continued)
47

TABLE XV (CaNT)
1983 1984 1985 1986 1987
Germany, F.R. 327 729 837 702 603Greece 30Italy 289 1,476Portugal 31Sweden 115Switzerland 25United Kingdom 27 164 126 295 187Japan 16,840 20,394 22,833 26,514 27,016South Korea 92Other Countries 933 598 428 617 19
Brass Rods, Sheets, Plates,Bars &Strip 58,297 93,024 68,028 63,946 54,430
Canada 3,580 5,572 3,482 2,292 3,823Mexico 1,795 1,234 190 1,503 4,513Argentina 198 329 695 2,163 1,680Brazil 5,813 15,101 8,929 7,098 2,985Peru 484Belgium 289 404 409 225Denmark 256France 5,470 12,363 6,081 5,400 3,249Germany, F.R. 19,764 26,906 18,575 16,390 10,785Italy 1,384 3,182 3,591 2,592 1,449Netherlands 4,247 6,728 5,449 5,048 5,918Sweden 290 607 1,808 774 718Switzerland 1,343 1,432 1,789 2,428 2,422United Kingdom 810 1,403 686 456 892Yugoslavia 939 2,306 1,557 1,590 1,749Israel 1,259 1,322 1,141 1,095 1,064Japan 8,159 7,059 7,481 8,771 7,880South Korea 3,618 444South Africa 819 1,188 648 630 444New Zealand 399Hungary 858 796 539 684 1,442Poland 1,156Other Countries 1,205 5,026 4,920 1,414 453
Copper &Alloyed Foil (a 28,008 39,717 33,951 31,129 37,590Canada 5,205 7,900 5,763 5,219 6,830Belgium 93 46 192France 308 544 36 18Germany, F.R. 769 2,061 1,033 1,057 2,451Ireland 601Netherlands 7,976 9,047 8,968 8,978 10,353Sweden 10,529 13,785 13,732 13,248 14,856United Kingdom 1,109 2,488 631 518 437Japan 1,661 2,533 2,303 1,518 1,727Other Countries 358 1,313 1,485 591 125
(continued)
48

TABLE XV (CONT)
1983 1984 1985 1986 1987
Brass Seamless Tube &Tubing 17 ,259 22,798 20,212 21,171 18,786Canada 3,447 4,303 2,443 1,025 1,154Mexico 143 672 185 918 958Braz i1 174 500 359 575 136Chile 90Belgium 59France 335 77 39 36Germany, F.R. 7,919 10,457 9,340 9,438 8,545Greece 59 225 116 127 317Italy 252 504 1,282 1,537 101Netherlands 392 250 51Portugal 164 170Spain 2 9 2Switzerl and 12 19 44 86United Kingdom 132 326 211 130Yugoslavia 307 674 592 535 390Israel 156 270 311 332 364Japan 3,897 3,619 3,665 4,049 4,155South Korea 175 459 444 719 479South Afri ca 44 4 699 1,289 1,364Other Countries 205 288 230 463 201
Copper Alloyed Wire 4,334 5,362 4,757 8,026 8,439
Copper Wire Insulated (b 44,977 68,190 83,016 95,201 103,597Canada 22,704 36,057 36,393 33,491 34,523Mexico 2,129 5,592 6,683 10,528 23,276Costa Rica 2,757 2,350Brazil 2,317 3,893 5,904 4,141 3,157Chile 669 132 918 1,444 829Peru 1,156 356 5,251 4,499 3,587Venezuela 3,427 3,276France 1,129 1,699 2,598 2,538 4,130Germany, F.R. 614 1,127 921 1,171Italy 1,016 2,169 3,111 3,011 1,763Spain 258 1,025 3,227 4,205 3,728Sweden 62 49 85 59United Kingdom 1,085 789 718 277Yugoslavia 2,846 1,837 2,595 2,898 3,072Israel 472 732 810 616Japan 4,952 3,396 3,149 6,862 4,329South Korea 794 488 3,274 5,797 4,914Taiwan 5,563 7,342Other Countries 2,774 8,849 7,379 4,040 1,198
(a) Metal weight. (b) Gross weight.
Source: American Bureau of Metal Statistics Inc., U.S. Bureau of the Census.Current monthly data available, report 010, for the above table on an annual subscriptionbasis.
49

TABLE XV (CONT)
Copper Exports of the United States by Countries
Copper Content-Short Tons
1983 1984 1985 1986 1987
Ore, Concentrate &Matte 47,110 67,240 128,206 192,183 137,512Canada 92 87 3,050 6,993 2,013Belgium 212 100Finland 5,096 7,968Germany, F.R. 7,696 1,694 976Netherlands 11Yugoslavia 4,113India 124 33 111Israel 2Japan 32,330 62,004 113,352 145,103 109,737South Korea 3,195 7,628 15,548 5,681Taiwan 6,868 4,076 5,505 4,162China 13,771 2,723Other Countries 167 28
Blister Copper 8,213 9,237 19,817 17 ,598 13,600Canada 397 430 408 437 922Mexico 15 47 2,804 303Chile 28 4Venezuela 72Austria 556Belgium 26 784Germany, F. R. 141 257 100Netherlands 276Portuga1 125 281Spain 100 5Un ited Kingdom 15Hong Kong 68 213 6 185 784Indonesia 193Japan 8 18 776 4,706South Korea 7,194 6,480 16,177 14,879 5,122Philippines 98Singapore 15 72 76 94 112Taiwan 68 84 93 636 521Australia 139 380Other Countries 321 100 246 227 86
Refi ned Ingots, Bars, Etc. 96,482 103,532 53,037 16,446 19,784Canada 2,739 4,513 6,165 5,357 4,943Mexico 9,613 3,288 12,729 317 4,674Dominican Republic 46Brazil 3 123 53 126 501Venezuela 19 13 27 149 134Belgium 812 51 671 391France 708 955 318 516 535
(continued)
50

TABLE XV (CONT)
1983 1984 1985 1986 1987
Germany, F.R. 2,423 1,401 1,439 1,533 514Italy 218Netherlands 66,941 7,387 19,343 305 276Spain 69 126 2Sweden 134 9 76Switzer1and 65 46 40 108 49United Kingdom 486 1,080 806 2,469 1,185Hong Kong 32 168 1,050 661 458India 86 32 24 61Israel 13 14 30 2Japan 8,031 78,568 5,605 3,036South Korea 6 1,737 1,146 1,473 2,063Sin9apore 3 64 2Taiwan 1,130 3,539 1,609 2,835 658Ghana 246Australia 14 7 4China 2,375 55 25Other Countries 780 356 1,875 351 38
Copper Waste &Scrap (unalloyed) 52,897 89,075 148,040 150,375 119,636Canada 14,742 12,399 18,277 15,149 12,273Mexico 9,373 14,915 13,507 6,488 13,533Brazil 1,875 4,374 3,326Venezuela 217Belgium 2,677 2,209 10,383 3,552 2,154Finland 97France 19 57 182Germany, F.R. 757 3,270 18,654 9,385 4,774Italy 839 7,553 13,585 6,769Netherlands 172 1,085 4,395 1,887 406Spain 399 2,058 5,292 6,191 8,877Sweden 61 487 234 2United Kingdom 486 572 4,303 1,637 822Hong Kong 79 446 1,590 6,312 3,656Indi a 2,563 1,288 1,102 792 545Japan 3,822 16,878 14,829 13,835 17,141South Korea 16,348 14,528 15,284 13,632 10,650Phil ippines 1,045Singapore 1,062 754 1,262Taiwan 1,341 17,539 27,650 51,694 31,651Thail and 9 8 8Australia 78 58 157China 210Other Countries 49 419 2,864 1,108 69
Copper-Base Alloy,Waste &Scrap (a) 88,472 115,659 160,791 167,121 204,236
Canada 19,117 33,638 26,421 22,628 23,321Mexico 6,016 2,655 4,239 935 6,308Trinidad 776
(continued)
51

TABLE XV (CONT)
1983 1984 1985 1986 1987
Brazil 401 4,363 7,037Venezuela 1 262 374 141Austria 310Belgium 5,229 3,422 6,960 6,187 8,019France 299 224 227 106Germany, F.R. 2,909 3,996 18,814 5,325 8,513Italy 3 2,695 9,804 21,608 7,177Netherlands 2,154 664 4,315 1,644 885Spain 490 1,391 7,638 8,595 6,911Sweden 5,897 2,821 1,994 2,587 1,763Switzerland 495 513 713 180United Kingdom 482 601 2,296 4,486 2,975Yugoslavia 132Hong Kong 391 258 1,285 576India 4,289 9,113 15,235 18,254 13,079Japan 17,765 28, III 27,328 28,317 26,500South Korea 9,421 8,315 13,692 15,837 28,761Phil ippines 126Singapore 155 771 344 255Taiwan 13,291 16,023 16,231 24,153 60,249China 198Other Countries 68 186 2,749 2,202 70
Copper &Alloyed Foil 223 327 195 667 1,125Canada 84 114 12 246 532Mexico 7Honduras 25Venezuela 181Germany, F. R. 13 6 6 6 25Netherlands 4 2United Kingdom 9 7 19Bahrain 3Hong Kong 62India 6Japan 9 11 22 8 8South Korea 7 5 6 7 76Kuwait 31Qatar 36Saudi Arabia 7Singapore 5Taiwan 33 171 76 121 173Thailand 13 11United Arab Emirates 115 31New Zealand 3Other Countries 77 20 73 8 14
Pipes &Tubes 3,991 4,270 5,004 5,890 7,128
Plates &Sheets 1,511 5,122 866 708 594
(continued)
52

TABLE XV (CONT)
Unalloyed Copper Bars, Angles,Shapes, Sections &Rods
Wire &Cable, Bare
Insulated Wire &Cable (b)Building Wire &CablePower Wire &CableCommunication Wire &CableCopper Magnet WireAppliance Wire &CordOther Insulated Wire &Cable
Blister Copper (c)
Refined Copper (c)CanadaMexicoBrazilGermany, F.R.NetherlandsJapanSouth KoreaTaiwanChina
10,405
9,163
67,7146,0047,388
23,8253,6795,779
21,039
718661
54
3
13,338
9,677
65,1363,8796,622
21,2113,5894,511
25,324
2,0069
1,005
551
441
7,396
8,775
54,7542,2656,852
13,4892,9055,950
23,293
7
16,73612
369
10,148
6,207
9,848
7,915
65,2172,9246,338
21,3042,2796,311
26,061
4
69227
665
15,611
11,237
95,2112,852
13,61030,1083,2445,189
40,208
11
11
(a) Meta7 weight. (b) Gross weight. (c) Re-exports, imported foreign merchandise.
Source: American Bureau of Metal Statistics Inc., U.S. Bureau of the Census.Current monthly data available, report 011, for the above table on an annual subscriptionbasis.
53

TABLE XVI
"COVERED EMPLOYMENT" AND WAGES IN ARIZONA COPPER MINING AND SMELTING
Average No. Average Average TonsCovered Total Annua1 Weekly Copper
Year Employees 11 Wages Wage Wage Ore
1948 11,493 41,318,524 3,595 69.13 39,072,2041949 11,001 40,612,224 3,692 71.00 37,365,611
1950 10,181 41,994,321 4,125 79.33 41,757,2731951 10,754 47,825,698 4,447 85.52 42,784,3881952 11 ,365 54,950,235 4,835 93.14 44,472,5221953 12,068 62,742,982 5,199 99.98 45,187,8381954 12,502 65,518,853 5,241 100.79 43,072,894
1955 12,399 71,293,263 5,750 110.58 52,189,7281956 14,008 83,568,996 5,966 114.73 60,468,580
LJ1 1957 14,652 85,125,320 5,809 111.71 59,571,834.,..1958 14,100 74,726,972 5,300 101. 93 56,255,8091959 11,568 72,095,130 6,232 119.85 53,121,545
1960 13,764 90,312,848 6,562 126.19 66,032,4391961 14,275 97,271,286 6,814 131.04 71,918,9911962 14,408 101,920,108 7,074 136.04 78,868,1471963 14,303 104,291,588 7,292 140.23 80,615,1321964 14,720 113,792,031 7,730 148.65 86,132,039
1965 15,239 122,163,124 8,016 154.16 92,859,5351966 17,018 137,187,611 8,061 155.02 101,558,2981967 13,426 108,427,206 8,076 155.31 74,289,2031968 15,734 136,089,579 8,649 166.33 101,293,9631969 19,459 173,183,018 8,900 171.15 127,848,828
1970 21,479 201,665,064 9,389 180.56 150,241,0001971 21,231 211,978,597 9,984 192.00 149,294,0001972 23,233 254,717,341 10,964 210.85 165,914,825 (21973 25,494 291,294,328 11,426 218.89 181,311,9451974 27,894 340,832,096 12,219 234.98 178,913,296
(continued)

TABLE XVI (CONT)
"COVERED EMPLOYMENT" AND WAGES IN ARIZONA COPPER MINING AND SMELTING
Average No. Average Average TonsCovered Total AnnuaI Weekly Copper
Year Employees 11 Wages Wage Wage Ore
1975 25,950 363,349,178 14,002 269.27 168,750,1521976 25,631 405,289,034 15,812 304.08 194,136,5591977 23,373 398,539,789 16,835 323.75 168,641,4011978 21,092 397,790,419 18,860 362.69 178,204,4911979 23,239 494,963,476 21,299 409.60 203,997,408
1980 21,602 510,168,454 23,617 454.17 169,650,4011981 26,031 687,434,789 26,408 507.85 216,787,4301982 17,182 487,415,292 28,368 545.53 135,768,6471983 13,864 395,266,852 28,510 548.29 135,301,6521984 12,556 387,028,537 30,824 592.77 145,278,431
VIVI 1985 11 , 155 349,311,047 31,314 602.19 174,218,218
1986 10,848 326,915,975 30,136 579.54 167,808,0001987 10,340 299,297,407 28,946 556.65 166,113,000
{1 "Covered Employment" by law includes a77 employees of employers of three or more persons. Prior1966 only a portion of the workers in smelting, refining and rod fabrication were included inthis table.
(2 Mine production in short tons of lode ore from "Arizona, Mine Production by Class of Ore", reportby U.S. Bureau of Mines. In 1982 and thereafter the tonnage may include copper-zinc, copper-leadand lead-zinc ore combined to avoid disclosing individual company confidential data.
Source: This report, Table XVII; "Mineral Yearbook - Area Reports: Domestic", U.S. Bureau of Mines;Research and Statistics Unit, Arizona Department of Economic Security.

TABLE XVI I
ARIZONA INDUSTRIES COVERED BY UNEMPLOYMENT INSURANCE
YEAR - 1987
Average Average AverageNumber of Total Annua1 Weekly
Industrv Emo1ovees (1 Wages Wage Wage
Copper Mining 8,559 249,140,570 29,109 559.78Copper Smelting, Refining
&Rod Fabrication 1,781 50,156,837 28,162 541. 58
TOTAL COPPER MINING &PROCESSING 10,340 299,297,407 28,946 556.65
Other Mining, Quarrying &Processing 2,951 88,078,347 29,847 573.98
U1 ALL MINING, QUARRYING &PROCESSING 13,291 387,375,754 29,146 560.490"-
Mfg. Except Copper Processing 186,316 4,861,516,141 26,093 501. 79Construction 103,230 2,110,761,306 20,447 393.21Transportation, Utilities, etc. (2 62,439 1,581,919,452 25,335 487.22Wholesale-Retail Trade 341,323 4,827,141,741 14,142 271. 97Services, Finance &Misc. 422,457 7,977,698,389 18,884 363.15Agriculture &Related Services 31,874 367,748,251 11,538 221.88Federal, State &Local Government 226,693 5,096,435,789 22,482 432.34
TOTAL AND AVERAGES 1,387,623 ·27,210,596,823 19,610 377.11
(1 Includes all covered employees.(2 Transportation exclusive of railroads.
Source: Research Administration, Arizona Department of Economic Security

TABLE XVIII
$1,791,515,000VALUE OF
COPPER INDUSTRY OUTPUT
ACirculation and recirculation of the direct Impactof copper Industry spending creates a "rippleeHec'" that expands the direct economic impactof the copper Industry on Arizona to • totalImpact that .. ow. five times g......r than thedirect Impact llaen.
$834,980,000 TOWORKERS, SUPPLIERSGOVERNMENTS, ANDINVESTORS OUTSIDEOF ARIZONA
DIRECTBUSINESSINCOME$608,021,000
TOTAL TO BUSINESSES$3,915,321,000
TOTAL IMPACT: $5,794,607,000
DIRECT AND INDIRECT IMPACTSOF THE COPPER INDUSTRY ON THE ARIZONA ECONOMY
1987
Source: "The Copper Industry's Impact on the Arizona Economy -- 1987"by George F. Leaming, Western Economic Analysis Center, Marana, AZ
57

TABLE XIX
EMPLOYMENT, EARNINGS AND HOURS IN COPPER MINING
IN THE UNITED STATES AND ARIZONA (1
AllEmployees PRODUCTION WORKERS
Average No. Average No. Average Average Average Average Earnings Aggregate(Thousands) (Thousands) Weekly Weekly Hourly Per Man Man Hours
Earnings Hours Earnings Per Year (Thousands)
(2 (3 (4 (5 (6 (7 (8Period Ariz. U.S. Ariz. U.S. Ariz. U.S. Ariz. U.S. Ariz. U.S. Ariz. J.L..S.... Ariz. U.S.
1970 18.8 37.0 14.9 29.5 173.01 175.67 43.8 44.7 3.95 3.93 8,997 9,135 33,936 68,570VI 1971 18.9 34.7 14.9 26.8 178.50 178.46 42.4 42.9 4.21 4.16 9,282 9,280 32,852 59,78500 1972 20.5 38.9 16.1 30.7 194.69 192.19 41.6 41.6 4.68 4.62 10,124 9,994 34,827 66,410
1973 21.5 42.3 17.6 33.7 206.75 206.42 41.6 42.3 4.97 4.88 10,751 10,734 38,072 74,1271974 24.0 42.8 19.1 33.8 222.16 226.46 39.6 41.1 5.61 5.51 11,552 11,776 39,331 72,2371975 22.5 37.1 17.9 28.4 247.43 247.14 38.6 39.2 6.41 6.33 12,866 12,903 35,929 57,8911976 21.7 35.5 17 .2 27.0 286.31 280.70 40.1 40.1 7.14 7.00 14,888 14,596 35,865 56,3001977 19.3 35.1 15.3 26.9 302.99 288.73 39.4 38.6 7.69 7.48 15,755 15,014 31,347 53,9941978 17.2 35.2 13.7 26.9 344.76 338.40 40.8 40.0 8.45 8.46 17,928 17,597 29,066 55,9521979 19.3 31.9 15.3 24.6 404.81 405.03 42.3 42.5 9.57 9.53 21,050 21,061 33,654 54,3661980 17.7 29.4 14.0 22.6 446.19 435.01 41.7 41.0 10.70 10.61 23,202 22,621 30,358 48,1831981 21.9 36.2 17 .4 27.9 497.28 492.54 41.2 41.6 12.07 11.84 25,859 25,612 37,278 60,3531982 15.2 25.3 12.1 18.5 495.60 484.91 38.3 38.7 12.94 12.53 25,771 25,215 24,098 37,2291983 11.3 18.9 9.0 13.5 519.25 522.69 39.1 39.9 13.28 13.10 27,001 27,180 18,299 28,0101984 10.5 16.3 8.2 11.4 553.83 562.74 41.3 41.5 13.41 13.56 28,799 29,002 17,610 24,6011985 9.4 13.1 7.5 9.4 573.80 574.76 41.4 42.2 13.86 13.62 29,838 29,888 16,146 20,6271986 8.7 11.4 6.9 8.8 582.38 507.99 40.4 41.3 14.42 12.30 30,284 26,415 14,496 18,8991987 8.6 13.5 6.9 10.7 556.65 492.20 40.1 43.1 13.88 11.42 28,946 25,595 14,388 23,981
(continued)

TABLE XIX (CONT)
EMPLOYMENT, EARNINGS AND HOURS IN COPPER MINING
IN THE UNITED STATES AND ARIZONA (1
Worker ProductivityCopper Ore Mined Copper Produced Copper Ore Mined Copper Produced
(Thousand Short Tons) (Recoverable Content) Per Man-Hour Per Man-Hour(Thousand Pounds) (Tons) (Pounds)
Period Ariz. U.S. Ariz. U.S. Ariz. U.S. Ariz. U.S.
1970 150,241 257,729 1,826,734 3,368,957 4.427 3.759 53.829 49.1321971 149,294 242,656 1,633,568 2,986,599 4.544 4.059 49.725 49.995
\Jl 1972 165,815 266,831 1,816,118 3,264,113 4.761 4.017 52.161 49.151-.0 1973 173,605 289,998 1,847,635 3,386,357 4.872 3.912 48.530 45.683
1974 178,821 293,443 1,710,744 3,145,148 4.547 4.062 43.496 43.5391975 168,656 253,003 1,619,535 2,772,111 4.694 4.543 45.076 47.8851975 194,046 283,736 2,043,168 3,166,889 5.410 5.040 56.958 56.2501977 168,601 259,974 1,843,949 2,964,539 5.379 4.815 58.824 54.9051978 178,201 263,722 1,965,072 2,955,210 6.131 4.713 67.607 52.8171979 203,977 291,078 2,085,555 3,140,110 6.061 5.369 51.971 57.7591980 169,650 241,090 . 1,669,495 2,527,920 5.588 5.004 54.994 52.4651981 216,787 305,089 2,294,437 3,354,548 5.815 5.072 61. 549 55.5821982 146,125 200,589 1,697,500 2,507,070 6.064 5.388 70.442 67.3421983 152,902 196,203 1,514,538 2,288,612 8.356 7.005 82.765 81.7071984 145,278 189,499 1,583,505 2,405,866 8.250 7.703 89.921 97.7951985 174,218 239,399 1,778,334 2,443,675 10.790 11. 606 110.141 118.4701986 167,808 186,105 1,752,525 2,361,127 11. 576 9.847 120.897 124.9341987 166,113 219,545 1,724,068 2,810,182 11. 545 9.155 119.827 117.189
(continued)

0'o
TABLE XIX (CONT)
EMPLOYMENT, EARNINGS AND HOURS IN COPPER MINING
IN THE UNITED STATES AND ARIZONA (1
(1 Statistics do not reflect workers in copper smelting, refining and rod fabrication.
(2 These figures are estimates made by the Arizona Department of Economic Security, in cooperation with the U.SBureau of Labor Statistics, and they include all full and part-time wage and salary workers who were employedin copper mining in any part of the pay periods which included the 12th of each month of the year.
(3 Estimates made by the U.S. Bureau of Labor Statistics, in cooperation with the 50 states, and based uponmonthly samplings similar to those in (2 above, adjusted periodically to census bench mark.
(4 Estimates of production (non-supervisory) workers based upon samplings as in (2 above. Since 1975, figureshave been calculated by the Arizona Department of Mines and Mineral Resources dividing the annual number of"A77 Employees-Arizona" by a factor of 1.26. This factor was derived by comparing the annual number of "A77Employees-Arizona" with "Production Workers - Arizona" from 1970 to 1974.
(5 Earnings figures for a particular year is the product of "Average Hourly Earnings" and "Average Weekly Hours"for that year.
(6 Gross payroll aggregates, exclusive of irregular bonuses and other pay not earned in a sample pay period, aredivided by gross man-hour aggregates of production and related workers for the period in order to determineaverage hourly earnings.
(7 "Average Weekly Earnings" times 52 weeks.
(B Number of production workers times "Average Weekly Hours" times 52 weeks.
Source: Table I this publication, American Bureau of Metal Statistics, Research and Statistics Unit, ArizonaDepartment of Economic Security: "Mineral Yearbook - Metals, Minerals", U.S. Bureau of Mines."Employment and Earnings", March issues, U.S. Department of Interior.

Productivity of Arizona Copper WorkersTABLE XIX
ill,!
'1i
~
rt1
iJj/
f/
~'
.0"/
a"
'1Sl,
,",/ '
ra---' ,.1/I
t R /50 i r:r" 's... /
I ,/I S--.--2l I
40 +--r--,"-"" I -, I ----r--.---j-' I ,'----I-r·-,-l-'---11970 1971 1972 1973 1974 1975 1976 1977 1978 1979 1980 1981 1982 1983 1984 1985 1986 1987
130 TI
120 1
110 J!
i!!
100 --j,
I90 -1
ii
80 ~I
70 -II
60 ---J!
L.III0.0.oo
L.:Jo.cIc:oE",,00'......
Period

o
.......Ul
"UC:J00-
"UC0Ul:J .......o Ul.r: Cf- 0........-
cr--g2,N
u:J"U
~0-"-II)0.0.00
Copper Produced (Recoverable Content)TABLE XIX
3.5 I" . . -. ""'--" ----- ---.--.-- -.--------..----.--.-.-- --..-- ---"--- ..- ' -""'1
Ir~ ~Nrq ~ N ~ I3lN~NNN N~FlN N !
j\ N N N ~ ~ ~ N ~ N ~ RN N N N !~ ~"l N N N NNe ~
2.5- ~i N ~'j N N ~,I N' INN '~'-J N N N r'l ['1 "1I ~,'I ~, '" i N ~~ t- I ~ I h I N 1 f'... I ~ I '" ' "'! ~ I F:"l 'Ii " ''i I" l'i 'i ''i i"J I '1' !. I 'I P1"i I 'I r1 ''I . 'I . ''I '1I ~ N ~" :~ ~" ~'1 t'''! t'i N i'-..j N(T~ N ~,~ :"! ,.~ " '-~
2 -i 1"- '''! N N '< >.; ffi' l"1 ',,-; i "-i vN N ~-..: :"-' .'" '\ ""I 0.-.1 "I , t' "... N rt ,I I h.. ~ I ~1. ~'" '1 " • I ~l i ''" '1 Q "i '"i ,~r : ' (1''; r "l ! "I ~ '1 J I "i ".~ ,"i ." .''; ,
/I''i NP'i ('1'1 N ,~, I: k'l'-.l N vN N ." 0 pl\ PT'i_ ' "i: '-oj;o/ ~ V"I ~ ,'-i : • '" ' 'I~ i/ '-i v I (1"\ ( I '~ '-"; v' '-, ;
,"iV"l( ': :("oJ 'r iV v l"1'/"J1 IV 'v' ,V'\, ,(Nv 1; I v (' , I V 'v (' 'v I r ~ / '/ '! V ,,; v] \ ,,- "- ./ ''1,r 'v' 'i
I 1./ ... V v'll r/N''!'/ ',/1' v I 'I 1 I ". 1 ' .-..: /1'.~ " v ,,1'\ ~ 'v ! f-/ V ,.~ VN v vN v v "1'-.. V " >1"-.. v t
0.5 -1, N r/ ", i ( : ( /,,~ : '. : ( '~: ~ V ,V," ( '~/',,- " 1\ ( "-; :"-, "vt" v ,/ 'I f" ,,, V I V, Vr~ ( v "-; ( ~ vt'-..l/ll "-;,1"-..,, 1 ,r''', r t
~ / ''-j: ~ V I'-i ~'''',,- ( ,~t'i v1'1 ( ': v'~ , ~+"l$$f-'-' ~'\ i-/ ''\ ~/h~ v, ",,-; I ,~/ ' 'r': ,I '\i' '" I" i : / I V1''\ ' ",," 1
L "I"""" --'-+-~f-L-'-
19701971197219731974197519761977197819791980 1981198219831984198519861987
rL7 ·;1 Arizona_L_
PeriodL::::sJ U.S.

TABLE XX
REFINED COPPER INVENTORIES AT YEAR ENDAMOUNTS IN THOUSANDS OF SHORT TONS
Where Held 1983 1984 1985 1986 1987------------------------------------------------------ ------------------------------------
U.S. refineries 66.1 193.4 150.4 145.1 63.1
Comex warehouses 409.2 276.3 120.3 93.3 18.3
'" Total U.S. 475.3 469.7 270.7 238.4 81.4w
Refineries elsewhere 352.6 285.7 293.7 277 .1 210.0
LME warehouses 480.2 139.3 209.1 193.1 58.3
Total elsewhere 832.8 425.0 502.8 470.2 268.3
Aggregate inventories 1308.1 894.7 773.5 708.6 349.7
Source: American Bureau of Metal Statistics. All figures for December 31.

TABLE XXIAVERAGE QUOTED PRICE OF
ELECTROLYTIC COPPER WIREBARDOMESTIC, DELIVERED
U.S. /1 b. (J
1978 1979 1980 1981 1982 1983 1984 1985 1986 1987------------------------------------------------------------------------------------------------------JANUARY 62.625 76.574 119.385 88.570 78.634 80.219 68.792 64.487 69.881 64.986
FEBRUARY 63.593 89.697 133.808 86.071 78.779 84.024 70.748 66.446 68.253 65.525
MARCH 62.410 96.718 106.040 87.382 75.862 82.072 75.311 65.547 70.144 68.071
APRIL 64.625 98.322 94.851 88.033 76.273 83.493 77 .388 70.318 68.801 67.129
MAY 64.768 91.234 93.479 85.798 77.948 85.634 72.229 69.864 67.082 70.9850-
85.226.I:- JUNE 66.569 88.241 92.713 71. 488 81.836 69.849 67.094 67.471 74.346
JULY 64.079 86.768 103.565 84.412 71.053 82.947 64.402 66.773 63.815 80.419
AUGUST 67.232 91. 335 100.708 87.387 70.999 80.542 64.535 66.284 62.374 82.183
SEPTEMBER 67.632 95.853 98.864 84.722 71. 065 77.587 63.408 65.716 64.844 85.607
OCTOBER 70.495 99.106 99.471 82.312 72.413 73.392 62.039 66.680 63.464 88.253
NOVEMBER 71.191 99.708 96.982 81.216 72.968 69.581 65.650 66.294 62.855 108.528
DECEMBER 71.897 106.448 89.127 80.293 74.230 70.805 63.538 68.025 63.630 133.339
(J NW US Producer Delivered.
Source: Metals Week.
Prepared by: State of Arizona Joint Legislative Budget Committee Staff.

TABLE XXII
AVERAGE COPPER CASH PRODUCTION COSTS FOR THE UNITED STATES, 1982-86 (1
(Cents per pound of copper)
0'V1
PRODUCT COSTS
Mine op. cost
Mill-Float op. cost
Mill-Leach op. cost
Smelt/Refine/Transportation
Taxes (3
Total CostByproduct Credits
Cash Cost (4
Production Thousand Short Tons (5of Copper
1982
26
24
9
28
3
90(13)
-----r7
989
1983
22
24
7
26
3
82(13)
69
1,027
1984
20
23
7
24
2
76(11 )
~
1,203
1985 (6
23
20
23
2
68(9)
59
1,222
1986
23
21
19
2
65(9)
56
1,180
Long run (2
26
22
5
24
3
80(11 )
69
1,504
(1 Includes 16 mines, most of which were producing from 1982 to 1986.(2 Long run costs include depreciation allowances to sustain production.(3 Property and severance taxes and royalties, if applicable.(4 Includes all cash cost of production and credit for byproducts but excludes depreciation and profit
(except long run costs). Costs are in actual dollars for each year shown.(5 Based on the production of the 16 mines analyzed. Long run production is estimated full capacity
level. Capacities are averaged over the life of the mine.(6 Includes 13 mines. Hill costs are combined in 1985-6.
Source: U.S. Bureau of Mines Preprint from Bulletin 675 Chapter on Copper. Mineral Facts and Problems,1985 Edition and 1986 Minerals Yearbook.

DEPOSIT &LEGAL DESCRIPTION COMPANY
ANTLER Standard MetalsT17N R16W Sec 4 Corp.
TABLE XXII I
COPPER RESERVE BASE IN ARIZONA (1
MAJOR MILLIONS AVERAGE CuMINERAL TYPE OF TONS CONTENT REMARKS/SOURCE
Sulfide 5 1.95 With 4.13% In, 0.94% Pb, and 1.05 Agoz/ton. Annual Rpt & Form 10-K, 1987.An additional 2.5 million tons reportedin 1979 Annual Report.
ATLAS American Pacific Sulfide 5 0.64 Report on BS&K Project, Pima Co., AI" byTllS R8E Sec 32 Mining Co. Inc. Frank H Buchella. Cutoff at 0.40% Cu.
Acid Soluble 5 0.37 Cutoff at 0.20% Cu.Sulfi de 19 0.66 Asarco property adjacent to Atlas.Acid Soluble 12 0.38 Asarco property adjacent to Atlas.
0'0'
BAGDADTl4N R9W Sec 4
Cyprus Minerals Co. Sulfide 43 0.45 With 0.018% Mo. (includes acid soluble)Form 10-K, 1987.
BUCKEYE EAST Asarco Inc.T3S R12E Sec 26
CACTUS Magma Copper Co.TlN R13E Sec 36
CARLOTA Owens, S.B.TlN R13E Sec 36
Acid Soluble
Mixed
Acid Soluble
22
10
4
0.65 Al Mining Assoc. "AI Wilderness 1988"Report A-23 to Congress.
0.70 Cactus Prospect Rpt. Cutoff at 0.2% Cu.
0.85 Reported 1979.
CASA GRANDET6S R5E Sec 18
Casa GrandeCopper Co.
Mixed 352 1.00 Getty Oil Co. Annual Report, 1980.With 0.01% Mo. Cutoff at 0.5% Cu.
CHILITO Asarco Inc.14S RISE Sec 22
Mixed 75 0.51 Chilito Mines Report. With 0.01% Mo,0.04 oz Ag.
CHRISTMAS (OP)CHRISTMAS (UG)14S R16E Sec 30
InspirationConsolidated CopperCo.
SulfideSulfide
720
0.631.82
Inspiration Resources Form 10-K, 1983.(same as above)
(continued)

DEPOSIT &LEGAL DESCRIPTION COMPANY
COCHISE Phelps Dodge Corp.T23S R24ESecs 9 &10
TABLE XXIII (CONT)
COPPER RESERVE BASE IN ARIZONA (1
MAJOR MILLIONS AVERAGE CuMINERAL TYPE OF TONS CONTENT REMARKS/SOURCE
Acid Soluble 170 0.50 Annual Report, 1987.
COPPER BASIN Phelps Dodge Corp.T13N R3W Sec 20
COPPER BUTTE Asarco Inc.T3S R13E Sec 30
COPPER CREEK Magma Copper Co.T8S R18E Sec 11
Sul fide
Acid Soluble
Sulfide
175
22
80
0.55 With 0.021% Mo.
1.09 AZ Mining Assoc. "AZ Wilderness 1988"Report A-23 to Congress.
0.55 Old copper reserves data.
0.... COPPER QUEENT23S R24E Sec 9
Phelps Dodge Corp. Mixed 1 5.50 Underground. Phelps Dodge ProspectusMay 8, 1975.
DOS POBRES Phe1ps Dodge Corp.T5S R26E Sec 27
DRAGOON CF &I Steel Corp.T16S R22E Sec 25
DYNAMITE Smith, V.A. - EstateT17S R13E Sec 30
Sulfide
Acid Soluble
Mixed
232
25
100
0.89 Form 10-K, 1987.
0.50 0.5 to 0.6 acid soluble copper.
0.53 Unpublished estimate.
EMERALD ISLE TSC Enterprises, Inc. Acid SolubleT23N R18W Sec 22
1 0.40 3 million tons at 0.1% CuUSBM RI 8236, Pub. 1977.
ESPERANZA Cyprus Minerals Co.T18S R12E Sec 16
FOUR METALS Dore Mining &T23S R16E Sec 20 Milling
Sul fide
Sulfide
48
3
0.27 With 0.034% Mo. Pennzoil Form 10-K,1981.
0.82 Iso Mines Ltd. Annual Report, 1965.
(continued)

DEPOSIT &LEGAL DESCRIPTION COMPANY
TABLE XXIII (CONT)
COPPER RESERVE BASE IN ARIZONA (1
MAJOR MILLIONS AVERAGE CuMINERAL TYPE OF TONS CONTENT REMARKS/SOURCE
GIBSON Lodestar Minerals Inc. Acid SolubleTIS RI4E Sec 21
11 0.7 43 million tons at 0.04% Cu. Fletcher,J.B. et al report Aug. 1984.
HELVETIA Asarco Inc.TI8S RISE Sec 36
Sulfide 337Acid Soluble 22
0.54 With Sulfide - 0.088 oz/ton Ag, 0.00050.55 oz/ton Au.
Acid Soluble 167Sulfide 110
g;
1-10 Cyprus Minerals Co.TI5S R23E Sec 31
INSPIRATION AREA Cyprus Minerals Co.MINESTIN RI4E Sec 25
IRON DOOR UnknownTI3S R25E Sec 17
Mixed
Sulfide
100
63
0.52 Unpublished estimate; with 0.02% Mo.
0.60 Inspiration Resources Corp. Annual0.52 Report, 1987. Acquired by Cyprus from
Inspiration July I, 1988.
0.38 Spike-E Hills Rpt. Cutoff at 0.20% Cu.
KALAMAZOOT9S RI6E Sec 9
Magma Copper Co. Sulfide 211Sulfide shaft 101pi 11 ar
0.77 Form 10-K, 1987.0.68
KAY COPPER MINET8N R2E Sec 4
Rayrock Mines Sulfide 3 UNK Unpublished estimate.
KORN KOB Keystone MineralsTIIS RI7E Sec 14 Inc.
LAKESHORE Cyprus Minerals Co.TIOS R4E Sec 25
Acid Soluble
Sulfide(Porphyry)Sulfide(Tactite)Acid Soluble
28
41
9
16
0.53 North Ore Body.0.44 South Ore Body.
Holmes &Narrou report on Korn Kob,March 1974 section 5.
0.71 Noranda Annual Report, 1984.
1.35 Noranda Annual Report, 1984.
0.80 Cyprus Minerals Form 10-K, 1987.------------------------------------------------------ --------------------------------------------
(continued)

DEPOSIT &LEGAL DESCRIPTION COMPANY
LONE STAR Phelps Dodge Corp.T6S R27E Sec 5
TABLE XXIII (CONT)
COPPER RESERVE BASE IN ARIZONA (1
MAJOR MILLIONS AVERAGE CuMINERAL TYPE OF TONS CONTENT REMARKS/SOURCE
Mixed 1065 0.58 World Mining, May 1981.1000 0.41 Phelps Dodge Form 10-K, 1987.
MAGMA MINE Magma Copper Co.TIS R12E Sec 35
MAME Hope Mi ni ng &T19S R25E Sec 20 Milling Co.
MIAMI EAST Magma Copper Co.TIN RISE Sec 19
Sulfide
Acid Soluble
SulfideSulfide
4
1
650
5.70 Magma Form 10-K, 1987.
1.10 Unpublished estimate.
3.14 Newmont Mining Annual Report, 1985.1.95 Minerals Yearbook 1973, VII Area
Reports USBM.
'""" MIAMI TAl LINGSTIN RISE Sec 30
MINERAL BUTTE14S R7E Sec 1
Magma Copper Co.
Unknown
Acid Soluble
Mixed
35
15
0.33 Magma Form 10-K, 1987. Expect 54%recovery.
0.42 Cutoff at 0.32% Cu. Bear Creek report.
MINERAL PARK Cyprus Minerals Co.T23N R17W Sec 19
MISSION COMPLEX Asarco Inc.T16S R12E Sec 31
MORENCI/METCALF Phelps Dodge 85% &T4S R29E Sec 16 Sumitomo 15%
NEW CORNELIA Phelps Dodge Corp.TI2S R6W Sec 27
Sul fide
Sulfide
SulfideSulfide
Sulfide
35
367
739241
209
0.17 With 0.054% Mo. Pennzoil Form 10-K,1981.
0.64 With 0.12 oz/ton Ag. Asarco AnnualReport, 1987.
0.76 Additional reserve is Sulfide - 2410.69 million tons at 0.69% Cu. Phelps Dodge
Form 10-K, 1987.
0.50 Phelps Dodge Form 10-K, 1987.
(continued)

DEPOSIT &LEGAL DESCRIPTION COMPANY
TABLE XXIII (CONT)
COPPER RESERVE BASE IN ARIZONA (1
MAJOR MILLIONS AVERAGE CuMINERAL TYPE OF TONS CONTENT REMARKS/SOURCE
ORACLE RIDGE Continental UnionTIIS R16E Sec 16 Minerals
Mixed 11 2.25 AZ Conference AIME Dec. 1977.With 0.64 oz/ton Ag, Copper Studies Inc,
NYC March 30, 1979.--------------------------------------------------------------------------------------------------
PEACH ELGIN Asarco Inc.T18S RI5E Sec 15
SulfideAcid Soluble
1410
0.78 West, Barbara J. report, January 1980.0.75
--------------------------------------------------------------------------------------------------....o
PINTO VALLEYTIN RI4E Sec 2
POSTON BUTTET4S R9E Sec 33
RAYns R13E Sec 10
Magma Copper Co.
Conoco Inc.
Asarco Inc.
Sulfide
Mixed
Sulfide
421
800
677
0.39 Magma Form IO-K, 1987.
0.40 Copper Studies Inc, NYC, March 30, 1979.500 million tons at 0.50% TCu from
Conoco Annual Report, 1972.
0.70 Asarco Annual Report, 1987.
RED MOUNTAIN Kerr McGee Corp.T22S R16E Sec 20
SACATON EAST (UG) Asarco Inc.T5S R5E Sec 26
SAN JUAN Cochise Mining Corp.T5S R26E Sec 35
Sulfide
Sulfide
Acid Soluble
100
15
16
0.71 Tucson Daily Citizen, Sept. 23, 1970.
1.25 Asarco Inc. Form 10-K, 1979.
0.52 Cutoff at 0.35% Cu or 20 million tonsat lower grade with lower cutoff.Producers Minerals Corp rpt June 1975.
SAN MANUEL Magma Copper Co.T8S R16E Sec 34
SAN MANUEL OPEN Magma Copper Co.PITT8S R16E Sec 35
Sulfi de 59Sulfide shaft 103pillar
Acid Soluble 44Acid Soluble 11Acid Soluble 272
0.62 Magma Form 10-K, 1987. Cutoff at 0.50%0.64 Cu.
0.43 Open Pit. Magma Form 10-K, 1987.0.14 Open Pit Marginal. Magma Form 10-K, 1987.0.36 In Situ. Magma Form 10-K, 1987.
-----------------------.--------------------------------------------------------------------------(continued)
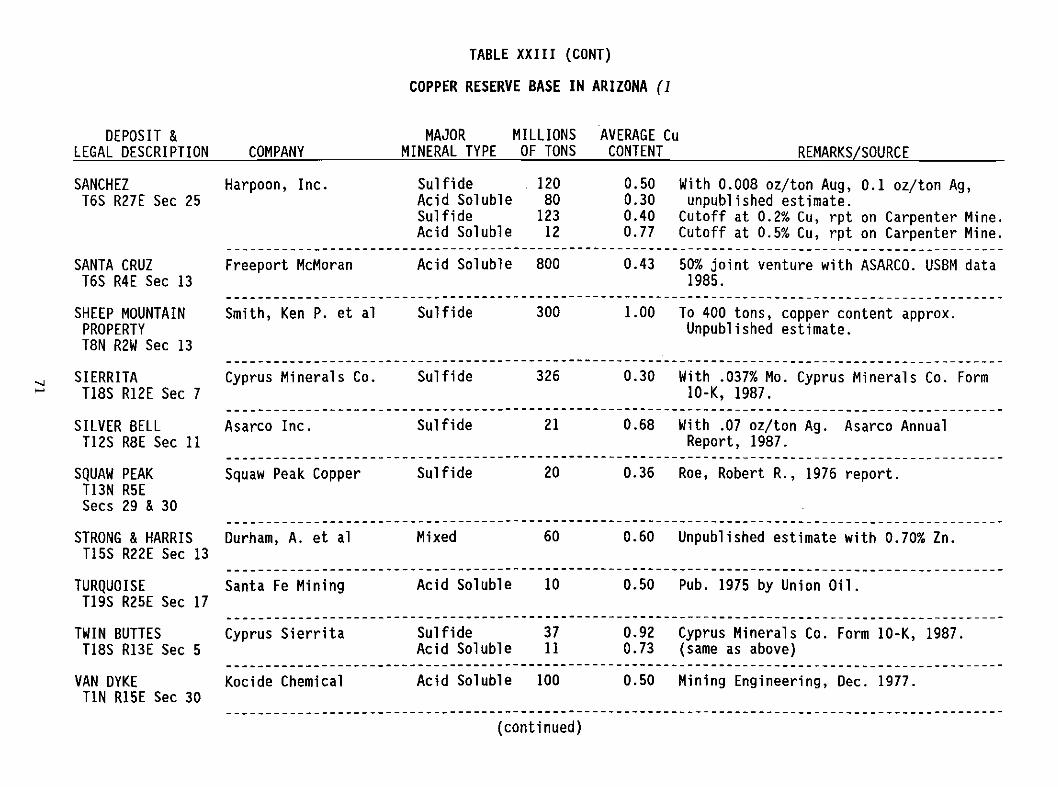
TABLE XXIII (CONT)
COPPER RESERVE BASE IN ARIZONA (1
DEPOSIT &LEGAL DESCRIPTION COMPANY
SANCHEZ Harpoon, Inc.T6S R27E Sec 25
MAJOR MILLIONSMINERAL TYPE OF TONS
Sulfide 120Acid Soluble 80Sulfide 123Acid Soluble 12
AVERAGE CuCONTENT REMARKS/SOURCE
0.50 With 0.008 oz/ton Aug, 0.1 oz/ton Ag,0.30 unpublished estimate.0.40 Cutoff at 0.2% Cu, rpt on Carpenter Mine.0.77 Cutoff at 0.5% Cu, rpt on Carpenter Mine.
Acid Soluble 800SANTA CRUZT6S R4E Sec 13
SHEEP MOUNTAINPROPERTYT8N R2W Sec 13
Freeport McMoran
Smith, Ken P. et a1 Sulfide 300
0.43 50% joint venture with ASARCO. USBM data1985.
1.00 To 400 tons, copper content approx.Unpublished estimate.
--------------------------------------------------------------------------------------------------.....,.... SIERRITA Cyprus Minerals Co .
TI8S R12E Sec 7Sulfide 326 0.30 With .037% Mo. Cyprus Minerals Co. Form
IO-K, 1987.--------------------------------------------------------------------------------------------------
SILVER BELL Asarco Inc.T12S R8E Sec 11
Sulfide 21 0.68 With .07 oz/ton Ag. Asarco AnnualReport, 1987.
--------------------------------------------------------------------------------------------------
--------------------------------------------------------------------------------------------------
SQUAW PEAKT13N R5ESecs 29 &30
Squaw Peak Copper Sulfide 20 0.36 Roe, Robert R., 1976 report.
STRONG &HARRIS Durham, A. et a1T15S R22E Sec 13
Mixed 60 0.60 Unpublished estimate with 0.70% Zn.
--------------------------------------------------------------------------------------------------TURQUOISE Santa Fe Mining
T19S R25E Sec 17Acid Soluble 10 0.50 Pub. 1975 by Union Oil.
--------------------------------------------------------------------------------------------------TWIN BUTTES Cyprus Sierrita
TI8S Rl3E Sec 5SulfideAcid Soluble
3711
0.92 Cyprus Minerals Co. Form IO-K, 1987.0.73 (same as above)
--------------------------------------------------------------------------------------------------VAN DYKE Kocide Chemical
TIN RISE Sec 30Acid Soluble 100 0.50 Mining Engineering, Dec. 1977.
--------------------------------------------------------------------------------------------------(continued)

DEPOSIT &LEGAL DESCRIPTION COMPANY
VEKOL HILLS Papago Tribe,TIOS R3E Sec 4 Tohono O'odham
TABLE XXIII (CaNT)
COPPER RESERVE BASE IN ARIZONA (1
MAJOR MILLIONS AVERAGE CuMINERAL TYPE OF TONS CONTENT REMARKS/SOURCE
Sulfide 105 0.56 With 0.014% Mo, 16 million tons acidsoluble Cu. Final EIS, Vekol HillsProject, US Dept of Interior, Bureauof Indian Affairs, May 1988.
VENTURA Cyprus Minerals Co.T23S RISE Sec 1
WHITE MESA Navajo TribeT38N R9E Sec 29
Sulfide
Acid Soluble
6
2
0.26 Iso Mines Ltd Annual Report, 1965. With0.28% MoS (6 million additional tonspossible)
0.75 Mayo, E.B., 1955 report.
.....N
ZONIA Antioch Resources & Acid SolubleTIIN R4W Sec 12 Queenstake Resources
TOTAL COPPER RESERVE BASE IN ARIZONA
35 0.31 Lundin, R. J. et al, Feb. 1985 report .
SulfideAcid SolubleMixedTOTAL
5.61.93.6
11.1
Billion tonsII II
II II
II II
at 0.65% Cu" 0.44% Cu" 0.54% Cu" 0.58% or 64 mi 11 ion tons of copper
(1 Reserve Base -That part of an identified resource that meets specified minimum physical and chemical criteriarelated to current mining and production practices, including those for grade, quality,thickness, and depth. The reserve base is the in-place demonstrated (measured plus indicated)resource from which reserves are estimated. It may encompass those parts of the resources thathave a reasonable potential for becoming economically available within planning horizons beyondthose that assume proven technology and current economics. The reserve base includes thoseresources that are currently economic (reserves), marginally economic (marginal reserves), andsome of those that are currently subeconomic (subeconomic resources)."Mineral Facts and Problems" 1985 Edition, Bureau of Mines Bulletin 675, page 3.

I23456789
101112131415161718192021222324252627282930313233343536373839404142434445464748495051525354555657585960616263
AntlerAtlasBagdadBuckeye EastCactusCarlotaeasa GrandeChil itoChristmasCochiseCopper BasinCopper ButteCopper CreekCopper QueenDos PobresDragoonDynamiteEmerald IsleEsperanzaFour MetalsGibsonHelvetia1-10Inspiration Area HinesIron DoorKalamazooKay Copper MineKorn KobLakeshoreLone StarMagma MineMameMiami EastMiami Tail ing,Mineral ButteMineral ParkMission ComplexMorenci/MetcalfNew CorneliaOracle RidgePeach ElginPinto ValleyPoston ButteRayRed MountainSacaton East (UG)San JuanSan ManuelSan Manuel Open PitSanchezSanta CruzSheep Mountain PropertySierritaSilver BellSquaw PeakStrong &HarrisTurquoiseTwin ButtesVan DykeVekol Hill'VenturaWhite MesaZonia
COPPER RESERVES
,I
,~\._j\I

~ ~
COPPER RESERVES· LISTED BY COMPANY
~ Deoosit
-J~
American PacHic Mining Co. Inc.
Antioch Res. &Queenstake Res.Asarco Inc.
Asarco Inc.
Asarco Inc.
Asarca Inc.Asarco Inc.Asarco Inc.
Asarco Inc.
Asarco Inc.
Asarco Inc.
Casa Grande Copper Co.CF & I Steel Corp.
Cochise Mining Corp.
Canoea Inc.
Continental Union
Cyprus Minerals Co.
Cyprus Minerals Co.
Cyprus Minerals Co.
Cyprus Minerals Co.
Cyprus Minerals Co.
Cyprus Minerals Co.
Cyprus Minerals Co.
Cyprus Minerals Co.
Cyprus SierritaDare Min1r19 & Hi lUng
Durham, A. et al
Freeport McHorenHarpoon, Inc.
Hope Mining & Hi lling Co.
Inspiration Consol idated Copper Co.
Atlas
Zonia
Sacaton East (UG)Sf lver Bell
Copper ButteRay
HeLvetiaPeach Elgin
Buckeye East
Chit itoMission Corrplex
Casa Grande
Dragoon
San Juan
Poston Butte
Oracle Ridge
I -lD
Lakeshore
Esperanza
Mineral Park
Sierrita
Bagdad
Ventura
Inspiration Area
Twin Buttes
Four Metals
Strong &Harris
Santa Cruz
Sanchez
MameChri stmas (OP)
Kerr McGee Corp.
Keystone Minerals
Kocide Chemical
Lodestar Minerals Inc.
Ma5JT18 Copper Co.
Magma Copper Co.
MalJOS Copper Co.
MalJOS Copper Co.
Magma Copper Co.
MalJOS Copper Co.
Magma Copper Co.
Magma Copper Co.
Magma Copper Co.
Navajo Tribe
Owens, S.B.
Papago Tribe, Tohono O'ocI1am
Phelps Dodge Corp.Phelps Dodge Corp.Phelps Dodge Corp.Phelps Dodge Corp.
Phelps Dodge Corp.Phelps Dodge Corp.Phelps Dodge Corp.Rayrock Mines
Santa Fe Mining
Smith, Ken P. et al
Smith, V.A•• Estate
Squaw Peak Copper
Stcnc:lard Metals
TSC Enterprises, Inc.
Unknown
Unknown
Red Mountain
Korn Kob
Van Dyke
Gibson
Miami Tai lings
San Manuel
Kalamazoo
Pinto Valley
Magma Mine
Miani East
San Manuel Open Pit
Copper Creek
Cactus
White Mesa
Carlota
Vekol Hills
Dos Pobres
Copper Basin
Lone Star
Copper Queen
New Corne l i a
Morenci/Metcal f
Coch i se
Kay Copper Mine
Turquoise
Sheep Mountain
Dynamite
Squaw Peak
Antler
Emerald Isle
Iron Door
Mineral Butte

TABLE XXIV
ARIZONA AND U.S. COPPER MINE PRODUCTION IN SHORT TONS OF Cu. 1874-1987
AZ % ofU.S. Prod.
Period AZ Production (1 Cumulative AZ U.S. Production (1 Cumulative U.S. Ann'l Cum------------------------------------------------------ ------------------------------------------------------ ----1874-1971* 24,889,171 60,365,183 41.2
1972 847,929 25,737,100 1,664,840 62,030,023 50.9 41.51973 867,506 26,604,606 1,717,940 63,747,963 50.5 41. 71974 804,904 27,409,510 1,597,002 65,344,965 50.4 41.9
1975 751,489 28,160,999 1,413,366 66,758,331 53.2 42.21976 956,215 29,117,214 1,605,586 68,363,917 60.0 42.61977 852,620 29,969,834 1,503,964 69,867,887 56.7 42.9
-J 1978 908,835 30,878,669 1,496,482 71,364,363 60.7 43.3V1 1979 957,251 31,835,920 1,591,200 72,955,563 60.2 43.6
1980 760,926 32,596,846 1,301,900 74,257,463 58.4 43.91981 1,071,949 33,668,795 1,695,500 75,952,963 63.2 44.31982 848,750 34,517,545 1,264,322 77,217,285 67.1 44.71983 747,604 35,265,149 1,144,306 78,361,591 65.3 45.01984 822,815 36,087,964 1,215,400 79,576,991 67.7 45.3
1985 878,044 36,966,008 1,218,900 80,795,891 72.0 45.81986 878,926 37,844,934 1,180,564 81,976,455 74.4 46.21987 (Prelim) 862,034 38,706,968 1,405,091 83,157,019 61.4 46.5
* For Cumulative Breakdown 1874-1911 and Annual Production 1912-1971, see "The Copper Industry" by Ken Phillips,published February 1973 by ADMMR.
(l Source: "Mineral Yearbook - Area Reports: Domestic", U.S. Bureau of Mines and Table I this report.

THE ARIZONA DEPARTMENT OF MINES AND MINERAL RESOURCES
The Department's task is to promote the development of Arizona's mineralresources. This is accomplished through technical research, fieldinvestigations, compilation of information into a mineral occurrence data baseand disseminating information through publications, personal contacts andseminars.
The Department's mining engineers and geologists assist mining and explorationcompanies, prospectors and others interested in Arizona's minerals withmineral processing, mineral land acquisition, exploration, mine development,financing, government regulations and marketing.
The Department is a service agency and does not regulate, tax or require anytype of registration. The agency provides many different services tailored tomeet the differing needs of the public. The following list of services arethose which the explorationist may find of benefit.
Maintain a site specific data base of unpublished reports and maps whichincludes 5,000 mine files and indexes of 10,000 computerized Arizonamineral locations.
Maintain an information bank and library of mineral and mlnlnginformation including, a mine map library (hard copy and microfilm),government publications, periodicals, and unpublished master anddoctorate theses.
Gather and disseminate information on commodities and markets.
Suggest target areas for possible exploration activity.
Suggest prospects and individual properties for study and acquisition.
Assist individuals and companies in their dealings with State regulatoryagencies to facilitate their mining and exploration activity.
Provide publications in the form of mineral reports, annual directories,technical reports, annual mineral industry surveys and informationcirculars. These include Laws and Regulations Governing Mineral Rightsin Arizona, Directory of Exploration Offices in Arizona, Manual forDetermination of Status and Ownership of Arizona Mineral and WaterRights, and others. A current listing of the Department publications ;savailable upon request.