Microbiological and Physicochemical Characterization of Small ...

Citation: Salih ZA, Siddeeg A, Al-Farga Ammar, Ibrahim AIE and Ali AO. The Physicochemical, Microbiological and Sensory Properties of Yoghurt Processed by Addition of Rice Flour. Ann Obes Disord. 2019; 4(1): 1025.
Ann Obes Disord - Volume 4 Issue 1 - 2019Submit your Manuscript | www.austinpublishinggroup.com Salih et al. © All rights are reserved
Annals of Obesity & DisordersOpen Access
Abstract
This study was aimed to assess the nutritional value and texture of the yoghurt with the addition of different concentrations of rice flour. Yoghurt samples were processed by added rice flour at 0, 2, 4 and 6%. The results indicated that the highest moisture content in the control sample was 86.86% and the lowest one in 6% was 84.41% of rice flour. The protein content of yoghurt samples was 4.16, 4.20, 4.57 and 4.83%, the protein contents increased significantly (p<0.005) by addition rice flour. The fat content in yoghurt samples was 2.19, 2.21, 2.21 and 2.23% in control, 2, 4 and 6%, respectively. The minerals content was not affected significantly (p<0.005) by added rice flour. The ash content was 0.26, 0.35, 0.52 and 0.72% in control, 2, 4 and 6%, respectively were increased significantly (p<0.005) by addition rice flour. Titratable acidity was decreased significantly (p<0.005), while the pH value increased by added rice flour. The viscosity of yoghurt samples the highest one in control sample was 4212 cps and lowest in 6% was 3766 cps. The serum separation of yoghurt samples with rice flour was 5.32, 4.47, 4.20 and 3.70 ml, respectively, decreased significantly (p<0.005), while the dry matter of yoghurt sample increased by addition rice flour, the highest one was recorded in the yoghurt sample produced by 6% was (15.42%) by rice flour. The microbiological analysis of yoghurt samples indicated the total count bacteria, mould and yeast no affected significantly (p<0.005) by addition rice flour and no growth of coliform and Salmonella. The sensory evaluation indicated that yoghurt samples with 4% rice flour had the highest consumer acceptability scores.
Keywords: Rice; Yoghurt; Physiochemical analysis; Microbiological characteristics; Sensory evaluation
of the recommended daily intake for calcium. Yoghurt is low in fat and high in certain minerals and essentials vitamins, including riboflavin B2, Vitamin B12, phosphorus and potassium [4]. Rice (Oryza sativa) is a dietary staple food and one of the most important cereal crops, especially for people in Asia, but the consumption outside Asia has increased, recently. It provides the bulk of daily calories for many companion animals and humans [5]. Besides those nutritional attributes of rice and rice products, the specialties of rice starch and flour contribute to their unique applications. Rice starch granule is the smallest among the cereal starches and results in a smooth and creamy texture. Its short-textured paste gives a clean taste. Rice starch and flour can provide suitable textures for a range of foods with high natural stability and digestibility. In addition, rice flour, starch and protein can also be used as a processing aid, ingredients in health food, coating agents in confectionary, water binders in small goods, expanding agents in extrusion food, flavour carriers, emulsifiers and fat replacers in dairy products and paper coating agents [6]. Rice can produce beta-carotene (pro-Vitamin A) in the seed endosperm tissue as in Golden Rice (has a gene that produces vitamin A). Although the precise amount of beta-carotene that Golden Rice variety can produce is not clear, the fact remains that it could still be beneficial to millions of people with Vitamin A deficiency that could lead to blindness [7]. Medicinal Value of rice the immense diversity of rice germplasm is a rich source for many rice-based products and is also used for treating many health-related maladies such as indigestion,
IntroductionDefinition of yoghurt is a cultured dairy product that can be
made from whole, low fat or skim milk, including reconstituted nonfat dry milk powder. Yoghurt is one of the oldest fermented milk products known [1]. Yoghurt is made by inoculating certain bacteria (starter culture), usually Streptococcus thermophilus and Lactobacillus bulgaricus, into milk. After inoculation, the milk is incubated at approximately 110⁰F until firm the milk is coagulated by bacteria-produced lactic acid. Yoghurt is made from the milk of water buffalo, yak, goat, horses and sheep [2]. Manufacturing of yoghurt is an ancient technique, which dates back thousands of years, and the knowledge has transferred generation to generation. However, during the last few decades, it became more rational due to the improvement of various fields much as microbiology, biochemistry and food engineering. Today it is a complex activity combined with art and science.
The generalized process of yoghurt making is comprised of modifying the original composition of milk, pasteurizing the yoghurt mix, fermentation at thermophilic temperatures 40-45⁰C [3]. Health benefits of yoghurt are a nutrient-dense food that meets a wide variety of nutritional needs at for everyone. Yoghurt is a good source of protein-an average 8-ounce serving contains between 8 and 10 grams of protein, or 16 to 20 per cent of the daily-recommended value [4]. Yoghurt is also an excellent source of calcium and contains up to 35%
Research Article
The Physicochemical, Microbiological and Sensory Properties of Yoghurt Processed by Addition of Rice FlourSalih ZA1,2*, Siddeeg A2, Al-Farga Ammar3, Ibrahim AIE1 and Ali AO1
1Agricultural and Veterinary Training Station, King Faisal University, Saudi Arabia2Department of Engineering and Technology, University of Gezira, Sudan3Department of Biochemistry, University of Jeddah, Saudi Arabia
*Corresponding author: Zakaria A Salih, Agricultural and Veterinary Training Station, King Faisal University, Saudi Arabia, Department of Engineering and Technology, University of Gezira, Wad Medani, PO Box, 20, Sudan
Received: May 16, 2019; Accepted: June 12, 2019; Published: June 19, 2019

Ann Obes Disord 4(1): id1025 (2019) - Page - 02
Salih ZA Austin Publishing Group
Submit your Manuscript | www.austinpublishinggroup.com
diabetes, arthritis, paralysis, epilepsy and give strength to pregnant and lactating mothers.
Materials and MethodsMaterials
Fresh whole cow milk was obtained from the Wad Almagdob farm and was immediately cooled and transported to the factory of Wad Almagdob, Gezira State, Sudan. Fresh rice was collected from a local market in Wad Medani city, Gezira State, Sudan. All the glassware media and other materials used were either wet sterilized or dry sterilized. The dry sterilization was done by the oven at 160⁰C for 2 hours, while wet sterilization was carried out in an autoclave at 121⁰C for 15 minutes. The media were prepared according to the manufacturer’s instructions.
MethodsPreparation of rice flour: Rice was the first choice of rice quantity
then rice is cleaned of dirt and then washed with water to get rid of dust and then soaked in water for three hours and filtered rice from the water and placed in the sun and then milled to a fine flour which was kept in a closed for further use [8].
Processing of yoghurt: Five liters were taken for each sample in a stainless steel container and heated to 85⁰C for 30min. After pasteurization, the milk was cooled to 44.6⁰C, starter culture in ratio 1.5% was added to milk at 44.6⁰C. Two types of yoghurt were prepared, the first type was left free without any additive of rice flour, the second type was addition rice flour at the levels of 2, 4, and 6 % to the milk respectively, after adding the starter culture to the milk, poured the milk in container sealed then put in the incubator about three hours to help to fermentation process after incubation transfer the immediately to refrigerators 4⁰C.
Microbiological AnalysisTen-gram samples of yoghurt type were dissolved with 90ml of
distilled water by shaking for several minutes, from this suspension; 1ml was taken from the dilution and transferred to another tube to make serial dilution up to 10-6. The total viable count per ml of sample was obtained by pour-plating suitable in triplicates on plate count ager following the method of APHA, [9]. Incubation was accomplished at 37⁰C for 48 hr. Plates containing 30-300 Colonies were counted as Colony Forming Units (C.F.U) per ml of the sample. Yeast and mould were enumerated according to Marshall, [10] using Potato Dextrose Agar (PDA). The plates were incubated at 25⁰C for 3-5 days, plates containing 30-300 colonies were counted as Colony Forming Units (C.F.U/ml). Coliform bacterial count was determined according to Marshal, using MacConkey broth [11].
The tubes were incubated at 37⁰C for 48 hours. Positive tubes gave gas in Durham tubes. Then the positive tubes were sub cultured into EC broth medium and then incubated at 44⁰C for 24 hours to determine the coliform bacteria, the tube showing any amount of gas production were considered positive. 100 ml of samples were incubated at 37⁰C for 24 hours. Then 10ml were drawn aseptically and added to 100ml Selenite Broth. The broth was incubated at 37⁰C for 24 hours than with a loopful streaking was done on dried Bismuth Sulphite agar plates. The plates were then incubated at 37⁰C for 72 hours. Black metallic sheen discrete colonies indicated the presence
of Salmonella. A confirmatory test was carried out by taking a discrete black.
Chemical AnalysesMoisture content
The moisture content was determined by oven method as described by AOAC, [12]. In this process, 5g of the sample was dried in a hot air oven for 2 hr at 100⁰C. The loss in weight was determined and recorded as the moisture content.
pH measurementThe pH was determined by the method described by [13], where
10g of the sample was dissolved in 100ml of distilled water. The mixture was allowed to equilibrate for 3min at room temperature. The pH was then determined by inserting the electrode of the pH meter in the sample then taking the result displayed on the pH meter.
Determination of total titratable acidity (TTA)This was determined by the method described by AOAC, [12].
The sample was dissolved in distilled water and mixed thoroughly. 1ml of phenolphthalein indicator was introduced into 10ml of the mixed solution. It was titrated against standard sodium hydroxide solution until pink color persisted for about 10-15 seconds for complete neutralisation.
Protein contentThe Kjeldahl method was used to determine the amount of
nitrogen of the different samples according to AOAC, [13], then multiplied by a factor of 6.25. The method was composed of three major steps. A portion of the prepared sample was weighed out. It contained about 0.05g protein-to the nearest 1mg and transferred to a Kjeldahl tube. A glass pearl, 20ml H2SO4 and 1:2 g catalyst (15g KSO4+1ml CuSO4) were added. The digestion was carried out in a destruction block until a bright green color appeared, then allowed to cool and 10 ml distilled water were added. The tube was placed in the distillation equipment and 30ml NaOH/thiosulphate solution was added. The ammonia was distilled into 20ml boric acid-indicator solution and then titrated with 0.05N HCl.
Ash content determinationThe ash content was determined by the direct heating method
as contain in AOAC, [12]. In this method, 5g each of the samples was measured into a crucible of known weight; the sample was burnt to ash in a muffle furnace for 3h at 500⁰C. It was then cooled in a desiccator, and the weight of the ash was finally determined.
Fat content determinationThe fat content was determined by the Gerber method according
to AOAC, [14] as follows: 10g of yoghurt sample was taken, 10ml sulfuric acid and 1ml of amyl alcohol was added to it and close with rubber cork, and then centrifuged at 1100 rpm for 15 min and the tubes were then transferred to a bath at 65⁰C for 5 minutes. The fat per cent was then read out directly from the fat column
Determination of mineral contentThe content of minerals of yoghurt was determined according to
the methods described by [15]. Samples were weighed into porcelain crucibles and ashed in a muffle furnace at a temperature of 500⁰C for 6 hours. After ashing the products were cooled in a desiccator. The ashes

Ann Obes Disord 4(1): id1025 (2019) - Page - 03
Salih ZA Austin Publishing Group
Submit your Manuscript | www.austinpublishinggroup.com
were then dissolved into an acidic aqueous solution (concentrated HNO3) for their analyses. Each product was then transferred quantitatively to 250ml volumetric flask and distilled water was added to fill the flask and was shaken many times. Then the aqueous sample was diluted with strontium solution two times. The Flame Atomic Absorption Spectrophotometer (FAAS) with a variant spectrometer (spectral AA-10) was used to determine the macro- elements and the microelements. Flame photometer (Model Eppendorf Elex 6361) was used to determine phosphorous. The necessary equipment adjustments were accomplished. Calibration was accomplished using six standards ranging from 0.1µ/ml magnesium, 0.25µ/ml sodium and potassium to a top standard with 2.0µ/ml magnesium, 5.0µ/ml sodium and potassium. Calcium analyses were performed with the use of 4% hydroxyquinone.
Physical AnalysisThe viscosity of the samples was determined by the method of as
contained in Jeremia and Afam, [16]. The spindle of the viscometer was inserted into the samples at the speed of 20rpm, and the reading on the viscometer was taken after 3minutes for each sample. Serum separation samples were placed in 20ml graduated cylinders. After storage at 4⁰C, the volume of the layer of clear serum at the top was recorded as an indication of instability. Measurements taken performed in duplicate [17]. Dry matter was determined according to gravimetric method AOAC, [15]. Heating 5ml sample in an oven at 100⁰C for 3 hrs.
Lactose The procedure of was used for determination of lactose [13].
Firstly, the invert sugar was determined by pipette 5ml from each Fehling A+B in a conical flask and 10ml of distilled water was added. Then 3-5 drops of methylene blue were added as an indicator. Then the lactose standard was titrated until the final red precipitate occurred. The titration of the concentration after that the lactose was determined by prepared 10ml of yoghurt in 100ml volumetric flask. Then the volume was completed to 100ml by adding distilled water. The mixture was filtered. Finally, the sample was titrated against. Fehling solution (A+B) as before. Then the concentration of lactose was calculated from the following equation.
Chemical analyses of raw milkThe various chemical analysis which included moisture, total
solids, fat, protein, lactose, ash, titratable acidity and pH of raw milk were determined by used Milkana instrumental.
Sensory evaluationYoghurt samples were subjected to sensory evaluation using
(10) panellists; the panellists were asked to assess each sample for color, appearance, flavour, texture and overall acceptability a 9-point hedonic scale with one as the extremely bad and nine the excellent. All analysis took place in a room free from disturbing noises, and in which fresh air was circulation conditions were equalized for all the tests. The order of presentation for samples was randomized, and the samples were given codes before being tested.
Statistical analysisStatistical analysis was done using Statistical Package for Social
Studies Software SPSS. Complete Randomized Design was used to
estimate chemical, microbiological and sensory characteristics of the yoghurt.
Results and DiscussionThe chemical composition of milk sample used for the production of yoghurt with rice flour
The chemical composition of raw milk sample used for the production of yoghurt is presented in Table 1. The moisture content of raw milk 85% was lower when compared to Salma et al., [18] that was 87.31%. The moisture content value was in close agreement with the moisture content of raw cow’s milk as reported by Sohail [19], which was 85%. The total solids content of raw milk was 11.98% Enb et al. reported similar values, [20] that was 12.10%. This result was in with that agreement reported by Abdul Kader et al., [21] that was 11.70%. The fat content of raw milk 3.72% was higher when compared to the milk sample of Enb et al., [20] that was 3.20%. The fat content of raw milk was in close agreement with that reported by Abdul Kader et al., [21], who found fat content of 3.70%. The protein content of raw milk 3.39% was lower when compared with Saha, which was 4.14%. The protein content values were in close agreement to the protein content of raw milk as reported by Abdul Kader et al., [21] that was 3.38%. The lactose content was 4.92% was lower when compared with Enb et al., [20] that was 5.0%.
Table 1 also, shows off that the ash content raw milk 2.89. This result agreed with that of Salma et al., [18] who reported a value of 2.88%. The ash content of raw milk was higher compared to Enb et al., [20] that was 0.65. The titratable acidity of raw milk 0.16 % was a close agreement to the titratable acidity reported by Enb et al. [20] that was 0.17%. The data presented in Table 4.1 also, showed that the pH value of raw milk 6.70% this value was in close agreement to that reported by Salma et al., [18] who found a pH value of 6.71 in raw milk and also with Enb et al., [20] which was 6.60.
The chemical composition of processed yoghurt by added rice flour
The chemical composition of processed yoghurt by added rice flour with different concentrations of rice flour (2, 4 and 6% g/l) is shown in Table 2. The value of moisture content in control was 86.86%, this value higher than other found in yoghurt with 2,4,6% rice flour which was 86,85.56,85.58%, respectively. Statistically, significant differences (p<0.005). In moisture content of different concentrations of rice flour in yoghurt, samples were found. These results were of similar value reported by Kavas Nazan, [22], which was 85.46%. Because the addition of rice flour decreases the moisture
Parameter Raw milk
Moisture (%) 83.00±0.04
Total Solid (%) 11.98±0.03
Fat (%) 3.72±0.06
Protein (%) 3.39±0.09
Lactose (%) 4.92±0.3
Ash (%) 2.89±0.01
Acidity 0.16±0.07
pH value 6.70±0.03
Table 1: Chemical composition of raw milk sample.

Ann Obes Disord 4(1): id1025 (2019) - Page - 04
Salih ZA Austin Publishing Group
Submit your Manuscript | www.austinpublishinggroup.com
content in yoghurt. The protein content of the yoghurt sample was 4.16, 4.20, 4.57 and 4.83% in control, 2, 4 and 6%, respectively. Statistically, no significant differences (p<0.005) in protein content of different concentrations of rice flour in yoghurt samples were found. The highest protein content was 4.83% was recorded in the yoghurt sample produced by 6% while the lowest one in the control sample which was 4.16%. This result was higher than reported by Igbabul et al., [23] that was 3.70%. The fat content in the control sample was 2.19. This value lowest compared to those found in yoghurt sample processed by added rice flour in ratio 2,4 and 6% which were 2.21, 2.21, 2.23%, respectively, no significant differences (p<0.005). These results are lower value as that reported by Ibrahim et al., [24] that was 4.36. The ash value in control was 0.26% is lower than other yoghurt sample processed by different levels of rice flour 2, 4 and 6 %, which were 0.35, 0.52, and 0.72%, respectively. These values were in close agreement to that reported by Ibrahim et al., [24] that was 0.74 %. Statistically, no significant variation (p<0.005) between yoghurt samples in ash content. On the other hand, the pH value in Table 2, the control sample was 3.73 this value lower than another sample 2, 4, 6% rice flour that was 3.81, 3.92, and 4.17 %, respectively. The results showed significant differences as (p>0.005). These results were in close agreement with that reported by Warda et al., [25]. The data presented in Table 2 also, showed that the values of titratable acidity (lactic acid %) was 1.04 in control sample, this value higher than found in yoghurt sample processed by different levels of rice flour 2,4 and 6% which were 0.94, 0.82, 0.76%, respectively. This result in line with those found by Kavas Nazan, [22], which was 0.71.
The physical composition of processed yoghurt by added rice flour
The Viscosity (cp) value in control was 4212 cps is higher than other yoghurt sample processed by different levels of rice flour 2,4,6% which were 3900, 3876, 3766 cps, respectively. These values were in
close agreement to that reported by Warda, which was 3,900 cps. Statistically, significant variation (p<0.005) between yoghurt samples in the Viscosity The data presented in Table 3, also, showed that the Serum separation of yoghurt sample were 5.32, 4.47, 4.20 and 3.70 ml in control, 2, 4 and 6 %, respectively. The lowest Serum separation was 3.70ml was recorded in a yoghurt sample produced by 6% of rice flour and while the higher one in the control sample which was 5.32ml. These results were lower than reported by Kavas Nazan [22] was 9.83. Lactose level in control was 4.32% is lower than other yoghurt sample processed by different levels of rice flour 2, 4 and 6 % which were 4.33, 4.32 and 4.34%, respectively. These values were in close agreement to that reported by Kavas Nazan, (2015) which was 4.43% but higher result compared by Warda, [25], which was 2.70. The data presented in Table 4.3 also, showed that the dry matter of yoghurt sample in control which was 13.14 this result lower than other found in yoghurt sample with 2,4 and 6% rice flour which was 14.0, 14.44, 15.42%, respectively. Statistically, significant differences (p<0.005), in dry matter of different concentrations of rice flour in yoghurt samples were found. These results in line with those found by Kavas Nazan [22], which was 14.54%.
Minerals content (mg/100g) of processed yoghurt by added rice flour
The mineral contents of the control sample and different concentration of processed yoghurt by addition rice flour are shown in Table 4. In processed yoghurt samples the concentrations of Calcium in control sample was 128.16 mg/100g these result lower than found in processed yoghurt by added rice flour were 135.0, 136.22, 136.91 mg/100g in 2, 4 and 6%, respectively. The highest one was recorded in the yoghurt sample produced by 6% of rice flour which was 136.91 mg/100g while the lowest one in control sample which was 128.16mg/100g. These results higher than reported by Ibrahim et al., [24], which was 98.00mg/100g. Statistically, significance different (p<0.005) between yoghurt samples in concentrations of calcium. The data presented in Table 4, also, showed that the concentrations of potassium in control sample was 50.67mg/100g lower than found in processed yoghurt by added rice flour were 60.33, 65.33, 66.00mg/100g for 2, 4 and 6 %, respectively.
These results higher than reported by Enb et al., [20] which was 44.5 statistically, significantly different (p<0.005) between the yoghurt sample in concentrations of potassium. In processed yoghurt sample the concentrations of sodium (Na) the highest one was recorded in yoghurt sample produced by 6% of rice flour which was 60.67mg/100g, while the lowest one in yoghurt sample produced by control of yoghurt which was 46.67mg/100g. These results in line with those found by Ibrahim et al., [24] which was 61.21 Statistically, a significant difference (p< 0.005) between the yoghurt sample in
Parameters Control sampleRatio
2% 4% 6%
Moisture (%) 86.86±0.15a 86.00±0.09ab 85.56±0.12b 84.41±0.32c
Protein (%) 4.16±0.12c 4.20±0.10b 4.57±0.66ab 4.83±0.11a
Fat (%) 2.19±0.08c 2.21±0.22b 2.21±0.34b 2.23±0.10a
Ash (%) 0.26±0.16c 0.35±0.13b 0.52±0.53ab 0.72±0.26a
pH 3.73±0.23d 3.81±0.10c 3.92±0.10b 4.17±0.09a
Titratable acidity 1.04±0.10a 0.94±0.13ab 0.82±0.32b 0.76±0.10c
Table 2: Chemical composition (%) of processed yoghurt with the addition of rice flour.
Mean values ± standard deviation having a different superscript letter(s) in each row differ significantly (p<0.005).
Parameters Control sampleRatio
2% 4% 6%
Viscosity 4.212±0.08a 3,900±0.04b 3,876±0.21c 3,766±0.12d
Serum separation 5.32±0.11a 4.47±0.12b 4.20±0.11c 3.70±0.31d
Lactose 4.32±0.07c 4.33±0.21b 4.32±0.20b 4.34±0.33a
Dry matter (%) 13.14±0.14c 14.00±0.11b 14.44±0.13ab 15.42±0.23a
Table 3: Physical analysis of processed yoghurt with the addition of rice flour.
Mean values ± standard deviation having a different superscript letter(s) in each row differ significantly (p<0.005).
Element Control sample
Ratio
2% 4% 6%
Calcium (mg/100g) 128.16±0.33b 135.0±0.34c 136.22±0.34b 136.91±0.44a
Potassium (mg/100g) 50.67±0.19c 60.33±0.49b 65.33±0.48ab 66.00±0.19a
Sodium (mg/100g) 46.67±0.23d 54.66±0.28bc 56.00±0.33b 60.67±0.13a
Table 4: Minerals content (mg/100g) of processed yoghurt by added rice flour.
Mean values ± standard deviation having a different superscript letter(s) in each row differ significantly (p<0.005).
Ann Obes Disord 4(1): id1025 (2019) - Page - 05
Salih ZA Austin Publishing Group
Submit your Manuscript | www.austinpublishinggroup.com
concentrations of Sodium.
Microbial load of yoghurt processed by added different levels of rice flour
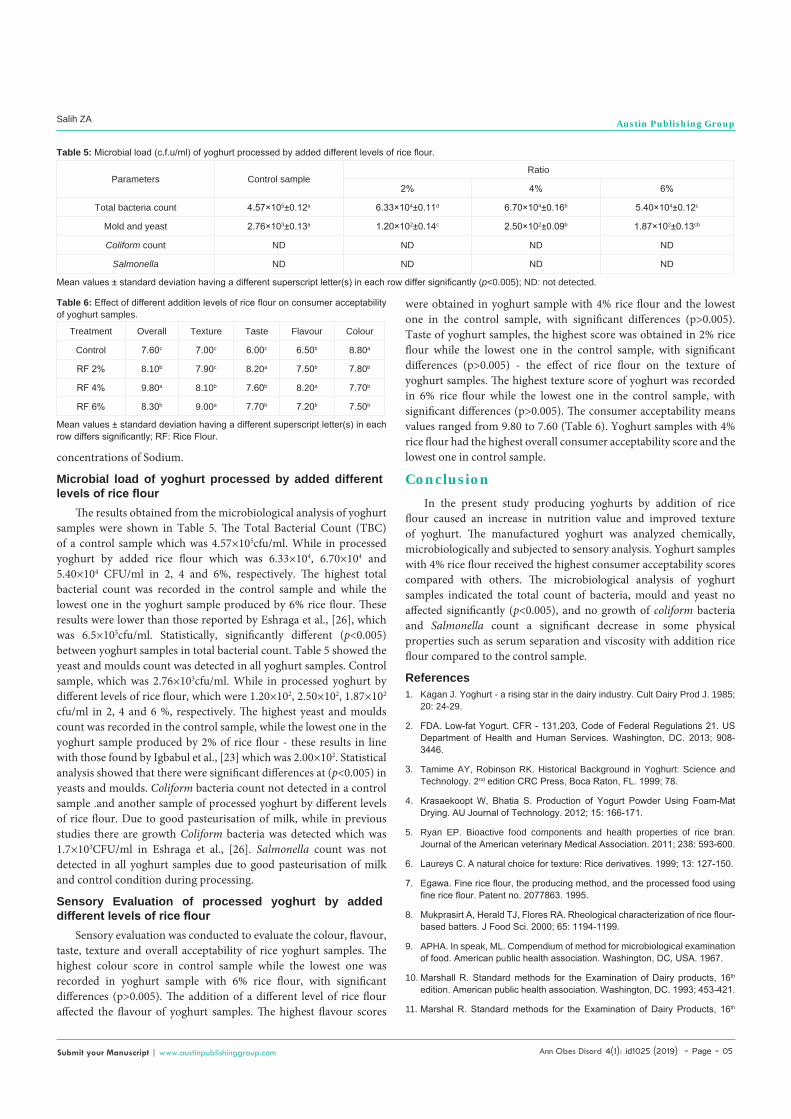
The results obtained from the microbiological analysis of yoghurt samples were shown in Table 5. The Total Bacterial Count (TBC) of a control sample which was 4.57×10⁵cfu/ml. While in processed yoghurt by added rice flour which was 6.33×10⁴, 6.70×10⁴ and 5.40×10⁴ CFU/ml in 2, 4 and 6%, respectively. The highest total bacterial count was recorded in the control sample and while the lowest one in the yoghurt sample produced by 6% rice flour. These results were lower than those reported by Eshraga et al., [26], which was 6.5×10⁵cfu/ml. Statistically, significantly different (p<0.005) between yoghurt samples in total bacterial count. Table 5 showed the yeast and moulds count was detected in all yoghurt samples. Control sample, which was 2.76×10³cfu/ml. While in processed yoghurt by different levels of rice flour, which were 1.20×10², 2.50×10², 1.87×10² cfu/ml in 2, 4 and 6 %, respectively. The highest yeast and moulds count was recorded in the control sample, while the lowest one in the yoghurt sample produced by 2% of rice flour - these results in line with those found by Igbabul et al., [23] which was 2.00×10². Statistical analysis showed that there were significant differences at (p<0.005) in yeasts and moulds. Coliform bacteria count not detected in a control sample .and another sample of processed yoghurt by different levels of rice flour. Due to good pasteurisation of milk, while in previous studies there are growth Coliform bacteria was detected which was 1.7×10³CFU/ml in Eshraga et al., [26]. Salmonella count was not detected in all yoghurt samples due to good pasteurisation of milk and control condition during processing.
Sensory Evaluation of processed yoghurt by added different levels of rice flour
Sensory evaluation was conducted to evaluate the colour, flavour, taste, texture and overall acceptability of rice yoghurt samples. The highest colour score in control sample while the lowest one was recorded in yoghurt sample with 6% rice flour, with significant differences (p>0.005). The addition of a different level of rice flour affected the flavour of yoghurt samples. The highest flavour scores
were obtained in yoghurt sample with 4% rice flour and the lowest one in the control sample, with significant differences (p>0.005). Taste of yoghurt samples, the highest score was obtained in 2% rice flour while the lowest one in the control sample, with significant differences (p>0.005) - the effect of rice flour on the texture of yoghurt samples. The highest texture score of yoghurt was recorded in 6% rice flour while the lowest one in the control sample, with significant differences (p>0.005). The consumer acceptability means values ranged from 9.80 to 7.60 (Table 6). Yoghurt samples with 4% rice flour had the highest overall consumer acceptability score and the lowest one in control sample.
ConclusionIn the present study producing yoghurts by addition of rice
flour caused an increase in nutrition value and improved texture of yoghurt. The manufactured yoghurt was analyzed chemically, microbiologically and subjected to sensory analysis. Yoghurt samples with 4% rice flour received the highest consumer acceptability scores compared with others. The microbiological analysis of yoghurt samples indicated the total count of bacteria, mould and yeast no affected significantly (p<0.005), and no growth of coliform bacteria and Salmonella count a significant decrease in some physical properties such as serum separation and viscosity with addition rice flour compared to the control sample.
References1. Kagan J. Yoghurt - a rising star in the dairy industry. Cult Dairy Prod J. 1985;
20: 24-29.
2. FDA. Low-fat Yogurt. CFR - 131.203, Code of Federal Regulations 21. US Department of Health and Human Services. Washington, DC. 2013; 908-3446.
3. Tamime AY, Robinson RK. Historical Background in Yoghurt: Science and Technology. 2nd edition CRC Press, Boca Raton, FL. 1999; 78.
4. Krasaekoopt W, Bhatia S. Production of Yogurt Powder Using Foam-Mat Drying. AU Journal of Technology. 2012; 15: 166-171.
5. Ryan EP. Bioactive food components and health properties of rice bran. Journal of the American veterinary Medical Association. 2011; 238: 593-600.
6. Laureys C. A natural choice for texture: Rice derivatives. 1999; 13: 127-150.
7. Egawa. Fine rice flour, the producing method, and the processed food using fine rice flour. Patent no. 2077863. 1995.
8. Mukprasirt A, Herald TJ, Flores RA. Rheological characterization of rice flour-based batters. J Food Sci. 2000; 65: 1194-1199.
9. APHA. In speak, ML. Compendium of method for microbiological examination of food. American public health association. Washington, DC, USA. 1967.
10. Marshall R. Standard methods for the Examination of Dairy products, 16th
edition. American public health association. Washington, DC. 1993; 453-421.
11. Marshal R. Standard methods for the Examination of Dairy Products, 16th
Parameters Control sample Ratio
2% 4% 6%
Total bacteria count 4.57×10⁵±0.12a 6.33×10⁴±0.11d 6.70×10⁴±0.16b 5.40×10⁴±0.12c
Mold and yeast 2.76×10³±0.13a 1.20×10²±0.14c 2.50×10²±0.09b 1.87×10²±0.13cb
Coliform count ND ND ND ND
Salmonella ND ND ND ND
Table 5: Microbial load (c.f.u/ml) of yoghurt processed by added different levels of rice flour.
Mean values ± standard deviation having a different superscript letter(s) in each row differ significantly (p<0.005); ND: not detected.
Treatment Overall Texture Taste Flavour Colour
Control 7.60c 7.00c 6.00c 6.50b 8.80a
RF 2% 8.10b 7.90c 8.20a 7.50b 7.80b
RF 4% 9.80a 8.10b 7.60b 8.20a 7.70b
RF 6% 8.30b 9.00a 7.70b 7.20b 7.50b
Table 6: Effect of different addition levels of rice flour on consumer acceptability of yoghurt samples.
Mean values ± standard deviation having a different superscript letter(s) in each row differs significantly; RF: Rice Flour.

Ann Obes Disord 4(1): id1025 (2019) - Page - 06
Salih ZA Austin Publishing Group
Submit your Manuscript | www.austinpublishinggroup.com
edition. APHA, Washington, DC. ME Schwartz, Cheese making Technology, Noyes Data Corporation, Park Ridge, NJ. 1992.
12. AOAC. “Official Methods of Analysis” Association of Official and Analytical Chemists Washington DC. 12th edition. 2005.
13. AOAC. Official methods of analysis. 13th edition. Association of Official Analytical Chemists. Washington, DC, USA. 1980.
14. AOAC. Association of Official Analytical Chemists: Official Methods of Analysis of the Association of Official Analytical Chemists. Thirteenth Edition. Association of Official Analytical Chemists (publisher), Washington, DC. USA. 2003; 1018.
15. AOAC. Official Methods of Analysis. (15th edition) association of Analytical. 1990.
16. Jeremia NM, Afam IO, Jideani. The physicochemical and sensory evaluation of commercial sour milk (amasi) products. African J. Food science. 2013; 7: 56-62.
17. Koksoy A, Kilic M. Effects of water and salt level on rheological properties of Ayran. Turkish yoghurt drink Int J Dairy Sci. 2003. 13: 835-839.
18. Salma M Siddig, Abdel Moneim E Sulieman, Zakaria A Salih, Abdelmuhsin A Abdelmuhsin. Quality Characteristics of White Cheese (Jibna-beida) Produced Using Camel Milk and Mixture of Camel Milk and Cow Milk. International Journal of Food Science and Nutrition Engineering. 2016; 6: 49-54.
19. Sohail MA. The role of the Arabian camel (Camel usdromedarius) in animal production. World. Rev. Anim. Prod. 1983; 19: 38-40.
20. Enb A, Donia A, Abd-Rabou NS, Abou-Arab AAK, El-Senaity MH. Chemical Composition of Raw Milk and Heavy Metals Behavior During Processing of Milk Products,Department of Dairy Science, National Research Center, El-Behoos St., Dokki, Giza, Egypt, Global Veterinaria. 2009; 3: 268-275.
21. Abdul Kader, Mitu Deb, Md Abdul Aziz. Evaluation of Physicochemical Properties and Microbiological Quality of Milk Collected from Different Dairy Farms in Slyest, Bangladesh Food Science and Technology. 2015; 3: 37-41.
22. Kavas Nazan. Some Properties of Set Type Yoghurts Produced from Camel (Camelus Dromedarius) Milk Enriched with Native Rice Flour and Skim Milk Powder,Dairy Products Program, Ege Vocational Training School, Ege University, 35100 İzmir, Turkey. 2016; 3.
23. Igbabul, Bibiana, Shember, Joseph, Amove, Julius. Physicochemical, microbiological and sensory evaluation of yoghurt sold in Makurdi metropolis. African Journal of Food Science and Technology. 2014; 5: 129-135.
24. Ibrahim Bhagiel, Mustafa EA, Tabidi MM, Ahmed MEM. Comparison between the physiochemical attributes of yogurt processed from camel milk and that processed from cow milk and the effect of storage period on pH and acidity .Department of Animal Production. 2015; 22: 3452-3111.
25. Abdelgadir WS, Ahmed TK, Direr HA. The traditional fermented milk products of the Sudan. 1998; 4: 1530-1 540.
26. Eissa EA, Yagoub AEA, Babiker EE, Ahmed IAM. Physicochemical, microbiological and sensory characteristics of yoghurt produced from camel milk during storage. Electronic journal environmental, agricultural and food chemistry. 2011; 10.
Citation: Salih ZA, Siddeeg A, Al-Farga Ammar, Ibrahim AIE and Ali AO. The Physicochemical, Microbiological and Sensory Properties of Yoghurt Processed by Addition of Rice Flour. Ann Obes Disord. 2019; 4(1): 1025.
Ann Obes Disord - Volume 4 Issue 1 - 2019Submit your Manuscript | www.austinpublishinggroup.com Salih et al. © All rights are reserved