The Persistence of Socio-Emotional Skills Life Cycle and...
54
HCEO WORKING PAPER SERIES Working Paper The University of Chicago 1126 E. 59th Street Box 107 Chicago IL 60637 www.hceconomics.org
Transcript of The Persistence of Socio-Emotional Skills Life Cycle and...

HCEO WORKING PAPER SERIES
Working Paper
The University of Chicago1126 E. 59th Street Box 107
Chicago IL 60637
www.hceconomics.org

The Persistence of Socio-Emotional SkillsLife Cycle and Intergenerational Evidence∗
Orazio Attanasio Áureo de Paula Alessandro Toppeta
September 2020
Abstract
This paper investigates the evolution of socio-emotional skills over the life cycle and acrossgenerations. We start by characterising the evolution of these skills in the first part of thelife cycle. We then examine whether parents’ socio-emotional skills in early childhood ratherthan in adolescence are more predictive of their children’s socio-emotional skills. We exploitdata from the 1970 British Cohort Study (BCS70) and focus on two dimensions of socio-emotional skills: internalizing and externalizing skills, linked respectively to the ability offocusing attention and engaging in interpersonal activities. When looking at the evolutionof socio-emotional skills over the life cycle, we notice a considerable amount of persistencewhich leads to a rejection of the simple Markov dynamic models often used in the literature.The BCS70 contains data on the skills of three generations. Moreover, the skills for cohortmembers and their children are not observed at the same calendar time, but at similar ages. Weestablish that parents’ and children’s socio-emotional skills during early childhood are com-parable and estimate intergenerational mobility in socio-emotional skills, examining the linkbetween the parent’s socio-emotional skills at age 5, 10 and 16 and the child’s socio-emotionalskills between ages 3 and 16. We show that the magnitudes of intergenerational persistenceestimates are smaller than the magnitude of intergenerational persistence estimates in occu-pation and income found for the United Kingdom. Finally, we estimate multi-generationalpersistence in socio-emotional skills and find that the grandmother’s internalizing skill corre-lates with the grandchild’s socio-emotional skills even after controlling for parental skills.
JEL codes: J62, D63, I21, J24Keywords: Intergenerational Mobility, Inequality, Socio-emotional Skills, Spectral gap mo-bility index.
∗Attanasio: Yale University, IFS and FAIR@NHH (e-mail: [email protected]); de Paula: University Col-lege London, CeMMAP and IFS (e-mail: [email protected]); Toppeta: University College London (e-mail: [email protected]). We thank participants to the Barcelona GSE Research Webinar on Children’s Health, Well-Being, and Human Capital Formation. We are grateful to the Centre for Longitudinal Studies (CLS), UCL Institute ofEducation, for the use of these data and to the UK Data Service for making them available. However, neither CLS northe UK Data Service bear any responsibility for the analysis or interpretation of these data.
1
1 Introduction
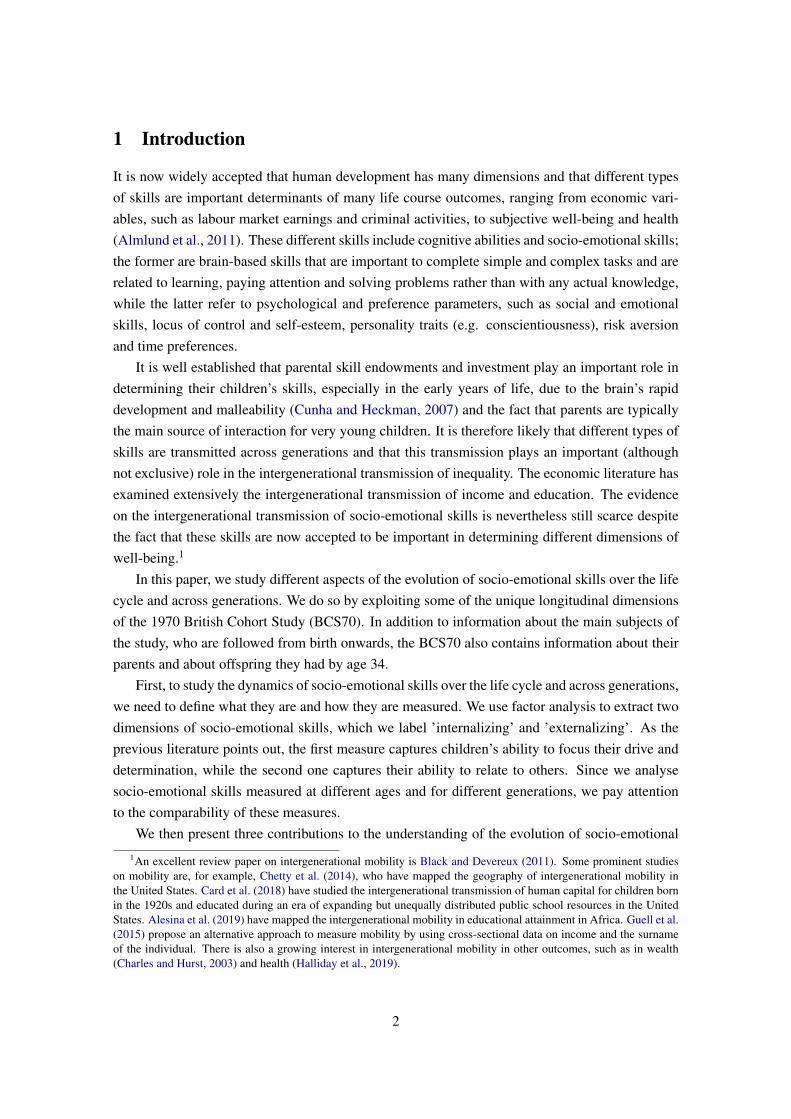
It is now widely accepted that human development has many dimensions and that different typesof skills are important determinants of many life course outcomes, ranging from economic vari-ables, such as labour market earnings and criminal activities, to subjective well-being and health(Almlund et al., 2011). These different skills include cognitive abilities and socio-emotional skills;the former are brain-based skills that are important to complete simple and complex tasks and arerelated to learning, paying attention and solving problems rather than with any actual knowledge,while the latter refer to psychological and preference parameters, such as social and emotionalskills, locus of control and self-esteem, personality traits (e.g. conscientiousness), risk aversionand time preferences.
It is well established that parental skill endowments and investment play an important role indetermining their children’s skills, especially in the early years of life, due to the brain’s rapiddevelopment and malleability (Cunha and Heckman, 2007) and the fact that parents are typicallythe main source of interaction for very young children. It is therefore likely that different types ofskills are transmitted across generations and that this transmission plays an important (althoughnot exclusive) role in the intergenerational transmission of inequality. The economic literature hasexamined extensively the intergenerational transmission of income and education. The evidenceon the intergenerational transmission of socio-emotional skills is nevertheless still scarce despitethe fact that these skills are now accepted to be important in determining different dimensions ofwell-being.1
In this paper, we study different aspects of the evolution of socio-emotional skills over the lifecycle and across generations. We do so by exploiting some of the unique longitudinal dimensionsof the 1970 British Cohort Study (BCS70). In addition to information about the main subjects ofthe study, who are followed from birth onwards, the BCS70 also contains information about theirparents and about offspring they had by age 34.
First, to study the dynamics of socio-emotional skills over the life cycle and across generations,we need to define what they are and how they are measured. We use factor analysis to extract twodimensions of socio-emotional skills, which we label ’internalizing’ and ’externalizing’. As theprevious literature points out, the first measure captures children’s ability to focus their drive anddetermination, while the second one captures their ability to relate to others. Since we analysesocio-emotional skills measured at different ages and for different generations, we pay attentionto the comparability of these measures.
We then present three contributions to the understanding of the evolution of socio-emotional1An excellent review paper on intergenerational mobility is Black and Devereux (2011). Some prominent studies
on mobility are, for example, Chetty et al. (2014), who have mapped the geography of intergenerational mobility inthe United States. Card et al. (2018) have studied the intergenerational transmission of human capital for children bornin the 1920s and educated during an era of expanding but unequally distributed public school resources in the UnitedStates. Alesina et al. (2019) have mapped the intergenerational mobility in educational attainment in Africa. Guell et al.(2015) propose an alternative approach to measure mobility by using cross-sectional data on income and the surnameof the individual. There is also a growing interest in intergenerational mobility in other outcomes, such as in wealth(Charles and Hurst, 2003) and health (Halliday et al., 2019).
2

skills. First, we characterise the dynamic properties of skill development and show that the simpleMarkov structure often used in the literature, where the level of skills at a certain age are a “suffi-cient statistic” for the level of subsequent skills, might be missing some important elements of theprocess. In particular, we show that the dynamic process for these skills may be quite complex andmight involve the interactions between different dimensions. We also show the returns that socio-emotional skills have on adult outcomes. Second, we study the intergenerational transmission ofskills by investigating to what extent parents’ socio-emotional skills, measured when they wereaged 5, 10 and 16, are associated with their children’s socio-emotional skills between the age of3 and 16. Our findings show that parental internalizing and externalizing skills during childhoodpredict their child’s internalizing and externalizing skills between the age of 3 and 16.2 Finally,a unique feature of the data we use is that allows us to estimate the association of grandparents’socio-emotional skills with the socio-emotional skills of their grandchildren. We show that theassociation of socio-emotional skills might be relevant across more than one generation.
Our study is not the first to look at the correlation of socio-emotional skills in the early yearson adult outcomes or at the intergenerational transmission of these skills. Heckman et al. (2013),Nandi and Nicoletti (2014), and Gensowski (2018), for instance, present evidence on the returnsto socio-emotional skills. As for the intergenerational transmission of skills, two important contri-butions to this literature in economics are Anger (2012) and Dohmen et al. (2011). These papersuse data from the German Socio-Economic Panel Study (SOEP) to study respectively the trans-mission of socio-emotional skills and attitudes from parents to children during adolescence andyoung adulthood. In another contribution, Gronqvist et al. (2016) use Swedish data from militaryenlistment records to study intergenerational transmission of cognitive and socio-emotional skills.The sample used in the analysis includes only men aged 18. Alana et al. (2017) study the trans-mission of risk attitudes from mothers to children through elicitation of risk in an incentivizedexperiment in Turkey. The psychological literature has also studied the intergenerational corre-lation of socio-emotional skills. Loehlin (2005) reviews several studies3 and concludes that thecorrelation in socio-emotional skills tends to be around 0.10 to 0.15 for young adult children butargues that those are likely to be underestimated because of self-reported measures, age, sample.Groves (2005) is another review situating these estimates between 0.14 and 0.29. Some of thesestudies are based on a small number of observations and lack representativeness. In any event, theestimates reviewed above are higher than the associations we find for age compatible associationsin early childhood (see, e.g., Appendix B).
Relative to the existing literature mentioned above on the intergenerational transmission ofsocio-emotional skills, this paper overcomes two drawbacks of existing analyses by exploitingunique features of the BCS70 data. First, the studies mentioned above, like most if not all ofthe existing literature, focus on measurements obtained during adolescence and early adulthood.At these development stages, skills and attitudes are likely to have developed and changed for
2Aside from other conventional measures for intergenerational mobility, we also use a new metric for mobilityacross generations which may be of interest on its own: the spectral gap mobility index.
3An example is Duncan et al. (2005) who uses the data from the National Longitudinal Survey of Youth (NLSY) tostudy personal traits and behaviours measured during adolescence.
3

other reasons, such as schooling and peer effects, which can be picked in the correlation, whilesocio-emotional skills are not fully developed during childhood and may still be quite malleable(Almlund et al., 2011). Adolescents’ socio-emotional traits may not bear a strong resemblanceto their parents’ socio-emotional traits if they have changed for other reasons in such a way thatthe intergenerational correlation for young adults decreases in size. This hints at a life cycle biaswhich is similar to the one we encounter when we use data about earnings that do not correspondto life earnings to study mobility.
Second, the main direction of intergenerational transmission is presumably from parents totheir children, but it is also possible that children influence their parents’ values and socio-emotionalskills. Previous studies, like some of those mentioned above, use contemporaneously measuredparents and children’s socio-emotional skills, which makes it difficult to rule out the possibilitythat children influence their parents’ skills. A high (low) correlation between parents and chil-dren’s socio-emotional skills and attitudes could, therefore, be found because of a convergence(or divergence) in skills and attitudes during adulthood when the children can also affect parents’personality and attitudes.4
We tackle these two concerns by using multiple measures of socio-emotional skills collectedin different waves of the BCS70. We observe the BCS70 subjects’ socio-emotional skills at theage of 5, 10, and 16 and examine their association with their children’s skills between the agesof 3 and 16. First, using multiple observations of socio-emotional skills over the life cycle mit-igates the ‘lifecyle’ bias we allude to above and allows us to investigate whether parents’ socio-emotional skills in early childhood rather than in adolescence are more predictive of their child’ssocio-emotional skills. Second, and relatedly, socio-emotional skills are not contemporaneouslymeasured in the BCS70. Parents’ skills are measured during their childhood (at age 5, 10 and 16),while their children’s skills are measured 18 years later. Therefore, the main direction of intergen-erational transmission is presumably from parents to their children, ruling out the possibility ofchildren influencing their parents’ personality.
In addition to linear correlations between the parent and child’s socio-emotional skills, wepresent estimates of intergenerational transmission of socio-emotional skills based on rank regres-sions and intergenerational transition matrices, as in Chetty et al. (2014). While we are awareof the problems that may arise in rank regressions, we notice that the evidence we obtain fromdifferent methodologies is very similar.
We also compare the intergenerational mobility estimates on socio-emotional skills to the onesof the intergenerational persistence in other economic domains. We find a higher mobility insocio-emotional skills than in the intergenerational transmission of occupation (Bell et al., 2018)and income (Gregg et al., 2017; Rohenkohl, 2019) in the United Kingdom.5 Finally, we contributeto the literature by investigating to what extent the interdependence between the internalizing and
4Dohmen et al. (2011) try to tackle reverse causality due to contemporaneous measurements by using religion as aninstrumental variable for the child’s attitude, but the first stage indicates a weak instrumental variable problem even ifone accepts its validity.
5Rohenkohl (2019) uses income using data from the BHPS and Understanding Society survey, while Gregg et al.(2017) and Belfield et al. (2017) use data from the National Child Development Study (NCDS) and the British CohortStudy (BCS).
4

externalizing socio-emotional skills can play a role in the intergenerational skill transmission. Westudy which one of the two skill dimensions correlates to the other dimension more.
We examine multi-generational transmission of socio-emotional skills from grandmothers tograndchildren. Information on grandmother and grandchildren’s socio-emotional skill is rarelyfound in any dataset. The BSC70 is an exception because the cohort members’ mother was askedto complete the Malaise Inventory (Rutter et al., 1970) at the 1975, 1980 and 1986 sweeps.6
The rest of the paper is organised as follows. In Section 2, we introduce the 1970 BritishCohort Study data used in the analysis. Section 3 presents the derivation of the two dimensions ofsocio-emotional skill and Section 4 the measures of persistence in the process of human develop-ment examined in this paper. In Section 5, we present the estimates about the life cycle dynamicsof socio-emotional skills. In Section 6, we present the estimates of the life cycle dynamics andintergenerational mobility in socio-emotional skills. Section 7 investigates multi-generational per-sistence in socio-emotional skills by examining the correlation between grandmother and grand-child’s socio-emotional skill. Section 8 summarizes the results and concludes.
2 Data sources
We make use of a unique longitudinal database, the 1970 British Cohort Study (BCS70), whichfollows the lives of around 17,000 individuals born in England, Scotland and Wales in a singleweek of 1970 and is publicly available at the UK Data Service. Cohort members have been con-tacted nine times, resulting in information at age 5, 10, 16, 26, 30, 34, 38, 42 and 46. We use theage 5, 10, and 16 sweeps to derive socio-emotional measures for the cohort members. The age 34sweep also provides substantial information on the offspring of the cohort members, including anumber of tests aimed at measuring their socio-emotional skills. We concentrate on the sample ofcohort members linked to their children and present descriptive statistics on the sample of BCS70with children in Table C3 in Appendix C.7
The BCS70 sample’s socio-emotional skills were measured at ages 5, 10 and 16 using theRutter A and Strengths and Difficulties Questionnaire (SDQ). These tests were also administeredduring the age 34 sweep to the children of the cohort members aged between 3 and 16. In Table1, we present the questions from these tests (Rutter et al., 1970; Goodman, 1994).
The Rutter and SDQ are behavioural screening scales, where mothers are asked whether theirchildren exhibit a series of behaviours, known as the items of the scale.8 Items are rated on threelevels: ‘Does not apply’, ‘Somewhat applies’, ‘Certainly applies’. Since they are all behavioursindicating lower skills, we recode all of them in reverse for the ease of interpretation, with higher
6Johnson et al. (2013) study multi-generational mobility in mental health across three generations using the BCS70,but find no correlation between the grandmother and grandchild’s mental health. In the psychiatry literature, Hancocket al. (2013) do a similar exercise in Australia. We discuss their approach to study multi-generational mobility in mentalhealth when we measure multi-generational in socio-emotional skills.
7Please see Tables C4 and C5 in Appendix C respectively for sample sizes in age 34 sweep and response rates forthe socio-emotional questions retained in the analysis in the age 5, 10, 16 and 34 sweeps.
8The SDQ scale was developed to consider advances in child psychopathology and includes positive as well asundesirable traits.
5

Table 1: Rutter A and Strengths and Difficulties Questionnaire ScalesRutter A scale administered to parents when they were 5, 10 and 16 years old
1. Very restless. Often running about or jumping up and down. Hardly ever still.∗ 2. Is squirmy or fidgety.∗
3. Often destroys own or others’ belongings. 4. Frequently fights other children.∗
5. Not much liked by other children. 6. Often worried, worries about many things.∗
7. Tends to do things on his/her own, is rather solitary.∗ 8. Irritable. Is quick to fly off the handle.9. Often appears miserable, unhappy, tearful or distressed.∗ 10. Sometimes takes things belonging to others.11. Has twitches, mannerisms or tics of the face or body. 12. Frequently sucks thumb or finger.13. Frequently bites nails or fingers. 14. Is often disobedient.∗
15. Cannot settle to anything for more than a few moments.∗ 16. Tends to be fearful or afraid of new things or newsituations.∗
17. Is over fussy or over particular. 18. Often tells lies.19. Bullies other children.∗ A. Complains of headaches.∗
B. Complains of stomach-ache or has vomited.∗ C. Complains of biliousnessD. Has temper tantrums (that is, complete loss of temper
with shouting, angry movements, etc.).∗
Strengths and Difficulties Questionnaire scale administered to children when they were between the age 3-16
1. Considerate of other people’s feelings+ 2. Restless, overactive and not able to sit still for long∗
3. Often complaining of headaches, stomach-aches or sickness∗ 4. Sharing readily with other children (treats, toys, pencils etc.)+
5. Has often had temper tantrums or hot tempers∗ 6. Rather solitary, tending to play alone∗
7. Generally obedient, usually doing what adults requested∗ + 8. Many worries, often seeming worried∗
9. Helpful if someone was hurt, upset or feeling ill+ 10. Constantly fidgeting and squirming∗
11. Has had at least one good friend + 12. Has often had fights with other children or bullies them∗
13. Often unhappy, downhearted or tearful∗ 14. Generally liked by other children +
15. Easily distracted, concentration wandered∗ 16. Nervous or clingy in new situations, easily loses confidence∗
17. Kind to younger children + 18. Often lied or cheated†
19. Picked on or bullied by other children 20. Has often volunteered to help others (parents, teachers, other children)+
21. Able to think things out before acting† + 22. Stole from home, school or elsewhere†
23. Getting on better with adults than with other children 24. Many fears, easily scared25. Has seen tasks through to the end, good attention span +
Note. The Rutter and Strengths and Difficulties Questionnaire items are rated on three levels: ‘Does not apply’, ‘Somewhat applies’, ‘Certainlyapplies’. Since they are all behaviours indicating lower skills, we recode all of them in reverse, i.e. ‘Certainly applies’ = 0, ‘Somewhat applies’ =1, ‘Does not apply’ = 2. The question of the Rutter items in the BCS70 administered when parents were 16 years old refers to the teenager. Itemsdenoted by + are positively coded in the original scale. Items denoted by ∗ are retained in the new comparable scale. Items denoted by † are askedonly to the children aged 6-16.
values associated with better socio-emotional skills (i.e. ‘Certainly applies’ = 0, ‘Somewhat ap-plies’ = 1, ‘Does not apply’ = 2).9
3 Modelling the dimensions of socio-emotional skills
Socio-emotional skills are intrinsically difficult to measure. Factor analysis is commonly used toestimate socio-emotional skill measures from a number of behavioural screening scales, whereparents or teachers are asked to evaluate a number of items on the child’s behaviour. Table 1 isan example of the type of measures available and provides those measures we use in our factor
9We augment the Rutter Scale with three additional parent-reported questions from the parental questionnaire, itemsA, B, and D in Table 1. These are rated on 4 levels: ‘Never in the last 12 months’, ‘less than once a month’, ‘at leastonce a month’, ‘at least once a week’. We recode these into binary indicators, with ‘Never’ and ‘Less than once amonth’ to 1 and zero otherwise. At the age 10 sweep, the Rutter A scale is continuous from 0 to 100, where 0 means‘Does not apply’ and 100 means ‘Certainly applies’. We recode it in reverse. In order to make it comparable to theRutter A scale in the other waves, we recode the items as follows: if the response is below 40, we code the answer as0; if the response is between 40 and 70, we code the answer as 1; if the response is between 70 and 100, we code theanswer as 2.
6

analysis. We follow the literature and focus on two factors for the (internalizing and external-izing) socio-emotional skills encoded in these questions. With these variables, we start with anexploratory factor analysis to understand which of the available measures correspond to each ofthese factors. We then proceed to estimate a factor model.
3.1 Exploratory analysis
In what follows, we analyse the persistence over the life cycle and across generations of the twofactors that are typically used to represent socio-emotional skills. This approach has been used inthe previous literature (Attanasio et al., 2020; Moroni et al., 2019), where they have been labeledas ‘externalizing’ and ‘internalizing’ skills. The first measure captures the ability of children tofocus their drive and determination and the second one their ability to relate to others.
To justify our focus on two factors, we perform an exploratory factor analysis. We concentrateon the 11 items from the Rutter A and Strengths and Difficulties Questionnaire (SDQ) scale whichare common across the cohort members and their children (Table 2). Finally, we estimate the factorloadings from the exploratory factor analysis, based on decomposing the polychoric correlationmatrix of the items and using weighted least squares (Olsson, 1979).10 The solution is rescaledusing oblique factor rotation (Hendrickson and White, 1964). Table 3 presents the factor loadingswhich show a clear separation between items. In particular, we highlight that the factor loadingshave a similar magnitudes across groups, pointing out that there is a similar association betweenthe item and the factor across groups.
10The polychoric correlation is an estimate for the correlation between two normally distributed continuous randomvariables observed as ordinal variables.
7

Table 2: Subscale of comparable items
Itm. Factor Cat. Title Rutter Wording (Parents during childhood) SDQ Wording (Children aged 3-16)
1 EXT 3 Restless Very restless. Often running about or Restless, overactive andjumping up and down. Hardly ever still not able to sit still for long
2 EXT 3 Squirmy/fidgety Is squirmy or fidgety. Constantly fidgeting and squirming3 EXT 3 Fights/bullies Frequently fights other children Has often had fights
with other children or bullied them4 EXT 3 Distracted Cannot settle to anything Easily distracted, concentration wandered
for more than a few moments.5 EXT 2/3 Tantrums Has temper tantrums (that is, complete loss of temper Has often had temper tantrums or
with shouting, angry movements, etc.) hot tempers6 EXT 3 Disobedient Is often disobedient (+) Generally obedient, usually doing what
adults requested7 INT 3 Worried Often worried, worries about many things Many worries, often seeming worried8 INT 3 Fearful Tends to be fearful or afraid Nervous or clingy in new situations,
of new things or new situations easily loses confidence9 INT 3 Solitary Tends to do things on his/her own, Rather solitary,
is rather solitary tending to play alone10 INT 3 Unhappy Often appears miserable, unhappy, tearful or Often unhappy, downhearted or tearful
distressed11 INT 2/3 Aches Complains of headaches + Often complaining of headaches, stomach-aches
stomach-ache or has vomited or sickness
Note. Itm. is item number. Factor is the latent construct to which the item loads - EXT is externalizing skills, INT is internalizing skills. Cat. is thenumber of categories in which the item is coded - 2 denotes a binary item (applies/does not apply) and 3 denotes a 3-category item. Title is a short labelfor the item. Wording columns show the actual wording in the scales used in each of the cohort studies. Items denoted by (+) are positively coded inthe original scale.
8

Tabl
e3:
Loa
ding
sfr
omex
plor
ator
yfa
ctor
anal
ysis
onen
tire
sam
ple
BC
S-p
aren
tsat
age
5B
CS
-par
ents
atag
e10
BC
S-p
aren
tsat
age
16C
hild
ren
aged
3-16
Item
Title
Fact
or1
(EX
T)
Fact
or2
(IN
T)
Fact
or1
(EX
T)
Fact
or2
(IN
T)
Fact
or1
(EX
T)
Fact
or2
(IN
T)
Fact
or1
(EX
T)
Fact
or2
(IN
T)
1R
estle
ss0.
801
-0.1
530.
801
-0.1
220.
603
0.07
70.
863
-0.1
242
Squi
rmy/
fidge
ty0.
691
0.03
20.
741
-0.0
120.
616
0.11
20.
779
0.01
33
Figh
ts/b
ullie
s0.
506
-0.0
190.
592
0.03
80.
700
-0.0
090.
487
0.20
04
Dis
trac
ted
0.58
30.
074
0.65
10.
069
0.70
90.
058
0.64
30.
055
5Ta
ntru
ms
0.49
30.
174
0.51
00.
096
0.72
3-0
.019
0.54
90.
155
6D
isob
edie
nt0.
667
0.01
30.
684
0.01
30.
817
-0.1
790.
578
-0.0
617
Wor
ried
-0.0
980.
702
-0.0
260.
813
-0.0
690.
774
-0.1
060.
797
8Fe
arfu
l-0
.095
0.56
8-0
.121
0.81
3-0
.075
0.69
30.
064
0.47
09
Solit
ary
0.08
60.
300
0.04
00.
326
0.10
70.
439
-0.0
380.
481
10U
nhap
py0.
247
0.50
90.
250
0.52
90.
400
0.40
00.
052
0.79
211
Ach
es-0
.022
0.43
1-0
.009
0.44
30.
192
0.08
6-0
.009
0.54
0
Not
e.T
heta
ble
disp
lays
the
fact
ors
load
ings
obta
ined
from
expl
orat
ory
fact
oran
alys
is(E
FA)
bysa
mpl
e.T
heE
FAis
base
don
the
deco
mpo
sitio
nof
the
poly
chor
icco
rrel
atio
nm
atri
x,an
dus
esob
limin
rota
tion.
9

3.2 Factor model
To model formally the relationship between internalizing and externalizing skills and the avail-able measures, the Rutter and SDQ items, based on the results of the exploratory analysis de-scribed in section 3.1, we specify a factor model. We consider four groups of individuals c ∈{C1, C2, C3, C4}, corresponding respectively to the children of the cohort members, and the co-hort members at the age of 5, 10 and 16. Each individual is denoted by i = 1, ...., Nc. For eachindividual and group, we observe categorical item responses Xijc, corresponding to the commonRutter/SDQ scale questions (Table 2) where j indexes the 11 available items. We follow the liter-ature and assume a latent bi-dimensional vector of externalizing and internalizing socio-emotionalskills θic = (θEXTic , θINTic )
The relationship between the latent factors θic and the available measuresXijc is characterisedby item- and group-specific intercepts vjc and loadings λjc and is affected by an independentmeasurement error term uijc. The measures are defined in terms of the following variable:
X∗ijc = vjc + λ>jcθic + uijc (1)
We consider a dedicated factor structure, where each item loads only on one latent dimension, andfollow the structure found in the exploratory factor analysis (Heckman et al., 2013; Conti et al.,2010). We estimate the baseline model which is characterized by the bare minimum number ofassumptions with the parameterisation defined below (Wu and Estabrook, 2016).
Given the specification of the behavioural scale, the measures Xijc have a discrete nature andtake one of an ordered number of values. To allow for such measures we introduce item- andgroup-specific threshold parameters τjc as follows:
Xijc = s if τs,jc ≥ X∗ijc ≥ τs+1,jc for s = 0, 1, 2 (2)
with τ0,jc = −∞ and τ3,jc = ∞. We assume that the latent factors and the measurement errorterms are normally distributed:
θic ∼ N (κc, σ2θc) and uijc ∼ N (0, σ2c ) (3)
Finally, we make the normalisation assumption needed to deal with factor indeterminacy bysetting the mean κc and the variance σ2θc of the factor equal to 0 and 1 respectively. In addition, theintercepts vjc are equal to zero and the error variance σ2c to 1 , while the loadings λjc and thresholdτjc are free to vary.
Having estimated the factor model, we can use it to predict the latent factors θic for any indi-vidual, based on their observed values of the Rutter/SDQ items. These latent factors are weightedsums of the observed items, with the weights determined by the parameters of the fitted model.Indicators which are more reliable measures of a factor – namely those with larger loadings λjc –will receive higher weights in the calculation of a factor score for that factor. Figure 1 shows thedistributions of the two latent factors: internalizing and externalizing skills.
10

Figure 1: Distribution of Factor Scores
Internalizing
Externalizing
Note. These figures present the distributions of the internalizing and externalizing socio-emotional skills for the children andparents respectively at age 5, 10, and 16. Higher scores correspond to better skills. The distribution is estimated nonparametri-cally, using an Epanechnikov kernel. The scale of the Rutter/SDQ items at the age-5, age-16 and child-questionnaire sweep iscategorical. The scale of the Rutter items at the age-10 sweep is converted to a categorical variable.
11

In Appendix A, we follow Attanasio et al. (2020) and test for measurement invariance sinceany comparison between socio-emotional skills across different generations requires that the socio-emotional measures we derived have the same relationship with the latent constructs (Vandenbergand Lance, 2000; Putnick and Bornstein, 2016).
4 Measuring persistence in the process of human development
We perform the analysis of life cycle and intergenerational persistence of socio-emotional skills intwo steps. First, we estimate the two factor scores (internalizing and externalizing) for the cohortmembers and their children, as outlined in section 3.2. We then estimate the relevant persistencemeasures with different types of regressions, which we discuss below. In principle, we couldestimate all the parameters of interest in one step, estimating the relevant factor models and theregressions that describe their relationships jointly. However, since our measured indicators arecategorical this approach could be computationally costly.
4.1 Life cycle persistence
To estimate the life cycle persistence of socio-emotional skills we estimate various versions of thefollowing regressions.
Y ji,16 = φj16+α
j1,16Y
ji,10+α
j2,16Y
ji,5+β
j1,16Y
ki,10+β
j2,16Y
ki,5+ρ
>Xi+εji,16, j, k = int, ext. (4)
Y ji,10 = φj10 + αj1,10Y
ji,5 + βj1,10Y
ki,5 + ρ>Xi + εji,10, j, k = int, ext. (5)
where the subscript i identifies a member of the cohort and the superscripts j and k refer to theparticular dimension of socio-emotional skills we consider, where internalising or externalisingskills. Equation (4) models the skills at age 16, while equation (5) is for the skills at age 10. Inboth cases we let the skills at a given age to depend on the lagged value of that skill as well asother skills.
In modeling the evolution of socio-emotional skill and characterising their persistence over thelife cycle, we let not only the skills observed at the most recent age to play a role but also skillsobserved at previous ages. In this sense our model deviates from the standard Markov assumptionnormally used in the literature.
We further generalise the models in equations (4) and (5) to consider also the association ofsocio-emotional skills with past cognitive skills. For the age 16 socio-emotional skills we considerthe following model:
Y ji,16 = φj16 + αj1,16Y
ji,10 + αj2,16Y
ji,5 + βj1,16Y
ki,10 + βj2,16Y
ki,5 (6)
+γj1,16Ycogi,10 + γj2,16Y
cogi,5 + ρ>Xi + εji,16, j, k = int, ext.
12

while for the age 10 skills we have:
Y ji,10 = φj10 + αj1,10Y
ji,5 + βj1,10Y
ki,5 + γj1,10Y
cogi,5 + ρ>Xi + εji,10, j, k = int, ext. (7)
As cognitive skills can be important in several dimensions, we also estimate a regression sim-ilar to equation (6), but with the level of cognitive skills on the left-hand side.
Finally, using the age 42 sweep, we relate a number of adult outcomes, including employment,earnings and the probability of smoking, to both cognitive and socio-emotional skills at age 5, 10and 16.
4.2 Intergenerational mobility
To study how socio-emotional skills can be transmitted across generation, we relate a number ofoutcomes observed on the children of our cohort members to a number of outcomes observed intheir parents before they reached adulthood.
In particular, for each parent and child in household i we estimate:
Y Ci = φ+ γ>YP
i + ρ>Xi + εi (8)
where Y Ci is the child i’s socio-emotional skill score and YP
i is a vector of child i’s parent’ssocio-emotional skill observed at the age of 5, 10, and 16. γ is a vector of parameters measuringintergenerational mobility in socio-emotional skills (i.e. internalizing and externalizing skills).Higher values of the coefficient γ correspond to lower mobility. In our specifications, we controlfor a vector Xi of individual’s characteristics, which include the region of birth fixed effects, theparent’s gender, the child’s gender and age, the number of children in the household, the mother’sage at the parent’s birth, a dummy equal to 1 if the parent is the first born, the parent’s employmentstatus at the age of 34, the grandparent’s employment status, education and profession in 1975 andthe number of children in the parent’s household when the parent is 5 years old. We includethese controls to consider some other possible channels that might relate to skills. For example,the employment variables are here to proxy for other channels like income that might explainskills. Region of birth fixed effects can account for the fact that parents were born in differentgeographical areas. We also include controls on family characteristics to consider the fact that thefamily composition can influence skills.
Rank regression For each parent and child in household i we estimate:
RCi = α+ β>RPi + ρ>Xi + εi (9)
whereRCi is the child i’s socio-emotional skill score (rank) and RPi is a vector of child i’s parent’s
socio-emotional skill score (rank) at the age of 5, 10, and 16. β is a vector of parameters measuringintergenerational mobility (relative) in socio-emotional skills (i.e. internalizing and externalizing
13

skills). Higher values of the coefficient β correspond to lower mobility. We control for a vectorXi of individual’s characteristics which are the same as above.
We follow Chetty et al. (2014) and estimate rank regressions to capture monotone relation-ships possibly not encoded in the simple correlation between socio-emotional skill scores. Therelationship between parents’ and children’s socio-emotional scores is often non-linear, making asimple linear correlation possibly not a good summary of mobility at all points of the distribution.Another advantage of the rank-based measure is to possibly reduce the attenuation and lifecyclebias (Nybom and Stuhler, 2017).
We need to consider that data come from the prediction of the factor model estimated in section3. Therefore, we compute standard errors for equations 8 and 9 by bootstrapping both the factormodel and the regression. More specifically, first, we generate 1000 samples by block samplingwith replacement from the original sample (i.e. we randomly draw the entire history of the parent-child link with replacement from the original sample). Second, for each bootstrap sample, weestimate the factor model, predict the factors and then estimate the intergenerational mobilityregression.
Absolute mobility indexes Another common measure of intergenerational mobility is to studythe children’s outcomes from parents at a given quintile in the distribution (Chetty et al., 2014).For example, a measure which is often reported is the probability of going from the lowest to thehighest quintile of the socio-emotional skill distribution (Corak and Heisz, 1999).
LH = Pr(RCi ≥ 80|RPi < 20) (10)
We thus produce non-parametric matrices of transition probabilities across quintiles of thesocio-emotional skill distribution. We do this for the parents’ internalizing and externalizing skillat the age of 5, 10 and 16 to document how mobility may differ at different points of the socio-emotional skill distribution.
To facilitate comparison across the several matrices, we propose a summary measure to com-pare the different transition matrices and order them in terms of mobility. Our measure is basedon the difference between the largest and the second largest eigenvalues in the transition matrix.This difference is usually referred to as the ‘spectral gap.’ We thus call this measure the ‘spectralgap mobility index’. This measure is useful to understand how far the intergenerational transitionmatrices are from an identity matrix which corresponds to a table with no mobility across quin-tiles: all its eigenvalues are equal to one and the measure above, (1 - second largest eigenvalue),is zero. The discrepancy between one and the second largest could be seen as a departure fromzero mobility, where higher numbers of the ’spectral gap mobility index’ corresponds to highermobility.
14

5 Persistence in childhood socio-emotional skills over the life cycle
Table 4 presents the estimates of various versions of equations (4) and (5). The parameters’ esti-mates we present measure the degree and modality of persistence of socio-emotional skills overthe life cycle for the cohort we are considering. We estimate the parameters for the process ofboth internalizing (columns 1-4) and externalizing skills (columns 5-8) at different ages.11 Forall specifications we include a set of controls, which are the cohort member’s gender, the age ofthe cohort member’s mother at birth, a dummy equal to 1 if the cohort member is the first born,the employment status, education and profession of the cohort member’s parent in 1975, and thenumber of children in the cohort member’s household when the cohort member is 5 years old. Incolumns 1 and 5, we study to what extent parental skills at the age of 5 can predict their own skillsat the age of 10, whereas in other columns, we study to what extent parental skills at the age of 5and 10 can predict their own skills at the age of 16.
An interesting pattern emerges from the results in Table 4. Socio-emotional skills both at age5 and at age 10 predict skills during adolescence. Table 4 shows that one unit increase in theinternalizing skill at the age of 5 corresponds to 0.319 unit increase in the internalizing skill atthe age of 16, while one unit increase in the internalizing skill at the age of 10 corresponds to0.127 unit increase in the internalizing skill at the age of 16 (column 4). Even more surprisingly,one unit increase in the internalizing skill at the age of 5 corresponds to 0.229 unit increase in theexternalizing skill at the age of 16, while one unit increase in the externalizing skill at the age of 5corresponds to 0.181 unit increase in the externalizing skill at the age of 16 (column 8).12
Remarkably, skills at age 5 (both internalising and externalising), are important in predictingskills at age 16, even after controlling for skills at age 10. This evidence is suggestive of the im-portance of early childhood in the skill formation process. Usually, when studying skill formation,researchers estimate first-order Markov chain processes, where the skills today depend only on theskills in the previous period. When data for adjacent periods are not available, by recursive sub-stitution, one can get an expression where skill today depend on skills on the previous availableperiod. However, if the model’s assumptions are valid, conditioning on a certain period skills,future skills should not depend on the level of development in previous periods. Our results pointtowards extending these models to consider the skills not only in the previous period but also inearlier periods, especially in the early childhood.
The richer persistence we document can be due to a variety of reasons. First, our findingcould be due to the fact that early childhood skills are better measured than the ones at the ageof 10. Therefore, this would imply that they better predict subsequent development. However,it is also important to notice that the magnitudes of the coefficients of the skills at the age of 5do not substantially change as we include controls. Table 4 shows that one unit increase in theinternalizing skill at the age of 5 corresponds to 0.384 unit increase in the internalizing skill at theage of 16 when we do not control for externalizing skills (column 2), while the effect does notchange substantially when we include controls for externalizing skills (column 4). Second, it is
11Table C6 in Appendix C presents the contemporaneous correlation of internalizing and externalizing skill measures.12A similar pattern emerges if we use a rank regression, of the type we estimate for intergenerational correlations.
15

possible that the significance of early years development captures the presence of individual (inthis case family) fixed effects. Finally, it is possible that specific ages are particularly salient andimportant for the process of development. We cannot distinguish among these different sources ofpersistence without richer data. We leave this investigation to future research.
Another important pattern that the data highlight is the interdependence of skills. Namely,externalizing skills can predict internalizing skills and vice-versa. Columns 4 and 8 of Table 4constitute strong evidence in this respect. Internalising skills at age 5 seem to be particularlyimportant to predict age-16 skills of both types considered. Analogously, both externalising skillsat age 5 and 10 are important for age-16 socio-emotional skills.
Table 4: Persistence over the life cycle socio-emotional skillsDependent variable: Internalizing Externalizing
At age 10 At age 16 At age 16 At age 16 At age 10 At age 16 At age 16 At age 16(1) (2) (3) (4) (5) (6) (7) (8)
INT at age 5 0.292*** 0.384*** 0.319*** -0.029 0.366*** 0.229***(0.035) (0.030) (0.044) (0.041) (0.034) (0.049)
INT at age 10 0.229*** 0.127*** 0.210*** -0.043(0.031) (0.045) (0.035) (0.051)
EXT at age 5 0.127*** 0.269*** 0.088** 0.498*** 0.312*** 0.181***(0.033) (0.027) (0.039) (0.037) (0.030) (0.043)
EXT at age 10 0.217*** 0.137*** 0.314*** 0.343***(0.027) (0.040) (0.031) (0.045)
Observations 1702 1116 1116 1116 1702 1116 1116 1116R2 0.174 0.262 0.210 0.283 0.284 0.237 0.324 0.346Region of birth FE(BCS70 5y)
Yes Yes Yes Yes Yes Yes Yes Yes
Other controls Yes Yes Yes Yes Yes Yes Yes Yes
Note. All standard errors in parentheses are obtained using 1,000 bootstrap repetitions, taking into account the factor estimation stagethat precedes the regression (*** p<0.01, ** p<0.05, * p<0.1). The table presents estimates for the regression of parents’ persistencein skills (parent-children link). Other controls include the cohort member’s gender, the age of the cohort member’s mother at birth,a dummy equal to 1 if the cohort member is the first born, the employment status, education and profession of the cohort member’sparent in 1975, and the number of children in the cohort member’s household when the cohort member is 5 years old.
As mentioned above, to investigate further the process of socio-emotional skills formation, weconsider a specification where, in addition to the socio-emotional skills at age 5 and 10, in theregressions for socio-emotional skills at age 16, we also consider cognitive skills at ages 5 and10. We report the results in Table 5. We note that in the richer specifications in columns 4 and8, these cognitive skills are not associated significantly with socio-emotional skills of either typeconsidered.
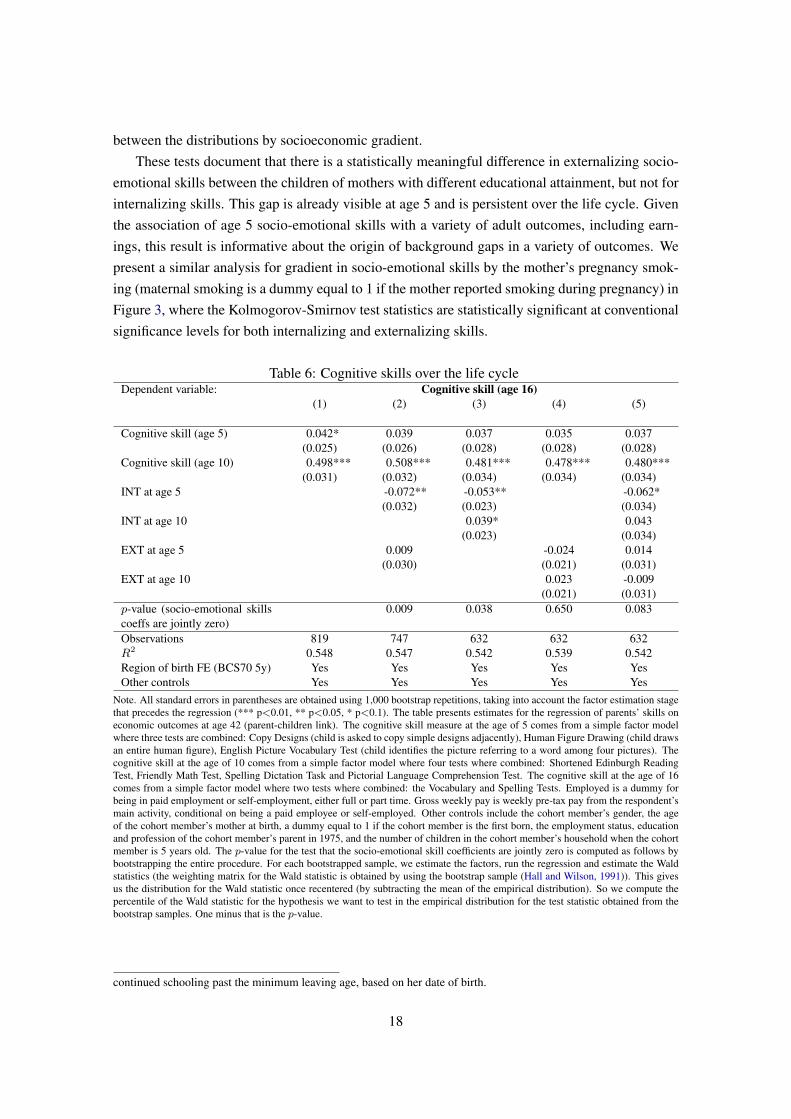
In Table 6, we also relate cognitive skills at age 16 with different types of skills at ages 5and 10.13 Interestingly, the dynamic patterns that emerge for cognitive skills are different fromthose for socio-emotional skills. In the richest specification considered in Column 5, it seems thatin addition to cognition at age 10, cognition at age 16 seems to be associated with internalisingsocio-emotional skills at age 5. This evidence is confirmed by the more parsimonious specificationin column 3. Whereas test statistics for the hypothesis that coefficient on socio-emotional skillsare jointly zero are associated with rather small p-values, this appears to be mostly driven by
13The response rate is lower at the age-16 sweep because of a teacher-led industrial strike disrupting the disseminationof the questionnaire. Only 2 cognitive tests (spelling test and vocabulary test) were fully completed out of 4 tests.
16

Table 5: Persistence in socio-emotional skills with cognitive skillDependent variable: Internalizing Externalizing
At age 10 At age 16 At age 16 At age 16 At age 10 At age 16 At age 16 At age 16(1) (2) (3) (4) (5) (6) (7) (8)
Cognitive skill (age 5) 0.058** -0.013 -0.020 -0.015 0.060* -0.001 -0.013 -0.008(0.028) (0.039) (0.039) (0.039) (0.031) (0.045) (0.045) (0.045)
Cognitive skill (age 10) 0.026 0.019 0.012 0.049 0.019 0.015(0.032) (0.032) (0.032) (0.034) (0.035) (0.035)
INT at age 5 0.321*** 0.385*** 0.342*** 0.001 0.362*** 0.226***(0.036) (0.033) (0.049) (0.042) (0.038) (0.054)
INT at age 10 0.214*** 0.099** 0.228*** -0.035(0.034) (0.049) (0.038) (0.056)
EXT at age 5 0.111*** 0.243*** 0.051 0.473*** 0.300*** 0.171***(0.034) (0.029) (0.044) (0.038) (0.033) (0.048)
EXT at age 10 0.231*** 0.163*** 0.346*** 0.366***(0.030) (0.044) (0.034) (0.050)
Observations 1610 914 914 914 1610 914 914 914R2 0.188 0.260 0.207 0.279 0.287 0.252 0.339 0.359Region of birth FE(BCS70 5y)
Yes Yes Yes Yes Yes Yes Yes Yes
Other controls Yes Yes Yes Yes Yes Yes Yes Yes
Note. All standard errors in parentheses are obtained using 1,000 bootstrap repetitions, taking into account the factor estimation stagethat precedes the regression (*** p<0.01, ** p<0.05, * p<0.1). The table presents estimates for the regression of parents’ persistencein skills (parent-children link). Other controls include the cohort member’s gender, the age of the cohort member’s mother at birth,a dummy equal to 1 if the cohort member is the first born, the employment status, education and profession of the cohort member’sparent in 1975, and the number of children in the cohort member’s household when the cohort member is 5 years old. The cognitiveskill measure at the age of 5 comes from a simple factor model where three tests are combined: Copy Designs (child is asked tocopy simple designs adjacently), Human Figure Drawing (child draws an entire human figure), English Picture Vocabulary Test (childidentifies the picture referring to a word among four pictures). The cognitive skill at the age of 10 comes from a simple factor modelwhere four tests where combined: Shortened Edinburgh Reading Test, Friendly Math Test, Spelling Dictation Task and PictorialLanguage Comprehension Test.
internalizing socio-emotional skills.14
Our next step is to check whether skills during early childhood can predict their outcomeslater in life. This allows us to contextualise our estimates on the evolution of socio-emotionalskills, given previous findings on how those relate to economic outcomes later in life. Table7 presents regressions of behavioural and economic outcomes at the age of 42 on skills duringchildhood. We highlight that socio-emotional skills during childhood can predict whether thecohort member smokes, is employed and how much she or he earns per week, conditional onbeing a paid employee or self-employed at the age of 42. These results are robust even aftercontrolling for own cognitive skill at the ages of 5 and 10 and the inclusion of their controls, suchas the cohort member’s gender, the age of the cohort member’s mother at birth, a dummy equal to1 if the cohort member is the first born, the employment status, education and profession of thecohort member’s parent in 1975, and the number of children in the cohort member’s householdwhen the cohort member is 5 years old.
A final pattern we document is the socio-economic gradient in socio-emotional skills. Figure2 presents the socio-economic gradient in socio-emotional skills for the sample of BCS70 cohortmembers for which we observe socio-emotional skills at ages 5, 10 and 16 for internalizing andexternalizing skills.15 We also report the p-value from Kolmogorov-Smirnov tests of equality
14The bootstrapped p-value for the test of the hypothesis that the coefficients on the internalising skills in column 5are jointly zero is 0.081, while the p-value for a similar hypothesis for the externalising skill coefficients is 0.930.
15The socioeconomic status is the mother’s education at the age-5 sweep; namely, a dummy equal to 1 if the mother
17
between the distributions by socioeconomic gradient.These tests document that there is a statistically meaningful difference in externalizing socio-
emotional skills between the children of mothers with different educational attainment, but not forinternalizing skills. This gap is already visible at age 5 and is persistent over the life cycle. Giventhe association of age 5 socio-emotional skills with a variety of adult outcomes, including earn-ings, this result is informative about the origin of background gaps in a variety of outcomes. Wepresent a similar analysis for gradient in socio-emotional skills by the mother’s pregnancy smok-ing (maternal smoking is a dummy equal to 1 if the mother reported smoking during pregnancy) inFigure 3, where the Kolmogorov-Smirnov test statistics are statistically significant at conventionalsignificance levels for both internalizing and externalizing skills.
Table 6: Cognitive skills over the life cycleDependent variable: Cognitive skill (age 16)
(1) (2) (3) (4) (5)
Cognitive skill (age 5) 0.042* 0.039 0.037 0.035 0.037(0.025) (0.026) (0.028) (0.028) (0.028)
Cognitive skill (age 10) 0.498*** 0.508*** 0.481*** 0.478*** 0.480***(0.031) (0.032) (0.034) (0.034) (0.034)
INT at age 5 -0.072** -0.053** -0.062*(0.032) (0.023) (0.034)
INT at age 10 0.039* 0.043(0.023) (0.034)
EXT at age 5 0.009 -0.024 0.014(0.030) (0.021) (0.031)
EXT at age 10 0.023 -0.009(0.021) (0.031)
p-value (socio-emotional skillscoeffs are jointly zero)
0.009 0.038 0.650 0.083
Observations 819 747 632 632 632R2 0.548 0.547 0.542 0.539 0.542Region of birth FE (BCS70 5y) Yes Yes Yes Yes YesOther controls Yes Yes Yes Yes Yes
Note. All standard errors in parentheses are obtained using 1,000 bootstrap repetitions, taking into account the factor estimation stagethat precedes the regression (*** p<0.01, ** p<0.05, * p<0.1). The table presents estimates for the regression of parents’ skills oneconomic outcomes at age 42 (parent-children link). The cognitive skill measure at the age of 5 comes from a simple factor modelwhere three tests are combined: Copy Designs (child is asked to copy simple designs adjacently), Human Figure Drawing (child drawsan entire human figure), English Picture Vocabulary Test (child identifies the picture referring to a word among four pictures). Thecognitive skill at the age of 10 comes from a simple factor model where four tests where combined: Shortened Edinburgh ReadingTest, Friendly Math Test, Spelling Dictation Task and Pictorial Language Comprehension Test. The cognitive skill at the age of 16comes from a simple factor model where two tests where combined: the Vocabulary and Spelling Tests. Employed is a dummy forbeing in paid employment or self-employment, either full or part time. Gross weekly pay is weekly pre-tax pay from the respondent’smain activity, conditional on being a paid employee or self-employed. Other controls include the cohort member’s gender, the ageof the cohort member’s mother at birth, a dummy equal to 1 if the cohort member is the first born, the employment status, educationand profession of the cohort member’s parent in 1975, and the number of children in the cohort member’s household when the cohortmember is 5 years old. The p-value for the test that the socio-emotional skill coefficients are jointly zero is computed as follows bybootstrapping the entire procedure. For each bootstrapped sample, we estimate the factors, run the regression and estimate the Waldstatistics (the weighting matrix for the Wald statistic is obtained by using the bootstrap sample (Hall and Wilson, 1991)). This givesus the distribution for the Wald statistic once recentered (by subtracting the mean of the empirical distribution). So we compute thepercentile of the Wald statistic for the hypothesis we want to test in the empirical distribution for the test statistic obtained from thebootstrap samples. One minus that is the p-value.
continued schooling past the minimum leaving age, based on her date of birth.
18

Figure 2: Socioeconomic gradient in socio-emotional skills at the age of 5, 10, and 16 (maternalschooling).
Note. The Figure presents the socioeconomic gradient in socio-emotional skills for the sample of parents that we use in the mainanalysis at the age of 5, 10 and 16 for internalizing and externalizing skills (parent-children link). The socioeconomic statusis the mother’s education at the age-5 sweep (dummy for whether the mother continued schooling past the minimum leavingage, based on her date of birth). Higher scores correspond to better skills. We report the means of the socio-emotional skill bysocioeconomic gradient and their standard errors between parentheses. The distribution is estimated nonparametrically, usingan Epanechnikov kernel. We report the p-value of a t tests on the equality of means between the two groups assuming unequalvariances. We report the p-value from Kolmogorov-Smirnov tests of equality between the distributions by socioeconomicgradient.
19

Figure 3: Socioeconomic gradient in socio-emotional skills at the age of 5, 10, and 16 (mother’spregnancy smoking).
Note. The Figure presents the socioeconomic gradient in socio-emotional skills for the sample of parents that we use in the mainanalysis at the age of 5, 10 and 16 for internalizing and externalizing skills (parent-children link). The socioeconomic status isthe mother’s pregnancy smoking (maternal smoking is a dummy equal to 1 if the mother reported smoking during pregnancy).Higher scores correspond to better skills. We report the means of the socio-emotional skill by socioeconomic gradient and theirstandard errors between parentheses. The distribution is estimated nonparametrically, using an Epanechnikov kernel. We reportthe p-value of a t tests on the equality of means between the two groups assuming unequal variances. We report the p-valuefrom Kolmogorov-Smirnov tests of equality between the distributions by socioeconomic gradient.
20

Table 7: Outcomes at age 42Dependent variable: Smoke Employed Log Pay
(1) (2) (3) (4) (5) (6)
Cognitive skill (age 5) -0.035 0.075*** -0.013(0.024) (0.020) (0.051)
Cognitive skill (age 10) -0.015 -0.011 0.191***(0.017) (0.017) (0.041)
INT at age 5 -0.023 -0.045* 0.006 0.009 0.105** 0.066(0.023) (0.026) (0.024) (0.026) (0.053) (0.059)
INT at age 10 -0.038* -0.040 0.028 0.048* -0.046 -0.032(0.024) (0.026) (0.024) (0.026) (0.055) (0.062)
INT at age 16 0.130*** 0.138*** -0.064*** -0.059** -0.104* -0.052(0.023) (0.026) (0.024) (0.027) (0.055) (0.061)
EXT at age 5 0.010 0.043* 0.009 -0.014 -0.170*** -0.123**(0.021) (0.023) (0.021) (0.024) (0.048) (0.054)
EXT at age 10 0.032 0.028 -0.054** -0.066*** 0.081 0.040(0.022) (0.024) (0.022) (0.023) (0.050) (0.056)
EXT at age 16 -0.122*** -0.139*** 0.096*** 0.081*** 0.138*** 0.116**(0.021) (0.024) (0.021) (0.023) (0.051) (0.056)
p-value (socio-emotional skillscoeffs are jointly zero)
0.001 0.000 .007 0.033 0.008 0.064
Observations 964 794 963 793 772 633R2 0.067 0.091 0.060 0.091 0.282 0.337Region of birth FE (BCS70 5y) Yes Yes Yes Yes Yes YesOther controls Yes Yes Yes Yes Yes Yes
Note. All standard errors in parentheses are obtained using 1,000 bootstrap repetitions, taking into account the factor estimation stagethat precedes the regression (*** p<0.01, ** p<0.05, * p<0.1). The table presents estimates for the regression of parents’ skills oneconomic outcomes at age 42 (parent-children link). Employed is a dummy for being in paid employment or self-employment, eitherfull or part time. Gross weekly pay is weekly pre-tax pay from the respondent’s main activity, conditional on being a paid employee orself-employed. The mean of parents who smoke is 15 percent, who are employed is 85 percent and the mean of log pay is 5.84. Thecognitive skill measure comes from a simple factor model where three tests administered at the age of 5 are combined: Copy Designs(child is asked to copy simple designs adjacently), Human Figure Drawing (child draws an entire human figure), English PictureVocabulary Test (child identifies the picture referring to a word among four pictures). The cognitive skill at the age of 10 comes froma simple factor model where four tests where combined: Shortened Edinburgh Reading Test, Friendly Math Test, Spelling DictationTask and Pictorial Language Comprehension Test. Other controls include the cohort member’s gender, the age of the cohort member’smother at birth, a dummy equal to 1 if the cohort member is the first born, the employment status, education and profession of thecohort member’s parent in 1975, and the number of children in the cohort member’s household when the cohort member is 5 years old.The p-value for the test that the socio-emotional skill coefficients are jointly zero is computed as follows by bootstrapping the entireprocedure. For each bootstrapped sample, we estimate the factors, run the regression and estimate the Wald statistics (the weightingmatrix for the Wald statistic is obtained by using the bootstrap sample (Hall and Wilson, 1991)). This gives us the distribution forthe Wald statistic once recentered (by subtracting the mean of the empirical distribution). So we compute the percentile of the Waldstatistic for the hypothesis we want to test in the empirical distribution for the test statistic obtained from the bootstrap samples. Oneminus that is the p-value.
21

6 Intergenerational mobility in socio-emotional skills
As discussed above, we study the transmission across generations of socio-emotional skills esti-mating equation (8). We do so using the sweep that contains information on the children of the1970 cohort, which was collected when the cohort members were about 34. We report the resultsof this exercise in Table 8, with the outcome variable being the child’s internalizing or externaliz-ing skills. In what follows, we refer to the cohort members as parents.
In the regression, we include a set of controls, which are the parent’s gender, the child’s gen-der, the number of children in the household, the mother’s age at the parent’s birth, a dummy equalto 1 if the parent is the first born, the parent’s employment status at the age of 34, the grandpar-ent’s employment status, education and profession in 1975, the number of children in the parent’shousehold when the parent is 5 years old, region of the parent’s birth fixed effects and age ofchild fixed effects. In columns 1-3, the outcome variable is the child’s internalizing skill, while incolumns 4-6 the outcome variable is the child’s externalizing skill.
In Table 8, we observe that parental skills during their childhood are important predictors oftheir children’s skills even after including a large set of controls. In particular, one unit increasein the parent’s internalizing skill at the age of 16 translates into a 0.109 unit increase in the child’sinternalizing skill (column 1), while one unit increase in the parent’s externalizing skill at the ageof 10 translates into a 0.078 unit increase in the child’s internalizing skill (column 2). In column3, we study the relationship between the child’s internalizing skills and the parent’s skills andfind that the magnitude of the coefficients of the parent’s internalizing skill at the age of 16 andexternalizing skill at the age of 10 increases when we control for other dimension of the socio-emotional skill. This points towards the importance of considering an interdependence acrossskills in the transmission process.
On the other hand, in columns 4-6, we study the relationship between the child’s externalizingskill and the parental skills (Table 8). The parent’s internalizing skill at the age of 16 is still animportant predictor for the child’s skill. One unit increase in the parent’s internalizing skill at theage of 16 translates in 0.191 unit increase in the child’s externalizing skill (column 4). This effectstill remains significant and the magnitude of the coefficient decreases slightly once we controlfor parental externalizing skills. Namely, in column 6, we observe that one unit increase in theparent’s internalizing skill at the age of 16 translates in 0.148 unit increase in child’s externalizingskill. While one unit increase in the parent’s externalizing skill at the age of 10 translates in 0.149unit increase in the child’s externalizing skill (column 5) and in 0.229 unit increase in child’sexternalizing skill when we control for the parent’s internalizing skills (column 6).16
Figures 4 and 5 present the binscatter plots for rank regressions (equation 9) when we residual-ize the socio-emotional skill rank and correlate the residualized rank of the child’s socio-emotionalskills (internalizing and externalizing) with the residualized rank of the parent’s skills at the ageof 5, 10 and 16. This is done in two steps. First, we regress each socio-emotional skill rank on theparent’s gender, the child’s gender, the number of children in the household, the mother’s age at
16The R2s have the same magnitude as in Anger (2012), Dohmen et al. (2011) and Charles and Hurst (2003).
22

the parent’s birth, a dummy equal to 1 if the parent is the first born, the parent’s employment statusat the age of 34, the grandparent’s employment status, education and profession in 1975, the num-ber of children in the parent’s household when the parent is 5 years old, region of the parent’s birthfixed effects and age of child fixed effects and obtain the residualized rank. Second, we correlatethe residualized rank of parent’s and child’s skills. This method should reduce the bias from otherpossible channels that can affect skills and make the results comparable to estimates in Table 9.
An interesting pattern emerges from the figures: the rank of parent’s socio-emotional skillsduring childhood is positively associated with the rank of child’s skills. This pattern holds for bothdimensions of socio-emotional skills. The magnitude of the rank slope ranges between 0.05 and0.16. In Appendix B, we present similar scatter plots for the intergenerational mobility equation(8) in levels (residualized socio-emotional skills) and for the rank regressions equation (9) whenwe do not include any controls.17
The magnitudes of our estimates in the rank regressions are smaller than the ones in the inter-generational mobility in occupation found in Bell et al. (2018), who use the Longitudinal Study ofEngland and Wales (LS), and income found by Rohenkohl (2019) who uses data on income fromthe BHPS and Understanding Society survey and Gregg et al. (2017), who use data from the Na-tional Child Development Study (NCDS) and the British Cohort Study (BCS).18 The nightingalerose chart in Figure 6 compares the rank regression coefficients from the studies mentioned above(without controls) when equation 9 is estimated without controls (see Figures B2 and B1).19
Table 9 presents the estimates for equation (9) respectively with the outcome variable beingthe rank of the child’s internalizing and externalizing skills. We include a set of controls, whichare the parent’s gender, the child’s gender, the number of children in the household, the mother’sage at the parent’s birth, a dummy equal to 1 if the parent is the first born, the parent’s employmentstatus at the age of 34, the grandparent’s employment status, education and profession in 1975,the number of children in the parent’s household when the parent is 5 years old, region of theparent’s birth fixed effects and age of child fixed effects. In columns 1-3, the outcome variable isthe rank of the child’s internalizing skill, while in columns 4-6 the outcome variable is the rank ofthe child’s externalizing skill.20
The rank regressions in table 9 show that an increase in one rank in the parent’s internalizingskill at the age of 16 translates in 0.107 increase in the rank of child’s internalizing skill (column1), while an increase in one rank in the parent’s externalizing skill at the age of 10 translates in0.125 increase in the rank of the child’s internalizing skill (column 2). These coefficients remainsignificant when we study to what extent skills are interdependent in the transmission process in
17In this instance, the relationship is nonlinear as previously noticed by the literature (Chetty et al., 2014).18Similar results have been found by Belfield et al. (2017), who use data from the National Child Development Study
(NCDS) and the British Cohort Study (BCS).19We urge caution in comparing our results to the findings in intergenerational mobility in income and/or occupation
because of different datasets, variables and model specifications.20At the age 10 sweep, teachers were also asked to answer socio-emotional questions similar to the ones asked to the
parents in the Rutter A questionnaire. We can also do the same exercise and estimate the intergenerational mobility insocio-emotional skills by using the questions answered by the teachers - instead of the parents - at the age 10 sweep.We present the results from the rank regression in Table B2 in Appendix B and highlight that we find similarities in ourestimates.
23

column 3. In columns 4-6, we study the relationship between the rank of the child’s externalizingskill and the parental skills. Importantly, the parent’s internalizing skill at the age of 16 andexternalizing skill at the age of 10 are still important predictors for the other dimension of thechild’s socio-emotional skill. An increase in one rank in the parent’s internalizing skill at the ageof 16 corresponds to 0.139 increase in the rank of the child’s externalizing skill and an increasein one rank in the parent’s externalizing skill at the age of 10 corresponds to 0.253 increase in therank of child’s externalizing skill (column 6).
As mentioned previously, some results in the extant literature focus on measurements takencontemporaneously for parent and child. Here we provide evidence on what we would encounterif we were to use contemporaneous measures of socio-emotional skills as in Dohmen et al. (2011)and Anger (2012), for example. Tables 10 and 11 present the estimates for intergenerational mo-bility for level and rank regressions when we use socio-emotional skill measures which are con-temporaneously measured for parents and children. Parents at the age-34 sweep were asked somesocio-emotional related questions, which we exploit to measure socio-emotional skill. We focuson the internalizing skill which is derived by a multi-factor model that considers 3 items (unhappy,worried and fearful) common across the 4 different waves. Column 1 in the tables reproduces theestimates from Column 1 in Tables 8 and 9 using this alternative measure for internalizing skills.Column 2 in the tables shows estimates using contemporaneous measures. Table 10, for example,shows that an increase in one unit in the parent’s internalizing skill translates in a 0.253-unit in-crease in the child’s internalizing socio-emotional skill. This coefficient is more than three timesas large as the coefficient we observe when we use measures of socio-emotional skills collectedin different waves and at different ages (column 1, Table 10).21 In column 3, we present estimatesfrom an instrumental variable regression where the socio-emotional skill at the age 34 is instru-mented by their own socio-emotional skill during childhood. The coefficient is noisily estimatedand not significant, but its magnitude is even higher. Finally, column 4 presents the first stage ofthe instrumental variable regression and F -statistics for the first stage are presented in the notes tothe tables.
Finally, Tables 12 and 13 report the transition matrices by quintile of the socio-emotional skilldistribution. We report them for the parents’ internalizing and externalizing skills at the age of 5,10 and 16. The transition probabilities report measures of directional mobility, highlighting howmobility may change at different quintile of the socio-emotional skill distribution. One advantageof reporting transition matrices is to gain a deeper understanding on whether intergenerationalpersistence in socio-emotional skills arises from what happens in the tails. Interestingly, childrenof very low socio-emotional or very high socio-emotional skill parents mostly stay in the samequintile as their parents, while children of parents in the middle of the socio-emotional skillsdistribution often end up in a different quintile from their parents.
We also notice that there are large variations in the percentage of children staying in the same21Fewer items are used to compute the socio-emotional skill measure since the age-34 sweep asked fewer socio-
emotional related questions. Interestingly, our estimates of intergenerational mobility do not change even if we changethe items considered to measure socio-emotional skills. We notice that the estimates of mobility from column in Table9 are robust and similar to the ones in column 1 in Table 11.
24

quintile of their parents as well as those moving up or down across different skills and ages. Theprobability of moving from the lowest to the highest quintile ranges from 13.1 to 21.1, highlight-ing the importance of distinguishing among skills. For each matrix, we also present the ‘spectralgap mobility index’ introduced earlier to facilitate comparison across matrices. The intergenera-tional transition matrix with higher mobility is the one relating the child’s internalizing skill to theparent’s externalizing skill at the age of 5, while the one with lower mobility is the one relatingthe child’s externalizing skill to the parent’s externalizing skill at the age of 10. The correlationbetween this measure and the rank regression coefficient estimates is -0.75 (the correlation is neg-ative because a higher rank coefficient implies lower mobility, while a high spectral gap mobilityindex implies higher mobility). This high correlation comes mostly from the mobility measuresof child’s externalizing skill on parent’s skill (the correlation is -0.90: almost the same ranking)rather than the child’s internalizing skill on parent’s skill (the correlation is -0.26).
Table 8: Intergenerational mobility (regression of child’s socio-emotional score on parent’ssocio-emotional score (internalizing) at the age of 5, 10 and 16)
Dependent variable: Internalizing (INT) Skills Externalizing (EXT) Skills(1) (2) (3) (4) (5) (6)
Parent’s INT at age 5 0.014 0.053 -0.036 -0.032(0.031) (0.044) (0.035) (0.051)
Parent’s INT at age 10 0.021 -0.058 0.036 -0.116**(0.032) (0.045) (0.036) (0.051)
Parent’s INT at age 16 0.109*** 0.136*** 0.191*** 0.148***(0.029) (0.043) (0.034) (0.050)
Parent’s EXT at age 5 -0.025 -0.055 -0.019 -0.004(0.028) (0.039) (0.031) (0.045)
Parent’s EXT at age 10 0.078*** 0.124*** 0.149*** 0.229***(0.028) (0.040) (0.031) (0.045)
Parent’s EXT at age 16 0.077*** -0.046 0.133*** 0.015(0.027) (0.040) (0.031) (0.045)
Observations 1101 1101 1101 1101 1101 1101R2 0.085 0.084 0.091 0.128 0.143 0.151Region of birth FE (BCS70 5y) Yes Yes Yes Yes Yes YesChild’s age FE Yes Yes Yes Yes Yes YesOther controls Yes Yes Yes Yes Yes Yes
Note. All standard errors in parentheses are obtained using 1,000 bootstrap repetitions, taking into account the factor estimation stagethat precedes the regression (*** p<0.01, ** p<0.05, * p<0.1). The table presents estimates for equation 8 on the intergenerationalmobility in socio-emotional skills (regression of child’s socio-emotional score on parent’s socio-emotional score at the age of 5, 10and 16). Other controls include the parent’s gender, the child’s gender, the number of children in the household, the mother’s age atthe parent’s birth, a dummy equal to 1 if the parent is the first born, the parent’s employment status at the age of 34, the grandparent’semployment status, education and profession in 1975 and the number of children in the parent’s household when the parent is 5 yearsold.
25

Figure 4: Association between the children’s residualized rank of externalizing skill and the par-ents’ residualized rank of socio-emotional skills at different ages.
Note. These figures present non-parametric binned scatter plots of the relationship between the children’s and the parent’sresidualized rank of socio-emotional skills. These figures are based on the socio-emotional skill scores built from factor analysis.Each panel plots the mean child socio-emotional skill within each parent socio-emotional skill bin. To construct each series, wegroup parents into 25 equally sized (4 percentile points) bins and plot the mean child’s skill versus the mean parent’s skill withineach bin. The slopes are estimated using an OLS linear regression on the microdata on the two dimensions of residualized rankof socio-emotional skills. All standard errors in parentheses are obtained using 1,000 bootstrap repetitions, taking into accountthe factor estimation stage that precedes the regression.
26

Figure 5: Association between the children’s residualized rank of internalizing skill and the par-ents’ residualized rank of socio-emotional skills at different ages.
Note. These figures present non-parametric binned scatter plots of the relationship between the children’s and the parent’sresidualized rank of socio-emotional skills. These figures are based on the socio-emotional skill scores built from factor analysis.Each panel plots the mean child socio-emotional skill within each parent socio-emotional skill bin. To construct each series, wegroup parents into 25 equally sized (4 percentile points) bins and plot the mean child’s skill versus the mean parent’s skill withineach bin. The slopes are estimated using an OLS linear regression on the microdata on the two dimensions of the residualizedrank of socio-emotional skills. All standard errors in parentheses are obtained using 1,000 bootstrap repetitions, taking intoaccount the factor estimation stage that precedes the regression.
27

Figure 6: Comparison of the mobility measures
Note. The nightingale rose chart presents a comparison of the mobility measures in socio-emotional skills from the rank regressions without controlsto the mobility measures (i.e., coefficients from the rank regressions) in other economic domains. Bell et al. (2018) and Rohenkohl (2019) study anolder cohort born respectively in 1974-83 and 1973-1991. Gregg et al. (2017) study mobility in income in the BCS70. Higher values of the rankcoefficient correspond to lower mobility.
28

Table 9: Intergenerational mobility (rank-rank) regression of child’s socio-emotional score onparent’s socio-emotional score (internalizing) at the age of 5, 10 and 16)
Dependent variable: Internalizing (INT) Skills Externalizing (EXT) Skills(1) (2) (3) (4) (5) (6)
Rank of parent’s INT at 5 0.024 0.073 -0.019 -0.013(0.030) (0.045) (0.030) (0.044)
Rank of parent’s INT at 10 0.044 -0.054 0.042 -0.109**(0.031) (0.045) (0.032) (0.045)
Rank of parent’s INT at 16 0.107*** 0.161*** 0.170*** 0.139**(0.030) (0.044) (0.031) (0.045)
Rank of parent’s EXT at 5 -0.047 -0.092** -0.028 -0.025(0.030) (0.045) (0.030) (0.044)
Rank of parent’s EXT at 10 0.125*** 0.172*** 0.171*** 0.253***(0.031) (0.044) (0.031) (0.044)
Rank of parent’s EXT at 16 0.075** -0.076* 0.124*** 0.009(0.031) (0.045) (0.031) (0.046)
Observations 1101 1101 1101 1101 1101 1101R2 0.084 0.084 0.094 0.130 0.147 0.154Region of birth FE (BCS70 5y) Yes Yes Yes Yes Yes YesChild’s age FE Yes Yes Yes Yes Yes YesOther controls Yes Yes Yes Yes Yes Yes
Note. All standard errors in parentheses are obtained using 1,000 bootstrap repetitions, taking into account the factor estimation stagethat precedes the regression (*** p<0.01, ** p<0.05, * p<0.1). The table presents estimates for equation 9 on the intergenerationalmobility in socio-emotional skills (rank-rank regression of child’s socio-emotional score on parent’s socio-emotional score at the ageof 5, 10 and 16). Other controls include the parent’s gender, the child’s gender, the number of children in the household, the mother’sage at the parent’s birth, a dummy equal to 1 if the parent is the first born, the parent’s employment status at the age of 34, thegrandparent’s employment status, education and profession in 1975 and the number of children in the parent’s household when theparent is 5 years old.
29

Table 10: Intergenerational mobility regression of child’s socio-emotional score on parent’ssocio-emotional score (internalizing) at the age of 5, 10, 16 and 34)
Dependent variable: Internalizing (INT) SkillsChild Child Child Parent (age 34)
(1) (2) (3) (4)(OLS) (OLS) (IV) (First Stage)
Parent’s INT (age 34) 0.253*** 0.444(0.031) (0.873)
Parent’s INT (age 5) 0.025 0.031(0.031) (0.031)
Parent’s INT (age 10) -0.001 0.038(0.032) (0.032)
Parent’s INT (age 16) 0.074** 0.160***(0.030) (0.031)
Observations 1101 1099 1099 1099R2 0.057 0.111 0.076 0.121Region of birth FE (BCS70 5y) Yes Yes Yes YesChild’s age FE Yes Yes Yes YesOther controls Yes Yes Yes Yes
Note. All standard errors in parentheses are obtained using 1,000 bootstrap repetitions, taking into account the factor estimation stagethat precedes the regression (*** p<0.01, ** p<0.05, * p<0.1). The table presents estimates for equation 9 on the intergenerationalmobility in socio-emotional skills. The internalizing skill is derived by a factor model that considers 3 items (unhappy, worried andfearful) common across the 4 different waves. Column 1 presents the regression of the child’s internalizing skill on the parent’sinternalizing skill at the age of 5, 10 and 16. Column 2 presents the regression of the child’s internalizing skill on the parent’sinternalizing skill at the age of 34. Column 3 presents the regression of the child’s internalizing skill on the parent’s internalizing skillat the age of 34 instrumented by the parent’s internalizing skill at the age of 5, 10 and 16. Column 4 presents the first stage of theinstrumental variable regression. The F-statistics for exclusion of the instruments is 13.46. Other controls include the parent’s gender,the child’s gender, the number of children in the household, the mother’s age at the parent’s birth, a dummy equal to 1 if the parent isthe first born, the parent’s employment status at the age of 34, the grandparent’s employment status, education and profession in 1975and the number of children in the parent’s household when the parent is 5 years old.
30

Table 11: Intergenerational mobility (rank-rank) regression of child’s socio-emotional scoreon parent’s socio-emotional score (internalizing) at the age of 5, 10, 16 and 34)
Dependent variable: Internalizing (INT) SkillsChild Child Child Parent (age 34)
(1) (2) (3) (4)(OLS) (OLS) (IV) (First Stage)
Parent’s INT at age 34 0.250*** 0.444(0.032) (0.383)
Parent’s INT at age 5 0.020 0.035(0.032) (0.032)
Parent’s INT at age 10 0.001 0.053(0.033) (0.034)
Parent’s INT at age 16 0.080** 0.164***(0.032) (0.033)
Observations 1101 1099 1099 1099R2 0.049 0.097 0.064 0.113Region of birth FE (BCS70 5y) Yes Yes Yes YesChild’s age FE Yes Yes Yes YesOther controls Yes Yes Yes Yes
Note. All standard errors in parentheses are obtained using 1,000 bootstrap repetitions, taking into account the factor estimation stagethat precedes the regression (*** p<0.01, ** p<0.05, * p<0.1). The table presents estimates for equation 9 on the intergenerationalmobility in socio-emotional skills. The internalizing skill is derived by a factor model that considers 3 items (unhappy, worried andfearful) common across the 4 different waves. Column 1 presents the rank-rank regression of the child’s internalizing skill on theparent’s internalizing skill at the age of 5, 10 and 16. Column 2 presents the rank-rank regression of the child’s internalizing skill onthe parent’s internalizing skill at the age of 34. Column 3 presents the rank-rank regression of the child’s internalizing skill on theparent’s internalizing skill at the age of 34 instrumented by the parent’s internalizing skill at the age of 5, 10 and 16. Column 4 presentsthe first stage of the instrumental variable regression. The F-statistics for exclusion of the instruments is 13.62. Other controls includethe parent’s gender, the child’s gender, the number of children in the household, the mother’s age at the parent’s birth, a dummy equalto 1 if the parent is the first born, the parent’s employment status at the age of 34, the grandparent’s employment status, education andprofession in 1975 and the number of children in the parent’s household when the parent is 5 years old.
31
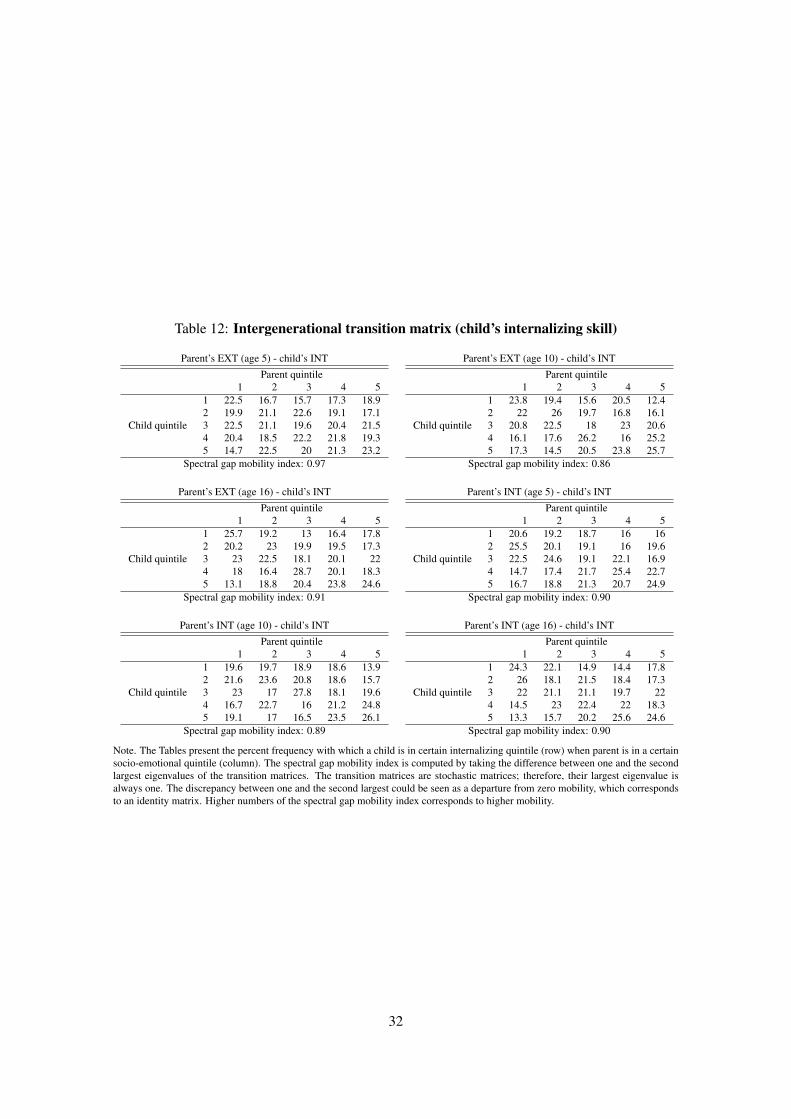
Table 12: Intergenerational transition matrix (child’s internalizing skill)
Parent’s EXT (age 5) - child’s INT
Parent quintile1 2 3 4 5
1 22.5 16.7 15.7 17.3 18.92 19.9 21.1 22.6 19.1 17.1
Child quintile 3 22.5 21.1 19.6 20.4 21.54 20.4 18.5 22.2 21.8 19.35 14.7 22.5 20 21.3 23.2
Spectral gap mobility index: 0.97
Parent’s EXT (age 10) - child’s INT
Parent quintile1 2 3 4 5
1 23.8 19.4 15.6 20.5 12.42 22 26 19.7 16.8 16.1
Child quintile 3 20.8 22.5 18 23 20.64 16.1 17.6 26.2 16 25.25 17.3 14.5 20.5 23.8 25.7
Spectral gap mobility index: 0.86
Parent’s EXT (age 16) - child’s INT
Parent quintile1 2 3 4 5
1 25.7 19.2 13 16.4 17.82 20.2 23 19.9 19.5 17.3
Child quintile 3 23 22.5 18.1 20.1 224 18 16.4 28.7 20.1 18.35 13.1 18.8 20.4 23.8 24.6
Spectral gap mobility index: 0.91
Parent’s INT (age 5) - child’s INT
Parent quintile1 2 3 4 5
1 20.6 19.2 18.7 16 162 25.5 20.1 19.1 16 19.6
Child quintile 3 22.5 24.6 19.1 22.1 16.94 14.7 17.4 21.7 25.4 22.75 16.7 18.8 21.3 20.7 24.9
Spectral gap mobility index: 0.90
Parent’s INT (age 10) - child’s INT
Parent quintile1 2 3 4 5
1 19.6 19.7 18.9 18.6 13.92 21.6 23.6 20.8 18.6 15.7
Child quintile 3 23 17 27.8 18.1 19.64 16.7 22.7 16 21.2 24.85 19.1 17 16.5 23.5 26.1
Spectral gap mobility index: 0.89
Parent’s INT (age 16) - child’s INT
Parent quintile1 2 3 4 5
1 24.3 22.1 14.9 14.4 17.82 26 18.1 21.5 18.4 17.3
Child quintile 3 22 21.1 21.1 19.7 224 14.5 23 22.4 22 18.35 13.3 15.7 20.2 25.6 24.6
Spectral gap mobility index: 0.90
Note. The Tables present the percent frequency with which a child is in certain internalizing quintile (row) when parent is in a certainsocio-emotional quintile (column). The spectral gap mobility index is computed by taking the difference between one and the secondlargest eigenvalues of the transition matrices. The transition matrices are stochastic matrices; therefore, their largest eigenvalue isalways one. The discrepancy between one and the second largest could be seen as a departure from zero mobility, which correspondsto an identity matrix. Higher numbers of the spectral gap mobility index corresponds to higher mobility.
32

Table 13: Intergenerational transition matrix (child’s externalizing skill)
Parent’s EXT (age 5) - child’s EXT
Parent quintile1 2 3 4 5
1 25.7 19.4 18.7 14.7 15.42 23.6 22 23.9 22.2 17.5
Child quintile 3 18.8 20.7 15.7 18.2 19.74 16.2 18.1 18.3 24.9 26.85 15.7 19.8 23.5 20 20.6
Spectral gap mobility index: 0.88
Parent’s EXT (age 10) - child’s EXT
Parent quintile1 2 3 4 5
1 32.7 20.3 16.4 16.8 10.12 20.2 28.6 27.5 17.2 14.7
Child quintile 3 18.5 18.5 13.9 22.5 19.74 14.3 19.8 20.1 20.1 29.45 14.3 12.8 22.1 23.4 26.1
Spectral gap mobility index: 0.78
Parent’s EXT (age 16) - child’s EXT
Parent quintile1 2 3 4 5
1 29 22.1 14.8 15.1 14.12 24.6 24.4 25 18.1 18.3
Child quintile 3 15.8 19.7 19.4 18.8 18.84 16.4 16.9 21.3 23.2 26.25 14.2 16.9 19.4 24.8 22.5
Spectral gap mobility index: 0.82
Parent’s INT (age 5) - child’s EXT
Parent quintile1 2 3 4 5
1 21.6 19.2 18.3 18.8 15.12 19.6 25.9 22.1 22.5 18.7
Child quintile 3 19.1 21 17.4 16.4 19.14 20.1 16.5 24.3 20.2 23.65 19.6 17.4 17.9 22.1 23.6
Spectral gap mobility index: 0.94
Parent’s INT (age 10) - child’s EXT
Parent quintile1 2 3 4 5
1 19.1 21.8 25.5 15 11.72 21.1 24.9 22.6 26.1 14.3
Child quintile 3 18.1 21.8 17 16.8 19.14 20.1 15.7 17.9 22.1 28.75 21.6 15.7 17 19.9 26.1
Spectral gap mobility index: 0.93
Parent’s INT (age 16) - child’s EXT
Parent quintile1 2 3 4 5
1 25.4 24 17.5 14.4 14.12 26 23.5 23.2 19.3 18.3
Child quintile 3 19.7 16.7 19.7 18.4 18.84 15 20.1 18.4 23.6 26.25 13.9 15.7 21.1 24.3 22.5
Spectral gap mobility index: 0.83
Note. The Tables present the percent frequency with which a child is in certain externalizing quintile (row) when parent is in a certainsocio-emotional quintile (column). The spectral gap mobility index is computed by taking the difference between one and the secondlargest eigenvalues of the transition matrices. The transition matrices are stochastic matrices; therefore, their largest eigenvalue isalways one. The discrepancy between one and the second largest could be seen as a departure from zero mobility, which correspondsto an identity matrix. Higher numbers of the spectral gap mobility index corresponds to higher mobility.
33

7 Multi-generational persistence in socio-emotional skills
During the 1975, 1980 and 1986 sweeps, the mothers of the subjects (i.e., grandmothers to thechildren of the 1970 cohort) were also asked some socio-emotional related questions. We exploitthese data to study multi-generational persistence in socio-emotional skills that is, the relationshipbetween the grandmother and grandchild’s socio-emotional skills.
The data on the grandmother’s socio-emotional skill in adulthood come from the cohort mem-bers’ mothers who have completed the Malaise Inventory (Rutter et al., 1970) in the 1975, 1980and 1986 sweeps.22 Table 14 presents the set of 24 ’yes-no’ self-completion questions asked tothe grandmothers to measure their levels of psychological distress, or depression.23 Individualsresponding ‘yes’ to eight or more of the 24 items are considered to be at risk of depression.24
We focus only on one dimension of socio-emotional skill, ‘internalizing skills’, for which wehave data comparable between grandmothers and grandchildren. Table 15 shows the questionsretained from both waves. Subsequently, we fit a multi-group factor model to derive the factorscore, as outlined in section 3, in order to study multi-generational mobility in socio-emotionalskills.
We begin by studying intergenerational mobility in socio-emotional skill by correlating the co-hort member’s and the mother’s internalizing skill. Table 16 presents the estimates from the levelregressions, while Table 17 presents the same estimates from the rank regression. We include a setof controls which are the cohort member’s gender, the age of the cohort member’s mother at birth,a dummy equal to 1 if the cohort member is the first born, the employment status, education andprofession of the cohort member’s parent in 1975, and the number of children in the cohort mem-ber’s household when the cohort member is 5 years old. We still find that the mother’s internalizingskill is positively correlated with the cohort member’s socio-emotional skills. However, we urgecaution in comparing these results to the main estimates for the following reasons. First, the con-trols we include are different. Second, the measures of skills for the mothers (aged around 25 yearsold in 1975) and the cohort members are contemporaneous. These results hint at the bias that wehighlight in Section 6 when we estimate intergenerational mobility in socio-emotional skills us-ing contemporaneous measures. The intergenerational mobility coefficients obtained from usingcontemporaneous measures of socio-emotional skills for the sample of parents and children (seecolumn 2 of Tables 10 and 11), estimated at around 0.25 in both cases, has the same magnitude asthe estimates obtained for the sample of grandmothers and parents, which uses contemporaneousmeasures of socio-emotional skills (see column 1 in Table 16 and 17). Interestingly, these results
22The Malaise Inventory was developed from the Cornell Medical Index Health Questionnaire which is comprisedof 195 self-completion questions.
23In the 1975 sweep the scale is binary, in the 1980 sweep the scale is continuous from 0 to 100 and in the 1986sweep the scale is categorical with 3 categories. We converted them to binary. We converted the continuous scale form0 to 100 (where 100 means "most of the times") to ’no behavioural problem’ (dummy equal to 1) if the answer is below80 and ’yes behavioural problem’ (dummy equal to 0) if the answer is above 80. We have tried different cutoffs and theresults are robust.
24Rodgers et al. (1999) show that that the internal consistency of the scale is acceptable and holds in differentsocioeconomic groups. Rutter et al. (1970) notice that ’the inventory differentiates moderately well between individualswith and without psychiatric disorder’.
34

do not depend on which items we include or not to derive the internalizing skill (in Tables 10 and11, we use only 3 items to derive the internalizing score).25
Tables 18 and 19 present the estimates for multi-generational persistence in the internalizingskill respectively when the outcome variable is the child’s raw internalizing score and the rank ofthe internalizing score. We include a set of controls which are the parent’s gender, the child’s gen-der, the number of children in the household, the mother’s age at the parent’s birth, a dummy equalto 1 if the parent is the first born, the grandparent’s employment status, education and professionin 1975, the number of children in the parent’s household when the parent is 5 years old, region ofthe parent’s birth fixed effects and age of child fixed effects.
The estimates show that the grandmother’s internalizing skill in adulthood is predictive of thegrandchild’s internalizing skill. This finding hints at a strong persistence in socio-emotional skillswhich goes back even to the grandmother’s generation. For example, Table 19 shows that anincrease in one rank in the grandmother’s internalizing skill in 1975 translates in an increase in0.086 rank in the grandchild’s internalizing skill (column 1) and in 0.053 rank in the grandchild’sinternalizing skill after we control for parental skills (column 5). The multi-generational mobilitycoefficient - namely, the grandmother’s internalizing skill at the 1975 sweep - is significant whenwe do not include any controls for the parent’s internalizing skill (column 1). This effect is alsorobust to controlling for the parents internalizing skills in the rank regressions on Table 19, thoughnot in the linear regression in Table 18 hinting at potential ‘masking’ by outliers (see (Rousseletand Pernet, 2012)).26
A strand of the literature has investigated multi-generational mobility in mental health, whichis related to a certain extent to socio-emotional skills. Johnson et al. (2013) study multi-generationalmobility in mental health across three generations by using the BCS70, but find no correlation be-tween the grandmother and grandchild’s mental health. Their approach to study multi-generationalmobility suffers from some of the problems which we have mentioned in the introduction and dis-cussed in Section 6. They measure parents’ mental health during adulthood, while they measurechildren’s mental health during childhood. In addition, contemporaneous measure of parents’ andchildren’s mental health are used from the age-34 sweep, which could lead to reverse causality ifthe disruptive child affects the parents’ mental health.27
25One alternative to discipline our estimates would be a statistical model where
Y Ci = γY P
i + εi, Y Ci = γY P
i + εi and Y Ci = γ × γY G
i + ηi,
where Y Ci and Y P
i are child and parent skills in childhood as previously defined and Y Pi and Y G
i are parent andgrandparent skills in adulthood.
26The p-value for a bootstrapped Wald test that the grandmothers’ internalizing skill coefficients are jointly differentfrom zero is 0.06 in column 5 from Table 19. For the linear regression (column 5 from Table 18), the p-value for sucha joint test is 0.573.
27Some other reasons for why Johnson et al. (2013) find no multi-generational correlation after controlling for parentscould be the following. Their measure of grandchildren’s mental health is not directly comparable to the ones ofgrandmothers and parents. For grandmothers and parents, they use the same questions, while for grandchildren theysum all the responses from SDQ which contains some items that are not mental health related. Finally, their measure ofmental health is obtained by averaging the responses to the mother mental health questionnaire, instead of estimating afactor model.
35

Table 14: Malaise Inventory QuestionsCohort members’ mothers (i.e. grandmothers to the children of the 1970 cohort)
answered the following questions
1. Tired Most of Time 13. Easily Upset or Irritated2. Often Feel Depressed 14. Frightened of Going Out3. Often Have Bad Headaches 15. Constantly Keyed Up, Jittery4. Often Get Worried 16. Suffer From Indigestion5. Sleeping Difficulty 17. Suffer From Upset Stomach6. Waking Unnecessarily Early 18. Is Appetite Poor7. Worn Out Worrying About Health 19. Everything Gets on Nerves8. Often Get Into Violent Rage 20. Does Heart Race9. Do People Annoy and Irritate 21. Often Have Bad Pains in Eyes10. Had Twitching of Face,Head 22. Rheumatism, Fibrositis11. Scared for No Good Reason 23. Had Nervous Breakdown12. Scared to be Alone 24. Other Health Problems
Note. The table reports the Malaise inventory questions. Cohort members’ mothers(i.e. grandmothers to the children of the 1970 cohort) answered them at the age-5sweep. The Malaise inventory questions are a set of self-completion questions whichcombine to measure levels of psychological distress, or depression. The 24 items ofthe inventory are ’yes-no’ questions.
Table 15: Subscale of comparable items between grandmother and grandchild
Itm. Factor Cat. Title Mother’s malaise (grandmother) Rutter Wording (Children aged 3-16)
1 INT 2 Worried Often Get Worried Many worries, often seeming worried2 INT 2 Fearful Scared for No Good Reason Nervous or clingy in new situations,3 INT 2 Unhappy Often Feel Depressed Often unhappy, downhearted or tearful4 INT 2 Aches Suffer From Upset Stomach Often complaining of headaches, stomach-aches
stomach-ache or has vomited or sickness5 INT 2 Solitary Scared to be alone Rather solitary, tending to play alone
Note. Itm. is item number. Factor is the latent construct to which the item loads - EXT is externalizing skills, INT is internalizingskills. Cat. is the number of categories in which the item is coded - 2 denotes a binary item (applies/does not apply). For the RutterWording (Children aged 3-16), 3-category item is converted to be binary (Does not apply is 1). Title is a short label for the item.Wording columns show the actual wording in the scales used in each of the cohort studies.
36

Table 16: Intergenerational mobility regression of parent’s socio-emotional score on grand-mother’s socio-emotional score (internalizing) and parent’s socio-emotional skill at the age of 5,10 and 16)
Dependent variable: Internalizing SkillsAt age 5 At age 10 At age 10 At age 16 At age 16 At age 16
(1) (2) (3) (4) (5) (6)
Grandmother’s INT (1975) 0.295*** 0.109*** 0.028 0.135*** 0.044 0.046(0.022) (0.024) (0.025) (0.028) (0.029) (0.029)
Grandmother’s INT (1980) -0.160*** -0.169*** 0.029 0.031 0.058*(0.024) (0.025) (0.029) (0.031) (0.031)
Grandmother’s INT (1986) 0.363*** 0.365*** 0.372***(0.028) (0.029) (0.030)
Parent’s INT at age 5 0.283*** 0.267*** 0.214***(0.030) (0.024) (0.030)
Parent’s INT at age 10 0.129***(0.030)
p-value (grandmother’s INT skillscoeffs are jointly zero)
0.000 0.000 0.000 0.000 0.000
p-value (parent’s INT skills coeffsare jointly zero)
0.000
Observations 1249 1265 1179 1296 1210 1145R2 0.170 0.121 0.199 0.202 0.257 0.272Region of birth FE (BCS70 5y) Yes Yes Yes Yes Yes YesOther controls Yes Yes Yes Yes Yes Yes
Note. All standard errors in parentheses are obtained using 1,000 bootstrap repetitions, taking into account the factor estimation stagethat precedes the regression (*** p<0.01, ** p<0.05, * p<0.1). The table presents estimates for equation 9 on the intergenerationalmobility in socio-emotional skills (regression of parent’s socio-emotional score on grandmother’s socio-emotional score (internalizing)and parent’socio-emotional skill at age 5, 10 and 16). Other controls include the cohort member’s gender, the age of the cohortmember’s mother at birth, a dummy equal to 1 if the cohort member is the first born, the employment status, education and professionof the cohort member’s parent in 1975, and the number of children in the cohort member’s household when the cohort member is 5years old. The p-value for the test that the socio-emotional skill coefficients are jointly zero is computed as follows by bootstrappingthe entire procedure. For each bootstrapped sample, we estimate the factors, run the regression and estimate the Wald statistics(the weighting matrix for the Wald statistic is obtained by using the bootstrap sample (Hall and Wilson, 1991)). This gives us thedistribution for the Wald statistic once recentered (by subtracting the mean of the empirical distribution). So we compute the percentileof the Wald statistic for the hypothesis we want to test in the empirical distribution for the test statistic obtained from the bootstrapsamples. One minus that is the p-value.
37

Table 17: Intergenerational mobility (rank-rank regression of parent’s socio-emotional scoreon grandmother’s socio-emotional score (internalizing) and parent’s socio-emotional skill at theage of 5, 10 and 16)
Dependent variable: Internalizing SkillsAt age 5 At age 10 At age 10 At age 16 At age 16 At age 16
(1) (2) (3) (4) (5) (6)
Grandmother’s INT (1975) 0.290*** 0.085*** 0.022 0.113*** 0.032 0.036(0.023) (0.024) (0.025) (0.028) (0.029) (0.029)
Grandmother’s INT (1980) -0.135*** -0.140*** 0.010 0.016 0.041(0.024) (0.025) (0.029) (0.031) (0.031)
Grandmother’s INT (1986) 0.297*** 0.297*** 0.298***(0.029) (0.030) (0.031)
Parent’s INT at age 5 0.220*** 0.262*** 0.206***(0.024) (0.030) (0.030)
Parent’s INT at age 10 0.172***(0.031)
p-value (grandmother’s INT skillscoeffs are jointly zero)
0.000 0.000 0.000 0.000 0.000
p-value (parent’s INT skills coeffsare jointly zero)
0.000
Observations 1249 1265 1179 1296 1210 1145R2 0.147 0.116 0.187 0.177 0.233 0.249Region of birth FE (BCS70 5y) Yes Yes Yes Yes Yes YesOther controls Yes Yes Yes Yes Yes Yes
Note. All standard errors in parentheses are obtained using 1,000 bootstrap repetitions, taking into account the factor estimation stagethat precedes the regression (*** p<0.01, ** p<0.05, * p<0.1). The table presents estimates for equation 9 on the intergenerationalmobility in socio-emotional skills (rank-rank regression of parent’s socio-emotional score on grandmother’s socio-emotional score(internalizing) and parent’s socio-emotional skill at age 5, 10 and 16). Other controls include the cohort member’s gender, the ageof the cohort member’s mother at birth, a dummy equal to 1 if the cohort member is the first born, the employment status, educationand profession of the cohort member’s parent in 1975, and the number of children in the cohort member’s household when the cohortmember is 5 years old. The p-value for the test that the socio-emotional skill coefficients are jointly zero is computed as follows bybootstrapping the entire procedure. For each bootstrapped sample, we estimate the factors, run the regression and estimate the Waldstatistics (the weighting matrix for the Wald statistic is obtained by using the bootstrap sample (Hall and Wilson, 1991)). This givesus the distribution for the Wald statistic once recentered (by subtracting the mean of the empirical distribution). So we compute thepercentile of the Wald statistic for the hypothesis we want to test in the empirical distribution for the test statistic obtained from thebootstrap samples. One minus that is the p-value.
38

Table 18: Multi-generational mobility regression of grandchild’s socio-emotional score ongrandmother’s socio-emotional score (internalizing) and parent’s socio-emotional skill at the ageof 5, 10 and 16)
Dependent variable: Internalizing Skills(1) (2) (3) (4) (5)
Grandmother’s INT (1975) 0.068** 0.046 0.062** 0.048* 0.022(0.029) (0.029) (0.030) (0.029) (0.031)
Grandmother’s INT (1980) 0.008 0.013 0.012 0.001 0.017(0.029) (0.030) (0.030) (0.029) (0.031)
Grandmother’s INT (1986) 0.041 0.045 0.045 0.017 0.041(0.028) (0.029) (0.029) (0.029) (0.031)
Parent’s INT at age 5 0.064** 0.040(0.031) (0.032)
Parent’s INT at age 10 0.035 0.008(0.028) (0.030)
Parent’s INT at age 16 0.078*** 0.050*(0.029) (0.031)
p-value (grandmother’s INT skillscoeffs are jointly zero)
0.010 0.080 0.026 0.156 0.573
p-value (parent’s INT skills coeffsare jointly zero)
0.095
Observations 1333 1237 1252 1285 1135R2 0.068 0.073 0.063 0.073 0.066Region of birth FE (BCS70 5y) Yes Yes Yes Yes YesChild’s age FE Yes Yes Yes Yes YesOther controls Yes Yes Yes Yes Yes
Note. All standard errors in parentheses are obtained using 1,000 bootstrap repetitions, taking into account the factor estimation stagethat precedes the regression (*** p<0.01, ** p<0.05, * p<0.1). The table presents estimates for equation 9 on the intergenerationalmobility in socio-emotional skills (regression of grandchild’s socio-emotional score on grandmother’s socio-emotional score (inter-nalizing) and parent’socio-emotional skill at age 5, 10 and 16). Other controls include the parent’s gender, the child’s gender, thenumber of children in the household, the mother’s age at the parent’s birth, a dummy equal to 1 if the parent is the first born, thegrandparent’s employment status, education and profession in 1975 and the number of children in the parent’s household when theparent is 5 years old. The p-value for the test that the socio-emotional skill coefficients are jointly zero is computed as follows bybootstrapping the entire procedure. For each bootstrapped sample, we estimate the factors, run the regression and estimate the Waldstatistics (the weighting matrix for the Wald statistic is obtained by using the bootstrap sample (Hall and Wilson, 1991)). This givesus the distribution for the Wald statistic once recentered (by subtracting the mean of the empirical distribution). So we compute thepercentile of the Wald statistic for the hypothesis we want to test in the empirical distribution for the test statistic obtained from thebootstrap samples. One minus that is the p-value.
39

Table 19: Multi-generational mobility (rank-rank regression of grandchild’s socio-emotionalscore on grandmother’s socio-emotional score (internalizing) and parent’s socio-emotional skill atthe age of 5, 10 and 16)
Dependent variable: Internalizing (INT) Skills(1) (2) (3) (4) (5)
Grandmother’s INT (1975) 0.086*** 0.070** 0.080*** 0.072** 0.053*(0.029) (0.030) (0.030) (0.029) (0.031)
Grandmother’s INT (1980) 0.009 0.016 0.013 0.007 0.022(0.029) (0.030) (0.030) (0.030) (0.031)
Grandmother’s INT (1986) 0.030 0.033 0.037 0.011 0.034(0.029) (0.030) (0.030) (0.030) (0.032)
Parent’s INT at age 5 0.050 0.030(0.031) (0.031)
Parent’s INT at age 10 0.028 0.005(0.028) (0.029)
Parent’s INT at age 16 0.070** 0.041(0.029) (0.031)
p-value (grandmother’s INT skillscoeffs are jointly zero)
0.001 0.010 0.001 0.028 0.060
p-value (parent’s INT skills coeffsare jointly zero)
0.091
Observations 1333 1237 1252 1285 1135R2 0.063 0.066 0.060 0.068 0.061Region of birth FE (BCS70 5y) Yes Yes Yes Yes YesChild’s age FE Yes Yes Yes Yes YesOther controls Yes Yes Yes Yes Yes
Note. All standard errors in parentheses are obtained using 1,000 bootstrap repetitions, taking into account the factor estimation stagethat precedes the regression (*** p<0.01, ** p<0.05, * p<0.1). The table presents estimates for equation 9 on the intergenerationalmobility in socio-emotional skills (rank-rank regression of grandchild’s socio-emotional score on grandmother’s socio-emotional score(internalizing) and parent’socio-emotional skill at age 5, 10 and 16). Other controls include the parent’s gender, the child’s gender,the number of children in the household, the mother’s age at the parent’s birth, a dummy equal to 1 if the parent is the first born, thegrandparent’s employment status, education and profession in 1975 and the number of children in the parent’s household when theparent is 5 years old. The p-value for the test that the socio-emotional skill coefficients are jointly zero is computed as follows bybootstrapping the entire procedure. For each bootstrapped sample, we estimate the factors, run the regression and estimate the Waldstatistics (the weighting matrix for the Wald statistic is obtained by using the bootstrap sample (Hall and Wilson, 1991)). This givesus the distribution for the Wald statistic once recentered (by subtracting the mean of the empirical distribution). So we compute thepercentile of the Wald statistic for the hypothesis we want to test in the empirical distribution for the test statistic obtained from thebootstrap samples. One minus that is the p-value.
40

8 Conclusion
This study investigates the life cycle dynamics and the intergenerational mobility in socio-emotionalskills in the United Kingdom by using unique data from the 1970 British Cohort Study. We noticea considerable amount of persistence in the life cycle dynamics of socio-emotional skills, provid-ing suggestive evidence of the importance of early childhood in the skill formation and pointingtowards extending these models to consider the skills not only in the previous period but also inearlier periods, especially in the early childhood.
In addition, our results contribute to the literature by providing an estimate of intergenera-tional mobility, which tackles some of the concerns on previous ones. First, the possibility to usemultiple observations of socio-emotional skills over the life cycle mitigates the ’lifecyle’ bias andquestions whether parents’ socio-emotional skills in early childhood rather than in adolescenceare more predictive of their child’s socio-emotional skills. Second, socio-emotional skills are notcontemporaneously measured in the BCS70. This means that the main direction of the intergen-erational transmission is presumably from parents to their children, ruling out the possibility ofchildren influencing their parents’ personality. We also move away from estimating the correla-tion between parents and children’s socio-emotional skills and estimate a rank regression of child’ssocio-emotional skills on parents’ socio-emotional skills measured at the age of 5, 10 and 16. Acomparison of our estimates to the ones on the intergenerational mobility in other economic do-mains shows that our estimates have a smaller magnitude to the ones found in the intragenerationalmobility in income and occupation in the United Kingdom (Bell et al., 2018; Gregg et al., 2017;Rohenkohl, 2019).
Multi-generational mobility in socio-emotional skills is finally investigated. We select itemsfrom the behavioural questionnaires which are comparable across children, parents and grand-mothers. We adopt methodological advances in multi-group factor analysis to establish that thegrandmother and grandchild’s socio-emotional skill measures are comparable. Our estimatesshow that the transmission of socio-emotional skills is quite persistent. The grandmother’s socio-emotional skill predicts her own grandchild’s socio-emotional skills.
41

References
Alana, S., N. Baydar, T. Boneva, T. F. Crossley, and S. Erta (2017). Transmission of risk prefer-ences from mothers to daughters. Journal of Economic Behavior & Organization 134, 60–70.3
Alesina, A., S. Hohmann, S. Michalopoulos, and E. Papaioannou (2019). Intergenerational mo-bility in Africa. CEPR Discussion Paper 13497. 2
Almlund, M., A. L. Duckworth, J. Heckman, and T. Kautz (2011). Personality psychology andeconomics. Handbook of the Economics of Education 4, 1–181. 2, 4
Anger, S. (2012). From Parents to Children: The Intergenerational Transmission of Advantage,Chapter Intergenerational Transmission of Cognitive and Noncognitive Skills, pp. 393 – 421.Russell Sage Foundation. 3, 22, 24
Attanasio, O., R. Blundell, G. Conti, and G. Mason (2020). Inequality in socioemotional skills: across-cohort comparison. Journal of Public Economics. 7, 12, 1
Belfield, C., C. Crawford, E. Greaves, P. Gregg, and L. Macmillan (2017). Intergenerationalincome persistence within families. IFS Working Paper W17/11. 4, 23
Bell, B., J. Blundell, and S. Machin (2018). The changing geography of intergenerational mobility.CEP Discussion Papers (CEPDP1591). 4, 23, 28, 41
Black, S. and P. Devereux (2011). Recent developments in intergenerational mobility. Handbookof Labor Economics 4B, 1487–1541. 2
Card, D., C. Domnisoru, and L. Taylor (2018). Intergenerational mobility in education during the’golden age’ of us mobility. NBER Working Paper 25000. 2
Charles, K. and E. Hurst (2003). The correlation of wealth across generations. Journal of PoliticalEconomy, 1155–1182. 2, 22
Chetty, R., N. Hendren, P. Kline, and E. Saez (2014). Where is the land of opportunity? Thegeography of intergenerational mobility in the United States. The Quarterly Journal of Eco-nomics 129, 1553–1623. 2, 4, 14, 23
Conti, G., J. Heckman, and S. Urzua (2010). The education-health gradient. American EconomicReview. 10
Corak, M. and A. Heisz (1999). The intergenerational earnings and income mobility of Canadianmen: Evidence from longitudinal income tax data. Journal of Human Resources. 14
Cunha, F. and J. Heckman (2007). The technology of skill formation. American Economic Review.2
42

Dohmen, T., A. Falk, D. Huffman, and U. Sunde (2011). The intergenerational transmission ofrisk and trust attitudes. The Review of Economic Studies 79(2), 645–677. 3, 4, 22, 24
Duncan, G., A. Kalil, S. E. Mayer, R. Tepper, and M. R. Payne (2005). The Apple Does Not FallFar From the Tree. Princeton University Press. 3
Gensowski, M. (2018). Personality, IQ, and lifetime earnings. Labour Economics, 170–183. 3
Goodman, R. (1994). A modified version of the Rutter parent questionnaire including extra itemson children’s strengths: A research note. Journal of Child Psychology and Psychiatry. 5
Gregg, P., L. Macmillan, and C. Vittori (2017). Moving towards estimating sons’ lifetime in-tergenerational economic mobility in the UK. Oxford Bulletin of Economics and Statistics 79(1)(79-100). 4, 23, 28, 41
Gronqvist, E., B. Ockert, and J. Vlachos (2016). The intergenerational transmission of cognitiveand noncognitive abilities. Journal of Human Resources. 3
Groves, M. O. (2005). Personality and the Intergenerational Transmission of Economic Status.Princeton University Press. 3
Guell, M., J. V. R. Mora, and C. Telmer (2015). The informational content of surnames, the evo-lution of intergenerational mobility, and assortative mating. The Review of Economic Studies,693–735. 2
Hall, P. and S. Wilson (1991). Two guidelines for bootstrap hypothesis testing. Biometrics. 18,21, 37, 38, 39, 40
Halliday, T., B. Mazumder, and A. Wong (2019). The intergenerational transmission of health inthe United States: A latent variables analysis. IZA Discussion Paper No. 12740. 2
Hancock, K., F. Mitrou, M. Shipley, D. Lawrence, and S. Zubrick (2013). A three generation studyof the mental health relationships between grandparents, parents and children. BMC Psychiatry.5
Heckman, J., R. Pinto, and P. Savelyev (2013). Understanding the mechanisms through whichan influential early childhood program boosted adult outcomes. American Economic Review,2052–86. 3, 10
Hendrickson, A. and P. White (1964). Promax: A quick method for rotation to oblique simplestructure. British Journal of Statistical Psycholog 17, 65–70. 7
Johnson, D., S. Schurer, and M. Shields (2013). Exploring the intergenerational persistence ofmental health: Evidence from three generations. Journal of Health Economics, 1077–89. 5, 35
Loehlin, J. (2005). Resemblance in Personality and Attitudes Between Parents and their Children.Genetic and Environmental Contributions. Princeton University Press. 3
43

MacCallum, R. C., M. W. Browne, and H. M. Sugawara (1996). Power analysis and determinationof sample size for covariance structure modeling. Psychological Methods 1, 130–149. 1
Moroni, G., C. Nicoletti, and E. Tominey (2019). Child socio-emotional skills: The role of parentalinputs. IZA working paper. 7
Nandi, A. and C. Nicoletti (2014). Explaining personality pay gaps in the UK. Applied Economics,3131–3150. 3
Nybom, M. and J. Stuhler (2017). Biases in standard measures of intergenerational income de-pendence. Journal of Human Resources. 14
Olsson, U. (1979). Maximum likelihood estimation of the polychoric correlation coefficient. Psy-chometrika 44, 443–460. 7
Putnick, D. and M. Bornstein (2016). Measurement invariance conventions and reporting: Thestate of the art and future directions for psychological research. Developmental Review 41,71–90. 12, 1
Rodgers, B., A. Pickles, C. Power, S. Collishaw, and B. Maughan (1999). Validity of the malaiseinventory in general population samples. Social Psychiatry and Psychiatric Epidemiology 34,333–341. 34
Rohenkohl, B. (2019). Intergenerational income mobility in the UK: New evidence using theBHPS and Understanding Society. SERPS no. 2019017. 4, 23, 28, 41
Rousselet, G. and C. Pernet (2012). Improving standards in brain-behavior correlation analyses.Frontiers in Human Neuroscience 6, 119. 35
Rutter, M., J. Tizard, and K. Whitmore (1970). Education, Health and Behaviour. 5, 34
Vandenberg, R. J. and C. E. Lance (2000). A review and synthesis of the measurement invarianceliterature: Suggestions, practices, and recommendations for organizational research. Organiza-tional Research Methods 3(1), 4–70. 12, 1
Wu, H. and C. Estabrook (2016). Identification of confirmatory factor analysis models of differentlevels of invariance for ordered categorical outcomes. Psychometrika 81(4), 1014–1045. 10, 1
44

Appendices to "Intergenerational Mobility in socio-emotional Skills"
A Measurement invariance
As in Attanasio et al. (2020), we test for measurement invariance since any comparison betweensocio-emotional skills across different generations requires that the socio-emotional measures wederived have the same relationship with the latent constructs (Vandenberg and Lance, 2000; Put-nick and Bornstein, 2016). Specifically, the items in the age 5, 10 and 16 sweeps for the cohortmembers and the child-sweep must measure internalizing and externalizing in the same way.
This is a formally testable property following the assumptions introduced by Wu and Es-tabrook (2016). Intuitively, this is done by comparing the baseline model, namely the maximalidentifiable model, with a series of models with stronger restrictions on the item- and cohort-specific intercepts vic and loadings λic, requiring them to be the same across groups. Their fit iscompared to see if the models with stronger restrictions have a worse fit. If this is not the case, theinvariance is achieved.
We estimate three models with additional restrictions that we can compare with the baselinemodel and assess their relative fit. First, we estimate the threshold invariant model which is ob-servationally equivalent to the baseline model when each item is a categorical variable with threecategories (Wu and Estabrook, 2016). We highlight that the number of parameters and fit areindeed the same for the baseline and threshold invariant model.
Second, we estimate the loading- and threshold-invariant model, which imposes stronger re-strictions. Namely, we impose that the factor loadings λic and the threshold on the parametersmust be the same between parents and children. This means that the items in the Rutter/SDQ scalefrom the children and parents have the same relationship with the latent skill because the factorloadings are the same across groups. If the fit of the model is similar to the baseline one, thensocio-emotional skills can be placed on the same scale and we can compare the variance.
Third, we estimate a loading-, threshold-, and intercept-invariant model. Namely, we imposethat the factor loadings λjc, the intercepts vjc and the threshold be the same between parents andchildren. If the fit of the model does not worsen compared to the baseline model, we can alsocompare the means of the socio-emotional skills between the two groups.
Table A1 compares the fit of each model. We first present the χ2 statistic, but also other alterna-tive goodness-of-fit indices commonly used, such as the root mean squared error of approximation(RMSEA), the comparative fit index (CFI), and the Tucker-Lewis index (TLI).2
The baseline model fits the data well. When we restrict the threshold and loadings to be thesame across groups, this yields a fit comparable to the baseline one. The fit worsens when we also
2The RMSEA is defined as√
(χ2 − df)/df(N − 1), where df are the degrees of freedom and N is the samplesize. Lower values imply a better fit and MacCallum et al. (1996) suggest measures between 0.05 and 0.08 to be fair.On the other hand, CFI and TLI determine how far our model is from the model with the model where the variableshave no correlation across them). The CFI is defined as (εNull Model − εAlternative Model)/εNull Model, where ε = χ2 − df ,whereas the TLI is defined as (εNull Model − εAlternative Model)/(εNull Model − 1), where now ε = χ2/df . Both indices arebetween 0 and 1 and a higher value corresponds to a better fit for the alternative model.
1

Table A1: Measurement invariance fit comparison
Model Number of parameters χ2 RMSEA CFI TLI
Baseline model/ Threshold Invariance 136 1875.935 0.061 0.959 0.947Threshold and loading invariance 108 2425.905 0.064 0.946 0.941Threshold, loading, and intercept invariance 81 5056.477 0.089 0.883 0.886
Note. The table compares the optimal number of factors suggested by different approaches. RMSEA stands for the rootmean squared error of approximation, CFI for the comparative fit index, and TLI for the Tucker-Lewis index.
restrict the intercepts to be the same, but still provides comparable fit according to the measuresabove.
B Mobility in socio-emotional skills
In this section, we report additional estimates of mobility in socio-emotional skills. Figures B1and B2 report binned scatter plots of the rank regression for internalizing and externalizing skillswhen we do not include any controls. Figures B3 and B4 present non-parametric binned scatterplots of the relationship between the children’s and the parent’s residualized socio-emotional skill.Table B2 presents estimates for equation 9 on the intergenerational mobility in socio-emotionalskills (rank-rank regression of child’s socio-emotional score on parent’s socio-emotional scoreat the age of 5, 10 and 16), where socio-emotional skill at the age-10 sweep are derived fromquestionnaire administered to teachers.
2

Figure B1: Association between the children’s percentile ranks of internalizing skill and the par-ents’ percentile ranks of socio-emotional skills at different ages.
Note. These figures present non-parametric binned scatter plots of the relationship between children’s and parent’s percentilesocio-emotional skill ranks. These figures are based on the socio-emotional skill scores built from factor analysis. Each panelplots the mean child percentile rank within each parent percentile rank bin. To construct each series, we group parents into 25equally sized (4 percentile point) bins and plot the mean child percentile rank versus the mean parent percentile rank within eachbin. The slopes are estimated using an OLS rank-rank regression on the microdata on the two dimensions of socio-emotionalskill. All standard errors in parentheses are obtained using 1,000 bootstrap repetitions, taking into account the factor estimationstage that precedes the regression.
3

Figure B2: Association between the children’s percentile ranks of externalizing skill and the par-ents’ percentile ranks of socio-emotional skills at different ages.
Note. These figures present non-parametric binned scatter plots of the relationship between children’s and parent’s percentilesocio-emotional skill ranks. These figures are based on the socio-emotional skill scores built from factor analysis. Each panelplots the mean child percentile rank within each parent percentile rank bin. To construct each series, we group parents into 25equally sized (4 percentile points) bins and plot the mean child percentile rank versus the mean parent percentile rank withineach bin. The slopes are estimated using an OLS rank-rank regression on the microdata on the two dimensions of socio-emotional skill. All standard errors in parentheses are obtained using 1,000 bootstrap repetitions, taking into account the factorestimation stage that precedes the regression.
4

Figure B3: Association between the children’s residualized externalizing skill and the parents’residualized socio-emotional skills at different ages.
Note. These figures present non-parametric binned scatter plots of the relationship between the children’s and the parent’sresidualized socio-emotional skill. These figures are based on the socio-emotional skill scores built from factor analysis. Eachpanel plots the mean child socio-emotional skill within each parent socio-emotional skill bin. To construct each series, we groupparents into 25 equally sized (4 percentile points) bins and plot the mean child’s skill versus the mean parent’s skill within eachbin. The slopes are estimated using an OLS linear regression on the microdata on the two dimensions of socio-emotional skill.All standard errors in parentheses are obtained using 1,000 bootstrap repetitions, taking into account the factor estimation stagethat precedes the regression.
5

Figure B4: Association between the children’s residualized internalizing skill and the parents’residualized socio-emotional skills at different ages.
Note. These figures present non-parametric binned scatter plots of the relationship between the children’s and the parent’sresidualized socio-emotional skill. These figures are based on the socio-emotional skill scores built from factor analysis. Eachpanel plots the mean child socio-emotional skill within each parent socio-emotional skill bin. To construct each series, we groupparents into 25 equally sized (4 percentile points) bins and plot the mean child’s skill versus the mean parent’s skill within eachbin. The slopes are estimated using an OLS linear regression on the microdata on the two dimensions of socio-emotional skill.All standard errors in parentheses are obtained using 1,000 bootstrap repetitions, taking into account the factor estimation stagethat precedes the regression.
6

Table B2: Intergenerational mobility (rank-rank) regression of child’s socio-emotional scoreon parent’s socio-emotional score (internalizing) at the age of 5, 10 and 16) - socio-emotional skillat the age-10 sweep derived from questionnaire administered to teachers.
Dependent variable: Internalizing (INT) Skills Externalizing (EXT) Skills(1) (2) (3) (4) (5) (6)
Rank of parent’s INT at 5 0.051 0.057* 0.016 -0.026(0.031) (0.034) (0.031) (0.035)
Rank of parent’s INT at 10 0.039 0.061* 0.004 0.057(0.030) (0.032) (0.030) (0.035)
Rank of parent’s INT at 16 0.123*** 0.187*** 0.178*** 0.166***(0.030) (0.033) (0.030) (0.035)
Rank of parent’s EXT at 5 0.023 -0.007 0.056* 0.074**(0.032) (0.034) (0.032) (0.036)
Rank of parent’s EXT at 10 0.011 0.061* 0.068** 0.109***(0.031) (0.033) (0.031) (0.036)
Rank of parent’s EXT at 16 0.097*** -0.073** 0.145*** 0.005(0.030) (0.033) (0.030) (0.035)
Observations 1133 1133 1133 1133 1133 1133R2 0.095 0.085 0.099 0.123 0.128 0.137Region of birth FE (BCS70 5y) Yes Yes Yes Yes Yes YesChild’s age FE Yes Yes Yes Yes Yes YesOther controls Yes Yes Yes Yes Yes Yes
Note. All standard errors in parentheses are obtained using 1,000 bootstrap repetitions, taking into account the factor estimation stagethat precedes the regression (*** p<0.01, ** p<0.05, * p<0.1). The table presents estimates for equation 9 on the intergenerationalmobility in socio-emotional skills (rank-rank regression of child’s socio-emotional score on parent’s socio-emotional score at the ageof 5, 10 and 16). Socio-emotional skill at the age-10 sweep derived from questionnaire administered to teachers. We do not includeitems for disobedient and aches because teachers were not administered such questions. Other controls include the parent’s gender,the child’s gender, the number of children in the household, the mother’s age at the parent’s birth, a dummy equal to 1 if the parent isthe first born, the parent’s employment status at the age of 34, the grandparent’s employment status, education and profession in 1975and the number of children in the parent’s household when the parent is 5 years old.
C Descriptive statistics
Table C3 reports the descriptive statistics for the sample of parent and children linked. Table C4presents the number of responses in the BCS70 at the age-34 sweep. Table C5 reports the responserates for the questionnaire items used in the main analysis. Table C6 reports the correlation matrixof internalizing and externalizing skills at different ages.
7

Table C3: Descriptive statisticsHousehold characteristics
Mean St.Dev. N(1) (2) (3)
Grandparents at age-5 sweepGrandmother’s age 25 5.02 1101Grandmother has higher education degree 0.06 0.23 1101Grandmother’s occupation: professional (%) 8.99 28.62 1101Grandmother’s occupation: managerial-technical (%) 34.79 47.65 1101Grandmother’s occupation: skilled non-manual (%) 5.72 23.24 1101Grandmother’s occupation: skilled manual (%) 18.17 38.57 1101Grandmother’s occupation: unskilled (%) 1.36 11.60 1101Grandfather’s occupation: professional (%) 4.61 20.83 1101Grandfather’s occupation: managerial-technical (%) 11.33 31.61 1101Grandfather’s occupation: skilled non-manual (%) 15.42 36.04 1101Grandfather’s occupation: skilled manual (%) 46.02 49.80 1101Grandfather’s occupation: unskilled (%) 18.50 38.77 1101
Parents (BCS70 cohort members)Number other children in HH (5y) 2 1.02 1101Number other children in HH (5y) 1.52 1.02 1101First born (%) 45.78 49.84 1101Male cohort member (%) 28.16 45.00 1101Employed at age 34 (%) 76.66 42.32 1101Region of birthNorth (%) 18.35 38.72 1101Yorksh. + Humbers. (%) 9.81 29.76 1101East Midlands (%) 7.36 26.12 1101West Midlands (%) 10.99 31.29 1101South West (%) 7.99 27.13 1101East + SE (%) 30.34 45.99 1101Wales (%) 6.45 24.57 1101Scotland (%) 8.72 28.22 1101Northern Ireland (%) 0.00 0.00 1101
Children at age-34 sweepTotal number of children 2 0.85 1101Child’s age 7 3.27 1101Child’s sex (%) 51.67 49.02 1101
Note. The mean is reported in column 1, the standard deviation in column 2, and the number of observations of parent-children linkin column 3. The occupation is based on the Registrar General’s social class.
Table C4: Number of responses in British Cohort Study (BCS70) at the age-34 sweepNumber of observations
BCS70 cohort members:Core interviews 9,665
Parent and Child Survey:Parent Interview 5,207Parent self-completions:Children aged 0-11 months 414Children aged 1-2 years 825Children aged 3-5 years 1,259Children aged 6-16 years 2,285
Note. This Table presents the sample sizes of the age 34 sweep. It containsthe number of completed interviews by the cohort members and parents(namely, cohort members with children). The sample sizes are also dividedby children’s age for the parents. The socio-emotional skill questions wereadministered only to the parents who have children between the age of 3and 16.
8

Table C5: Response rates for children and parents at age 5, 10, 16 and 34 sweeps
Itm. Factor Children Parents (age 5) Parents (age 10) Parents (age 16)
1 Restless 0.997 0.804 0.852 0.6192 Squirmy/fidgety 0.997 0.801 0.850 0.6203 Fights/bullies 0.998 0.810 0.850 0.6174 Distracted 0.998 0.809 0.851 0.6185 Tantrums 0.998 0.775 0.813 0.6256 Disobedient 0.998 0.808 0.848 0.6207 Worried 0.997 0.808 0.850 0.6158 Fearful 0.998 0.809 0.851 0.6229 Solitary 0.997 0.807 0.852 0.61910 Unhappy 0.999 0.809 0.850 0.62011 Aches 0.997 0.757 0.814 0.620
Note. Itm. is item number. Title is a short label for the item. The response rate is lower atthe age 16 sweep because of a teacher-led industrial strike distrupting the dissemination of thequestionnaire.
Table C6: Correlation matrix of internalizing and externalizing skills at different agesINT (age 5) INT (age 10) INT (age 16) EXT (age 5) EXT (age 10) EXT (age 16)
INT (age 5) 1.00INT (age 10) 0.39 1.00INT (age 16) 0.43 0.38 1.00EXT (age 5) 0.65 0.32 0.37 1.00EXT (age 10) 0.29 0.67 0.36 0.47 1.00EXT (age 16) 0.40 0.33 0.84 0.46 0.47 1.00
Note. The table reports the Pearson correlation of the internalizing and externalizing factor scores at different ages.
9