The Performance Scorecard & Demystifying Financial Reports Pro Bowl Debate: Teams 2 vs. 5 Chapters...
19
The Performance The Performance Scorecard & Scorecard & Demystifying Financial Demystifying Financial Reports Reports Pro Bowl Debate: Teams 2 Pro Bowl Debate: Teams 2 vs. 5 vs. 5 Chapters 10 Chapters 10 & 11 & 11
-
Upload
christopher-cross -
Category
Documents
-
view
214 -
download
0
Transcript of The Performance Scorecard & Demystifying Financial Reports Pro Bowl Debate: Teams 2 vs. 5 Chapters...

The Performance Scorecard The Performance Scorecard & &
Demystifying Financial Reports Demystifying Financial Reports
The Performance Scorecard The Performance Scorecard & &
Demystifying Financial Reports Demystifying Financial Reports
Pro Bowl Debate: Teams 2 vs. 5 Pro Bowl Debate: Teams 2 vs. 5 Pro Bowl Debate: Teams 2 vs. 5 Pro Bowl Debate: Teams 2 vs. 5 Chapters 10 & 11Chapters 10 & 11

What is The Performance Scorecard?What is The Performance Scorecard?
It helps you collect and organizing key It helps you collect and organizing key Performance dataPerformance data Guides in the evaluation and scoring of Guides in the evaluation and scoring of performance dataperformance data Systematizes & categorizes performance Systematizes & categorizes performance data data for presentations purposes.for presentations purposes.
It is an analysis system & set of tools that enables It is an analysis system & set of tools that enables a comprehensive analysis of publicly traded a comprehensive analysis of publicly traded corporations including their financial statements. corporations including their financial statements.
Copyright protected… Copyright protected… ©
The PSC software is a copyright protected financial and general analysis program designed to accompany the “Management Strategy & Performance” textbook. It is a powerful and versatile tool written as a template in Microsoft Excel. It will provide you with an automatic ratio analysis, informative bar charts, and performance statistics – both financial and non-financial. It will guide you in developing a platform for comparing competing companies of different sizes. Predictive ratios and comparisons will be highlighted.
Each critical cell contains a detailed explanation of the relevance of that item and supplemental information about its significance in performance measurements.
PSC
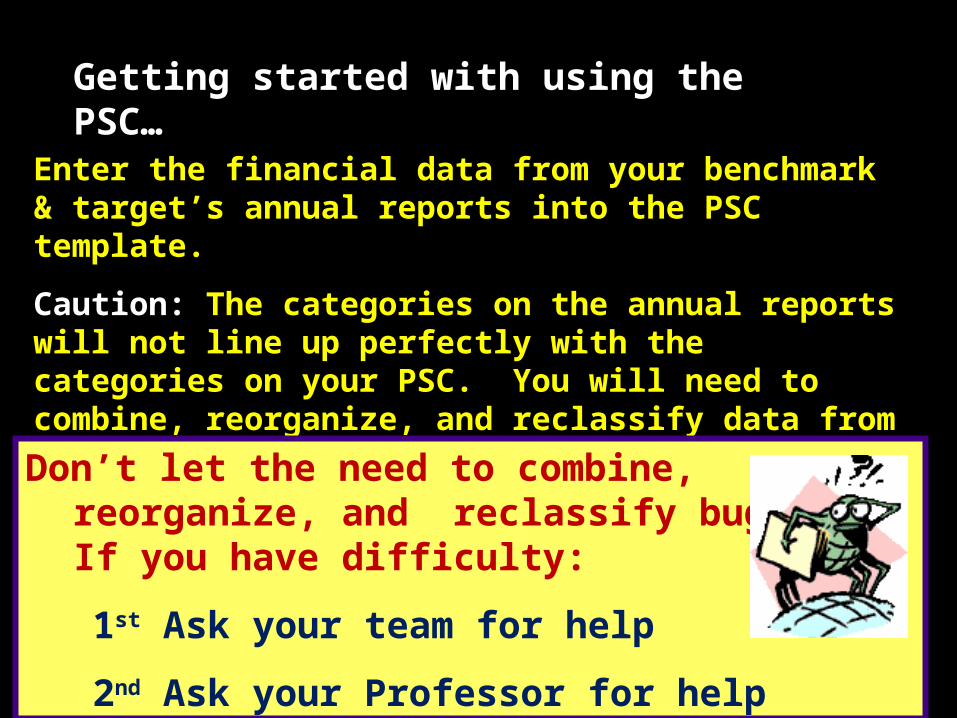
Enter the financial data from your benchmark & target’s Enter the financial data from your benchmark & target’s annual reports into the PSC template.annual reports into the PSC template.
Caution: Caution: The categories on the annual reports will not line up perfectly with the categories on your PSC. You will need to combine, reorganize, and reclassify data from the annual report so that it will fit into the PSC.
Don’t let the need to combine, reorganize, and reclassify bug you. If you have difficulty:
1st Ask your team for help
2nd Ask your Professor for help
Getting started with using the PSC…

As you enter the financial data from the annual reports of your selected companies, the PSC will automatically “common-size” the information.
The result will be several columns of percentages. The percentages will be the basis for comparing the performance of the target to the benchmark.
Remember: Remember: You will be comparing “percentages” NOT ABSOLUTE CURRENCIES (dollars, yen, euro, etc.)
Your “PSC” has a red triangle red triangle in the upper right hand corner of many data cells. If you hold the cursor on any one of the triangles it will provide you with the meaning, essence, and relevance of that particular measurement.
You will also notice that there are certain cells with . These are the only cells that require your input.Yellow shading.

DANGER!! If you skip the following steps – you will suffer!
BALANCE SHEET: FIRSTFIRST – Find the “total assets” on your selected company’s statement and type that number into the total assets cell of your PSC template. Next transfer all the assets from the selected company’s balance sheet to the PSC, followed by liabilities and lastly the equity.
INCOME STATEMENT: FIRSTFIRST – Find the revenue on your selected company’s statement and record this in the PSC.
SECONDSECOND Find the net income on the company’s statement and record it in the PSC. Then you may transfer the remaining items from the company’s income statement to the PSC.
See p. 343 of textbookSee p. 343 of textbook
See p. 343 of textbookSee p. 343 of textbook
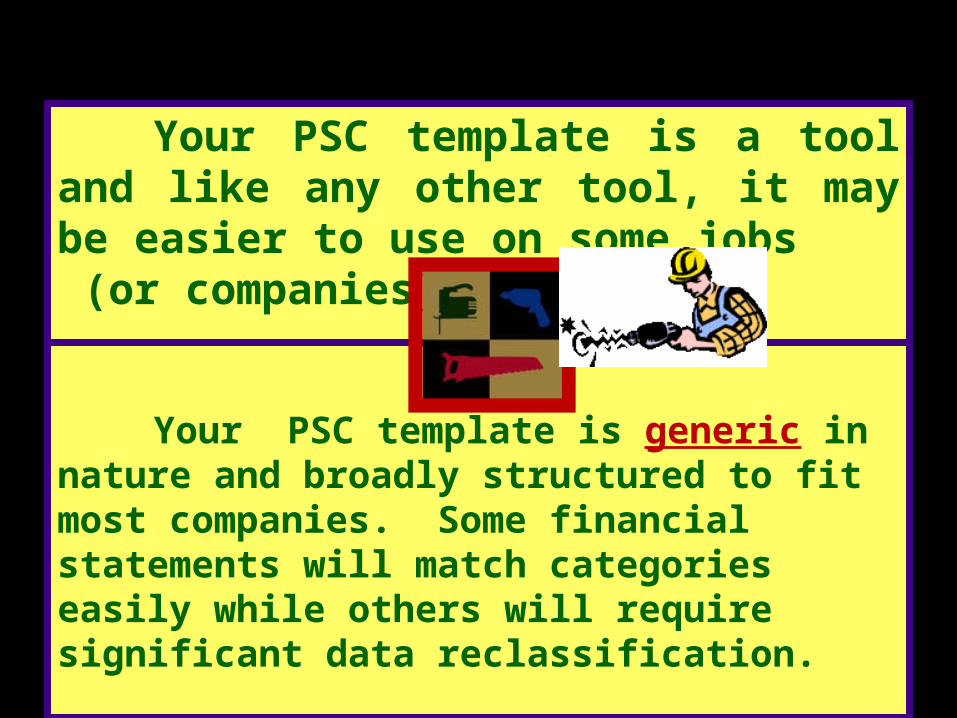
Your PSC template is a tool and like any other tool, it may be easier to use on some jobs (or companies) than others.
.
Your PSC template is generic in nature and broadly structured to fit most companies. Some financial statements will match categories easily while others will require significant data reclassification.

The PSC analysis software is a primary tool for completing your semester project (The Professional SummaryThe Professional Summary).
The PSC will automatically produce statistical analyses and create an array of bar charts that will assist in performance interpretation and help you to “spice up” the appearance of your Professional Summary (PS)Professional Summary (PS).
You can paste the charts into your PSPS to create a more visually interesting and decision informative report.
The Professional Summary (PS)The Professional Summary (PS)

The PSC is divided into five (5) distinct industries, each with a different analysis template. It is important that you select the template that most closely matches the industry in which your target company competes.
Remember, regardless of the template you select, you WILL have to reorganize some of the data from your target company’s annual report so that it fits into the PSC.
The five divisions are: (1) “GP1” merchandisers, manufacturers, & restaurants (2) “GP2” conglomerates (3) “S” service type organizations (4) “B” banking corporations (5) “I” financial services
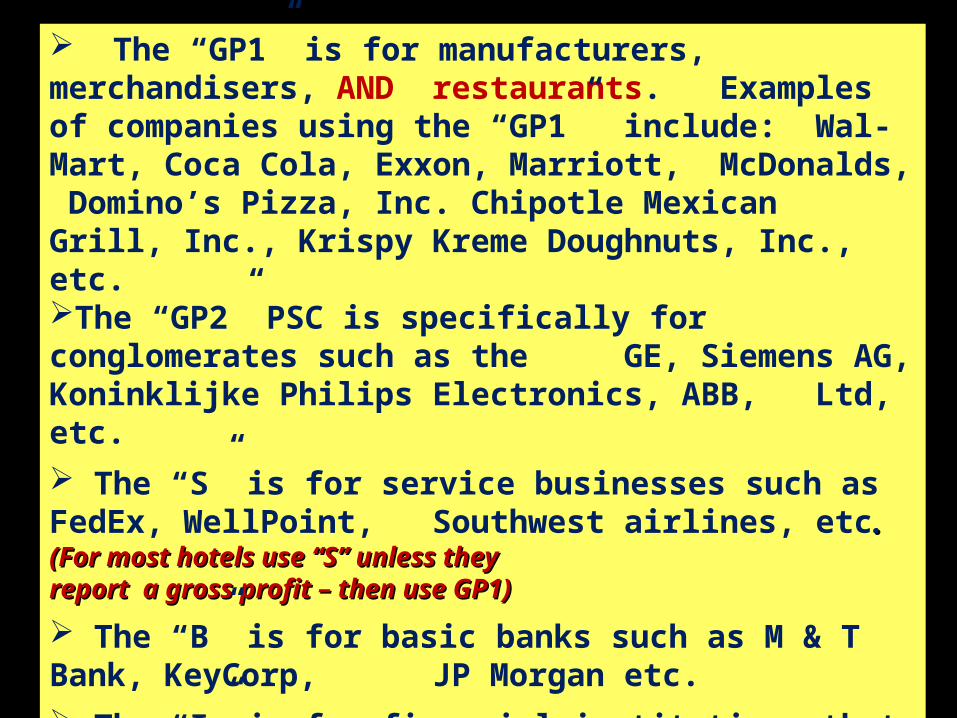
The “GP1” is for manufacturers, merchandisers, AND restaurants. Examples of companies using the “GP1” include: Wal-Mart, Coca Cola, Exxon, Marriott, McDonalds, Domino’s Pizza, Inc. Chipotle Mexican Grill, Inc., Krispy Kreme Doughnuts, Inc., etc.
The “GP2” PSC is specifically for conglomerates such as the GE, Siemens AG, Koninklijke Philips Electronics, ABB, Ltd, etc.
The “S” is for service businesses such as FedEx, WellPoint, Southwest airlines, etc. . (For most hotels use “S” unless they (For most hotels use “S” unless they
report a gross profit – then use GP1)report a gross profit – then use GP1)
The “B” is for basic banks such as M & T Bank, KeyCorp, JP Morgan etc.
The “I” is for financial institutions that are involved in more than just basic banking such as Morgan Stanley,
Goldman Sachs, Deutsche Bank AG, etc.
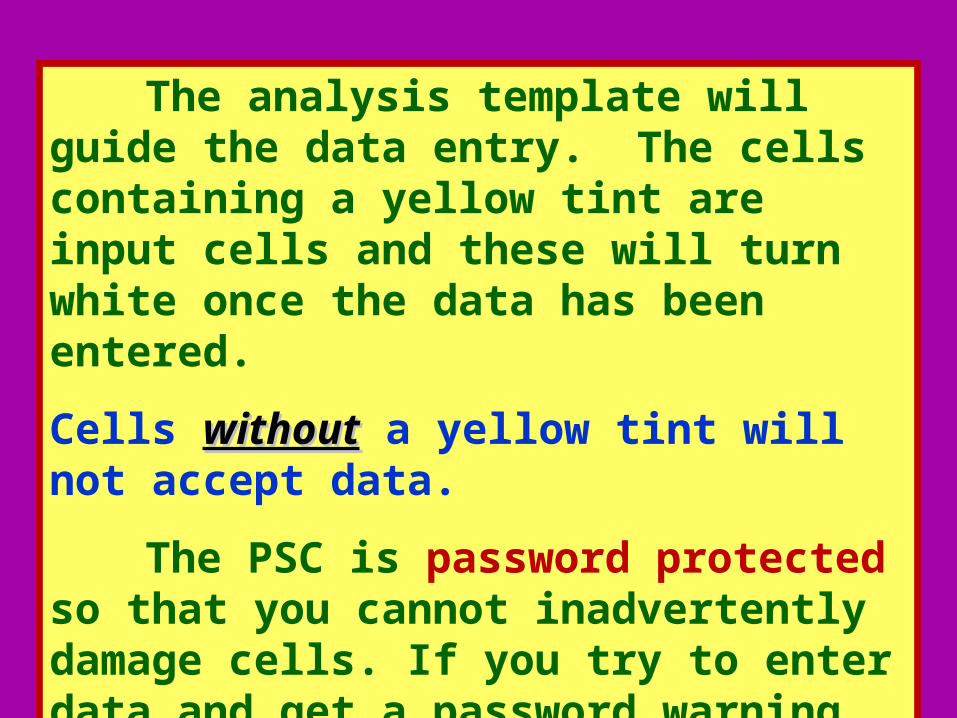
The analysis template will guide the data entry. The cells containing a yellow tint are input cells and these will turn white once the data has been entered.
Cells withoutwithout a yellow tint will not accept data.
The PSC is password protected so that you cannot inadvertently damage cells. If you try to enter data and get a password warning, simply move to the next cell.
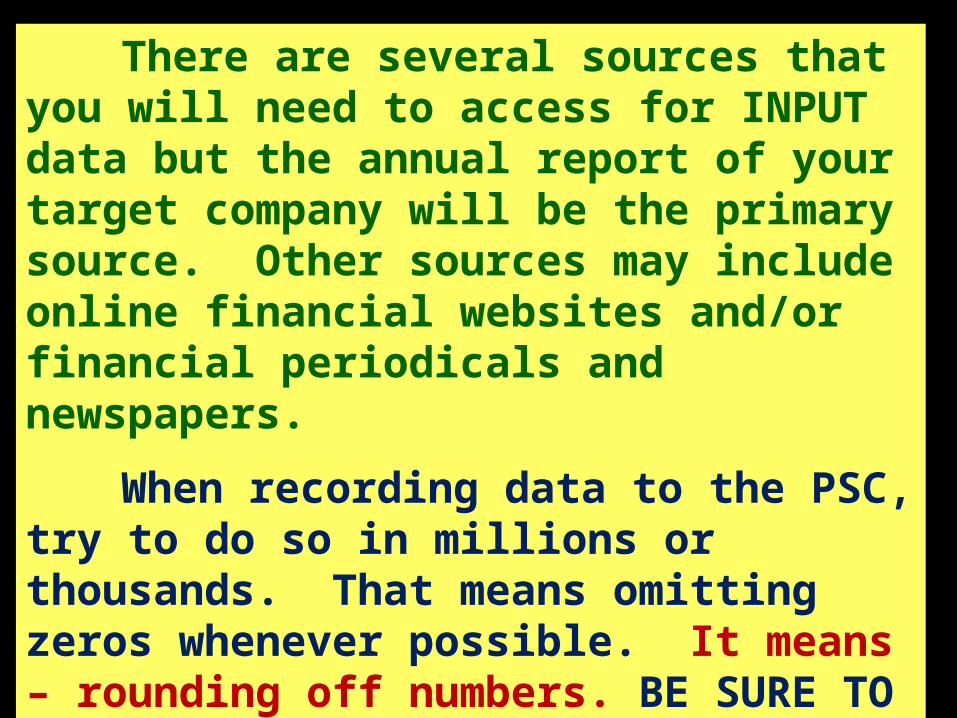
There are several sources that you will need to access for INPUT data but the annual report of your target company will be the primary source. Other sources may include online financial websites and/or financial periodicals and newspapers.
When recording data to the PSC, try to do so in millions or thousands. That means omitting zeros whenever possible. It means – rounding off numbers. BE SURE TO BE CONSISTENT IN YOUR ROUNDING!
Never record cents (pennies) to the PSC!Never record cents (pennies) to the PSC!

Additional required information:Additional required information:
1) Basic EPS (Earnings Per Share)
2) Diluted EPS
3) Share Price (Market value of each share as of the date of the annual report)
4) Dividends per common share
5) Beta

You may not use a company that has a deficit.
Professional Summaries with deficit target companies will be
graded as “zero.”

After you have recorded the raw data in the PSC, charts and graphs will be automatically generated. These should be analyzed.
In order to enhance your understanding of the results, it is strongly advised that you carefully study Chapter 12: “Measurements & Measurements & MeaningsMeanings” because it will provide you with a deeper insight to the components, meaning, and essence of the individual ratios.

Once you have completed all sections of the Performance Scorecard, print ALL segments (EVERY TAB) of your PSC and begin writing your Professional Summary.
Remember: Every tab from your PSC must be printed and included as an appendix to your Professional Summary.
You must also include a copy of the (1) Balance Sheet, (2) Income Statement, and (3) Statement of Cash Flows from your target company. Yes, that means you are Yes, that means you are including a copy directly from your target company!including a copy directly from your target company!
If you do not include the items listed above, your your grade will be significantly reduced.grade will be significantly reduced.


Read Chapters 12 “Measurements & Meanings”And Chapter 13 “Scoring Performance”