The Past and Future of Climate June 2007 David Archibald Lavoisier Conference, Melbourne.
33
The Past and Future of Climate June 2007 David Archibald Lavoisier Conference, Melbourne
-
Upload
ethan-dennis -
Category
Documents
-
view
252 -
download
1
Transcript of The Past and Future of Climate June 2007 David Archibald Lavoisier Conference, Melbourne.
The Past and Future of Climate
June 2007David Archibald
Lavoisier Conference, Melbourne
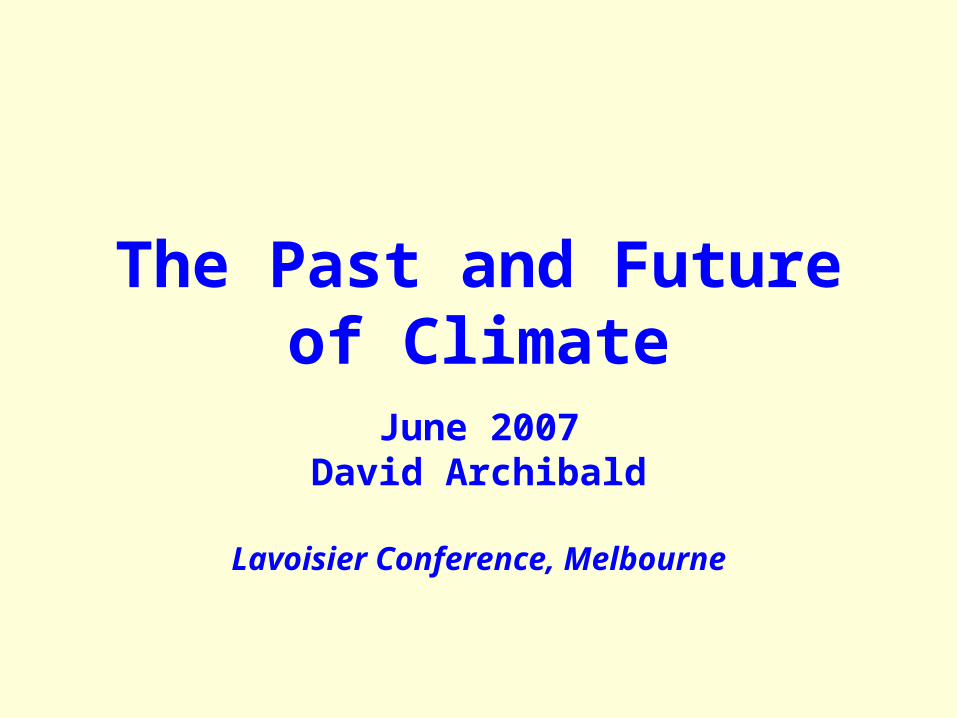
The 28 years of High Quality Satellite Data
The Southern Hemisphere is the same temperature it was 28 years ago, the Northern Hemisphere has warmed slightly.
Southern Hemisphere
Northern Hemisphere
Global

A Rural US Data Set
The smoothed average annual temperature of the Hawkinsville (32.3N, 83.5W), Glennville (31.3N, 89.1W), Calhoun Research Station (32.5N, 92.3W), Highlands (35.0N, 82.3W) and Talbotton (32.7N, 84.5W) stations is representative of the US temperature profile away from the urban heat island effect over the last 100 years (Data source: NASA GISS)
14.0
14.5
15.0
15.5
16.0
16.5
17.0
17.5
1893 1903 1913 1923 1933 1943 1953 1963 1973 1983 1993 2003
An
nu
al A
vera
ge
Tem
per
atu
re
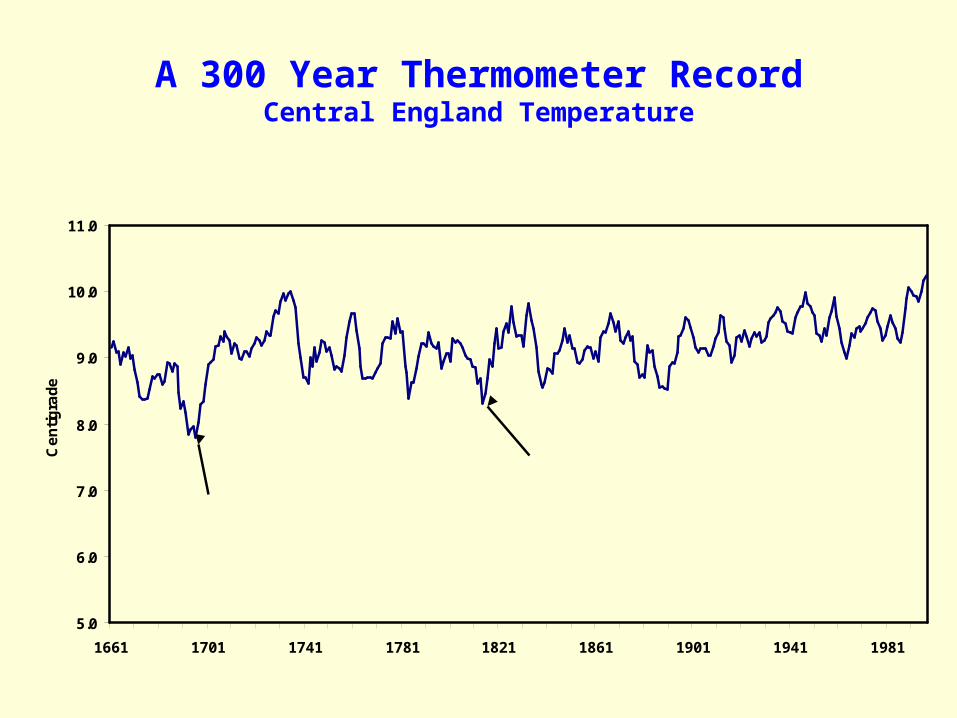
A 300 Year Thermometer RecordCentral England Temperature
5.0
6.0
7.0
8.0
9.0
10.0
11.0
1661 1701 1741 1781 1821 1861 1901 1941 1981
Ce
nti
gra
de
Maunder Minimum
Dalton Minimum

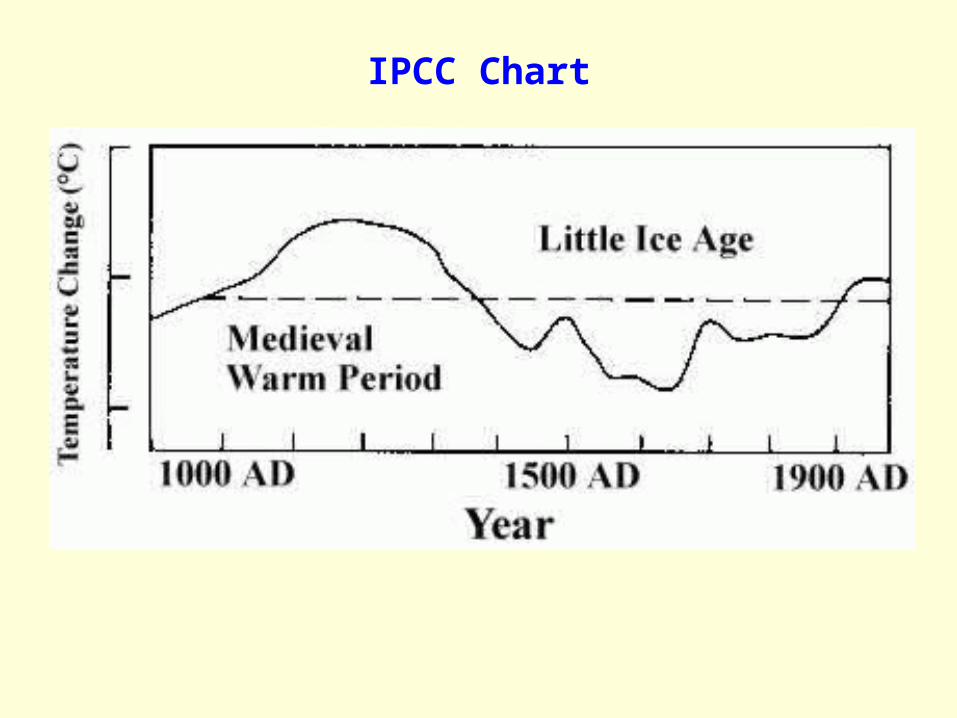
Medieval Warm Period – Little Ice Age
-3.0
-2.0
-1.0
0.0
1.0
2.0
3.0
Tem
per
atu
re C
han
ge
Dark Ages
Medieval Warm Period Little Ice Age
ModernWarmPeriod
900 1350 1900
IPCC Chart
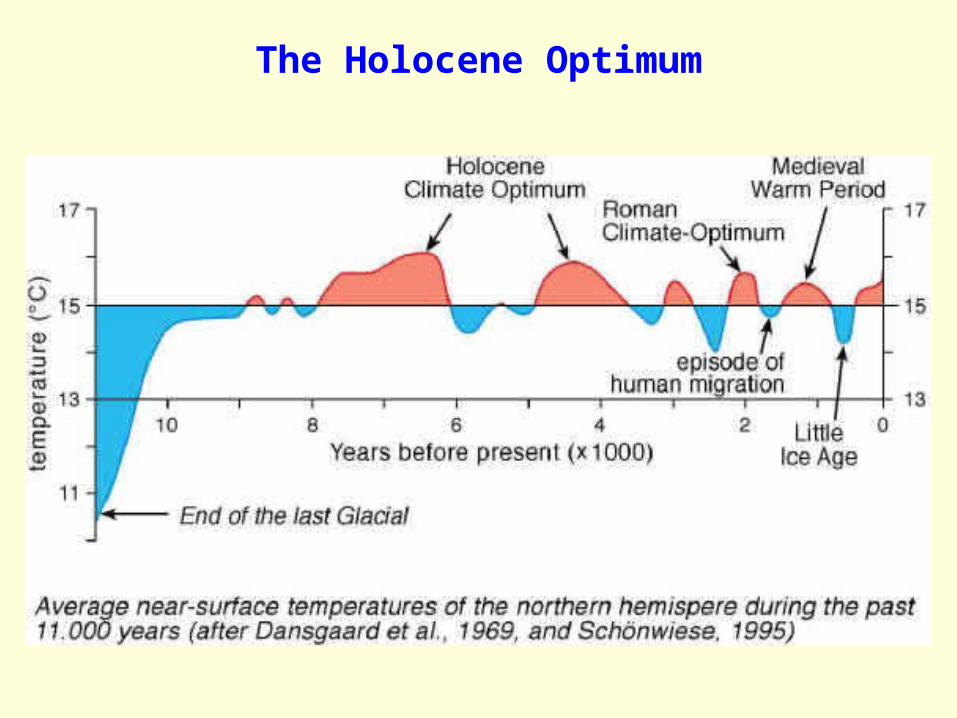
The Holocene Optimum

The Ice Ages
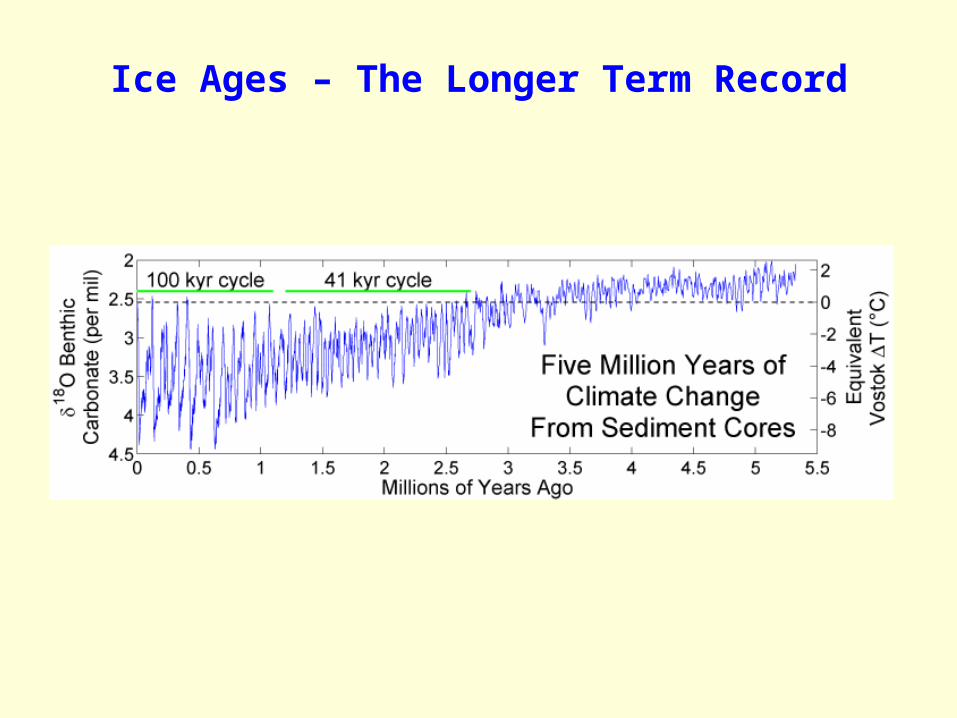
Ice Ages – The Longer Term Record
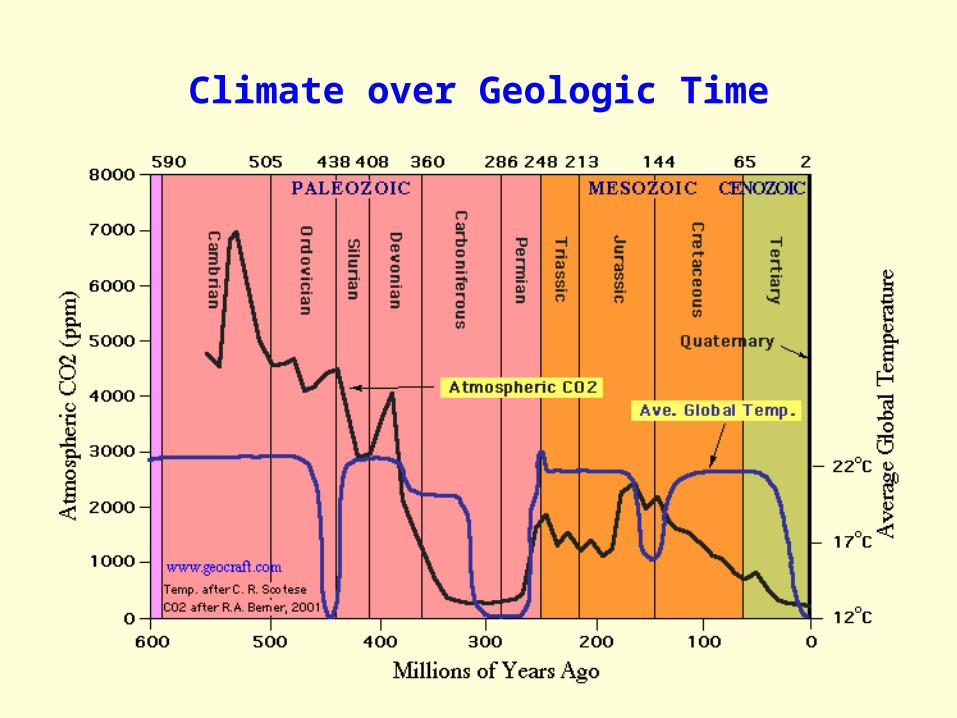
Climate over Geologic Time

The Solar Driver
0
20
40
60
80
100
120
140
160
180
200
1700 1720 1740 1760 1780 1800 1820 1840 1860 1880 1900 1920 1940 1960 1980 2000 2020
So
lar
Cyc
le A
mp
litu
de
(Wo
lf N
um
ber
)
DaltonMinimum
Projected
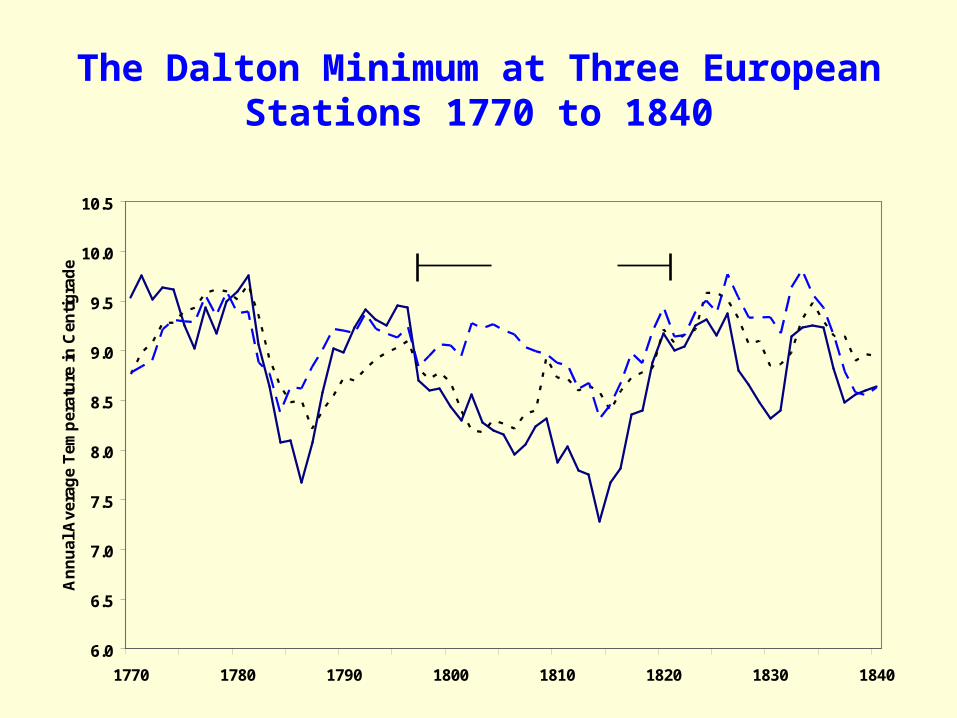
The Dalton Minimum at Three European Stations 1770 to 1840
6.0
6.5
7.0
7.5
8.0
8.5
9.0
9.5
10.0
10.5
1770 1780 1790 1800 1810 1820 1830 1840
An
nu
al A
vera
ge
Tem
per
atu
re in
Cen
tig
rad
e
Oberlach
De Bilt
Central England
Dalton Minimum
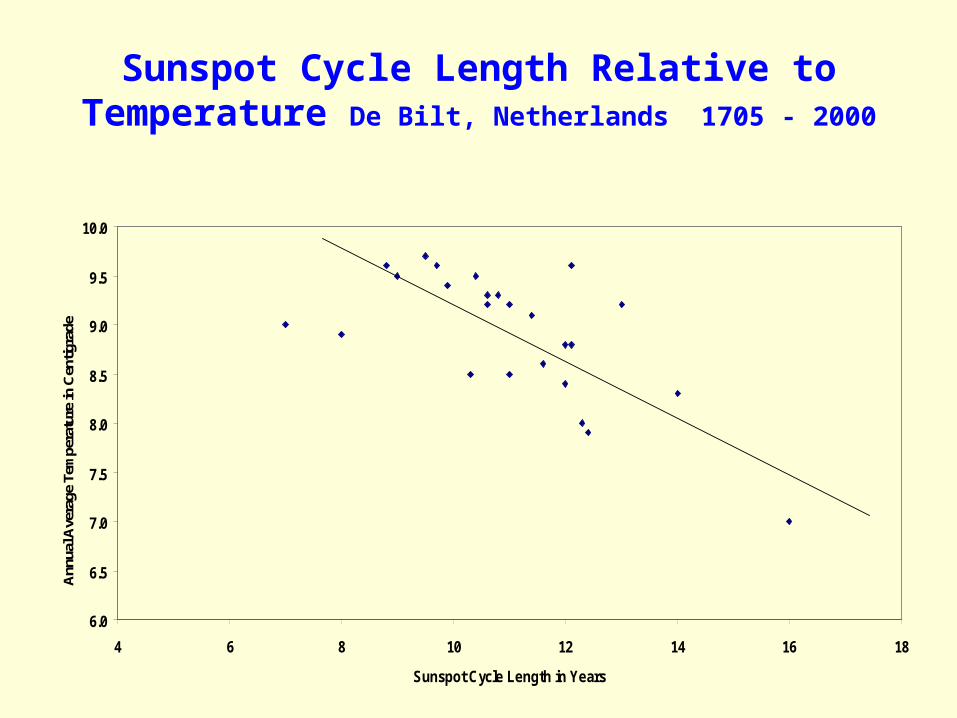
Sunspot Cycle Length Relative to Temperature De Bilt, Netherlands 1705 - 2000
6.0
6.5
7.0
7.5
8.0
8.5
9.0
9.5
10.0
4 6 8 10 12 14 16 18
Sunspot Cycle Length in Years
Ann
ual A
vera
ge T
empe
ratu
re in
Cen
tigra
de
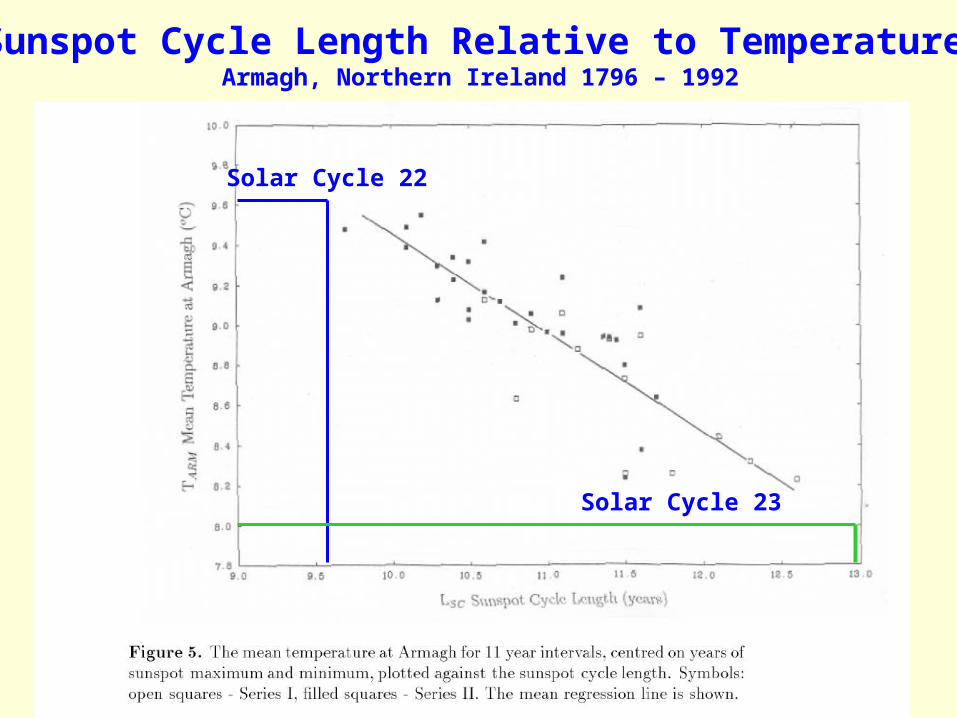
Sunspot Cycle Length Relative to Temperature Armagh, Northern Ireland 1796 – 1992
Solar Cycle 22
Solar Cycle 23
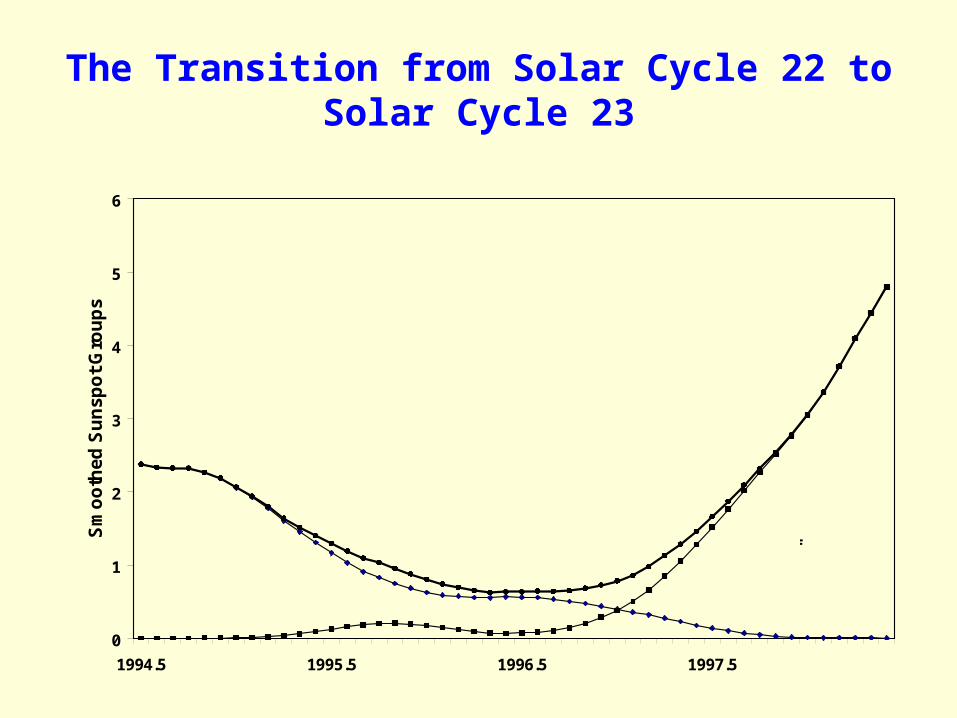
The Transition from Solar Cycle 22 to Solar Cycle 23
0
1
2
3
4
5
6
1994.5 1995.5 1996.5 1997.5
Sm
oo
thed
Su
nsp
ot
Gro
up
s
Solar Cycle 22
Solar Cycle 23
Sunspots of
Solar Cycle 22
Sunspots of
Solar Cycle 23
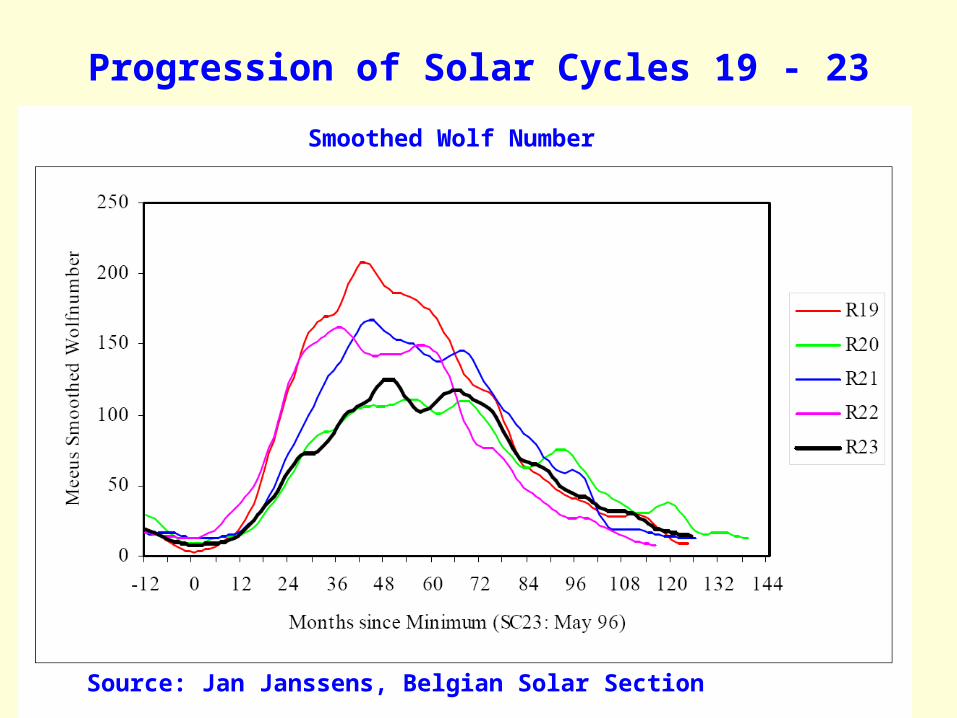
Progression of Solar Cycles 19 - 23
Smoothed Wolf Number
Source: Jan Janssens, Belgian Solar Section
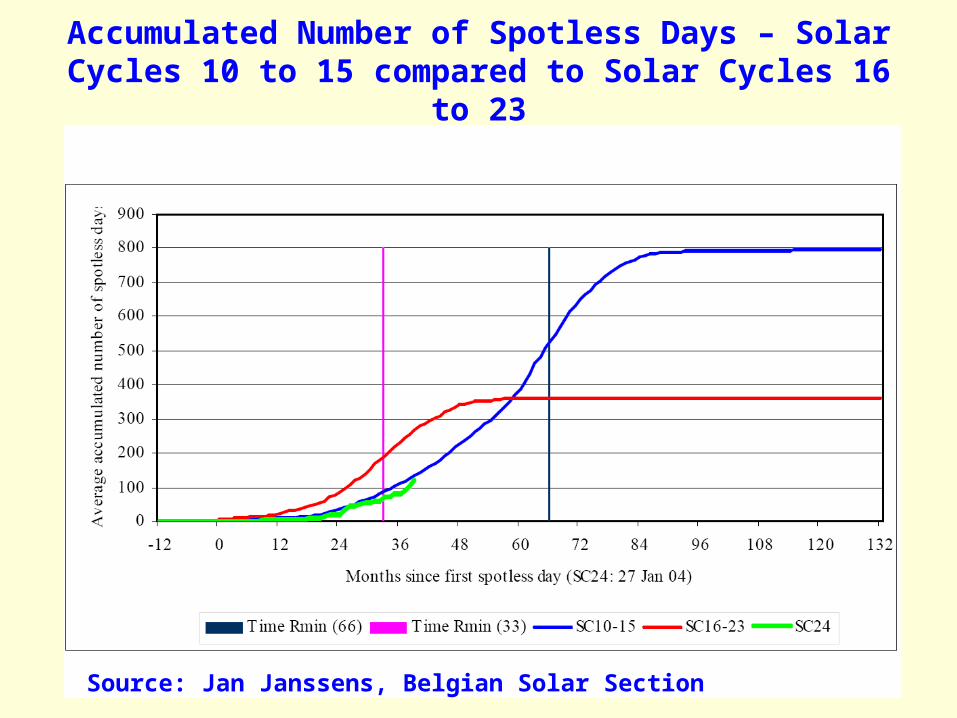
Accumulated Number of Spotless Days – Solar Cycles 10 to 15 compared to Solar Cycles 16 to 23
Source: Jan Janssens, Belgian Solar Section

NASA’s Solar Minimum Prediction
• March, 2008 (±6 months)– Marks the end of Cycle 23 and start of Cycle 24– The length of Cycle 23 will then be 11.75 years
• due to the absence of expected signatures of minimum-like conditions in March, 2007– no high-latitude sunspots yet observed with the Cycle 24 polarity– the large scale corona has not yet relaxed to a simple dipole– the heliospheric current sheet has not yet flattened– activity measures, e.g. cosmic ray flux, radio flux, and sunspot number,
have not yet reached typical solar minimum values
Released on 25th April, 2007
NASA really don’t know, but as they are supposed to know, they have to say something.
Source: http://www.sec.noaa.gov/SolarCycle/SC24/Biesecker.ppt
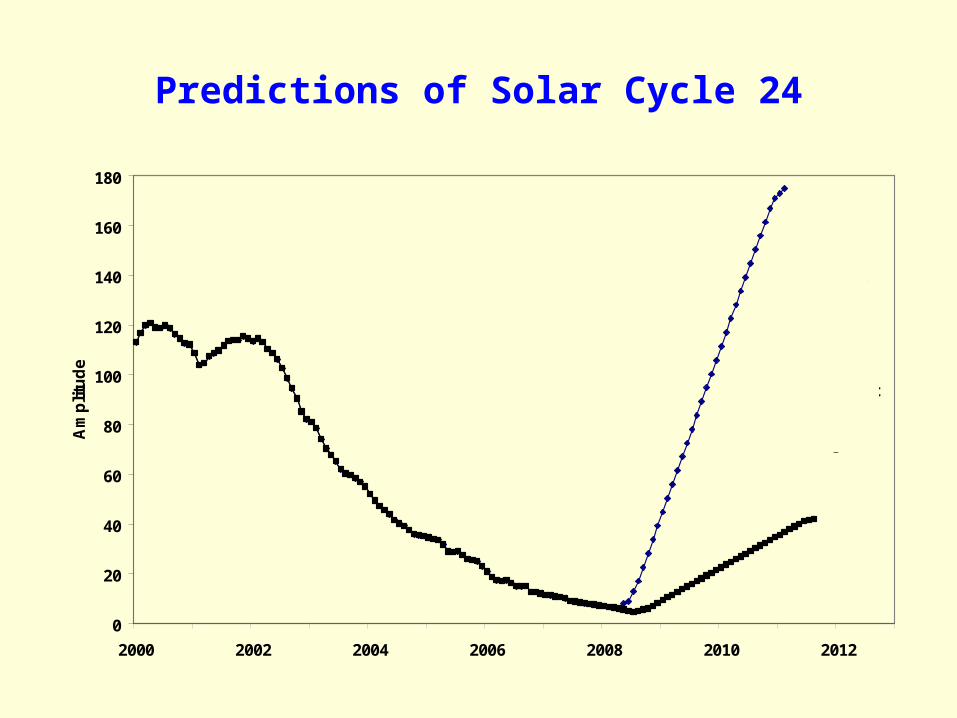
Predictions of Solar Cycle 24
0
20
40
60
80
100
120
140
160
180
2000 2002 2004 2006 2008 2010 2012
Am
plit
ud
e
Schatten
Dikpati
Clilverd
Hathaway
Svalgaard
Badalyan
Lundstedt

The Solar Dynamo Index
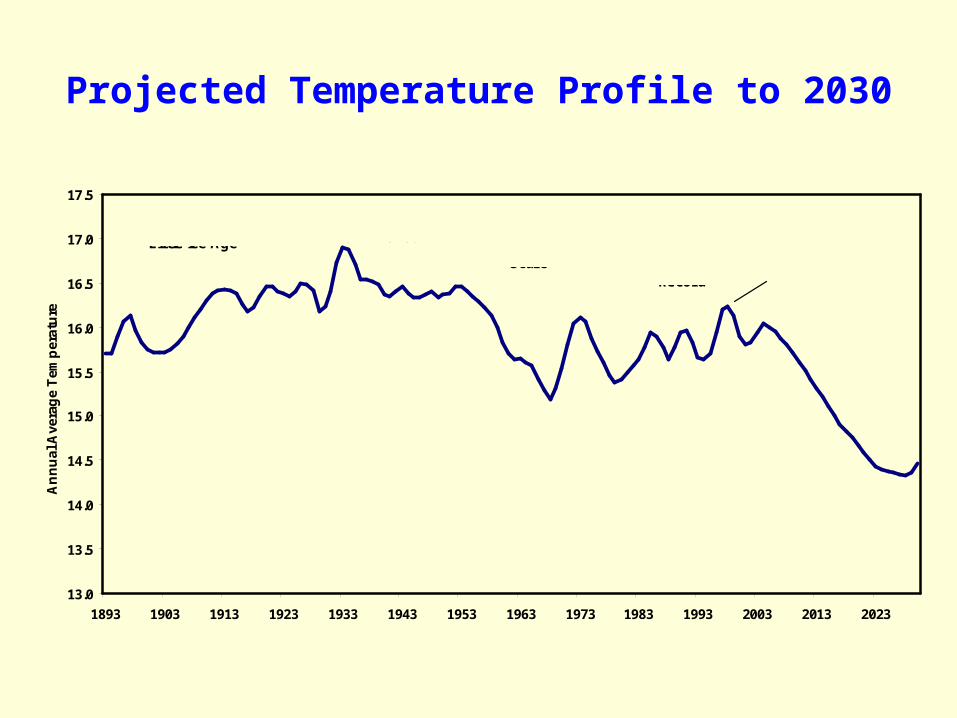
Projected Temperature Profile to 2030
13.0
13.5
14.0
14.5
15.0
15.5
16.0
16.5
17.0
17.5
1893 1903 1913 1923 1933 1943 1953 1963 1973 1983 1993 2003 2013 2023
An
nu
al A
vera
ge
Tem
per
atu
re
Recovery fromLittle Ice Age
1930s to 1950s Warm Period 1970s Cooling
ScareSatellite
Temperature Record
Next Minimum
1998 El Nino Peak

Another Dalton Minimum, or Worse?
“The surprising result of these long-range predictions is a rapid decline in solar activity, starting with cycle #24. If this trend continues, we may see the Sun heading towards a “Maunder” type of solar activity minimum - an extensive period of reduced levels of solar activity.”
K.H.Schatten and W.K.Tobiska, 34th Solar Physics Division Meeting,
June 2003, American Astronomical Society

aa Index
0
5
10
15
20
25
30
35
40
1868 1878 1888 1898 1908 1918 1928 1938 1948 1958 1968 1978 1988 1998
aa I
nd
ex
Little Ice Age
20th Century Warming Period
1970s CoolingScare

Galactic Cosmic Rays
2900
3100
3300
3500
3700
3900
4100
4300
4500
1953 1958 1963 1968 1973 1978 1983 1988 1993 1998 2003
Co
un
t at
Cli
max
, C
olo
rad
o
Solar Cycle19 Maximum
Solar Cycle20 Maximum Solar Cycle
21 MaximumSolar Cycle22 Maximum
Solar Cycle23 Maximum
1970s Cooling Scare
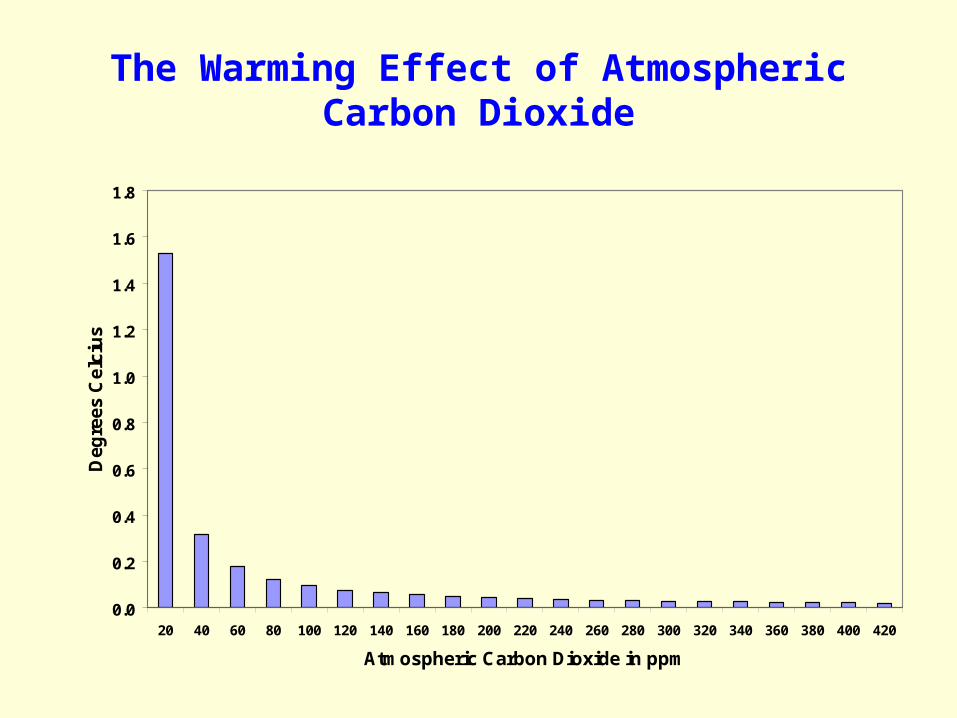
The Warming Effect of Atmospheric Carbon Dioxide
0.0
0.2
0.4
0.6
0.8
1.0
1.2
1.4
1.6
1.8
20 40 60 80 100 120 140 160 180 200 220 240 260 280 300 320 340 360 380 400 420
Atmospheric Carbon Dioxide in ppm
Deg
rees
Cel
ciu
s
0.0
0.5
1.0
1.5
2.0
2.5
3.0
3.5
Deg
rees
Cen
tig
rad
e
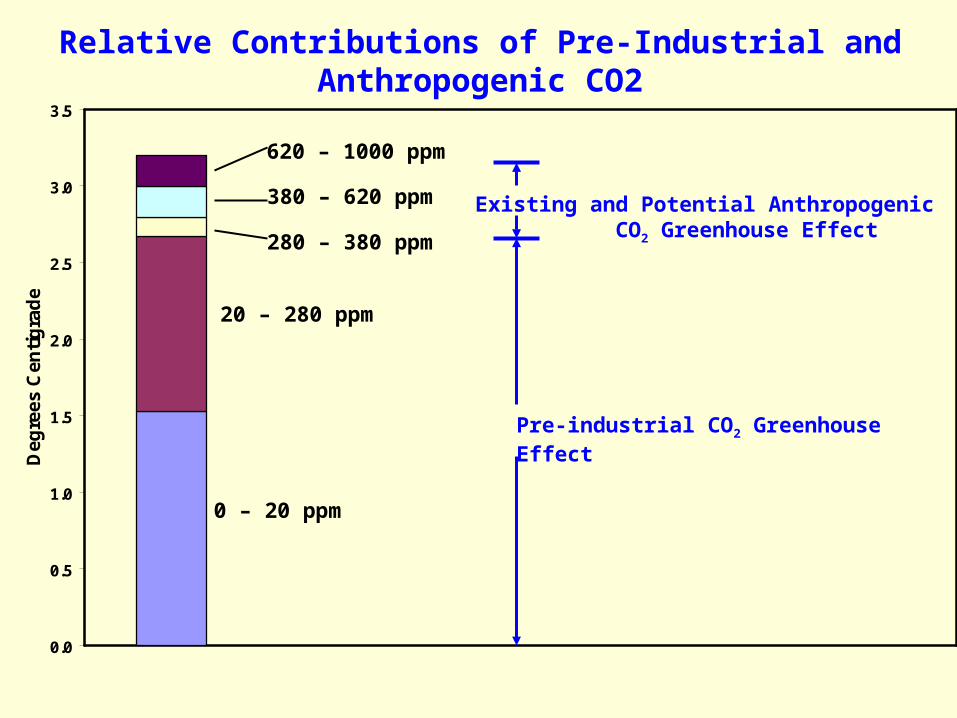
0 – 20 ppm
20 – 280 ppm
280 – 380 ppm
380 – 620 ppm
620 – 1000 ppm
Pre-industrial CO2 Greenhouse Effect
Existing and Potential Anthropogenic CO2 Greenhouse Effect
Relative Contributions of Pre-Industrial and Anthropogenic CO2
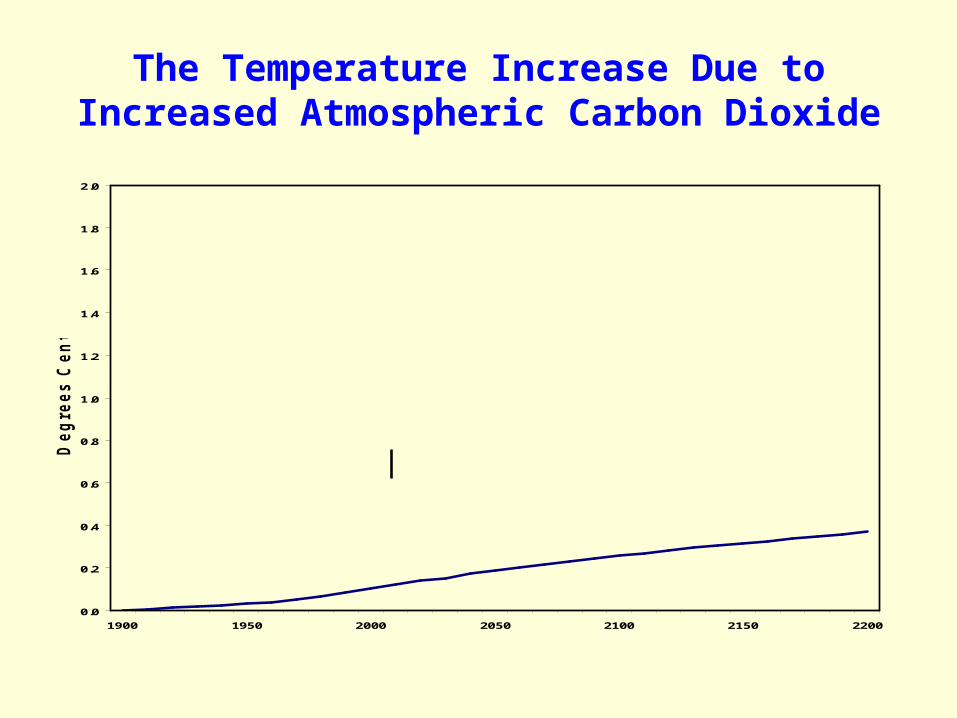
The Temperature Increase Due to Increased Atmospheric Carbon Dioxide
0.0
0.2
0.4
0.6
0.8
1.0
1.2
1.4
1.6
1.8
2.0
1900 1950 2000 2050 2100 2150 2200
Deg
rees C
en
tig
rad
e
Historic Projected
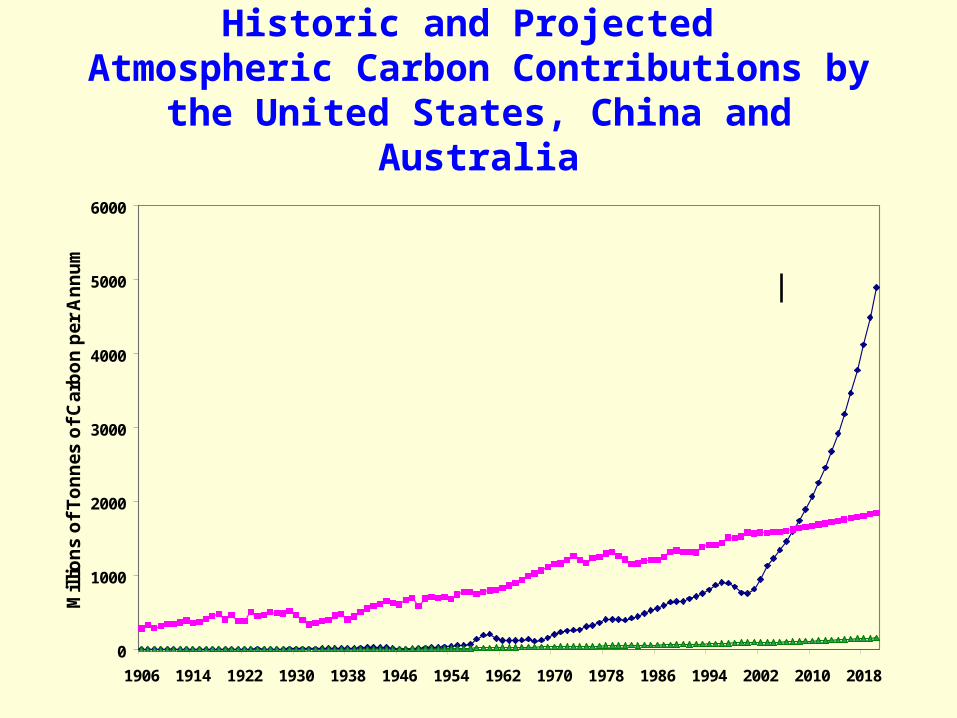
Historic and Projected Atmospheric Carbon Contributions by the
United States, China and Australia
0
1000
2000
3000
4000
5000
6000
1906 1914 1922 1930 1938 1946 1954 1962 1970 1978 1986 1994 2002 2010 2018
Mil
lio
ns
of
To
nn
es o
f C
arb
on
per
An
nu
m
United States
China
Australia
Historic Projected
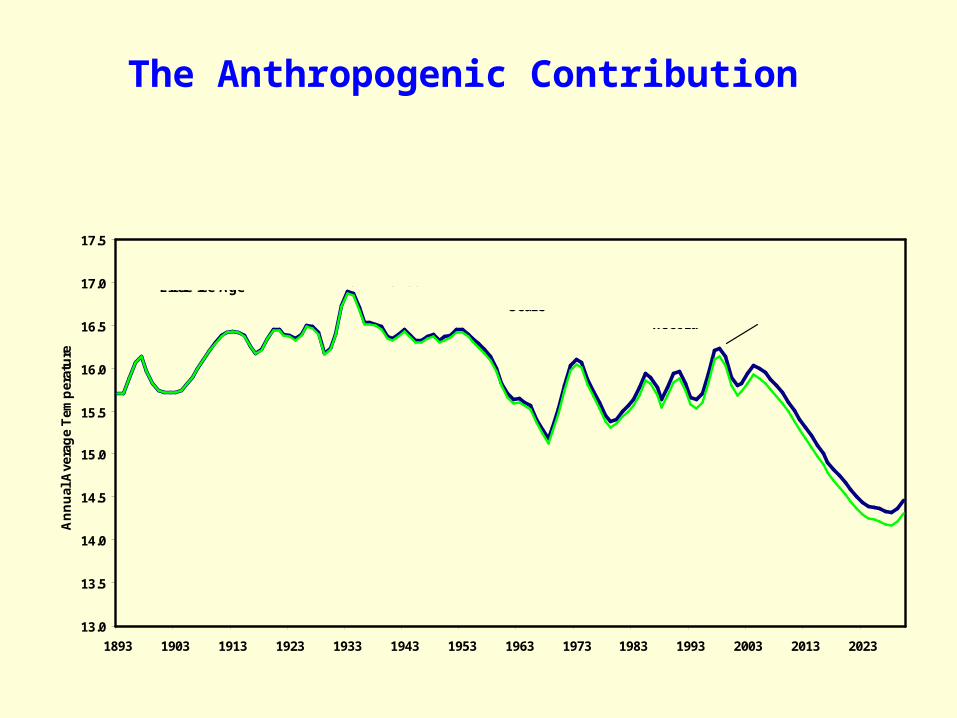
The Anthropogenic Contribution
13.0
13.5
14.0
14.5
15.0
15.5
16.0
16.5
17.0
17.5
1893 1903 1913 1923 1933 1943 1953 1963 1973 1983 1993 2003 2013 2023
An
nu
al A
vera
ge
Tem
per
atu
re
Recovery fromLittle Ice Age
1930s to 1950s Warm Period 1970s Cooling
ScareSatellite
Temperature Record
Next Minimum
1998 El Nino Peak

Can Carbon Dioxide be even a little bit bad?
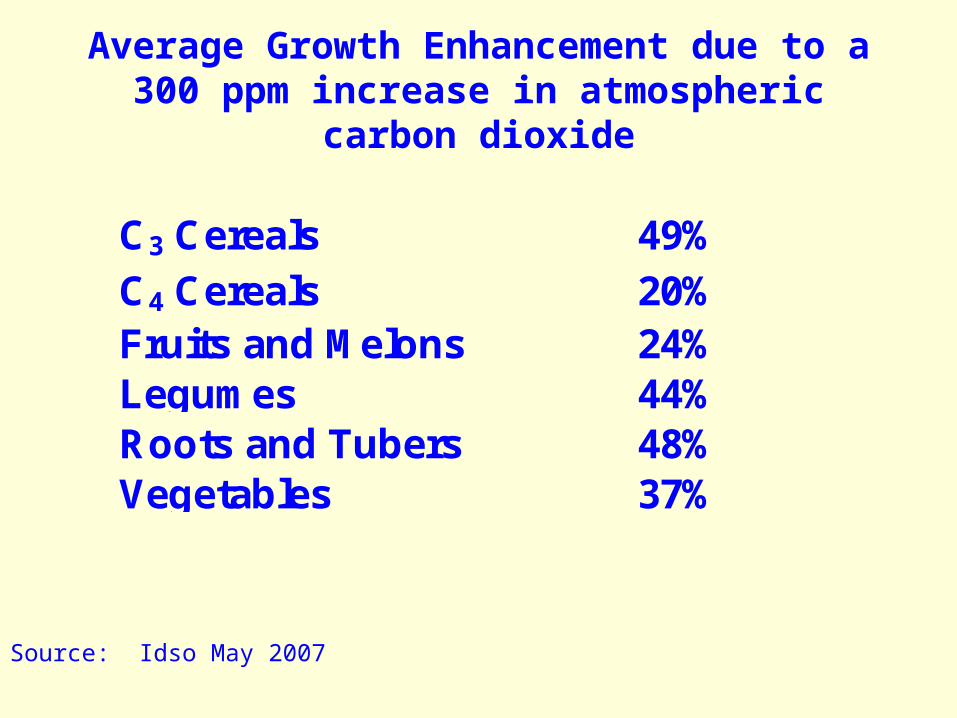
Average Growth Enhancement due to a 300 ppm increase in atmospheric carbon dioxide
C3 Cereals 49%C4 Cereals 20%Fruits and Melons 24%Legumes 44%Roots and Tubers 48%Vegetables 37%
Source: Idso May 2007
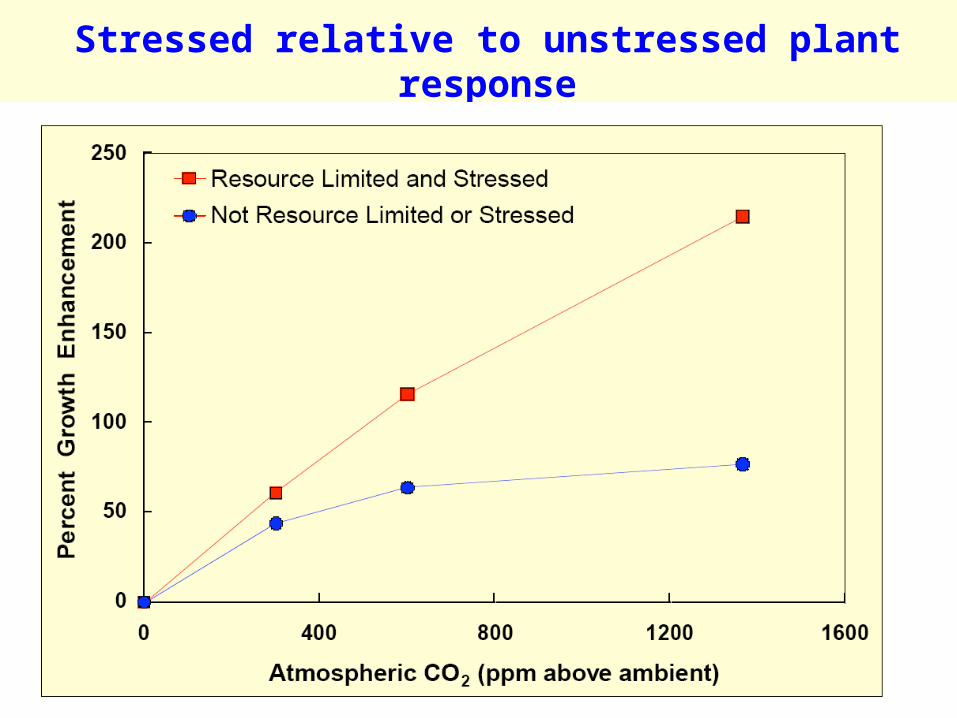
Stressed relative to unstressed plant response

Summary
1. The Sun drives climate change and it will be colder next decade by 2.0 degrees centigrade.
2. The anthropogenic carbon dioxide effect is real, minuscule and too small to be measured.
3. Higher atmospheric carbon dioxide levels will boost agricultural production.
4. Increased atmospheric carbon dioxide is wholly beneficial.