"The Optimism Bias of Official Fiscal Forecasts in the Eurozone" Banca d’Italia, Rome, 20 June,...
54
"The Optimism Bias of Official Fiscal Forecasts in the Eurozone" Banca d’Italia, Rome, 20 June, 2013 Jeffrey Frankel Harpel Professor, Harvard University Joint research with Jesse Schreger, supported by the Smith Richardson Foundation
-
Upload
cecil-chandler -
Category
Documents
-
view
214 -
download
0
Transcript of "The Optimism Bias of Official Fiscal Forecasts in the Eurozone" Banca d’Italia, Rome, 20 June,...

"The Optimism Bias of Official Fiscal Forecasts
in the Eurozone"
Banca d’Italia, Rome, 20 June, 2013
Jeffrey FrankelHarpel Professor, Harvard University
Joint research with Jesse Schreger, supported by the Smith Richardson Foundation

Overview of research questions
to be summarized today1) Is bias in official forecasts a source of pro-cyclical fiscal policy?
“Over-optimism in Forecasts by Official Budget Agencies and Its Implications," Oxford Review of Economic Policy 27, no.4, 2011.
2) How do countries subject to the euro’s Stability & Growth Pact differ from others, with respect to government forecast bias?
“Over-optimistic Official Forecasts & Fiscal Rules in the Eurozone," with Jesse Schreger, Review of World Economy (Weltwirtschaftliches Archiv) 149, no.2, 2013.
3) Can private-sector forecasts improve on official forecasts?“Bias in Official Fiscal Forecasts: Can Private Forecasts Help?” with Jesse Schreger, Harvard Kennedy School, 18 June, 2013.
22

33
Background: How can countries avoid pro-cyclical fiscal policy?
“Good institutions.”

44
”On Graduation from Fiscal Procyclicality,” Frankel, Végh & Vuletin; J.Dev.Economics, 2013.
Who achieves counter-cyclical fiscal policy?Countries with “good
institutions”

The quality of institutions varies, not just across countries, but also across
time.
55
1984-2009
Frankel, Végh & Vuletin,2013.
Good institutions;Countercyclical spending
Worsened institutions;More cyclical spending.
Improved institutions;Less cyclical spending.

66
”On Graduation from Fiscal Procyclicality,” Frankel, Végh &
Vuletin; J. Dev. Econ., 2013.
The countries that have graduated to counter-cyclical fiscal policy since 2000 are statistically those where institutional quality has improved.

77
How can countries avoid pro-cyclical fiscal policy? continued
What are “good institutions,” exactly?
Rules? Budget deficit ceilings (SGP) or debt brakes?
Have been tried many times. Usually fail. Rules for cyclically adjusted budgets?
Countries more likely to be able to stick with them. But…
An under-explored problem: Over-optimism in official forecasts
of growth rates & budgets.

88
Over-optimism in official forecasts
Statistically significant bias among 33 countries Worse in booms. Worse at 3-year horizons than 1-year. Frankel (2011, 2012).
Leads to pro-cyclical fiscal policy: If the boom is forecast to last indefinitely,
there is no apparent need to retrench.
BD rules don’t help. Frankel & Schreger (2013a).
The SGP worsens forecast bias for euro countries.
Solution?

99
Bias to optimism in official budget forecasts
is stronger at 3-year horizon, among countries with budget rules and in booms.
Frankel, 2011.
1010
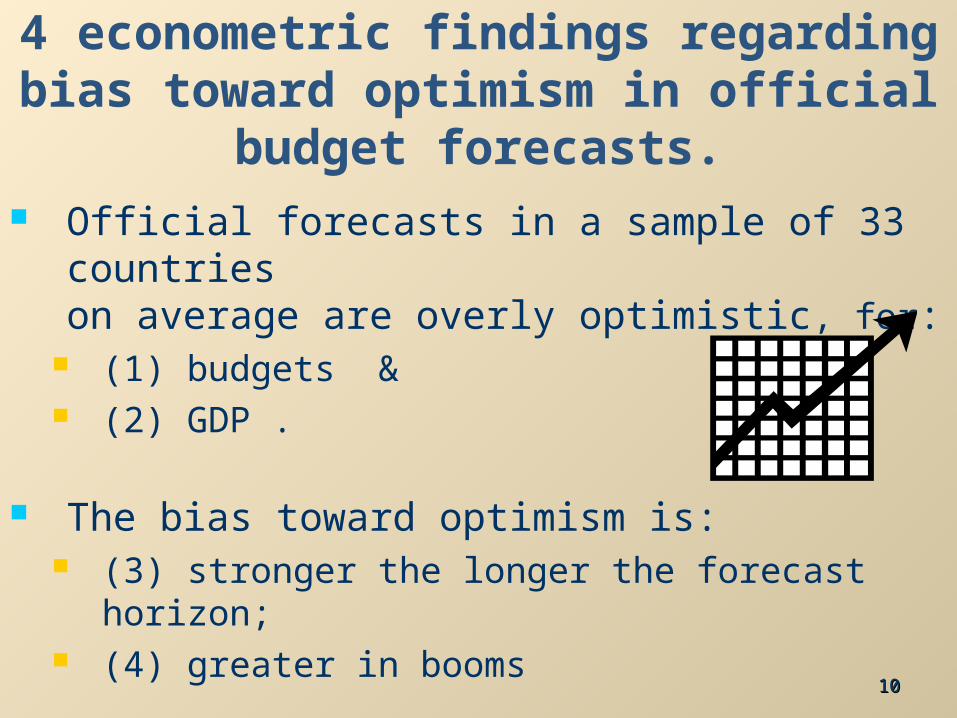
4 econometric findings regarding bias toward optimism in official budget forecasts.
Official forecasts in a sample of 33 countries on average are overly optimistic, for:
(1) budgets & (2) GDP .
The bias toward optimism is: (3) stronger the longer the forecast horizon; (4) greater in booms

1111
Variables1 year ahead
2 years ahead
3 years ahead
GDP gap 0.093*** 0.258*** 0.289***(0.019) (0.040) (0.063)
Constant 0.201 0.649*** 1.364***(0.197) (0.231) (0.348)
Observations 398 300 179
R2 0.033 0.113 0.092
RMSE 2.25 2.73 3.10
Table 2: Frankel (2011)
Budget balance forecast error as % of GDP, full dataset
*** p<0.01, ** p<0.05, * p<0.1. (Robust standard errors in parentheses, clustered by country.
Note: GDP gap is lagged so that it lines up with the year in which the forecast was made, not the year being forecast.

1212
US official projections have been over-optimistic on average
F & Schreger, 2013

1313
Greek official forecasts have always been over-optimistic.
F & Schreger, 2013
Data from Greece’s Stability and Convergence Programs.

1414
German forecasts have also usually been too optimistic
1515
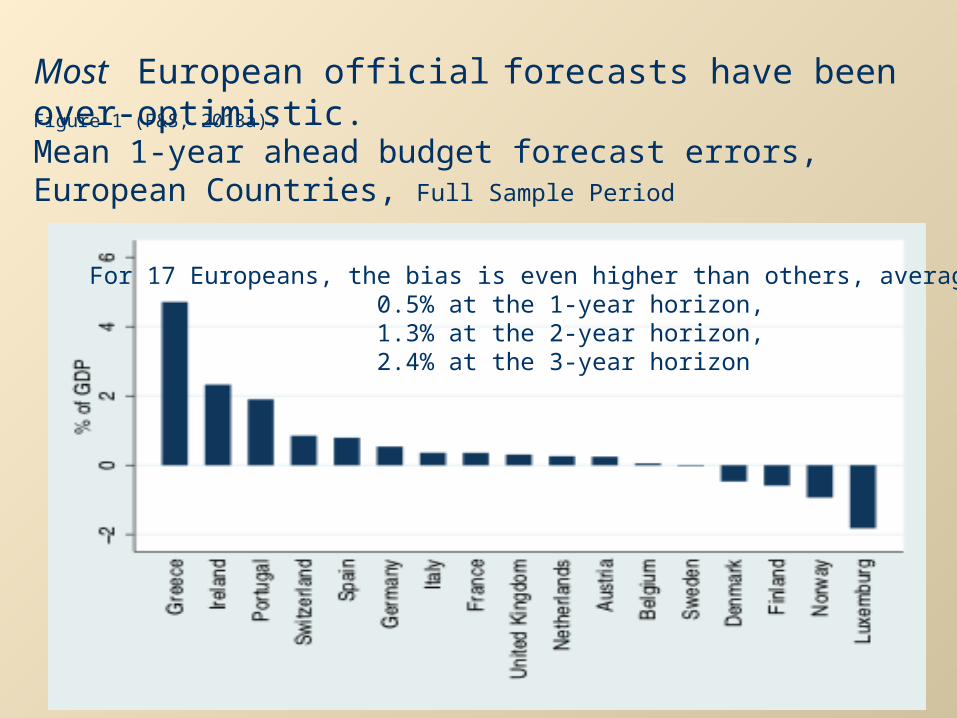
Figure 1 (F&S, 2013a):
Mean 1-year ahead budget forecast errors, European Countries, Full Sample Period
Most European official forecasts have been over-optimistic.
For 17 Europeans, the bias is even higher than others, averaging: 0.5% at the 1-year horizon, 1.3% at the 2-year horizon, 2.4% at the 3-year horizon

1616
Figure 2 (F&S, 2013a):
Mean 2-year ahead budget forecast errors, European Countries, Full Sample Period

1717
Figure 2 (F&S, 2013a):
Mean Budget Forecast Errors, Europe, 1995-2011

1818
Figure 3 (F&S, 2013a):
Mean GDP Growth Forecast Errors, Europe, 1995-2011

1919
Econometric findings regarding biasamong EU countries in particular (Frankel 2011).
Euro countries, subject to the SGP, show even more optimism bias than others
in growth forecasts, significant at 1 and 2-year horizons particularly when GDP is currently high. Forecasts of budget balance among euro countries
also show extra bias when GDP is currently high.

2020
***p<0.01, **p<0.05, *p<0.1. (Robust standard errors in parentheses.) Random effects. SGP ≡ dummy for countries subject to the SGP. GDP gap ≡ GDP as deviation from trend. All variables are lagged so that they line up with the year in which the forecast was made.
Variables1 year ahead
2 years ahead
3 years ahead
1 year ahead
2 years ahead
3 years ahead
SGP dummy
0.379*
0.780**–0.555
0.192 0.221 –1.067*
(0.199) (0.352) (0.529) (0.215) (0.410) (0.549)
SGP*GDPgap
0.148** 0.516***0.522***
(0.068) (0.141) (0.161)
Constant 0.239 0.914*** 2.436***
0.252 0.887*** 2.444***
(0.168) (0.318) (0.643) (0.168) (0.330) (0.642)Observations 369 282 175 368 282 175Countries 33 31 28 33 31 28R2 0.006 0.006 0.007 0.011 0.042 0.040RMSE 2.40 3.44 3.81 2.38 3.36 3.73
Table 5(c): Frankel (2011)
GDP growth rate forecast error, full dataset

2121
Variables1 year ahead
2 years ahead
3 years ahead
1 year ahead
2 years ahead
3 years ahead
SGP dummy 0.368
0.922***
0.625 0.182 0.331 0.066
(0.342) (0.329) (0.415) (0.335) (0.355) (0.449)
SGP * GDPgap 0.161** 0.509*** 0.544***
(0.065) (0.147) (0.148)
Constant 0.245 0.530** 1.235*** 0.219 0.501* 1.240***(0.198) (0.268) (0.408) (0.193) (0.268) (0.404)
Observations 399 300 179 398 300 179
Countries 33 31 29 33 31 29R2 0.018 0.023 0.008 0.029 0.080 0.076RMSE 2.113 2.701 3.130 2.122 2.614 3.011
Table 3(c): Frankel (2011)
Budget balance forecast error, full dataset
***p<0.01, **p<0.05, *p<0.1. (Robust standard errors in parentheses.) Random effects. SGP ≡ dummy for countries subject to the SGP. GDP gap ≡ GDP as deviation from trend. All variables are lagged so that they line up with the year in which the forecast was made.

2222
More findings regarding systematic forecast errors in Europe (Frankel & Schreger, 2013a).
Besides cyclicality (output gap), another determinant of governments’ bias:they over-forecast speed of disappearance of budget deficits.
(1) (2) (3)VARIABLES BBEt+1 BBEt+2 BBEt+3
Surplust*BudgetBalancet -0.080 -0.295** -0.175(0.057) (0.108) (0.171)
Deficit*BudgetBalancet -0.293*** -0.363** -0.558***(0.064) (0.134) (0.180)
Output Gapt 0.651*** 1.409*** 1.812***(0.113) (0.281) (0.452)
Constant -0.150 0.459 0.932**(0.169) (0.274) (0.404)
Observations 243 210 164R-2 0.213 0.344 0.374Countries 17 16 15Year FE No No No
(Robust s.e.is n parentheses, clustered at the country level.) ***, **, &* : significance at the level of 1, 5, and 10%, respectively.

2323
Another econometric finding (F&S, 2013a):
The bias is less among eurozone countries that have adopted certain rules at the national level, particularly creating an independent fiscal institution that provides independent forecasts.
Might the Fiscal Compact offer a solution?
• Expressing targets in cyclically adjusted terms improves the odds the countries can abide by them.
• But it doesn’t help the problem of biased forecasts.
• It might even make it worse.
• What about the rules & institutions imposed nationally?

2424
Figure 6 (F&S, 2013a): Fiscal Rules in the European Union, 1990-2010

Existing national budget
rules in the EU
The extra optimism-bias that comes with euro membership is reduced when euro membership is combined with national budget balance rules
2525
(1) (2)BBEt+1 BBEt+2
Output Gapt 0.220 0.693(0.218) (0.634)
Budget Balancet -0.325*** -0.459***(0.0676) (0.115)
BBR FRIt 1.258 1.285(0.982) (1.320)
Eurot 1.433 1.218(0.879) (1.178)
BBR FRIt*OGt -0.148 -0.706(0.377) (0.767)
BBR FRIt*BBt 0.056 0.142(0.067) (0.160)
Eurot*BBR FRIt -2.514* -2.455(1.183) (1.711)
Constant -0.608 -0.956(0.767) (1.323)
Observations 218 196R-2 0.437 0.535Year FE Yes Yes
BBR FRI = EC’s Fiscal Rule Index, budget balance component.
Euro = dummy for membership
Table 8 (F&S, 2013a)
– but not with FRI overall (debt, revenue, spending).
2626
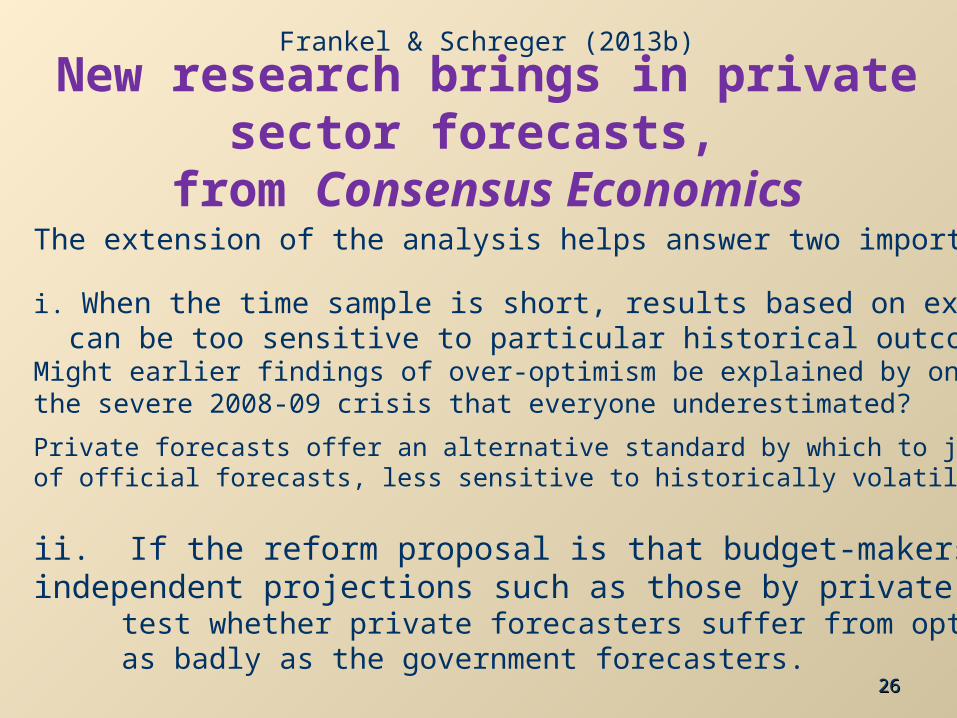
New research brings in private sector forecasts, from Consensus Economics
Frankel & Schreger (2013b)
The extension of the analysis helps answer two important questions. i. When the time sample is short, results based on ex post realizations can be too sensitive to particular historical outcomes: Might earlier findings of over-optimism be explained by one historical event, the severe 2008-09 crisis that everyone underestimated?
Private forecasts offer an alternative standard by which to judge performance of official forecasts, less sensitive to historically volatile ex post outcomes.
ii. If the reform proposal is that budget-makers use independent projections such as those by private forecasters, test whether private forecasters suffer from optimism bias as badly as the government forecasters.

2727
1-Year Ahead
2-Year Ahead
Notes: Forecast year is year being forecast. Frankel & Schreger (June 2013)
Fig.2: Budget Balance Forecasts Fig.3: Real GDP Growth Forecasts
1-year Ahead
2-Year Ahead
Italy is typical: Private forecasts more realistic than official forecasts

2828
We have three main new results, for a sample of 31 countries (sample period up to 2012.)
1. Official forecasters are more over-optimistic than private forecasters on average, at the 2-year horizon for budget balances and at the 1- & 2-year horizon for real GDP forecasts.
2. While euro area governments were very reluctant to forecast violations of the 3% deficit/GDP cap in the SGP; private sector forecasters were not.
3.The difference between official forecast & private forecast is positively correlated with the difference between official forecast and ex post realization.
• These results suggest that incorporating private sector
forecasts into the budget process could help countries stick to fiscal rules, by identifying over-optimism ex ante rather than just ex post.
2929
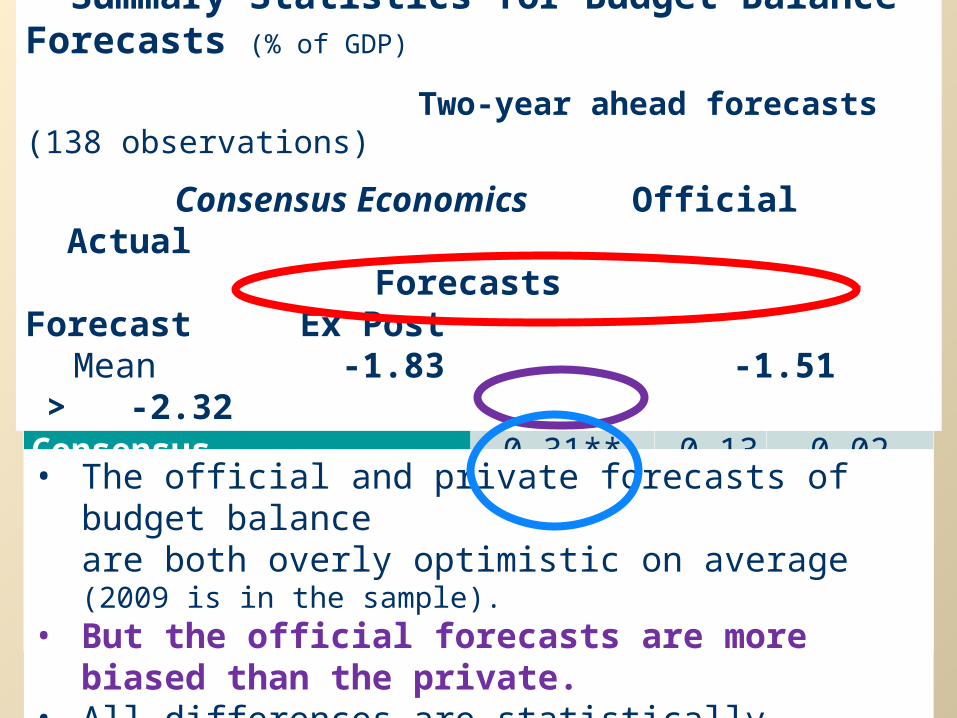
Differences Mean SD P-valueOfficial Minus Consensus 0.31** 0.13 0.02Official Forecast Error 0.81*** 0.22 0.00Consensus Forecast Error 0.49** 0.21 0.02
Table 2A: Frankel & Schreger (June 2013)
Summary Statistics for Budget Balance Forecasts (% of GDP)
Two-year ahead forecasts (138 observations)
Consensus Economics Official Actual Forecasts Forecast Ex Post
Mean -1.83 -1.51 > -2.32
• The official and private forecasts of budget balanceare both overly optimistic on average (2009 is in the sample).
• But the official forecasts are more biased than the private.
• All differences are statistically significant.

3030
Differences Mean SD P-valueOfficial Minus Consensus 0.16*** 0.03 0.00Official Forecast Error 1.15*** 0.21 0.00Consensus Forecast Error 0.99*** 0.21 0.00
Table 2B: Frankel & Schreger (June 2013)
Summary Statistics for GDP Growth Rates
Two-year ahead forecasts (289 observations)
Consensus Economics Official Actual Forecasts Forecast Ex Post
Mean 2.87 3.03 > 1.88
• The official and private forecasts of GDP growthare again both overly optimistic on average.
• But the official forecasts are more biased than the private .
• All differences are statistically significant.

3131
Budget forecasts & realizations in the euro area
In the euro countries, which are subject to SGP rules,
the optimism bias was captured by the practice of never forecasting next year’s budget deficit >
3% of GDP.Private-sector forecasts surveyed by Consensus
Forecasts are free to forecast budget deficits > 3% of GDP.
Figure 8: Frankel & Schreger(June 2013)
2-years ahead, thru 2009

3232
Figure 4: Budget Balance Forecasts, 1-Year Ahead F&S (Jun 2013)
Can private forecasts improve on official forecasts?
Yes. The ex ante official-private difference
is correlated with the ex post official prediction error.

3333
Figure 5: GDP Growth Forecasts, 1-Year Ahead F&S (Jun
2013)
The same with growth forecasts.
The official-private difference is correlated with the official
prediction
error.

3434
Table 4: Official Budget Balance Forecast Errors and Government-Private Disagreement
1-year ahead forecasts. 20 countries, 205 observations
(1) (3) (5) (7)
Gov-Con BBt+i 0.934** 0.873* 0.888*** 0.821*(0.349) (0.461) (0.296) (0.402)
Constant -0.050 -0.019 -1.568*** -1.551***(0.156) (0.191) (0.075) (0.102)
R2 0.177 0.280 0.445 0.535Country FE No Yes No YesYear FE No No Yes Yes
The LHS variable is the official budget forecast error. Gov-Con BB is the official forecast budget balance minus the Consensus forecast of the budget balance.
The official-private difference in ex ante budget forecasts is significantly correlated with the ex post official prediction error.
*** p<0.01, ** p<.05 * p<0.1 (Robust s.e.s in parentheses.)

3535
(1) (3) (5) (7)
Gov-Con GDPt 1.146* 1.194* 0.695* 0.716*(0.572) (0.657) (0.350) (0.396)
Constant 0.156 0.0824 1.062*** 1.060***(0.120) (0.090) (0.023) (0.026)
R2 0.078 0.115 0.561 0.589Country FE No Yes No YesYear FE No No Yes Yes
Table 5: Official Growth Forecast Errors and Government-Private Disagreement
1-year ahead forecasts. 29 countries, 350 observations,
The official-private difference in ex ante budget forecasts is significantly correlated with the ex post official prediction error.
The LHS variable in every column is the Official Real GDP Forecast Error. Gov-Con GDP is the official forecast real GDP growth rate minus the Consensus forecast.
*** p<0.01, * p<0.1 (Robust s.e.s in parentheses.)

3636
Conclusions
Incorporating private sector forecasts into the budget process could help countries stick to
fiscal rules:
1. Official forecasters are more over-optimistic than private forecasters judged by outcomes for budget balances & real GDP.
2. While euro area governments were very reluctant to forecast violations of the 3% deficit/GDP cap in the SGP during the period 1999-2009, private sector forecasters were not.
3.The difference between official forecast & private forecast is positively correlated with the difference between official forecast and ex post realization, i.e., the prediction error.

3737
References by the author “Bias in Official Fiscal Foreasts: Can Private Forecasts Help?” with Jesse Schreger, Harvard Kennedy School, 18 June 2013."Over-optimistic Official Forecasts and Fiscal Rules in the Eurozone," with J. Schreger; Review of World Economy (Weltwirtschaftliches Archiv) 149, no.2, 2013. NBER WP 18283. Summary, ""Will Europe's Fiscal Compact Work?Will Europe's Fiscal Compact Work?" Project Syndicate, Jan.2013.
"Over-optimism in Forecasts by Official Budget Agencies and Its Implications," Oxford Review of Economic Policy Vol.27, 4, 2011, 536-62. NBER WP 17239; Summary in NBER Digest, Nov.2011.
“On Graduation from Fiscal Procyclicality,” with Carlos Vegh & Guillermo Vuletin,,Journal of Development Economics, 100, no.1,2013; pp. 32-47.. HKS RWP 12-011. NBER WP 17619. Summarized in VoxEU, 2011.
“A Solution to Fiscal Procyclicality: The Structural Budget Institutions Pioneered by Chile,” Central Bank of Chile WP 604, 2011. Journal Economía Chilena vol.14, no.2, Aug., 2011. “A Lesson From the South for Fiscal Policy in the US and Other Advanced Countries,” Comparative Economic Studies, 53, no.3, 2011, 407-30. HKS RWP11-014.
“Snake-Oil Tax Cuts,” 2008, Economic Policy Institute Briefing Paper 221. HKS
RWP 08-056.

3838
Appendices
Appendix I: Which countries have historically followed pro-cyclical or counter-cyclical fiscal policy?
Appendix II: Chile’s fiscal institutions.

3939
Appendix I:Pro-cyclical fiscal
policy Fiscal policy has historically tended
to be procyclical in developing countries Cuddington (1989), Tornell & Lane (1999), Kaminsky, Reinhart
& Vegh (2004), Talvi & Végh (2005), Alesina, Campante & Tabellini (2008), Mendoza & Oviedo (2006), Ilzetski & Vegh (2008), Medas & Zakharova (2009), Gavin & Perotti (1997), Erbil (2011).
Correlation of income & spending mostly positive –
in comparison with industrialized countries.

4040
Correlations between Gov.t Spending & GDP1960-1999p
rocyclic
al }
G always used to be pro-cyclicalfor most developing countries.
countercyclic
al
Adapted from Kaminsky, Reinhart & Vegh (2004)

41414141
An important development -- some developing countries, including commodity producers, were able to break the historic pattern in the most recent decade: taking advantage of the boom of 2002-2008
to run budget surpluses & build reserves,
thereby earning the ability to expand fiscally in the 2008-09 crisis.
Chile, Botswana, Malaysia, Indonesia, Korea…
How were they able to achieve counter-cyclicality?
The procyclicality of fiscal policy, cont.

4242
Correlations between Government spending & GDP 2000-2009
In the last decade, about 1/3 developing countries
switched to countercyclical fiscal policy:Negative correlation of G & GDP.
Frankel, Vegh & Vuletin (2013)
procyclic
al
countercyclic
al

4343
1st rule – Governments must set a budget target,
2nd rule – The target is structural: Deficits allowed only to the extent that (1) output falls short of trend, in a recession, (2) or the price of copper is below its trend.
3rd rule – The trends are projected by 2 panels of independent experts, outside the political process. Result: Chile avoided the pattern of 32 other
governments, where forecasts in booms were biased toward
optimism.
The example of Chile
4444
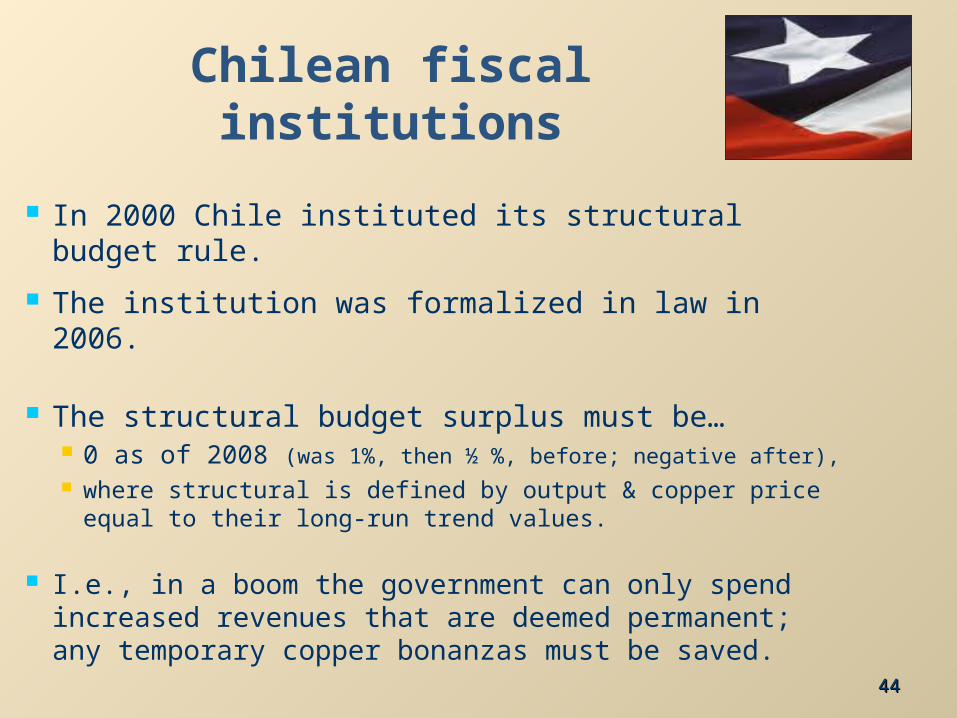
Chilean fiscal institutions
In 2000 Chile instituted its structural budget rule.
The institution was formalized in law in 2006.
The structural budget surplus must be… 0 as of 2008 (was 1%, then ½ %, before; negative after), where structural is defined by output & copper price
equal to their long-run trend values.
I.e., in a boom the government can only spend increased revenues that are deemed permanent; any temporary copper bonanzas must be saved.

4545
Chile’s fiscal position strengthened immediately: Public saving rose from 2.5 % of GDP in 2000 to 7.9 % in 2005 allowing national saving to rise from 21 % to 24 %.
Government debt fell sharply as a share of GDP and the sovereign spread gradually declined.
By 2006, Chile achieved a sovereign debt rating of A, several notches ahead of Latin American peers.
By 2007 it had become a net creditor. By 2010, Chile’s sovereign rating had climbed to A+,
ahead of some advanced countries. Now AA-.
=> It was able to respond to the 2008-09 recession via fiscal expansion.
The Pay-off
4646
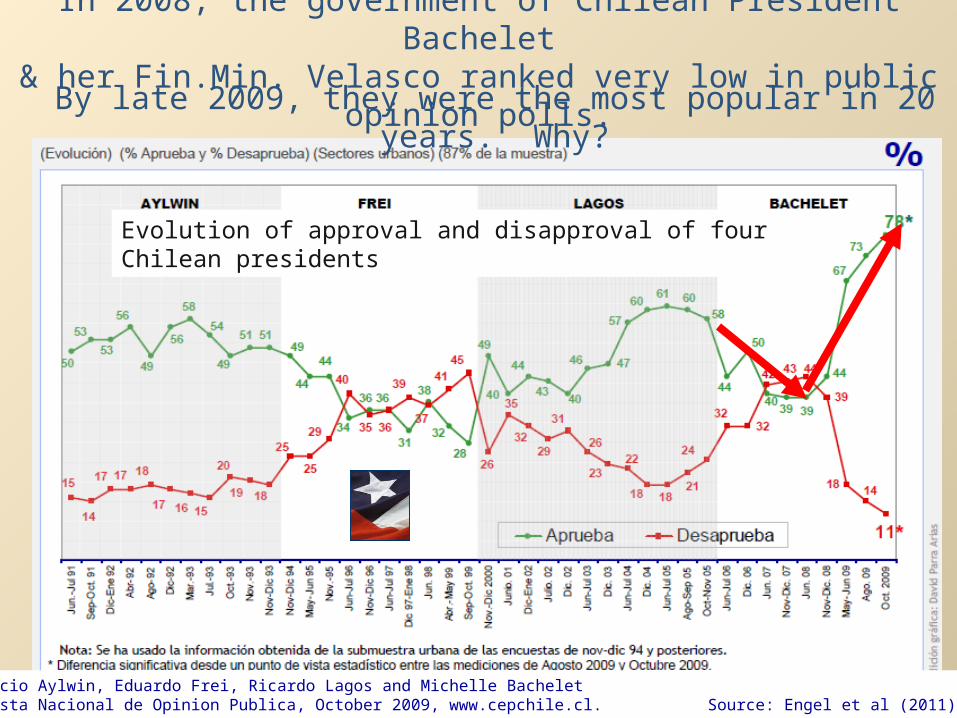
In 2008, the government of Chilean President Bachelet& her Fin.Min. Velasco ranked very low in public opinion
polls.
Presidents Patricio Aylwin, Eduardo Frei, Ricardo Lagos and Michelle BacheletData: CEP, Encuesta Nacional de Opinion Publica, October 2009, www.cepchile.cl. Source: Engel et al (2011).
Evolution of approval and disapproval of four Chilean presidents
By late 2009, they were the most popular in 20 years. Why?
4747
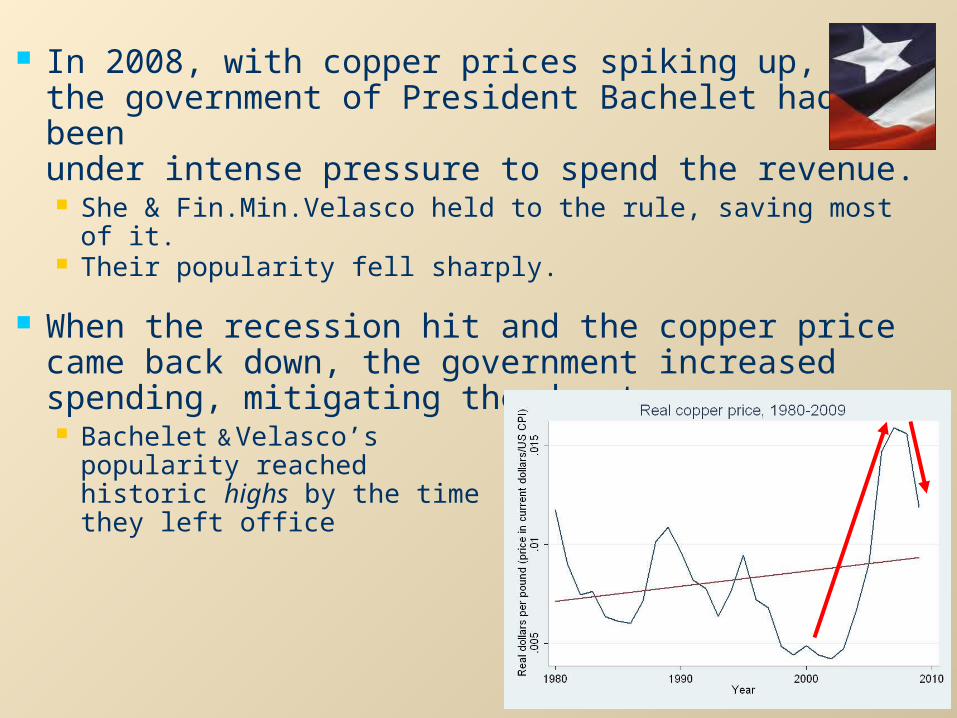
In 2008, with copper prices spiking up, the government of President Bachelet had beenunder intense pressure to spend the revenue. She & Fin.Min.Velasco held to the rule, saving most of it. Their popularity fell sharply.
When the recession hit and the copper price came back down, the government increased spending, mitigating the downturn. Bachelet & Velasco’s
popularity reached historic highs by the time they left office

4848
And the Finance Minister?: August 2009
Chart source: Eduardo Engel, Christopher Neilson & Rodrigo Valdés, “Fiscal Rules as Social Policy,” Commodities Workshop, World Bank, Sept. 17, 2009
Poll ratings of Chile’s
Presidents and Finance
Ministers
In August 2009, the popularity of the Finance Minister, Andres Velasco,
ranked behind only President Bachelet, despite also having been low two years
before. Why?

4949
5 econometric findings regarding official forecasts in Chile.
(1) The key macroeconomic input for budget forecasting in most countries: GDP. In Chile: the copper price.
(2) Real copper prices revert to trend in the long run.
But this is not always readily perceived: (3) 30 years of data are not enough
to reject a random walk statistically; 200 years of data are needed.
(4) Uncertainty (option-implied volatility) is higher when copper prices are toward the top of the cycle.
(5) Chile’s official forecasts are not overly optimistic.It has apparently avoided the problem of forecasts that unrealistically extrapolate in boom times.

5050
Chile’s official forecasts have not been over-optimistic.

5151
In sum, Chile’s fiscal institutions appear to have overcome the problem of over-optimism:
Chile is not subject to the same bias toward over-optimism in forecasts of the budget, growth, or the all-important copper price.
The key innovation that has allowed Chile to achieve countercyclical fiscal policy: not just a structural budget rule in itself, but rather the regime that entrusts to two panels
of independent experts estimation of the long-run trends of copper prices & GDP.

5252
Application of the innovation to other countries
Any country could adopt the Chilean mechanism.
Suggestion: give the panels more institutional independence as is familiar from central banking:
laws protecting them from being fired.
Open questions: Are the budget rules to be interpreted as ex ante or ex post? How much of the structural budget calculations are
to be delegated to the independent panels of experts? Minimalist approach: they compute only 10-year moving averages.
Can one guard against subversion of the institutions (CBO) ?
5353
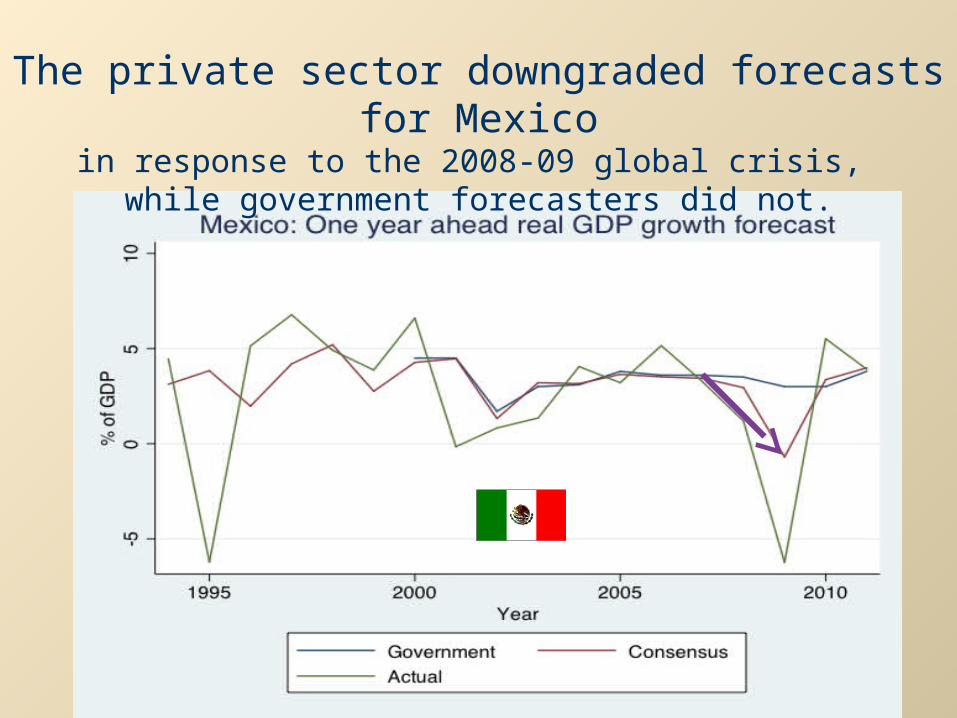
The private sector downgraded forecasts for Mexico
in response to the 2008-09 global crisis, while government forecasters did not.

5454
The private sector has also been less optimisticthan government forecasters about Mexican budget
prospectsespecially in the 2009 global crisis.