Applications Jeffrey Frankel Harpel Professor of Capital...
56
Trade and Inequality Jeffrey Frankel Harpel Professor of Capital Formation & Growth Harvard University Providence Committee on Foreign Relations December 14, 2016 An earlier version was presented as the Clair Wilcox Lecture, Swarthmore College, Oct. 24, 2016 1
Transcript of Applications Jeffrey Frankel Harpel Professor of Capital...
Trade and Inequality
Jeffrey Frankel Harpel Professor of Capital Formation & Growth
Harvard University
Providence Committee on Foreign Relations December 14, 2016
An earlier version was presented as the Clair Wilcox Lecture, Swarthmore College, Oct. 24, 2016
1
Overview on Trade & Inequality •
• The connection between trade and inequality received intense interest in this strange presidential election year.
– Why did Trump’s success catch elites so much by surprise?
– The story: “we hadn’t adequately realized how deep was the hardship and anger of those left behind by globalization… “
– “Trade led to inequality, and inequality led to Trump. “
– Analogous stories in Europe, e.g., Brexit.
• I will talk
– first about trade,
– then about inequality & its causes. 2
Trade & GDP
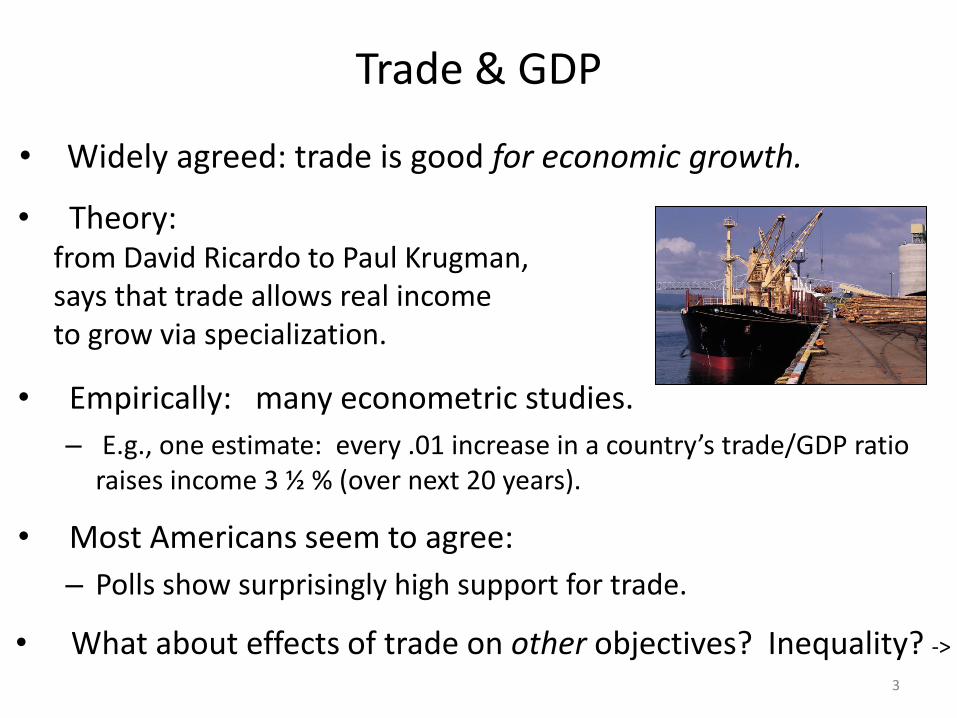
• Most Americans seem to agree:
– Polls show surprisingly high support for trade.
• Widely agreed: trade is good for economic growth.
• Theory: from David Ricardo to Paul Krugman, says that trade allows real income to grow via specialization.
• Empirically: many econometric studies.
– E.g., one estimate: every .01 increase in a country’s trade/GDP ratio raises income 3 ½ % (over next 20 years).
• What about effects of trade on other objectives? Inequality? ->
3
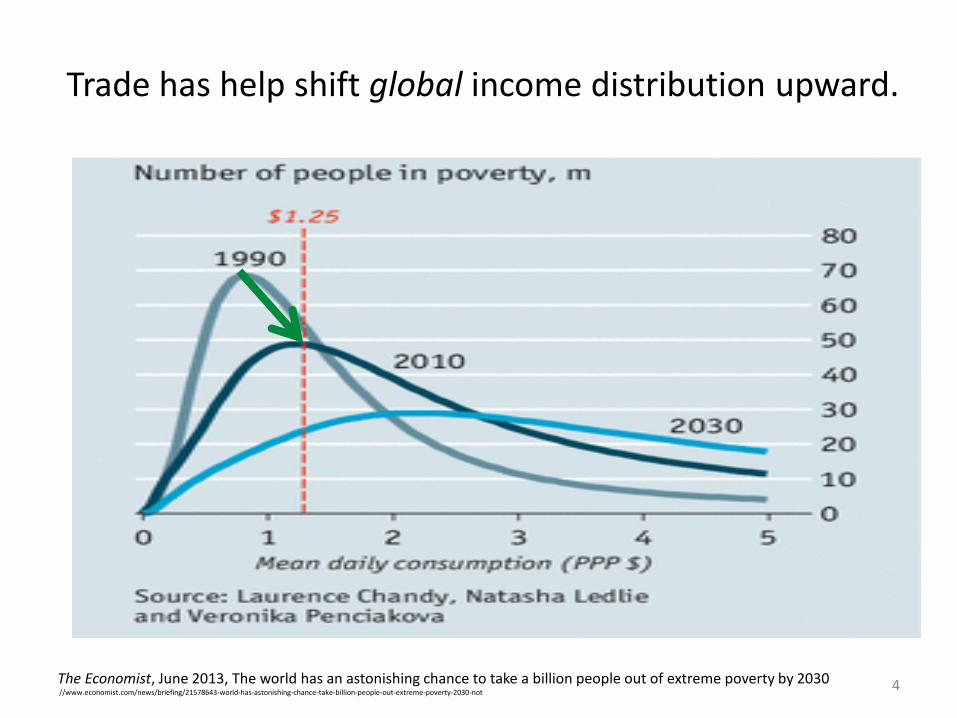
Trade has help shift global income distribution upward.
The Economist, June 2013, The world has an astonishing chance to take a billion people out of extreme poverty by 2030 //www.economist.com/news/briefing/21578643-world-has-astonishing-chance-take-billion-people-out-extreme-poverty-2030-not
4
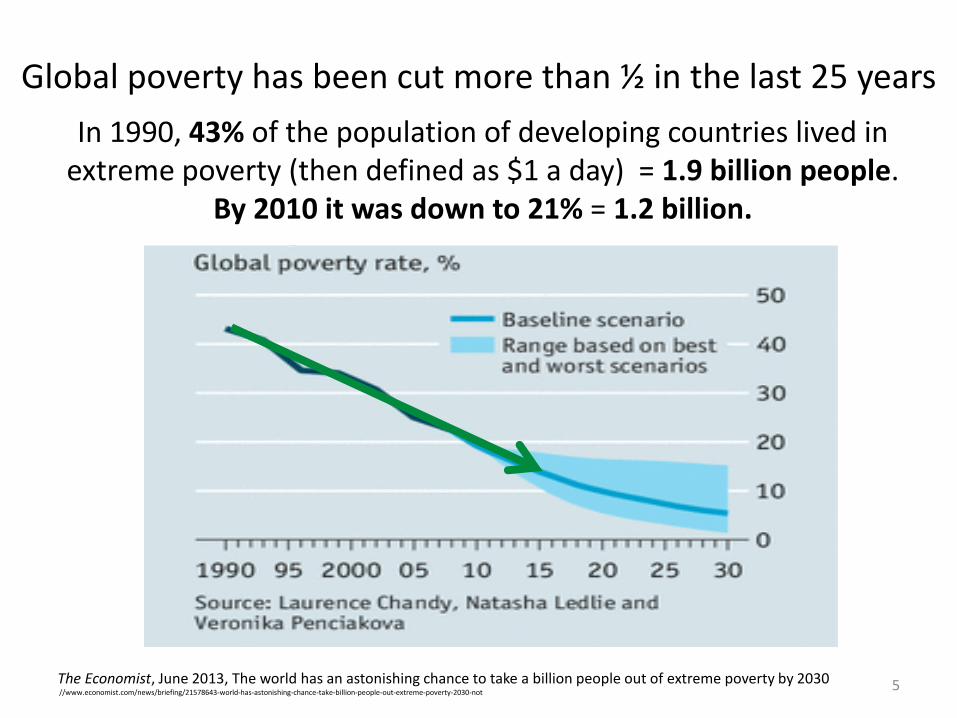
Global poverty has been cut more than ½ in the last 25 years
In 1990, 43% of the population of developing countries lived in extreme poverty (then defined as $1 a day) = 1.9 billion people.
By 2010 it was down to 21% = 1.2 billion.
The Economist, June 2013, The world has an astonishing chance to take a billion people out of extreme poverty by 2030 //www.economist.com/news/briefing/21578643-world-has-astonishing-chance-take-billion-people-out-extreme-poverty-2030-not
5
Inequality & anti-globalization.
Elections are domestic, of course. Typical explanation for the surprise Trump nomination:
Globalization US inequality. Anger from those left behind who then support radical changes.
“We should have seen it coming, but were out of touch.”
To summarize my take: • Inequality has unquestionably risen, esp. in US. • Trade & immigration probably play roles,
• along with a long list of other factors. • I don’t see the inequality issue logically leading to Trump. • There are some clear answers to the question: How can we
address the wellbeing of workers who have been left behind? 6
Needless to say, trade creates both winners & losers.
• So does every change. – E.g., putting up tariffs would create both winners and losers (many).
• “Pareto superiority” would require that everyone wins. If we economists require that before recommending one policy over another, then we can never make any recommendations. Someone always loses.
• Economists can make win-win policy recommendations if we express the distributional consideration in terms of a desired measure of overall inequality. – We can approve a policy that, while raising total income,
also reduces measures of inequality, – lowers the poverty rate, – or raises median income.
7
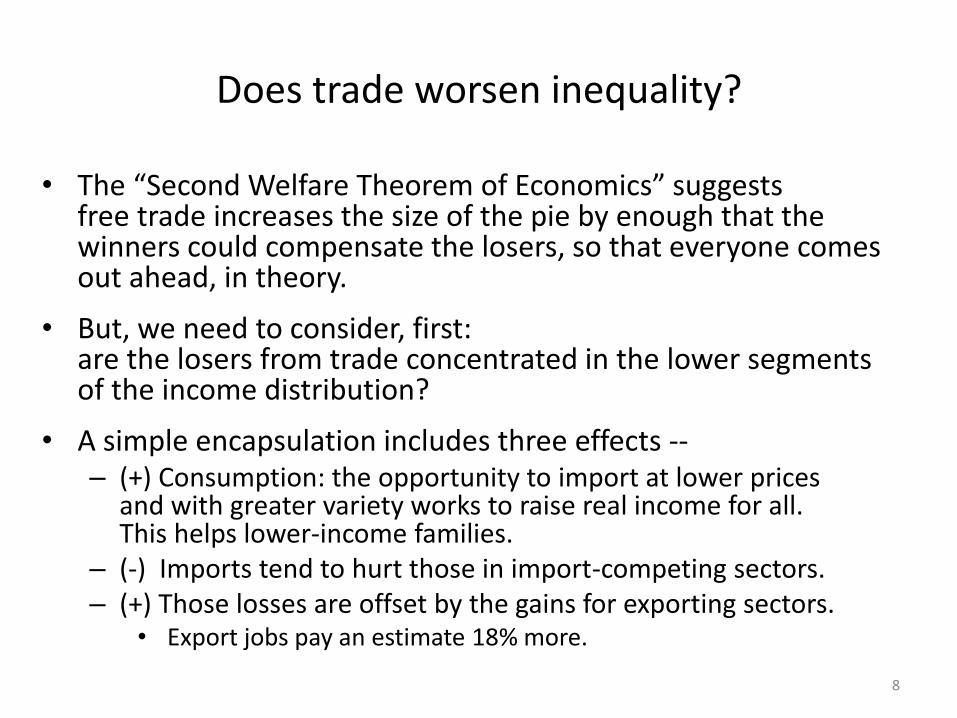
Does trade worsen inequality?
• The “Second Welfare Theorem of Economics” suggests free trade increases the size of the pie by enough that the winners could compensate the losers, so that everyone comes out ahead, in theory.
• But, we need to consider, first: are the losers from trade concentrated in the lower segments of the income distribution?
• A simple encapsulation includes three effects -- – (+) Consumption: the opportunity to import at lower prices
and with greater variety works to raise real income for all. This helps lower-income families.
– (-) Imports tend to hurt those in import-competing sectors. – (+) Those losses are offset by the gains for exporting sectors.
• Export jobs pay an estimate 18% more.
8
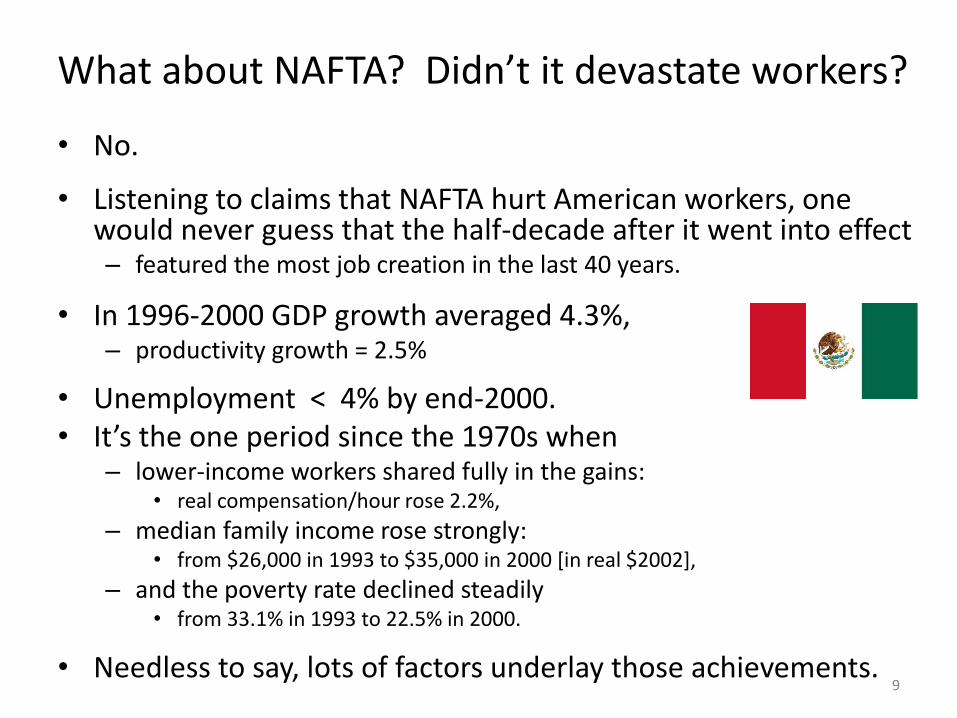
What about NAFTA? Didn’t it devastate workers?
• No.
• Listening to claims that NAFTA hurt American workers, one would never guess that the half-decade after it went into effect – featured the most job creation in the last 40 years.
• In 1996-2000 GDP growth averaged 4.3%, – productivity growth = 2.5%
• Unemployment < 4% by end-2000. • It’s the one period since the 1970s when
– lower-income workers shared fully in the gains: • real compensation/hour rose 2.2%,
– median family income rose strongly: • from $26,000 in 1993 to $35,000 in 2000 [in real $2002],
– and the poverty rate declined steadily • from 33.1% in 1993 to 22.5% in 2000.
• Needless to say, lots of factors underlay those achievements. 9
Recent research on job loss in import-competing sectors
• David Autor, David Dorn & Gordon Hanson (2013, 2016) have found evidence that
– a portion of lost US manufacturing jobs can indeed be associated with imports,
• especially from China.
– Employment & income in towns hit by such job losses can stay depressed for a much longer time than some had imagined.
10
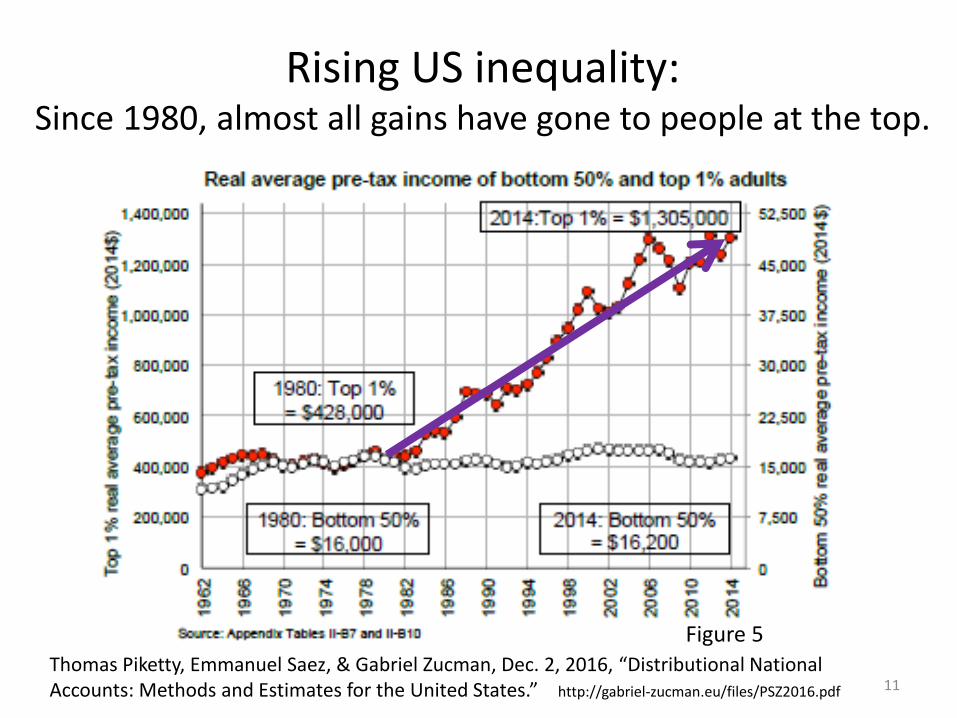
Rising US inequality: Since 1980, almost all gains have gone to people at the top.
11
Figure 5 Thomas Piketty, Emmanuel Saez, & Gabriel Zucman, Dec. 2, 2016, “Distributional National Accounts: Methods and Estimates for the United States.” http://gabriel-zucman.eu/files/PSZ2016.pdf
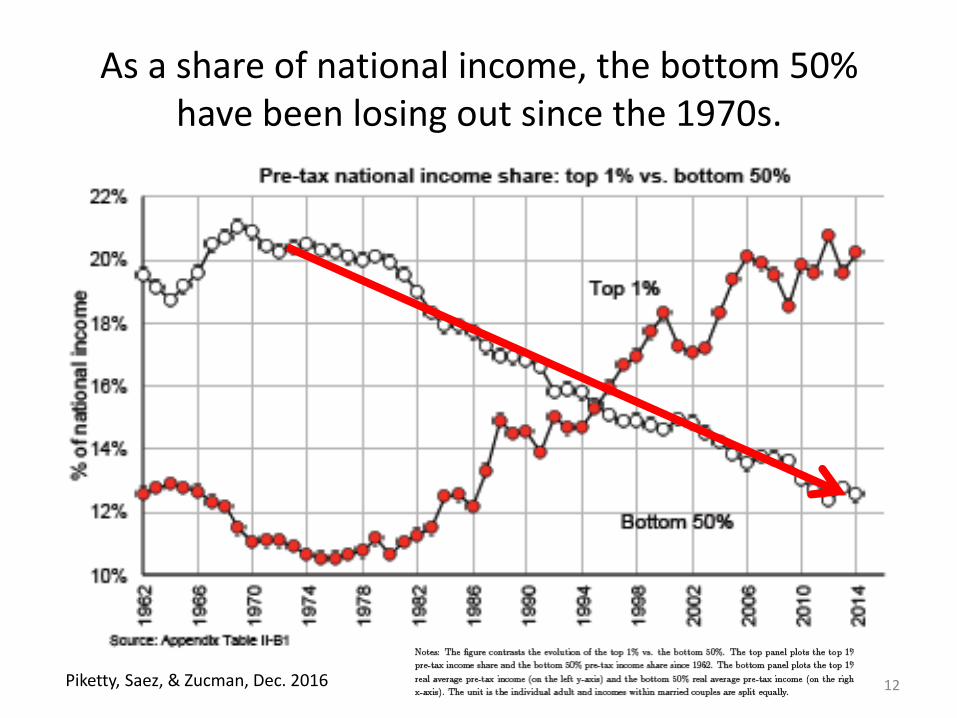
As a share of national income, the bottom 50% have been losing out since the 1970s.
12
Piketty, Saez, & Zucman, Dec. 2016
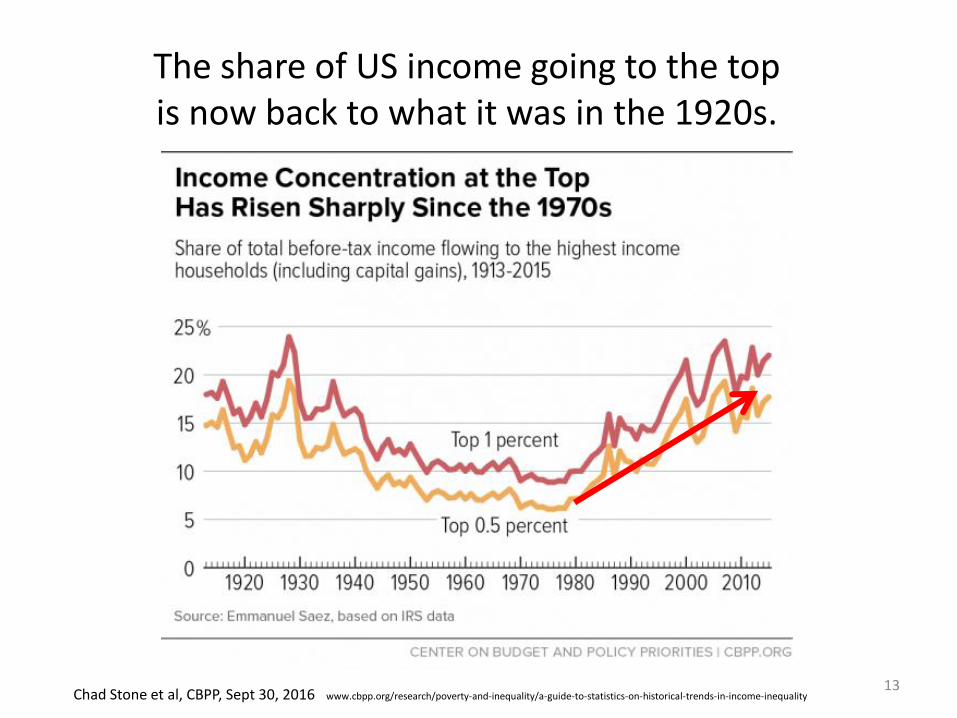
The share of US income going to the top is now back to what it was in the 1920s.
Chad Stone et al, CBPP, Sept 30, 2016 www.cbpp.org/research/poverty-and-inequality/a-guide-to-statistics-on-historical-trends-in-income-inequality 13
Why has inequality risen in the US?
1. Trade probably does play a role, alongside other factors:
2. technological change raising demand for skilled workers,
3. outpacing education that raises the supply;
4. “winner-take-all” labor markets,
5. “assortative mating,”
6. reduced corporate competition & higher rents,
7. excessive executive compensation;
8. and Thomas Piketty’s wealth accumulation.
Other suggested factors: declining roles of unions, minimum wage, & progressive taxation.
14
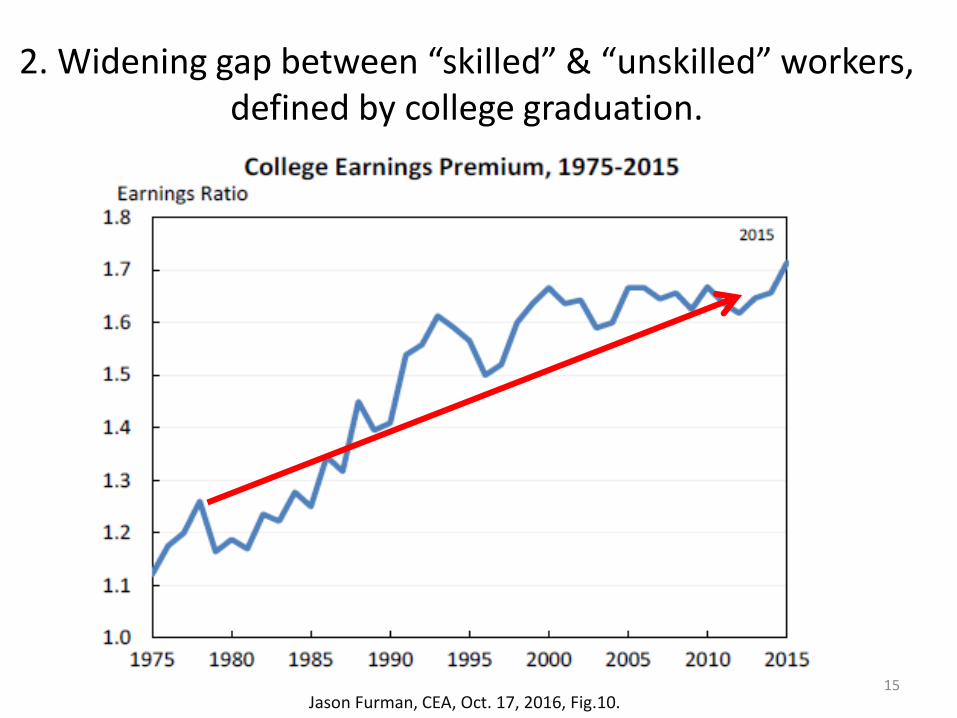
2. Widening gap between “skilled” & “unskilled” workers, defined by college graduation.
Jason Furman, CEA, Oct. 17, 2016, Fig.10. 15
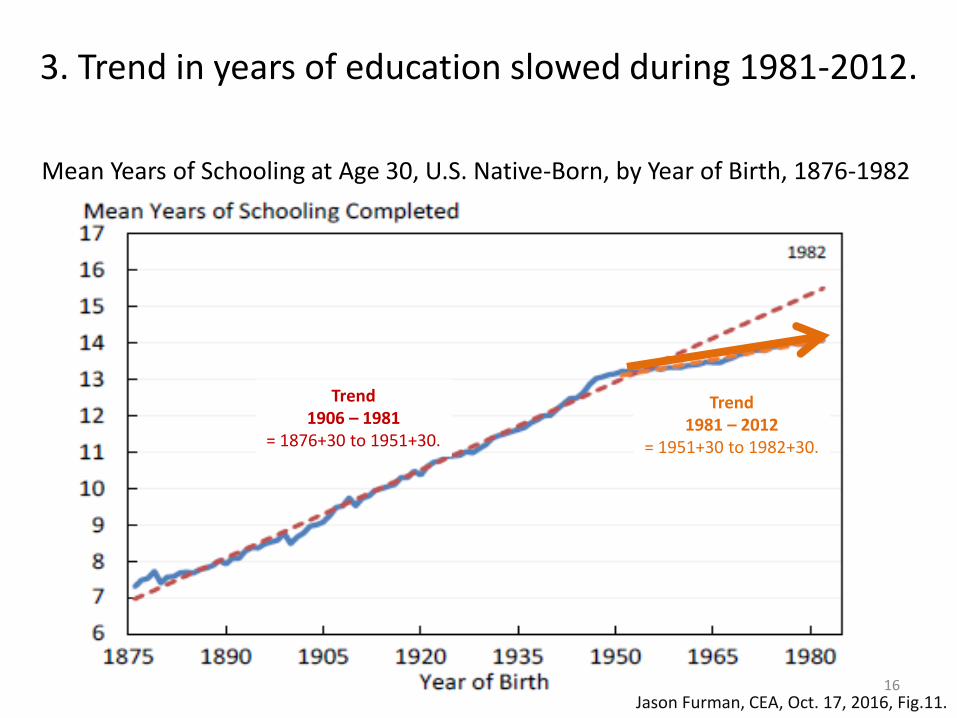
3. Trend in years of education slowed during 1981-2012.
Jason Furman, CEA, Oct. 17, 2016, Fig.11.
Trend 1981 – 2012
= 1951+30 to 1982+30.
Trend 1906 – 1981
= 1876+30 to 1951+30.
Mean Years of Schooling at Age 30, U.S. Native-Born, by Year of Birth, 1876-1982
16
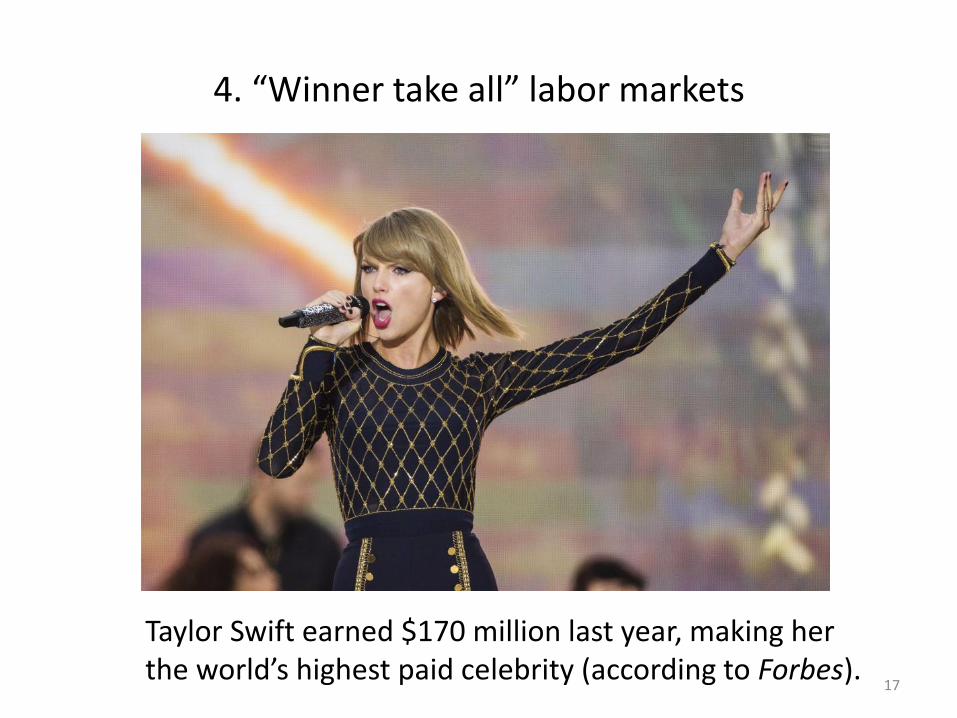
4. “Winner take all” labor markets
Taylor Swift earned $170 million last year, making her the world’s highest paid celebrity (according to Forbes).
17
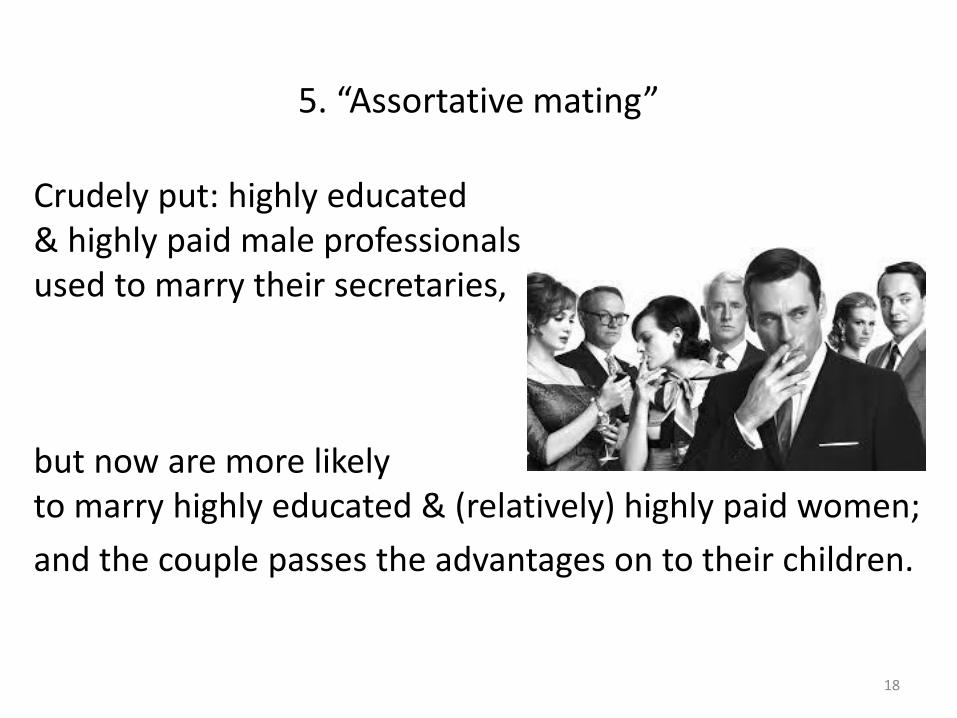
5. “Assortative mating”
Crudely put: highly educated & highly paid male professionals used to marry their secretaries,
but now are more likely to marry highly educated & (relatively) highly paid women;
and the couple passes the advantages on to their children.
18
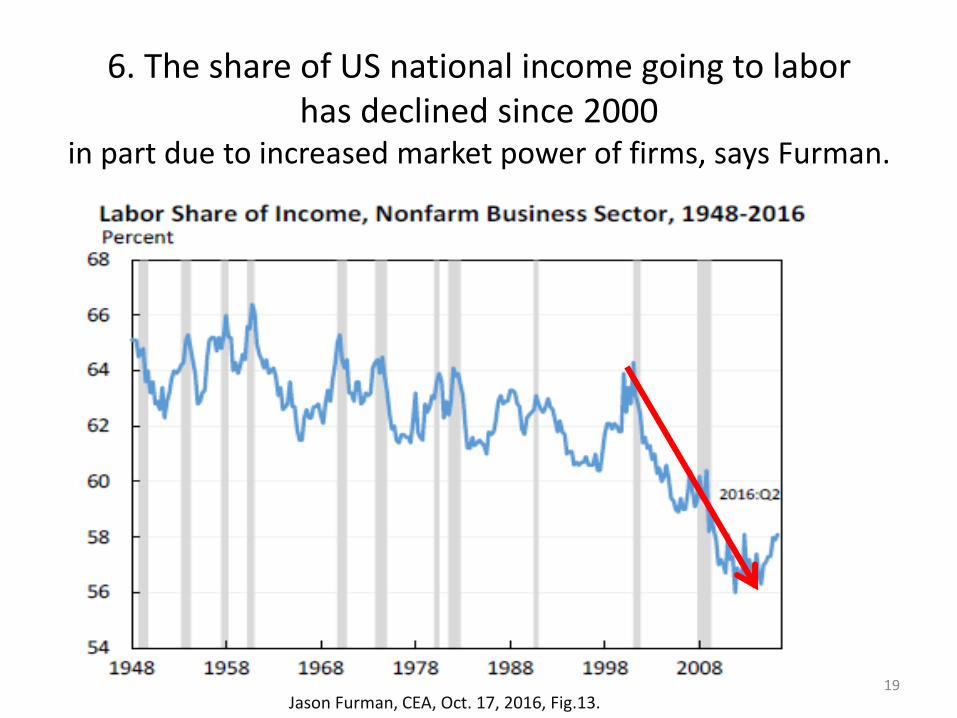
6. The share of US national income going to labor has declined since 2000
in part due to increased market power of firms, says Furman.
Jason Furman, CEA, Oct. 17, 2016, Fig.13. 19
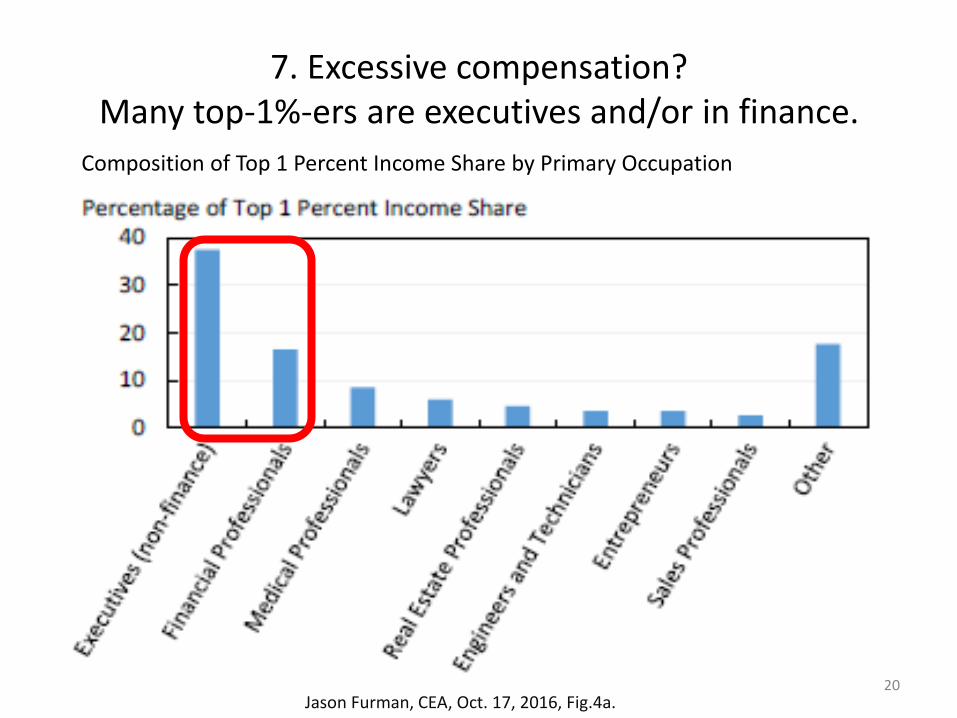
7. Excessive compensation? Many top-1%-ers are executives and/or in finance.
Jason Furman, CEA, Oct. 17, 2016, Fig.4a.
Composition of Top 1 Percent Income Share by Primary Occupation
20
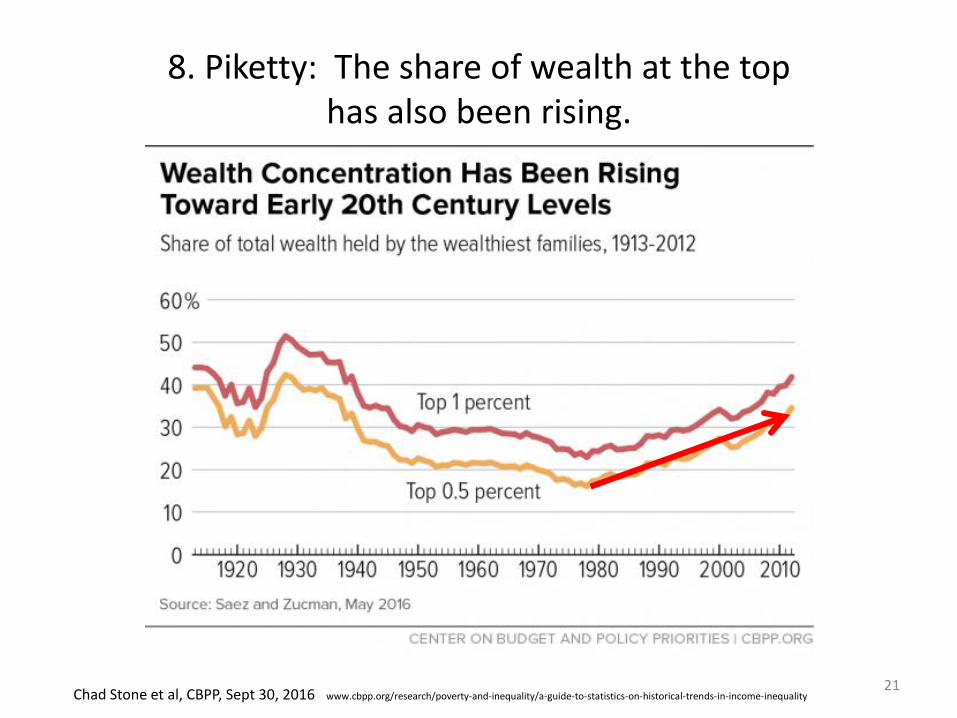
8. Piketty: The share of wealth at the top has also been rising.
Chad Stone et al, CBPP, Sept 30, 2016 www.cbpp.org/research/poverty-and-inequality/a-guide-to-statistics-on-historical-trends-in-income-inequality 21
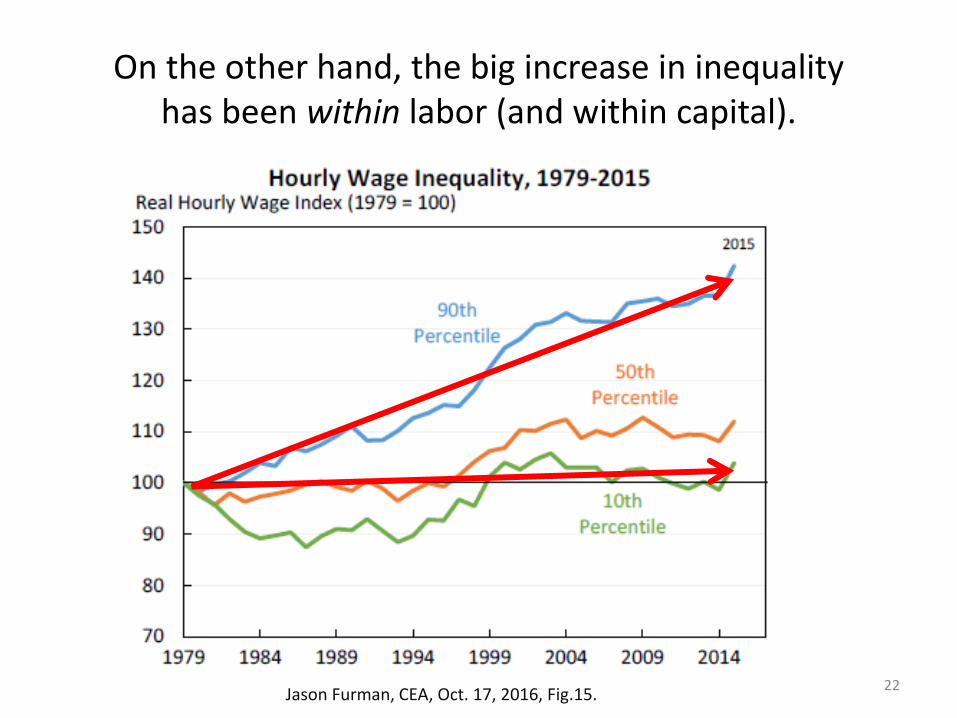
On the other hand, the big increase in inequality has been within labor (and within capital).
Jason Furman, CEA, Oct. 17, 2016, Fig.15. 22
What weights should we place on each of these 8 factors in explaining increased inequality?
• I don’t know.
• Probably all or most of them merit some weight:
• Trade, technology, education, winner-take-all, assortative mating, rents, executive compensation, or Piketty’s wealth accumulation.
• Surely one must diagnose the cause before deciding on the corresponding remedy?
• No, I don’t think one has to.
23
The Second Fundamental Welfare Theorem.
• When individuals are free to engage in trade, the size of the economic pie increases enough that the winners could in theory compensate the losers, – in which case everyone would be better off.
• Skeptics of globalization may understand this theorem and yet, reasonably, point out that the compensation in practice tends to remain hypothetical.
• They suggest that we should take the political failure to compensate losers as given, and so try to roll back globalization. – But an alternative would be the reverse strategy:
take globalization as given and instead work on trying to help those left behind.
– This is the sensible strategy. • Why?
24
• Even leaving aside the negative effects
of trade wars on economic growth,
– and the geopolitical damage,
• nothing a president does could bring the number of manufacturing jobs back up anywhere near the levels of 60 years ago.
25
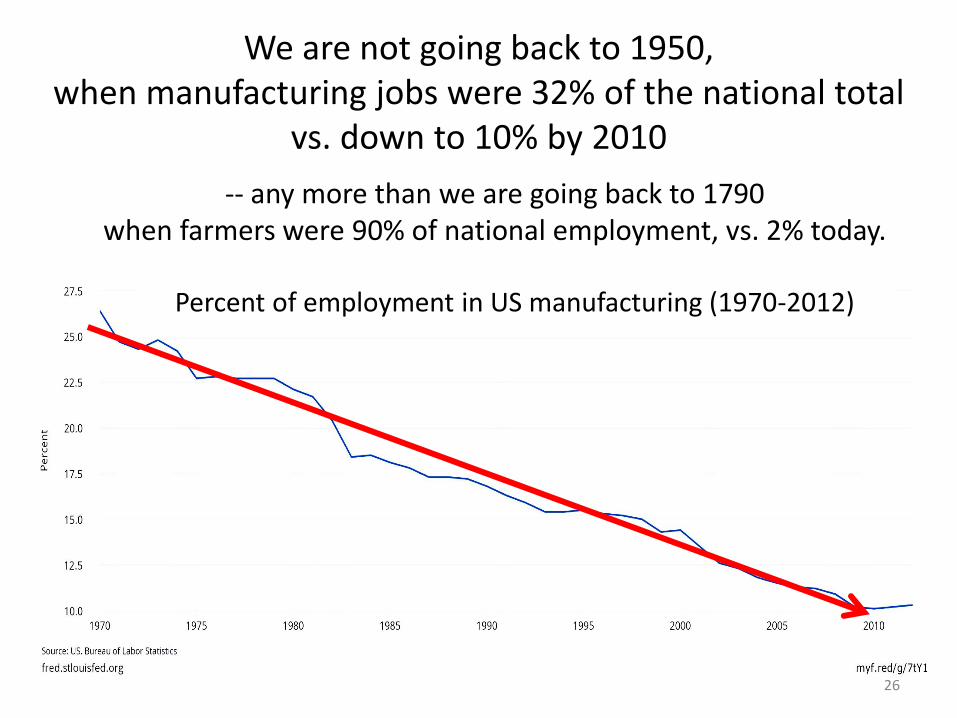
We are not going back to 1950, when manufacturing jobs were 32% of the national total
vs. down to 10% by 2010
26
Percent of employment in US manufacturing (1970-2012)
-- any more than we are going back to 1790 when farmers were 90% of national employment, vs. 2% today.
Some of those lost jobs were in autos & steel,
• where those northern workers who lacked a college education but were lucky enough to get a job in those two industries could earn a high income.
• After 1960, the number of jobs in sectors like steel fell by ½; – while the number of jobs in health care increased 6-fold.
• International trade was one factor that helped put an end to those high-paying jobs (along with productivity growth and relocation from the north to the south) – while improving the reliability, fuel efficiency and affordability
of cars for all of us – not just importing autos, – but also making US autos competitive again.
• Regardless, it is hard to see how we could go back. 27
The most effective policies to help those left behind (“to compensate the losers”):
• The program to help specifically those losing their jobs due to trade is Trade Adjustment Assistance.
– But why help only the small number of workers who have identifiably lost their jobs due to trade agreements?
– Wouldn’t it be better to help those who have been left behind regardless if the cause is trade, technology, or something else?
• and to do it in ways that still reward work.
28
Sensible policies to help those left behind include:
• Wage insurance;
• More progressive income tax system – including an expanded Earned Income Tax Credit, – And more progressive payroll tax rates too;
• Universal health insurance.
• Universal high-quality pre-school education;
• infrastructure investment spending;
• Financial regulation, such as Dodd-Frank.
Some politicians oppose these measures, – arguing that government overreach impedes growth.
29
Appendices
• Appendix 1: A century of US trade liberalization – Job losses in manufacturing
• Appendix 2: Trade theory
• Appendix 3: Opinion polls on trade
• Appendix 4: Trade and the environment
• Appendix 5: Improved global income distribution.
• Appendix 6: For each of 8 inequality diagnoses, one might think of a targeted policy response.
• Appendix 7: The outlook for the US trade deficit.
30
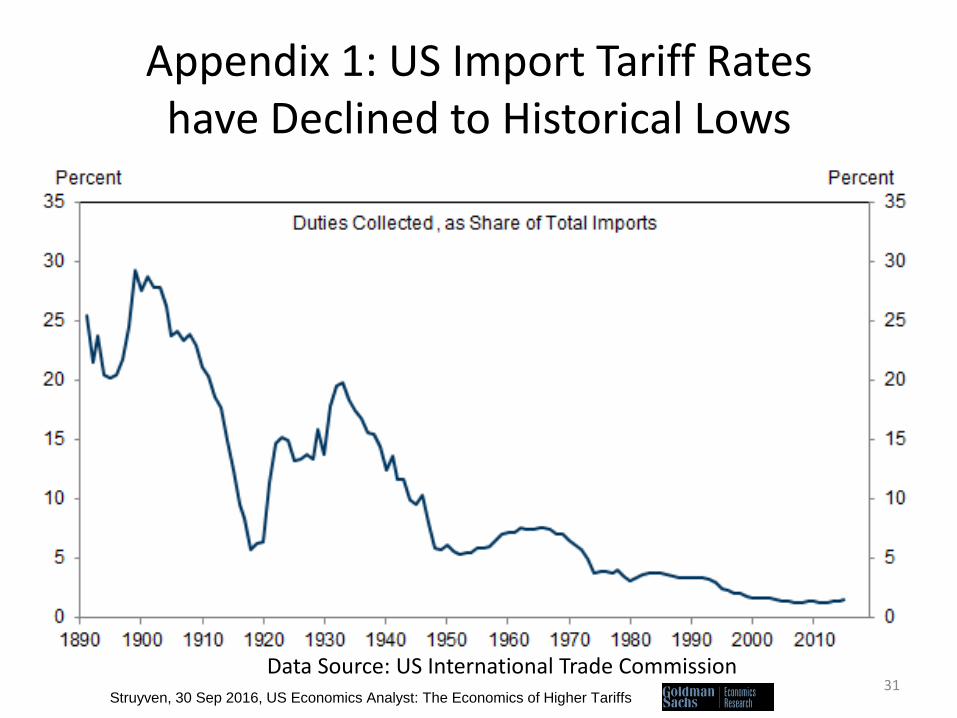
Appendix 1: US Import Tariff Rates have Declined to Historical Lows
Data Source: US International Trade Commission Struyven, 30 Sep 2016, US Economics Analyst: The Economics of Higher Tariffs
31
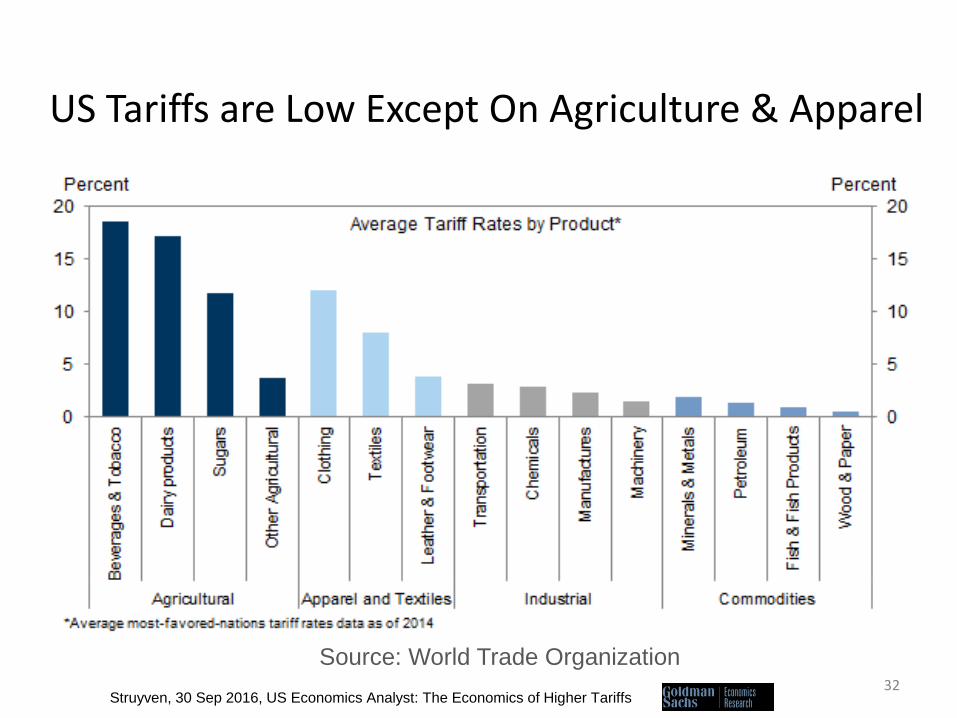
US Tariffs are Low Except On Agriculture & Apparel
Source: World Trade Organization
Struyven, 30 Sep 2016, US Economics Analyst: The Economics of Higher Tariffs 32
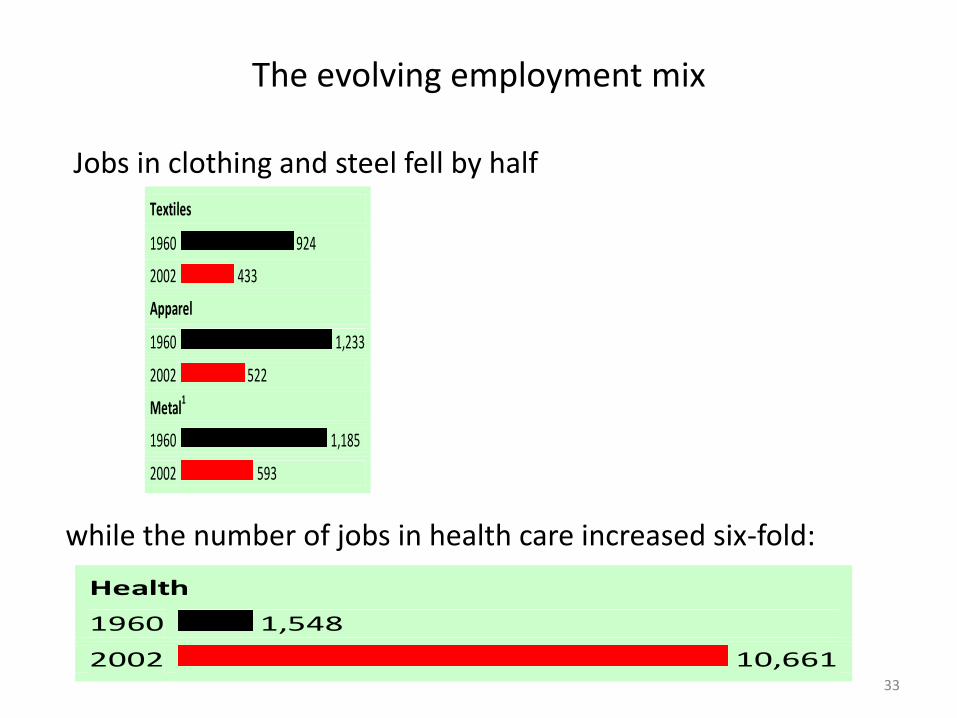
The evolving employment mix
Health
1960 1,548
2002 10,661
while the number of jobs in health care increased six-fold:
Textiles
1960 924
2002 433
Apparel
1960 1,233
2002 522
Metal1
1960 1,185
2002 593
Jobs in clothing and steel fell by half
33
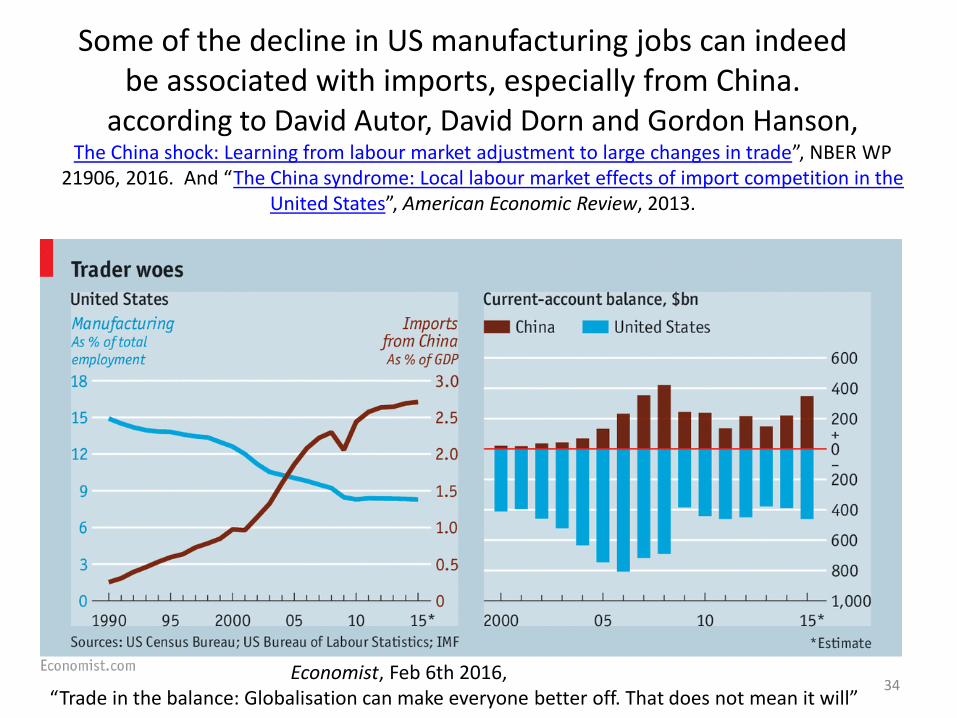
Some of the decline in US manufacturing jobs can indeed be associated with imports, especially from China.
Economist, Feb 6th 2016, “Trade in the balance: Globalisation can make everyone better off. That does not mean it will”
according to David Autor, David Dorn and Gordon Hanson, The China shock: Learning from labour market adjustment to large changes in trade”, NBER WP
21906, 2016. And “The China syndrome: Local labour market effects of import competition in the United States”, American Economic Review, 2013.
34
Appendix 2: Trade theory
• Throughout the history of international economics, theory has generally said that trade helps raise real national income:
– classical comparative advantage (Ricardo);
– and modern theories of trade
• based on imperfect competition (Krugman)
• & endogenous productivity (Melitz).
35

What does trade theory say about income distribution?
• Ironically, the trade theory that dominated academic research during the 1950s-70s was Heckscher-Ohlin-Samuelson,
• which gives solidly respectable grounds for fearing trade would hurt American workers even in absolute terms.
• It divides the population into “Unskilled” workers vs. others (owners of capital or land, or skilled workers) – The Stolper-Samuelson theorem specifically predicts that
workers in a capital-abundant country will lose from trade (wages fall), even though total real national income goes up.
• The H-O-S theory does not include the advances in trade theory since 1980.
• Still, its conclusions are very suggestive, – particularly regarding trade with low-income countries.
36
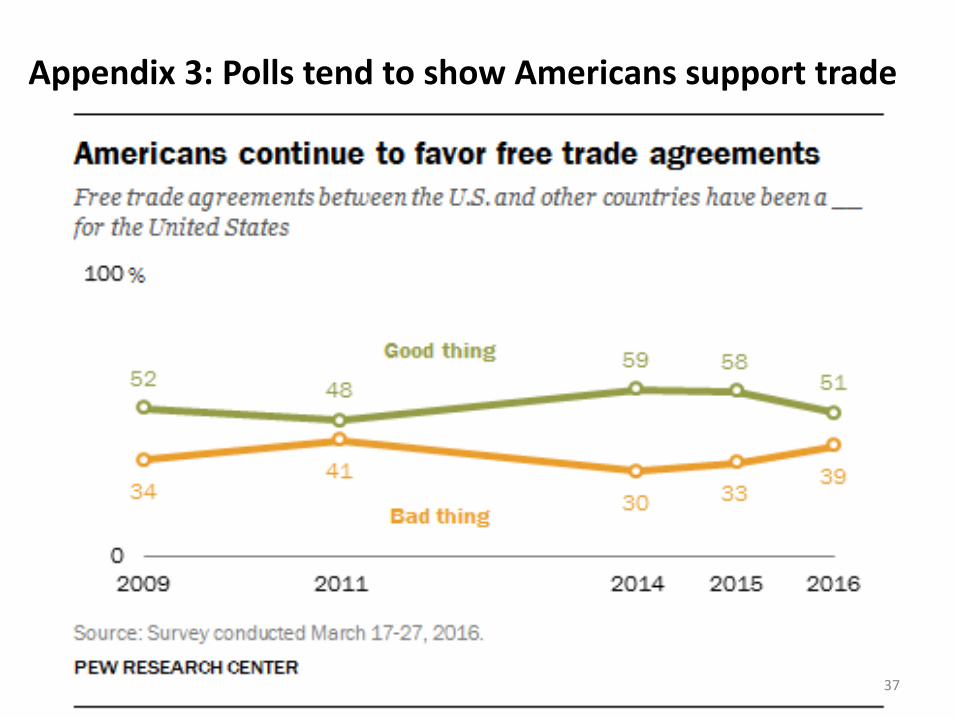
Appendix 3: Polls tend to show Americans support trade
37
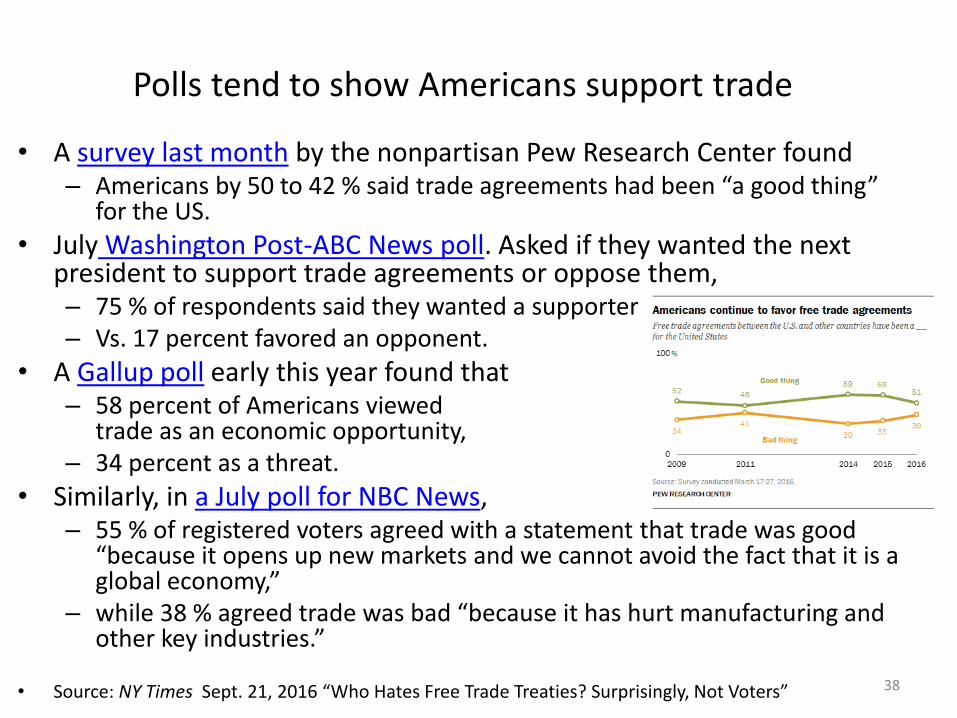
Polls tend to show Americans support trade
• A survey last month by the nonpartisan Pew Research Center found – Americans by 50 to 42 % said trade agreements had been “a good thing”
for the US.
• July Washington Post-ABC News poll. Asked if they wanted the next president to support trade agreements or oppose them, – 75 % of respondents said they wanted a supporter – Vs. 17 percent favored an opponent.
• A Gallup poll early this year found that – 58 percent of Americans viewed
trade as an economic opportunity, – 34 percent as a threat.
• Similarly, in a July poll for NBC News, – 55 % of registered voters agreed with a statement that trade was good
“because it opens up new markets and we cannot avoid the fact that it is a global economy,”
– while 38 % agreed trade was bad “because it has hurt manufacturing and other key industries.”
• Source: NY Times Sept. 21, 2016 “Who Hates Free Trade Treaties? Surprisingly, Not Voters” 38
Appendix 4: Trade can have either positive or negative effects on the environment.
• Example of negative effects: – “Race to the bottom” in environmental regulation among
national governments pursuing of cost-competitiveness.
• Example of positive effects: – Trade in environmental goods & services.
• US ended 1980s tariffs & quotas on fuel-efficient Japanese autos, benefiting both consumer pocketbooks & air quality.
• Almost ¾ of EU trade-remedy barriers currently target imports of products used for renewable energy! (Kasteng, 2013; Wu, 2014)
• AD remedies currently block trade in solar power inputs: – US has AD tariffs on imports of Chinese solar panels (2012, 2014, 2015).
– China has them against imports of polysilicon from US & EU (2012 & 2016);
– EU has penalties on imports of Chinese solar glass & panels (2013, 2015).
– They should be dropped, either by negotiation or unilaterally. 39
Which tend to dominate in practice, positive or negative effects of trade on the environment?
Econometric estimates depend on environmental criterion.
• For SO2 – Trade seems to be beneficial
• “Environmental Kuznets Curve” => at higher incomes, people want to clean the environment.
• For CO2 – Even at high levels of income, trade continues to hurt.
• The “free rider” problem => popular desire for environmental quality cannot be enacted at the national level, absent an effective multilateral treaty à la Paris Agreement.
Frankel & Rose, Review of Ec. & Stats. (2004).
40
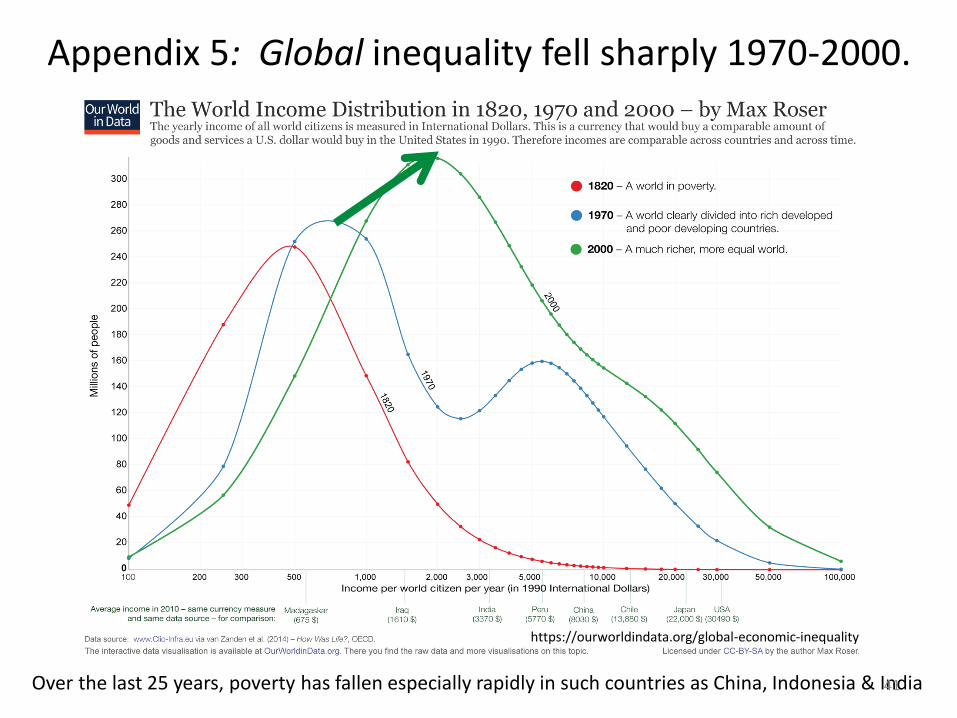
Appendix 5: Global inequality fell sharply 1970-2000.
https://ourworldindata.org/global-economic-inequality
Over the last 25 years, poverty has fallen especially rapidly in such countries as China, Indonesia & India 41
Appendix 6: For each of the 9 inequality diagnoses, one might think of a targeted policy response:
1. Trade
– Trade Adjustment Assistance or, better yet, wage insurance.
2. Technology and 3. education
– Make college more accessible to lower-income students.
4. “Winner-take-all” labor markets.
– An rise in income taxes & payroll taxes for the upper 0.1%.
5. “Assortative mating”
– Education again, especially universal pre-school.
…
42
For each of the 9 inequality diagnoses, a targeted policy response, continued:
… 6. Reduced corporate competition and increased monopoly rents
– More aggressive anti-trust action.
7. Executive compensation, especially in finance
– Reforms such as “say on pay,” separating the function of CEO & Chairman of the Board, “claw-back provisions,” and so on;
– Continued financial reform, begun under Dodd-Frank
• e.g., risk-tax on large financial institutions.
– Higher tax rates on the upper 0.1% and, very specifically, eliminating the carried-interest deduction.
8. Piketty’s wealth accumulation:
-- Inheritance tax, at least on estates above $5 million.
9. Less progressive income tax since 1981.
-- Could reverse that. 43
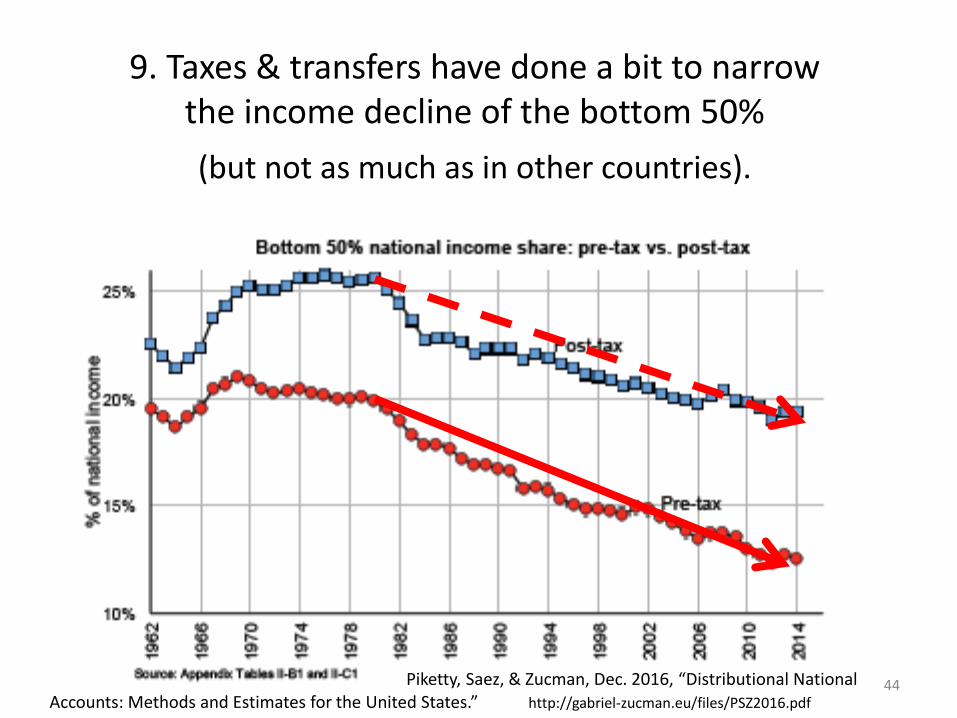
9. Taxes & transfers have done a bit to narrow the income decline of the bottom 50%
(but not as much as in other countries).
44 Piketty, Saez, & Zucman, Dec. 2016, “Distributional National Accounts: Methods and Estimates for the United States.” http://gabriel-zucman.eu/files/PSZ2016.pdf
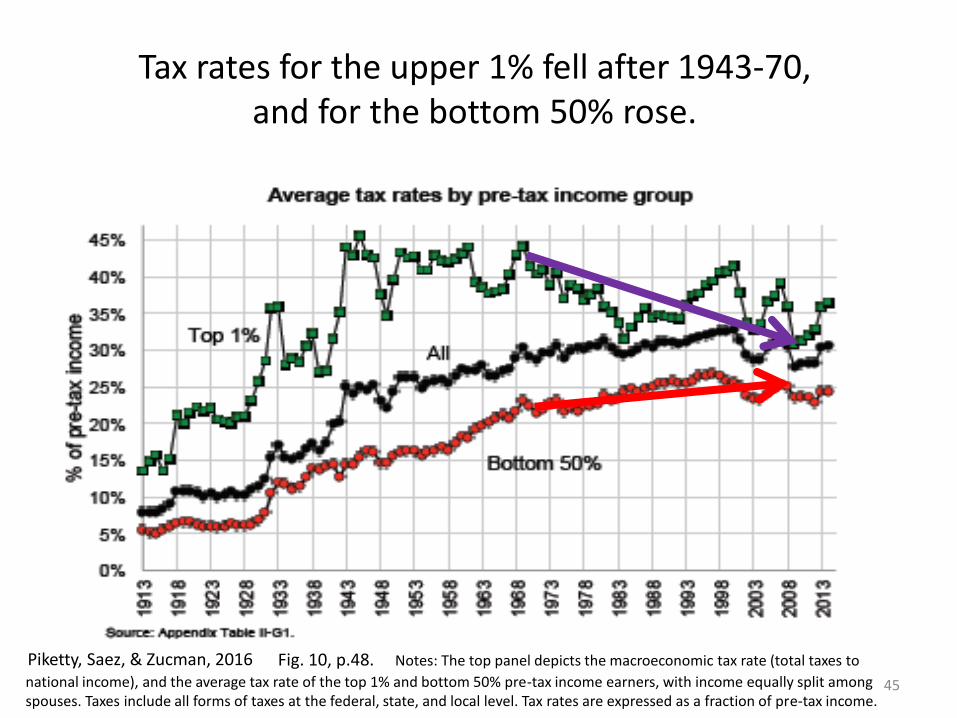
Tax rates for the upper 1% fell after 1943-70, and for the bottom 50% rose.
45
Fig. 10, p.48. Notes: The top panel depicts the macroeconomic tax rate (total taxes to
national income), and the average tax rate of the top 1% and bottom 50% pre-tax income earners, with income equally split among spouses. Taxes include all forms of taxes at the federal, state, and local level. Tax rates are expressed as a fraction of pre-tax income.
Piketty, Saez, & Zucman, 2016
Appendix 7: Outlook for the US trade balance
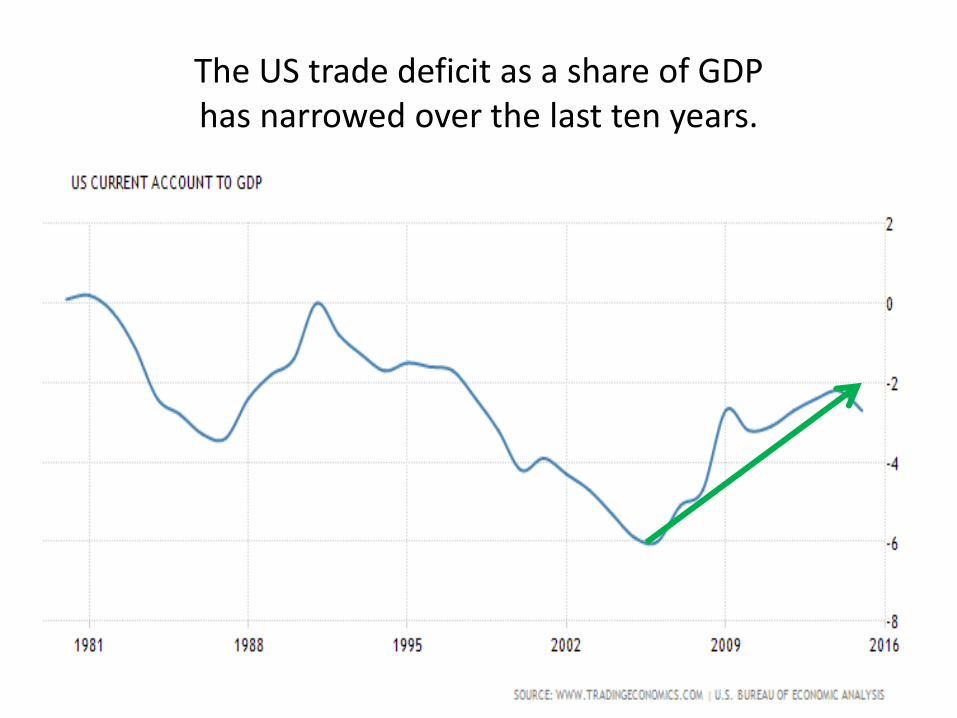
• Little-known fact: The US trade deficit has been narrowing for the last 10 years as a share of GDP
– [See graph.]
• Mr. Trump’s policies are likely to put the trade deficit back on a deteriorating path,
– even if he doesn’t stop China from intervening in the foreign exchange market.
47
The US trade deficit as a share of GDP has narrowed over the last ten years.
Mr. Trump’s policies are likely to set the trade deficit back on a deteriorating path.
• Plans for fiscal expansion: – massive tax cuts – and spending increases
• including military and infrastructure investment.
• It is hard to predict the carryover from campaign statements to actual policies. – But Congress is likely to support this sort of fiscal expansion. – It would repeat what Ronald Reagan and George W. Bush did.
• The budget deficit would reduce national savings, which would worsen the current account deficit. – An example of the “twin deficits” we saw under Reagan & Bush.
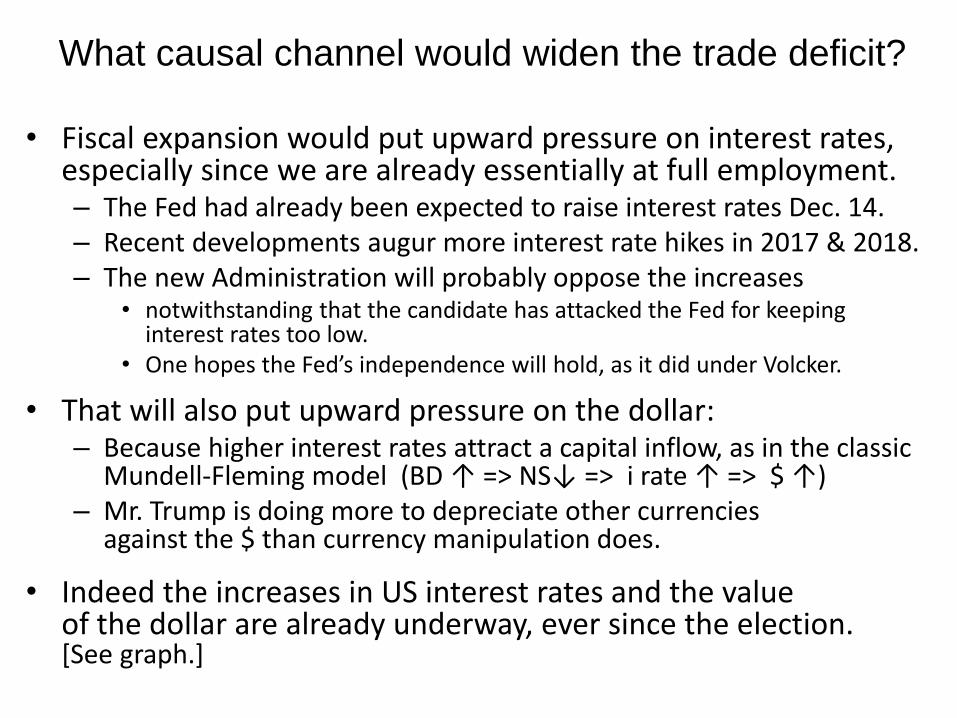
What causal channel would widen the trade deficit?
• Fiscal expansion would put upward pressure on interest rates, especially since we are already essentially at full employment. – The Fed had already been expected to raise interest rates Dec. 14. – Recent developments augur more interest rate hikes in 2017 & 2018. – The new Administration will probably oppose the increases
• notwithstanding that the candidate has attacked the Fed for keeping interest rates too low.
• One hopes the Fed’s independence will hold, as it did under Volcker.
• That will also put upward pressure on the dollar: – Because higher interest rates attract a capital inflow, as in the classic
Mundell-Fleming model (BD ↑ => NS↓ => i rate ↑ => $ ↑) – Mr. Trump is doing more to depreciate other currencies
against the $ than currency manipulation does.
• Indeed the increases in US interest rates and the value of the dollar are already underway, ever since the election. [See graph.]
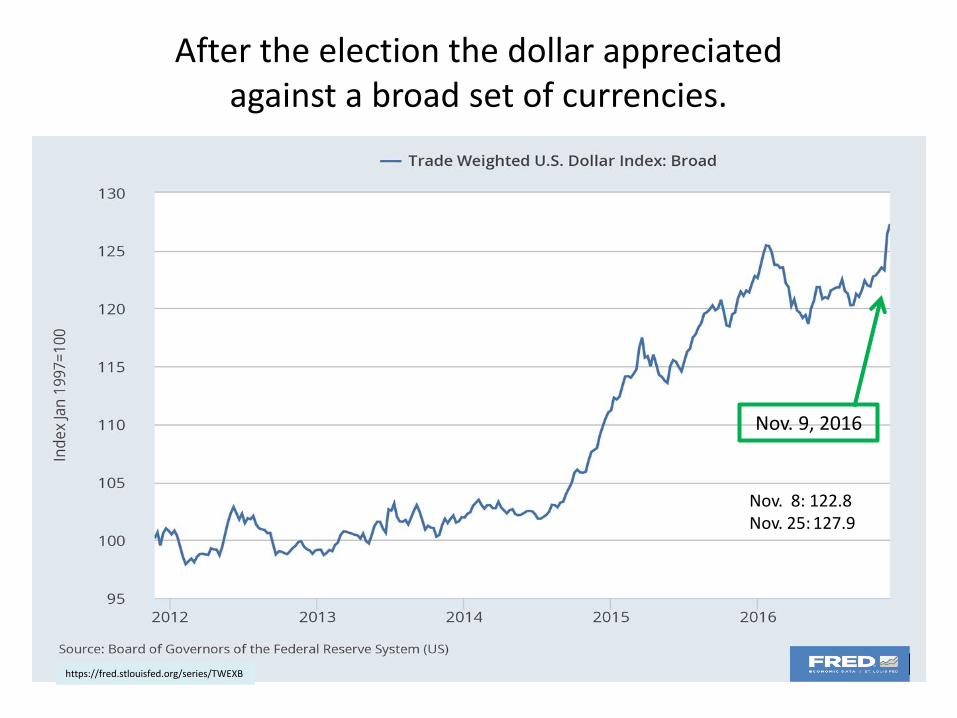
After the election the dollar appreciated against a broad set of currencies.
https://fred.stlouisfed.org/series/TWEXB
Nov. 9, 2016
Nov. 8: 122.8 Nov. 25: 127.9
Appendix 8: The argument for TPP
• As with most previous trade agreements, the net economic effect is positive, on both sides.
• Specific examples of American sectors that are likely to gain exports are in: – Agriculture
-- dairy to Canada, poultry to Vietnam; beef, pork, soy & wine to Japan.
– Services – engineering, education, software, express delivery services…
– Manufactures – ICT hardware (& autos, machinery…)
51
Overview of other aspects of TPP
• TPP differs from past agreements, as both supporters & detractors point out. – So-called “deep integration – Most prominently, it addresses:
• some areas of particular concern to the left, such as – the environment – and labor rights
• and some areas of particular concern to the right, such as – IPR – and investor-state dispute settlement.
– Of course TPP is politically unpopular, • in part, because many workers feel left behind by modern trends
– a valid point that we should discuss further.
– But, few critics know what is actually in the agreement. 52
Environmental (Chapter 20)
• Steps to help implement at the national level bans on trade in endangered wildlife – under CITES (Conventn. On Int. Trade in Endangered Species)
– but insufficiently enforced until now. – E.g., rhinos, elephants, tropical birds, and rare reptiles.
• Steps to protect the ocean environment from ship pollution.
• & to limit subsidies for fishing fleets, – which subsidize depletion of tuna, & swordfish…
• For the 1st time in a regional agreement, these provisions are subject to a dispute settlement process backed up by threat of trade penalties.
53
Labor practices (Chapter 19)
– Including steps to promote union rights in Vietnam
• allowing independent labor unions for the first time
• VN agreed bilaterally to make labor regulations consistent with the US, or forfeit tariff concessions on clothing & textiles.
– As with enviro, dispute settlement & trade penalty threat backs up commitment to labor provisions.
54
In two particular areas, critics were afraid that the final agreement would give too much to US
corporations such as tobacco & pharmaceuticals.
• This could have happened, given that Pres. Obama needed Republican votes for TPA. – But these industries did not get what they wanted.
• ISDS, e.g., – might have interfered unreasonably with countries’ anti-
smoking campaigns. – But, no. Australia is free to ban brand name logos on cig. packs.
• IPR, e.g., – TPP might have extended to other countries our 12-year
protection for data on new drugs from our pharma and bio-tech. companies.
– But, no, the most they get is 8 years in some countries • (5 years in others, with other measures).
55
Geopolitics
• If, as expected, the US Senate fails to ratify TPP, the Asian members will conclude that the US has lost interest in their region
– and perhaps has lost the capacity to lead globally.
• As a result, they will conclude they have no choice but to draw closer to China.
– It has already happened:
• AIIB
• RCEP…
56


![[PPT]Energy Economics – II Jeffrey Frankel Harpel Professor ... · Web viewEnergy Economics – III Jeffrey Frankel Harpel Professor, Harvard University ADA Summer School, Baku,](https://static.fdocuments.net/doc/165x107/5ab0cb237f8b9abc2f8bdb54/pptenergy-economics-ii-jeffrey-frankel-harpel-professor-viewenergy-economics.jpg)