The Number System (NS)
29
Eighth Grade Mathematics 2015 1 The Number System (NS) Standard I Can Statement Vocabulary Supplemental Resources Assessments Quarter Focus 8.NS.1. Understand informally that every number has a decimal expansion; the rational numbers are those with decimal expansions that terminate in 0s or eventually repeat. Know that other numbers are called irrational. Define and represent rational numbers Define and represent irrational numbers Recognize that all real numbers can be written in a decimal form Change rational and irrational numbers to Decimals Convert a decimal number (repeating/terminating) into a fraction Determine if a decimal number is rational or Irrational Recognize that a repeating/terminating decimal is a rational number Convert terminating and repeating decimals to Fractions Determine if a number is rational or irrational Distinguish between rational and irrational numbers** Rational number Repeating decimal Terminating decimal Chapter 1: Les. 1.1 & 1.10 8.NS.2. Use rational approximations of irrational numbers to Estimate irrational numbers 8.NS.2 Find the square roots of perfect squares Irrational numbers Real numbers Inquiry Lab 1-9 Les. 1.9 & 1.10
Transcript of The Number System (NS)

Eighth Grade Mathematics 2015
1
The Number System (NS)
Standard I Can Statement Vocabulary Supplemental
Resources Assessments
Quarter
Focus
8.NS.1. Understand informally that every number has a decimal expansion; the rational numbers are those with decimal expansions that terminate in 0s or eventually repeat. Know that other numbers are called irrational.
Define and represent rational numbers Define and represent irrational numbers Recognize that all real numbers can be written in a decimal form Change rational and irrational numbers to Decimals Convert a decimal number (repeating/terminating) into a fraction Determine if a decimal number is rational or Irrational Recognize that a repeating/terminating decimal is a rational number Convert terminating and repeating decimals to Fractions Determine if a number is rational or irrational Distinguish between rational and irrational numbers**
Rational number
Repeating decimal
Terminating decimal
Chapter 1: Les. 1.1 & 1.10
8.NS.2. Use rational approximations of irrational numbers to
Estimate irrational numbers 8.NS.2 Find the square roots of perfect squares
Irrational numbers
Real numbers
Inquiry Lab 1-9
Les. 1.9 & 1.10

Eighth Grade Mathematics 2015
2
The Number System (NS)
Standard I Can Statement Vocabulary Supplemental
Resources Assessments
Quarter
Focus
compare the size of irrational numbers, locate them approximately on a number line diagram, and estimate the value of expressions (e.g., π2). For example, by truncating the decimal expansion of √2, show that √2 is between 1and 2, then between 1.4 and 1.5, and explain how to continue on to get better
Estimate the decimal for a square root Locate rational numbers on a number line Locate irrational numbers on a number line Locate the approximate location of irrational numbers on a number line based on perfect squares Construct a number line that includes rational and irrational numbers Compare and contrast irrational numbers identifying larger vs. smaller numbers Recognize if a number is rounded or repeats when using a calculator Determine which number is bigger when given any set of numbers written in any form

Eighth Grade Mathematics 2015
3
Expressions & Equations (EE)
Standard I Can Statement Vocabulary Supplemental
Resources Assessments
Quarter
Focus
8.EE.1. Know and apply the properties of integer exponents to generate equivalent numerical expressions. For
example, 32 X 3−5
= 3−3=1/33=1/27
Recognize integers Add and subtract integers Multiply and divide integers Recognize exponents Fluently read exponents Read equivalent expressions with exponents Generate equivalent expressions with Exponents Identify the laws of exponents including multiplication, division, power of a power, and zero exponents Apply the laws of exponents when multiplying and dividing like and unlike bases Convert bases with negative exponents to Fractions Simplify algebraic expressions, involving zero Exponents Simplify algebraic expressions, involving negative exponents
Power
Base Exponent
Les. 1.2
Les. 1.3
Les 1.4
Chapter 1: Problem
Solving Investigation

Eighth Grade Mathematics 2015
4
Expressions & Equations (EE)
Standard I Can Statement Vocabulary Supplemental
Resources Assessments
Quarter
Focus
Simplify algebraic expressions, by applying the multiplication properties of exponents [exponents are added] Simplify algebraic expressions, by applying the power properties of exponents [exponents are multiplied] Simplify algebraic expressions, by applying the division properties of exponents [exponents are subtracted] Simplify algebraic expressions, using several properties
8.EE.2. Use square root and cube root symbols to represent solutions to equations of
the form 𝑥2 = p and 𝑥3 = p where p is a positive rational number. Evaluate square roots of small perfect squares and cube roots of small perfect cubes. Know that √2 is irrational.
Read perfect square numbers Read perfect cube numbers Define square and cube root Solve square root equations Solve cube roots equations Understand that non-perfect squares are Irrational Understand that non-perfect cubes are Irrational
Square root
Perfect Square
Radical sign
Cubed root
Perfect cube
Irrational number
Real number
Les. 1.8- 1.10
Les. 5.5-5.7
Eighth Grade Mathematics 2015
5
Expressions & Equations (EE)
Standard I Can Statement Vocabulary Supplemental
Resources Assessments
Quarter
Focus
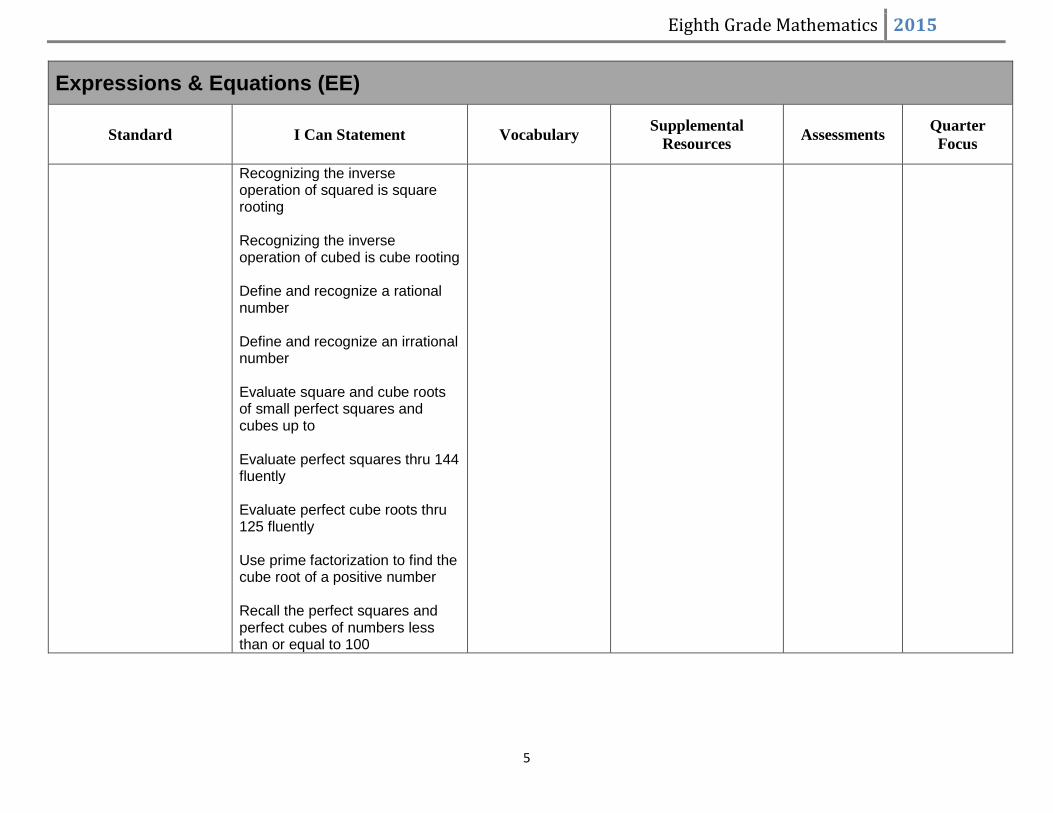
Recognizing the inverse operation of squared is square rooting Recognizing the inverse operation of cubed is cube rooting Define and recognize a rational number Define and recognize an irrational number Evaluate square and cube roots of small perfect squares and cubes up to Evaluate perfect squares thru 144 fluently Evaluate perfect cube roots thru 125 fluently Use prime factorization to find the cube root of a positive number Recall the perfect squares and perfect cubes of numbers less than or equal to 100
Eighth Grade Mathematics 2015
6
Expressions & Equations (EE)
Standard I Can Statement Vocabulary Supplemental
Resources Assessments
Quarter
Focus
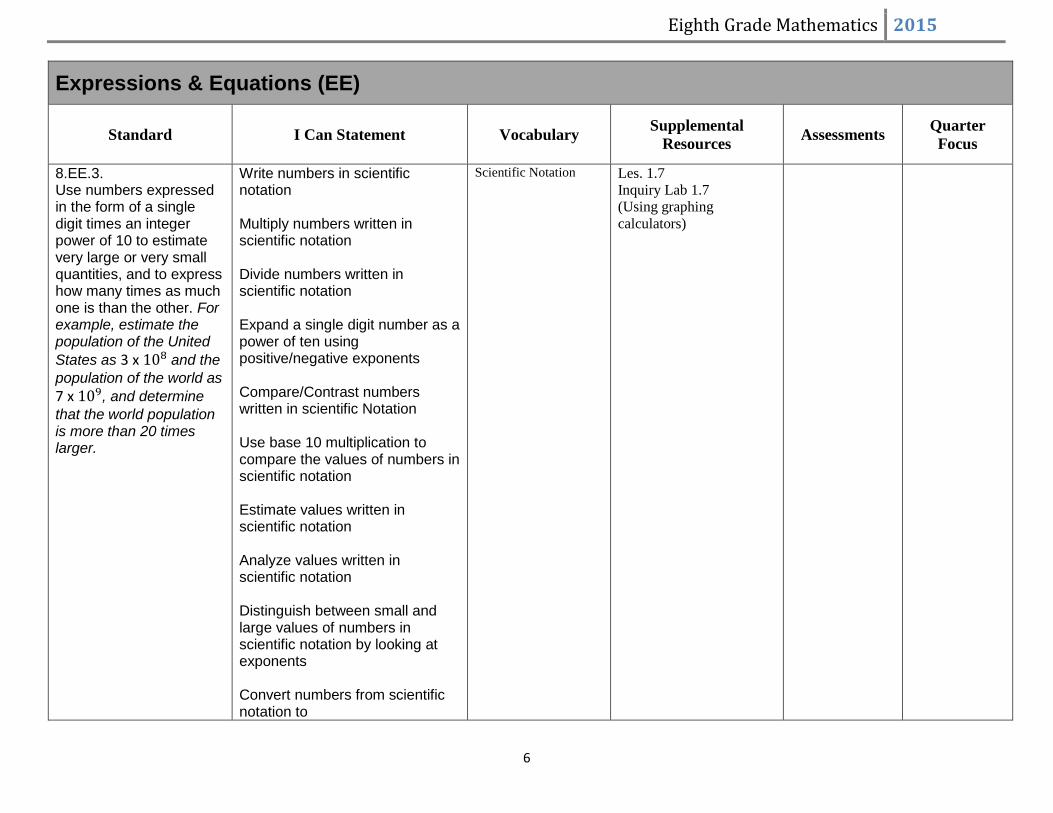
8.EE.3. Use numbers expressed in the form of a single digit times an integer power of 10 to estimate very large or very small quantities, and to express how many times as much one is than the other. For example, estimate the population of the United
States as 3 x 10⁸ and the
population of the world as
7 x 10⁹, and determine
that the world population is more than 20 times larger.
Write numbers in scientific notation Multiply numbers written in scientific notation Divide numbers written in scientific notation Expand a single digit number as a power of ten using positive/negative exponents Compare/Contrast numbers written in scientific Notation Use base 10 multiplication to compare the values of numbers in scientific notation Estimate values written in scientific notation Analyze values written in scientific notation Distinguish between small and large values of numbers in scientific notation by looking at exponents Convert numbers from scientific notation to
Scientific Notation Les. 1.7
Inquiry Lab 1.7
(Using graphing
calculators)

Eighth Grade Mathematics 2015
7
Expressions & Equations (EE)
Standard I Can Statement Vocabulary Supplemental
Resources Assessments
Quarter
Focus
8.EE.4. Perform operations with numbers expressed in scientific notation, including problems where both decimal and scientific notation are used. Use scientific notation and choose units of appropriate size for measurements of very large or very small quantities (e.g., use millimeters per year for seafloor spreading). Interpret scientific notation that has been generated by technology.
Multiply numbers written in scientific notation using the laws of exponents Divide numbers written in scientific notation using the laws of exponents Interpret real-life situations using scientific Notations Demonstrate knowledge of scientific notation by using a calculator or other form of technology to solve problems
Scientific Notation Les. 1.6-1.7
8.EE.5. Graph proportional relationships, interpreting the unit rate as the slope of the graph. Compare two different proportional relationships represented in different ways. For example, compare a distance-time graph to a distance-time equation to determine which of two moving objects has greater speed.
Identify slope is unit rate Interpret the unit rate of a graph as the slope of a line Compare the unit rate of a line and of an equation ** Determine the slope of an equation Determine the slope of a graph Compare the slopes of 2 equations
Linear Relationship
Constant rate of change
Slope
Rise/Run
Direct variation
Constant of variation
Constant of
proportionality
Les. 3.1
Les. 3.3

Eighth Grade Mathematics 2015
8
Expressions & Equations (EE)
Standard I Can Statement Vocabulary Supplemental
Resources Assessments
Quarter
Focus
Compare the slopes of 2 graphs Compare the slope of an equation to the slope of a graph Determine which slope is the steepest Determine which slope is closest to being Horizontal Analyze graphs, tables, and equations and explain what is being represented Graph by hand and by calculator data illustrating slope as the unit rate Compare and contrast proportional relationships from a graph, table, or description
8.EE.6. Use similar triangles to explain why the slope m is the same between any two distinct points on a non-vertical line in the coordinate plane; derive the equation y =mx for a line through the origin and the equation y = mx + b for a line intercepting the vertical axis at b.
Explain why triangles are similar Determine the slope between two points Determine the slope between two points on a coordinate plane Determine the slope, looking at a graph
Direct variation
Constant of variation
Constant of
proportionality
y-intercept
Slope-intercept form
Les. 3.3
Les. 3.4
Les. 7.6

Eighth Grade Mathematics 2015
9
Expressions & Equations (EE)
Standard I Can Statement Vocabulary Supplemental
Resources Assessments
Quarter
Focus
Determine the y-intercept, looking at a graph Write the slope-intercept form of an equation of a line, looking at a graph Construct a right triangle using two points on a non-vertical line ** Compare the sides by counting units to understand the slope of a non-vertical line is rise to run Identify m as the slope of a line and b as the point where the line intercepts the vertical axis (y intercept) Construct an equation using the slope m and the y-intercept b in the form of y=mx + b Justify why the slope is the same between any two points on a non-vertical line Identify that the slope is the same between any two points on a line based on the proportional relationship of m=y/x
8.EE.7 Solve linear equations in one variable.
See next page Les. 2.1-2.5
Eighth Grade Mathematics 2015
10
Expressions & Equations (EE)
Standard I Can Statement Vocabulary Supplemental
Resources Assessments
Quarter
Focus
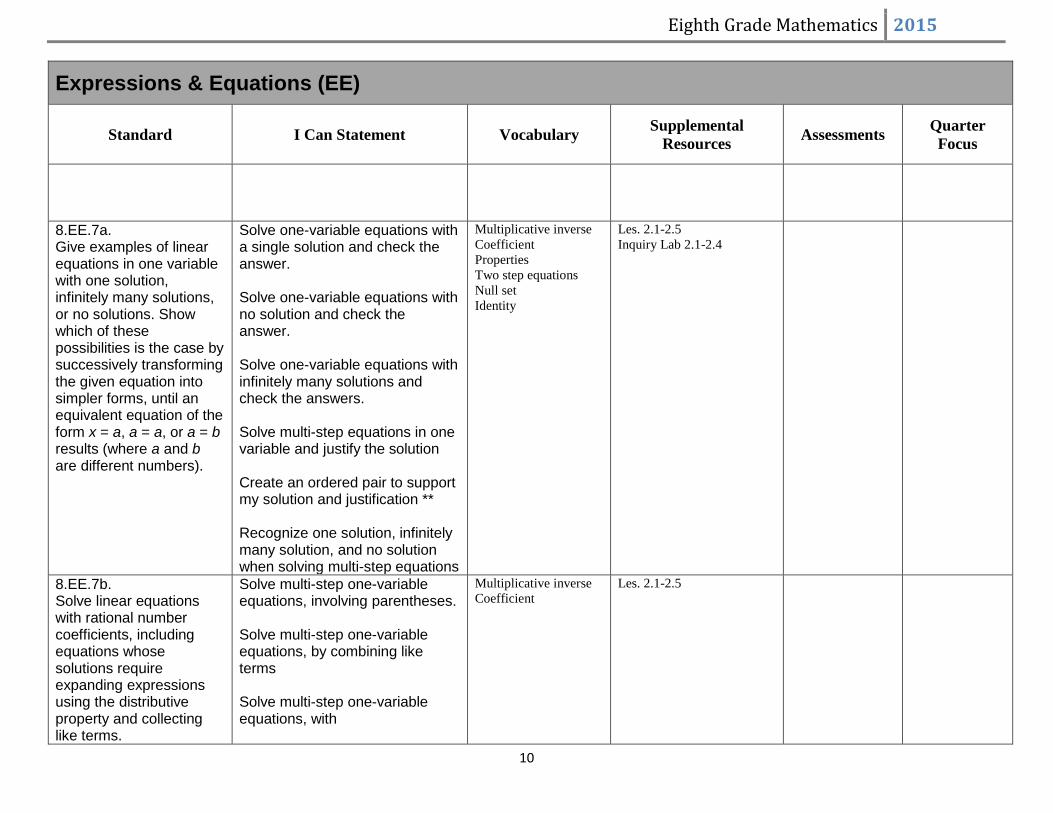
8.EE.7a. Give examples of linear equations in one variable with one solution, infinitely many solutions, or no solutions. Show which of these possibilities is the case by successively transforming the given equation into simpler forms, until an equivalent equation of the form x = a, a = a, or a = b results (where a and b are different numbers).
Solve one-variable equations with a single solution and check the answer. Solve one-variable equations with no solution and check the answer. Solve one-variable equations with infinitely many solutions and check the answers. Solve multi-step equations in one variable and justify the solution Create an ordered pair to support my solution and justification ** Recognize one solution, infinitely many solution, and no solution when solving multi-step equations
Multiplicative inverse
Coefficient
Properties
Two step equations
Null set
Identity
Les. 2.1-2.5
Inquiry Lab 2.1-2.4
8.EE.7b. Solve linear equations with rational number coefficients, including equations whose solutions require expanding expressions using the distributive property and collecting like terms.
Solve multi-step one-variable equations, involving parentheses. Solve multi-step one-variable equations, by combining like terms Solve multi-step one-variable equations, with
Multiplicative inverse
Coefficient
Les. 2.1-2.5

Eighth Grade Mathematics 2015
11
Expressions & Equations (EE)
Standard I Can Statement Vocabulary Supplemental
Resources Assessments
Quarter
Focus
8.EE.8. Analyze and solve pairs of simultaneous linear equations
See next page Chapter 3-Problem Solving
Investigation
Les. 3.7-3.8
Eighth Grade Mathematics 2015
12
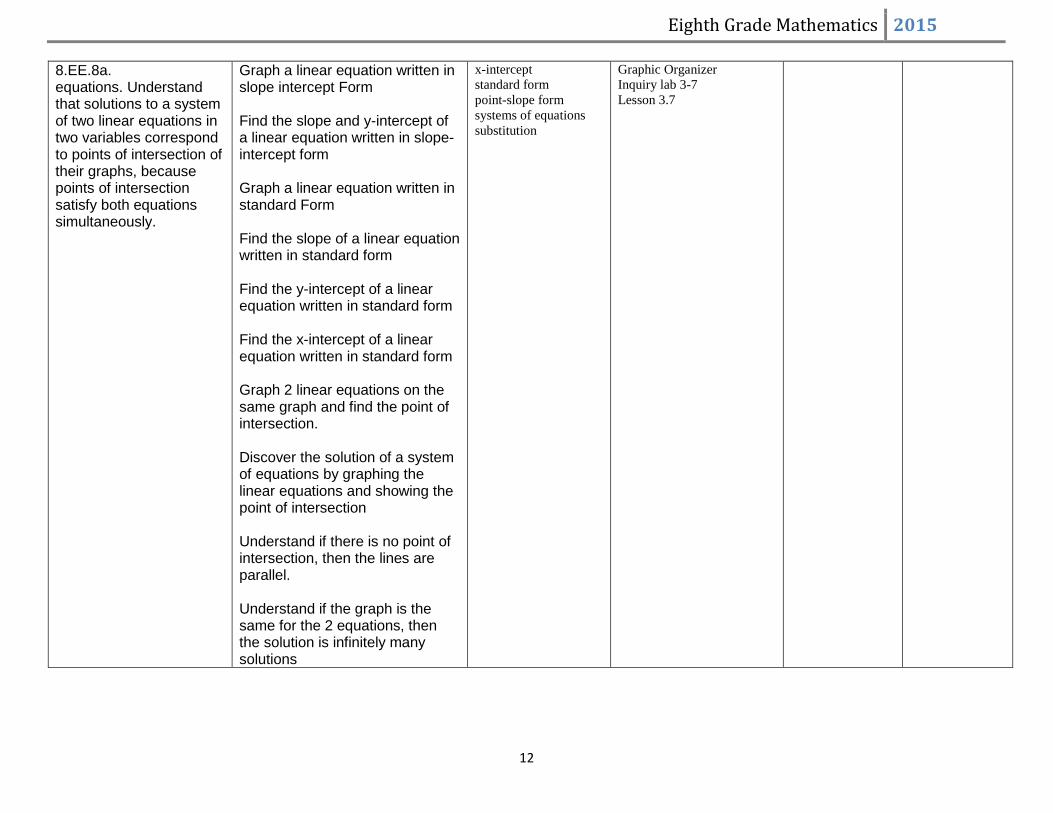
8.EE.8a. equations. Understand that solutions to a system of two linear equations in two variables correspond to points of intersection of their graphs, because points of intersection satisfy both equations simultaneously.
Graph a linear equation written in slope intercept Form Find the slope and y-intercept of a linear equation written in slope-intercept form Graph a linear equation written in standard Form Find the slope of a linear equation written in standard form Find the y-intercept of a linear equation written in standard form Find the x-intercept of a linear equation written in standard form Graph 2 linear equations on the same graph and find the point of intersection. Discover the solution of a system of equations by graphing the linear equations and showing the point of intersection Understand if there is no point of intersection, then the lines are parallel. Understand if the graph is the same for the 2 equations, then the solution is infinitely many solutions
x-intercept
standard form
point-slope form
systems of equations
substitution
Graphic Organizer
Inquiry lab 3-7
Lesson 3.7

Eighth Grade Mathematics 2015
13
Expressions & Equations (EE)
Standard I Can Statement Vocabulary Supplemental
Resources Assessments
Quarter
Focus
8.EE.8b. Solve systems of two linear equations in two variables algebraically, and estimate solutions by graphing the equations. Solve simple cases by inspection. For example, 3x + 2y = 5 and 3x +2y = 6 have no solution because 3x + 2y cannot simultaneously be 5 and 6.
Solve a system of equations by substitution, involving 1 solution. Solve a system of equations by substitution, involving no solution [parallel lines] Solve a system of equations by substitution, involving infinitely many solutions [same line] Solve a system of equations by elimination, involving 1 solution. Solve a system of equations by elimination, involving no solution [parallel lines] Solve a system of equations by elimination, involving infinitely many solutions [same line] Estimate solutions through simple inspection Distinguish between one solution, no solution, and infinitely many solution by graphing a system of equations Rearrange linear equations from slope intercept form to standard form and vice versa
x-intercept
standard form
point-slope form
systems of equations
substitution
Lesson 3.7
Lesson 3.8

Eighth Grade Mathematics 2015
14
Expressions & Equations (EE)
Standard I Can Statement Vocabulary Supplemental
Resources Assessments
Quarter
Focus
8.EE.8c Solve real-world and mathematical problems leading to two linear equations in two variables. For example, given coordinates for two pairs of points, determine whether the line through the first pair of points intersects the line through the second pair.
Solve word problems by writing 2 linear equations and solving the system. Explain how the point of intersection represents 2 linear equations Examine real-world problems and extract linear systems of equations Decide which method to use when solving systems of linear equations in real-world situations
x-intercept
standard form
point-slope form
systems of equations
substitution
Lesson 3.7
Lesson 3.8

Eighth Grade Mathematics 2015
15
Functions (F)
8.F.1. Understand that a function is a rule that assigns to each input exactly one output The graph of a function is the set of ordered pairs consisting of an input and the corresponding output.1
Define function Identify the domain and range of a relation Determine if a set of points is a function Identify functions from an equation Graph a set of points Determine if a graph is a function Calculate the y-value for an equation when given the x-value Calculate the x-value for an equation when given the y-value Create a table for an equation Determine if a table is a function Determine if an equation is a function by looking at it Represent a function in the form of ordered pairs, mapping, graph, listing
Functions
Linear Equation
Inquiry Lab 4.3
Lessons 4.3, 4.4, 4.7
8.F.2. Compare properties of two functions each represented in a different way (algebraically, graphically, numerically in tables, or by verbal
Find the slope of a graph Find the slope of a table Find the slope of an equation
Direct variation
Constant of variation
Constant of
proportionality
Lesson 3.3
Lesson 4.5

Eighth Grade Mathematics 2015
16
descriptions). For example, given a linear function represented by a table of values and a linear function represented by an algebraic expression, determine which function has the greater rate of change.
Compare and explain slopes [unit rate] Identify properties of a function Compare/contrast two functions with the same representation (graphically, numerically, verbally) Compare/contrast two functions with different Representations Compare functions represented in different forms to determine which has the greater rate change (slope) **
8.F.3. Interpret the equation y = mx + b as defining a linear function, whose graph is a straight line; give examples of functions that are not linear. For example, the function A = s2 giving the area of a square as a function of its side length is not linear because its graph contains the points (1,1), (2,4) and (3,9), which are not on a straight line.
Explain the slope-intercept form of an equation Identify that non-linear is not straight Use equations to categorize functions as linear or non-linear Use graphs to categorize functions as linear or non-linear Use tables to categorize functions as
y-intercept
slope intercept form
linear function
continuous data
discrete data
Lesson 3.4
Lesson 4.4
Lesson 4.7 and 4.8
Inquiry Lab 4.8

Eighth Grade Mathematics 2015
17
8.F.4. Construct a function to model a linear relationship between two quantities. Determine the rate of change and initial value of the function from a description of a relationship or from two (x, y) values, including reading these from a table or from a graph. Interpret the rate of change and initial value of a linear function in terms of the situation it models, and in terms of its graph or a table of values.
Identify the slope and y-intercept from a graph Identify the slope and y-intercept from a table 8Identify the slope and y-intercept given an Equation Understand that the y-intercept is the initial value of a function Construct an equation from a verbal expression Write an equation given the slope of a line and a point on the line Write an equation given two points on a line Interpret the rate of change (slope) and the y intercept given real-world situations Model the rate of change and the y-intercept given real-world situations
y-intercept
slope intercept form
linear function
continuous data
discrete data
constant of variation
constant of
proportionality
y-intercept
slope intercept form
x-intercept
standard form
Lesson 3.3 and 3.4
Inquiry lab 3.6
Lesson 4.1
Lesson 4.3-4.6
Eighth Grade Mathematics 2015
18
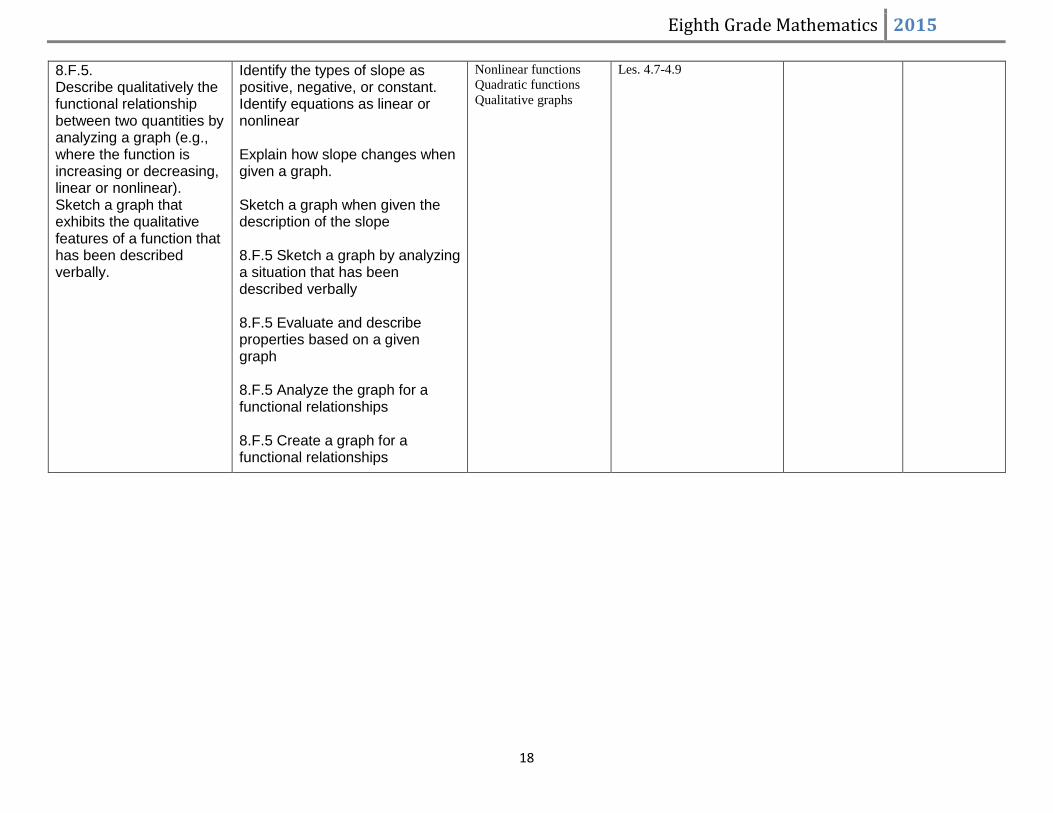
8.F.5. Describe qualitatively the functional relationship between two quantities by analyzing a graph (e.g., where the function is increasing or decreasing, linear or nonlinear). Sketch a graph that exhibits the qualitative features of a function that has been described verbally.
Identify the types of slope as positive, negative, or constant. Identify equations as linear or nonlinear Explain how slope changes when given a graph. Sketch a graph when given the description of the slope 8.F.5 Sketch a graph by analyzing a situation that has been described verbally 8.F.5 Evaluate and describe properties based on a given graph 8.F.5 Analyze the graph for a functional relationships 8.F.5 Create a graph for a functional relationships
Nonlinear functions
Quadratic functions
Qualitative graphs
Les. 4.7-4.9
Eighth Grade Mathematics 2015
19
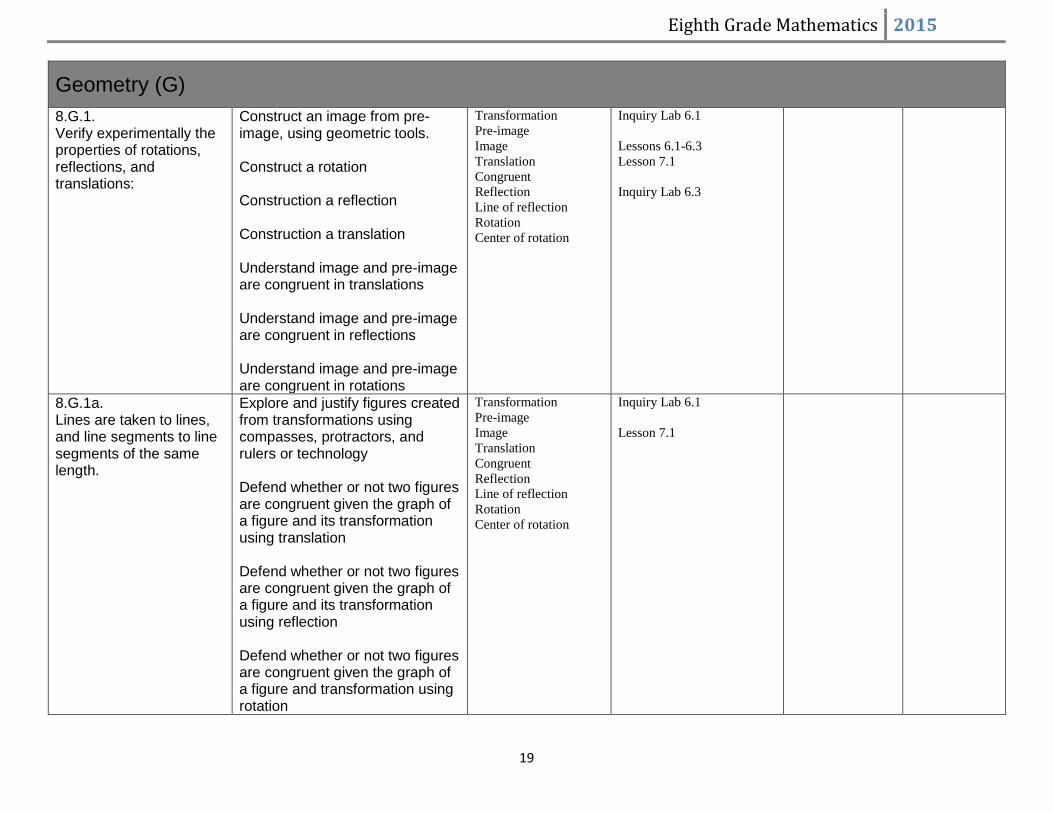
Geometry (G)
8.G.1. Verify experimentally the properties of rotations, reflections, and translations:
Construct an image from pre-image, using geometric tools. Construct a rotation Construction a reflection Construction a translation Understand image and pre-image are congruent in translations Understand image and pre-image are congruent in reflections Understand image and pre-image are congruent in rotations
Transformation
Pre-image
Image
Translation
Congruent
Reflection
Line of reflection
Rotation
Center of rotation
Inquiry Lab 6.1
Lessons 6.1-6.3
Lesson 7.1
Inquiry Lab 6.3
8.G.1a. Lines are taken to lines, and line segments to line segments of the same length.
Explore and justify figures created from transformations using compasses, protractors, and rulers or technology Defend whether or not two figures are congruent given the graph of a figure and its transformation using translation Defend whether or not two figures are congruent given the graph of a figure and its transformation using reflection Defend whether or not two figures are congruent given the graph of a figure and transformation using rotation
Transformation
Pre-image
Image
Translation
Congruent
Reflection
Line of reflection
Rotation
Center of rotation
Inquiry Lab 6.1
Lesson 7.1

Eighth Grade Mathematics 2015
20
8.G.1b. Angles are taken to angles of the same measure.
Defend whether or not two figures are congruent given the graph of a figure and its transformation using translation Defend whether or not two figures are congruent given the graph of a figure and its transformation using reflection Defend whether or not two figures are congruent given the graph of a figure and transformation using rotation
No new vocab Inquiry Lab 6.1
Lesson 7.1
8.G.1c Parallel lines are taken to parallel lines
Recognize the angles formed by two parallel lines and a transversal Justify why angles(formed by parallel lines and a transversal) are congruent using angle relationships
Only touched on in Inquiry
Lab 6.1
8.G.2. Understand that a two-dimensional figure is congruent to another if the second can be obtained from the first by a sequence of rotations, reflections, and translations; given two congruent figures, describe a sequence that exhibits the congruence between them
Determine if two figures are congruent by identifying the transformation used to produce the figures Write congruent statements . Recognize the congruent symbol Define congruent Write statements that justify the process of transformation as well as the conclusion Describe the sequence of transformations from one figure to another
Corresponding parts
≈ (is congruent to
symbol)
Lesson 7.1 & 7.2

Eighth Grade Mathematics 2015
21
8.G.3 Describe the effect of dilations, translations rotations, and reflections on two dimensional figures using coordinates.
Identify the new coordinates of a translation Identify the new coordinates of a reflection Identify the new coordinates of a rotation Identify the new coordinates of a dilation Understand image and pre-image are similar in Dilations Given two similar figures describe the sequence of rotations, reflections, translations, and dilations Create a figure congruent to a given figure by applying knowledge of translation Create a figure congruent to a given figure by applying knowledge of reflection Create a figure congruent to a given figure by applying my knowledge of rotation(90, 180, 270 degrees) both clockwise and counterclockwise
Transformation
Pre-image
Image
Translation
Congruent
Reflection
Line of reflection
Rotation
Center of rotation
Dilation
Center of dilation
Scale factor
Lessons 6.1-6.4
8.G.4. Understand that a two-dimensional figure is similar to another if the second can be obtained from the first by a sequence of rotations,
Comprehend that the angles of similar figures are congruent and the sides of similar figures are proportional Produce similar figures from dilations using scale factors
Similar
Similar polygons
Scale factor
Inquiry Lab 6.4
Les. 7.3- 7.4
Eighth Grade Mathematics 2015
22
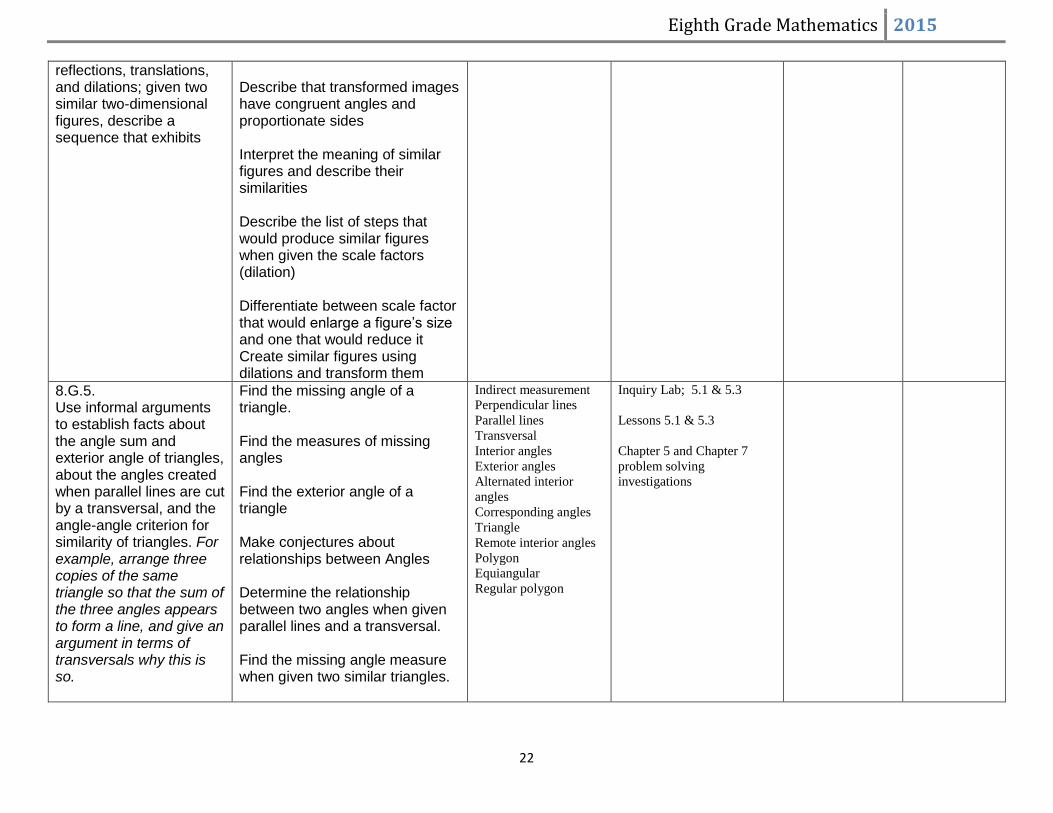
reflections, translations, and dilations; given two similar two-dimensional figures, describe a sequence that exhibits
Describe that transformed images have congruent angles and proportionate sides Interpret the meaning of similar figures and describe their similarities Describe the list of steps that would produce similar figures when given the scale factors (dilation) Differentiate between scale factor that would enlarge a figure’s size and one that would reduce it Create similar figures using dilations and transform them
8.G.5. Use informal arguments to establish facts about the angle sum and exterior angle of triangles, about the angles created when parallel lines are cut by a transversal, and the angle-angle criterion for similarity of triangles. For example, arrange three copies of the same triangle so that the sum of the three angles appears to form a line, and give an argument in terms of transversals why this is so.
Find the missing angle of a triangle. Find the measures of missing angles Find the exterior angle of a triangle Make conjectures about relationships between Angles Determine the relationship between two angles when given parallel lines and a transversal. Find the missing angle measure when given two similar triangles.
Indirect measurement
Perpendicular lines
Parallel lines
Transversal
Interior angles
Exterior angles
Alternated interior
angles
Corresponding angles
Triangle
Remote interior angles
Polygon
Equiangular
Regular polygon
Inquiry Lab; 5.1 & 5.3
Lessons 5.1 & 5.3
Chapter 5 and Chapter 7
problem solving
investigations

Eighth Grade Mathematics 2015
23
Construct various triangles and find the measures of interior and exterior angles Explore and justify relationships that exist between angle sums and exterior angle sums of triangles Explore and justify relationships that exist between angles created when parallel lines are cut by a transversal Explore and justify relationships that exist between the angle – angle criterion for similarity of triangles Construct various triangles and find measures of the interior and exterior angles Form a hypothesis about the relationship between the measure of an exterior angle and the other two angles of a triangle Apply my knowledge of angle relationships to find the measure of missing angles Construct parallel lines and transversal to examine the relationships between created angles Apply my knowledge of vertical, adjacent, and supplementary

Eighth Grade Mathematics 2015
24
angles to identify other pairs of congruent angles Construct triangles having line segments of different lengths but with two corresponding congruent angles Compare ratios of sides to find a constant scale factor of similar triangles
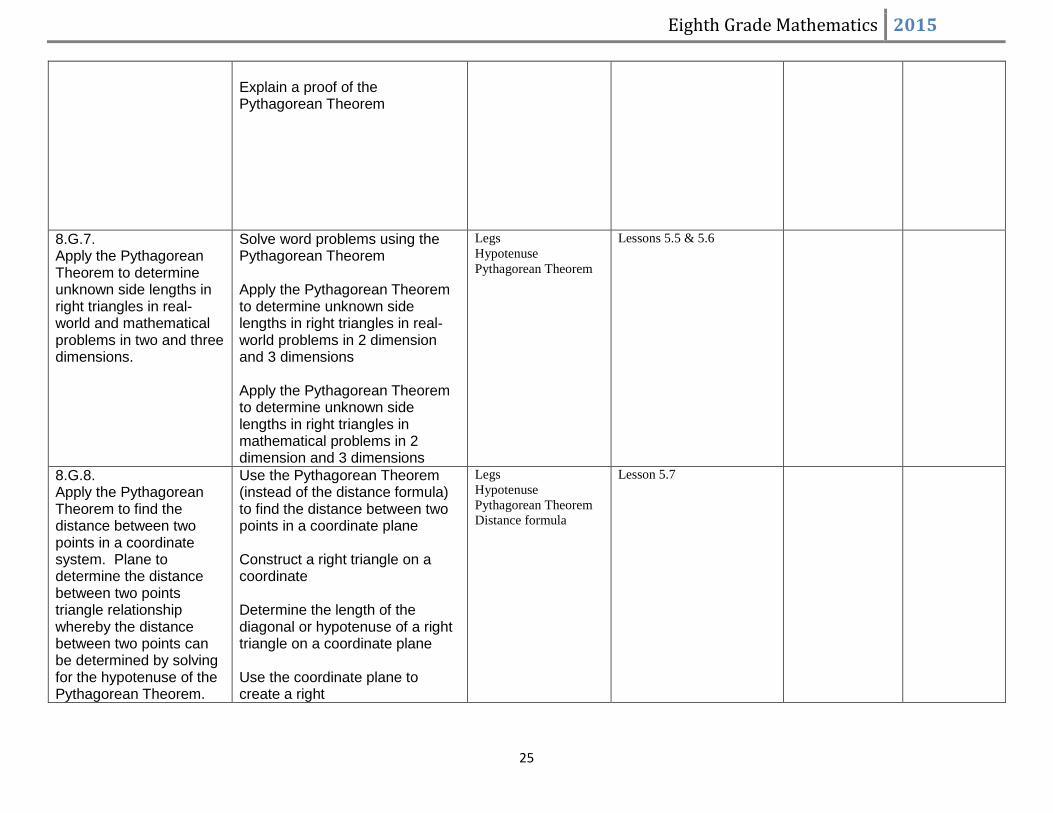
8.G.6. Explain a proof of the Pythagorean Theorem and its converse.
Understand the Pythagorean Theorem Use the Pythagorean Theorem to find the missing side of a right triangle. Use the Pythagorean Theorem to determine if three length measurements form a right triangle Identify the parts of a right triangle (legs and hypotenuse) Recognize the diagonal of a parallelogram with right angles as the hypotenuse of the right triangles formed Verify the Pythagorean Theorem by examining the area of squares coming off of each side of the right triangle Determine if a triangle is a right triangle by using the Pythagorean Theorem Identify Pythagorean triples
Legs
Hypotenuse
Pythagorean Theorem
Lessons 5.5 & 5.6
Eighth Grade Mathematics 2015
25
Explain a proof of the Pythagorean Theorem
8.G.7. Apply the Pythagorean Theorem to determine unknown side lengths in right triangles in real-world and mathematical problems in two and three dimensions.
Solve word problems using the Pythagorean Theorem Apply the Pythagorean Theorem to determine unknown side lengths in right triangles in real-world problems in 2 dimension and 3 dimensions Apply the Pythagorean Theorem to determine unknown side lengths in right triangles in mathematical problems in 2 dimension and 3 dimensions
Legs
Hypotenuse
Pythagorean Theorem
Lessons 5.5 & 5.6
8.G.8. Apply the Pythagorean Theorem to find the distance between two points in a coordinate system. Plane to determine the distance between two points triangle relationship whereby the distance between two points can be determined by solving for the hypotenuse of the Pythagorean Theorem.
Use the Pythagorean Theorem (instead of the distance formula) to find the distance between two points in a coordinate plane Construct a right triangle on a coordinate Determine the length of the diagonal or hypotenuse of a right triangle on a coordinate plane Use the coordinate plane to create a right
Legs
Hypotenuse
Pythagorean Theorem
Distance formula
Lesson 5.7
Eighth Grade Mathematics 2015
26
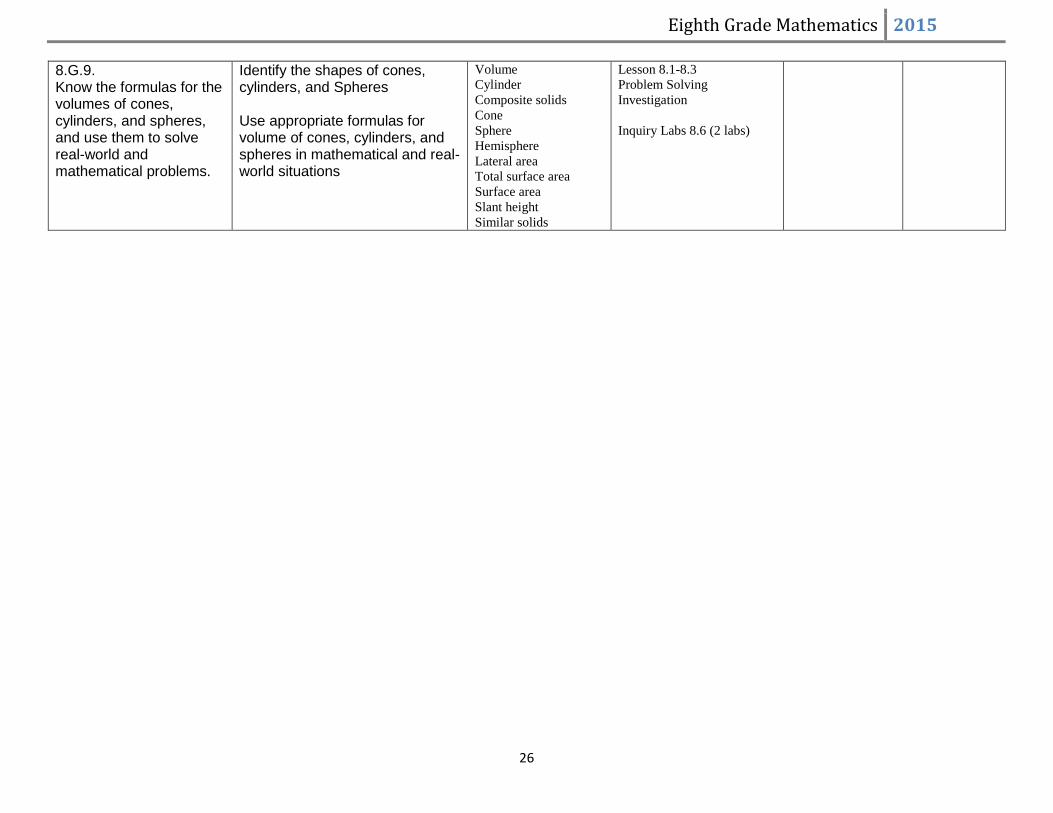
8.G.9. Know the formulas for the volumes of cones, cylinders, and spheres, and use them to solve real-world and mathematical problems.
Identify the shapes of cones, cylinders, and Spheres Use appropriate formulas for volume of cones, cylinders, and spheres in mathematical and real-world situations
Volume
Cylinder
Composite solids
Cone
Sphere
Hemisphere
Lateral area
Total surface area
Surface area
Slant height
Similar solids
Lesson 8.1-8.3
Problem Solving
Investigation
Inquiry Labs 8.6 (2 labs)

Eighth Grade Mathematics 2015
27
8.SP.1. Construct and interpret scatter plots for bivariate measurement data to investigate patterns of association between two quantities. Describe patterns such as clustering, outliers, positive or negative association, linear association, and nonlinear association
Graph a set of points Interpret scatter plot as linear or nonlinear Interpret scatter plot as positive, negative, constant, or no correlation. Interpret the graph as strong correlation (clustering) or weak (outliers) Construct a scatter plot on a plane using two Variables Investigate the relationship between two quantities on a scatter plot Predict future outcomes using a scatter plot Analyze the trend of a scatter plot and determine whether there is a positive, negative(linear), or no relationship(non-linear) Describe patterns in the data such as clustering and outliers r
Bivariate data
Scatter plot
Line of best fit
Inquiry Lab(s): Les. 9.1 &
9.2
Chapter 9-Les. 1 & 2
Problem solving
investigation
p.666-678
Eighth Grade Mathematics 2015
28
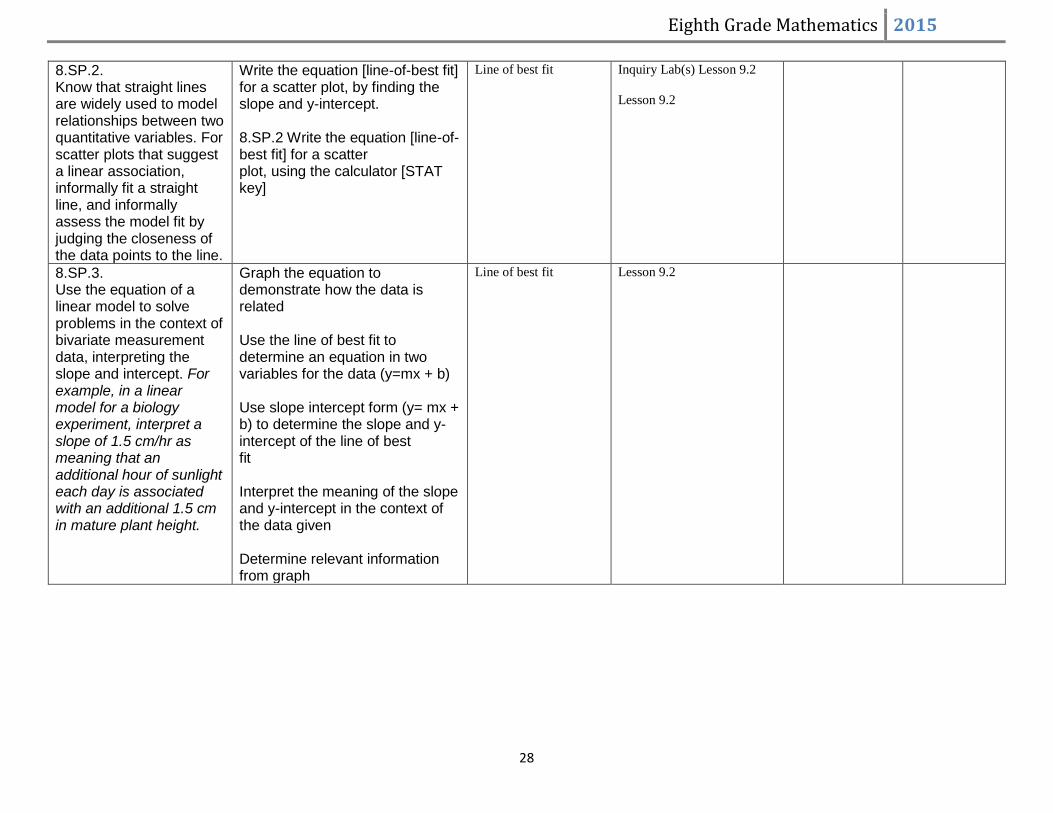
8.SP.2. Know that straight lines are widely used to model relationships between two quantitative variables. For scatter plots that suggest a linear association, informally fit a straight line, and informally assess the model fit by judging the closeness of the data points to the line.
Write the equation [line-of-best fit] for a scatter plot, by finding the slope and y-intercept. 8.SP.2 Write the equation [line-of-best fit] for a scatter plot, using the calculator [STAT key]
Line of best fit Inquiry Lab(s) Lesson 9.2
Lesson 9.2
8.SP.3. Use the equation of a linear model to solve problems in the context of bivariate measurement data, interpreting the slope and intercept. For example, in a linear model for a biology experiment, interpret a slope of 1.5 cm/hr as meaning that an additional hour of sunlight each day is associated with an additional 1.5 cm in mature plant height.
Graph the equation to demonstrate how the data is related Use the line of best fit to determine an equation in two variables for the data (y=mx + b) Use slope intercept form (y= mx + b) to determine the slope and y-intercept of the line of best fit Interpret the meaning of the slope and y-intercept in the context of the data given Determine relevant information from graph
Line of best fit Lesson 9.2

Eighth Grade Mathematics 2015
29
8.SP.4. Understand that patterns of association can also be seen in bivariate categorical data by displaying frequencies and relative frequencies in a two-way table. Construct and interpret a two-way table summarizing data on two categorical variables collected from the same subjects. Use relative frequencies calculated for rows or columns to describe possible association between the two variables. For example, collect data from students in your class on whether or not they have a curfew on school nights and whether or not they have assigned chores at home. Is there evidence that those who have a curfew also tend to have chores?
Determine if there is a correlation between the information Read a graph to determine a correlation Construct a graph based on information given Create a frequency table with collected data Interpret a frequency table Make predictions and analyze the data between the variables in the frequency table Justify and defend the accuracy of my predictions
Relative frequency
Two-way tables
Lesson 9.3