THE NECESSITY TO HAVE NATIONAL DRIFT CURVES:...
47
THE NECESSITY TO HAVE THE NECESSITY TO HAVE NATIONAL DRIFT CURVES: NATIONAL DRIFT CURVES: EXAMPLE OF DRIFT CURVES FOR EXAMPLE OF DRIFT CURVES FOR VINEYARDS IN NORTHERN ITALY VINEYARDS IN NORTHERN ITALY Paolo Paolo Balsari Balsari , Paolo , Paolo Marucco Marucco DEIAFA DEIAFA – – University of Torino University of Torino Italy Italy [email protected] [email protected]
Transcript of THE NECESSITY TO HAVE NATIONAL DRIFT CURVES:...
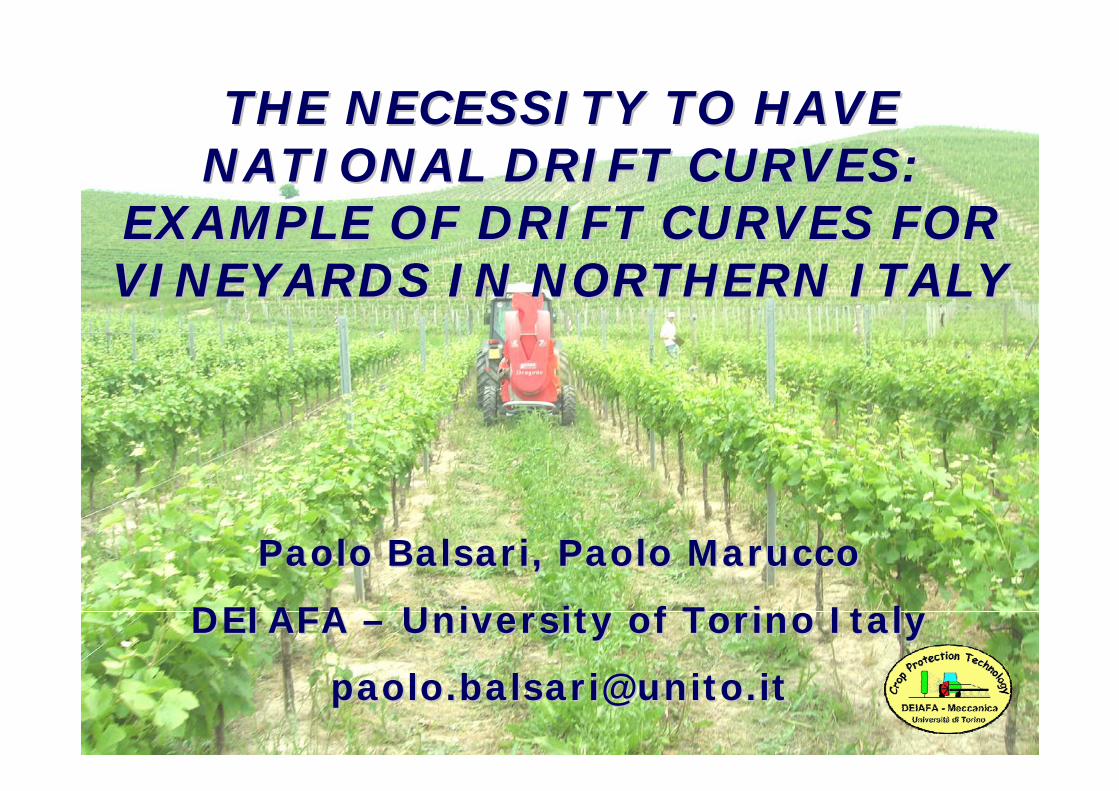
THE NECESSITY TO HAVE THE NECESSITY TO HAVE NATIONAL DRIFT CURVES: NATIONAL DRIFT CURVES:
EXAMPLE OF DRIFT CURVES FOR EXAMPLE OF DRIFT CURVES FOR VINEYARDS IN NORTHERN ITALYVINEYARDS IN NORTHERN ITALY
Paolo Paolo BalsariBalsari, Paolo , Paolo MaruccoMarucco
DEIAFA DEIAFA –– University of Torino University of Torino ItalyItaly
[email protected]@unito.it

at is drift?
finition according to ISO 22866 standard:
pray drift is the quantity of plant protection duct that is carried out of the sprayed ated) area by the action of air currents
INTRODUCTION

Spray drift assessment is more and more important
New EU Directive (128/2009 EC) on stainable use of pesticides is coming
into force
ecessity for all EU countries to adopt measures aimed at minimising
INTRODUCTION

INTRODUCTION
NVIRONMENTAL RISKS CONCERNING SPRAY NVIRONMENTAL RISKS CONCERNING SPRAY DRIFTDRIFT
ONTAMINATION OF SENSITIVE AREAS (e.g. atural parks, wetlands, etc.)
ONTAMINATION OF ADJACENT CROPS
ONTAMINATION OF WATER COURSES
ONTAMINATION OF URBAN AREAS
INTRODUCTION
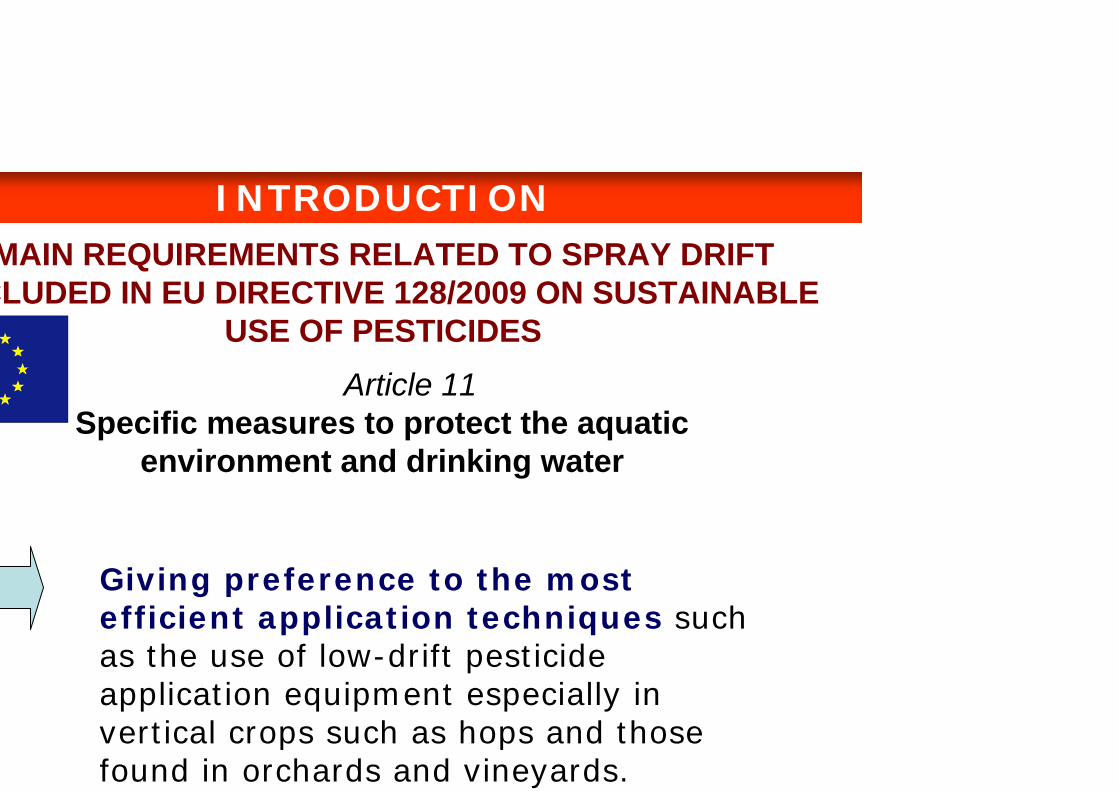
Article 11 Specific measures to protect the aquatic
environment and drinking water
MAIN REQUIREMENTS RELATED TO SPRAY DRIFTCLUDED IN EU DIRECTIVE 128/2009 ON SUSTAINABLE
USE OF PESTICIDES
Giving preference to the most efficient application techniques such as the use of low-drift pesticide application equipment especially in vertical crops such as hops and those found in orchards and vineyards.

INTRODUCTION
Article 11 Specific measures to protect the aquatic
environment and drinking water
MAIN REQUIREMENTS RELATED TO SPRAY DRIFTLUDED IN EU DIRECTIVE 128/2009 ON SUSTAINABLE
USE OF PESTICIDES
Use of mitigation measures which minimise the risk of off-site pollution caused by spray drift, drain-flow and run-off. These shall include the establishment of appropriately-sized buffer zones for the protection of non-target aquatic organisms and safeguard zones for surface and groundwater used for the abstraction of drinking water, where pesticides must not be

INTRODUCTION
EASURES TO PROTECT ENVIRONMENT FROM DRIFT
DIRECT
Reducing drift at source
Use of Spray Drift Reduction Technology
(SDRT)
• Application equipment
INDIRECT
Reducing exposure to drift
• Fixed buffer zones
No spray zones, buffer zonesNatural vegetative strips
Windbreaks, hail nets, etc.

INTRODUCTION
In several EU countries legislative measures are already in force establishing
buffer zone widths to be respected for reducing spray drift contamination risks
Sprayed crop
BUFFER ZONE
Sensitive area(or water course)
NOT SPRAYED
n metres

PPP full dose PPP half doseter coursewidth Nozzle type Nozzle type
S S
< 3 m 5 4 2 1 2 1 1 1
÷ 6 m 3 2 1 1 1 1 1 1
> 6 m 2 1 1 1 1 1 1 1
LERAP (UK)LERAP (UK)iteriaiteria forfor determinationdetermination of buffer of buffer zoneszones widthwidth (m), (m),
forfor fieldfield cropcrop sprayerssprayers
Standard
PLE

Up to now, most of the models adopted in Europe to define buffer zone widths are
based on Ganzelmeier drift curvestrapolated on the basis of hundreds of driftsts carried out in Germany by BBA (nowKI) in some typical contexts (arable crops, eyards, orchards, hops) according to ISO
22866 methodology.
THE PROBLEM
Are these reference drift curvest ti l f th S th
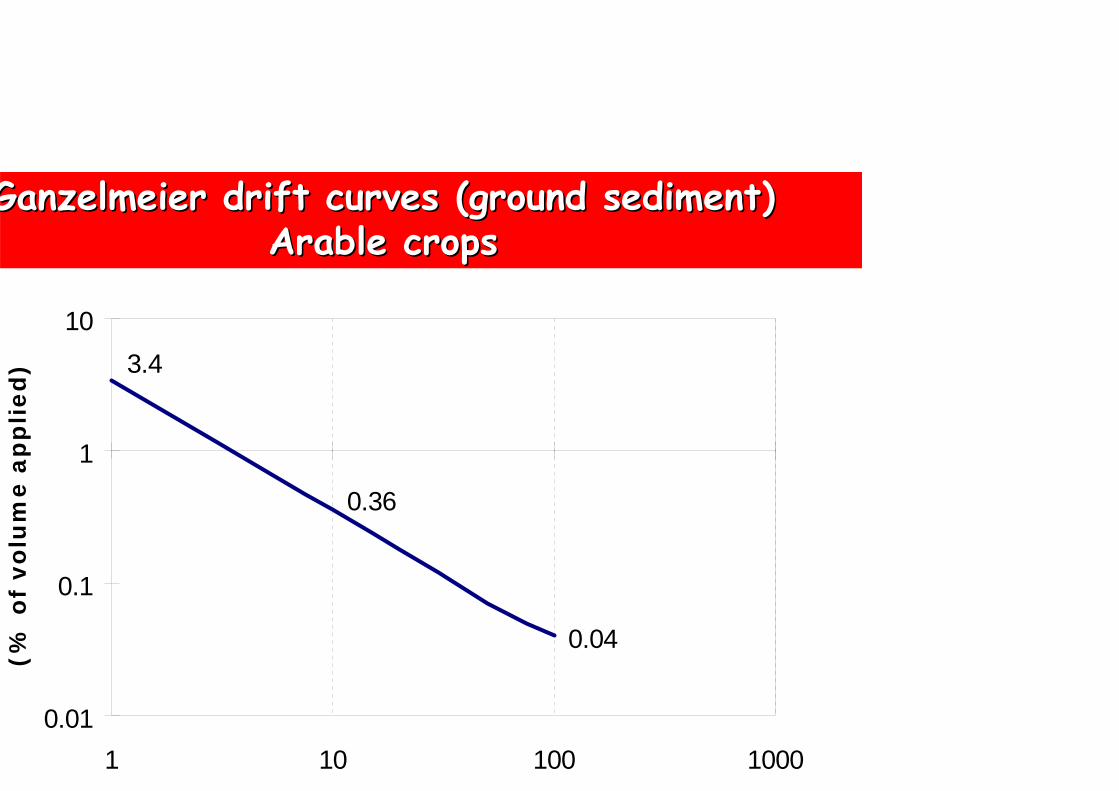
0.04
0.36
3.4
0.01
0.1
1
10
1 10 100 1000
(% d
el v
olum
e di
strib
uito
)
GanzelmeierGanzelmeier driftdrift curvescurves ((groundground sedimentsediment))ArableArable cropscrops
(% o
f vo
lum
e a
pp
lied
)
i f h d

0.16
0.55
0.05
3.61.36
6.78
0.01
0.1
1
10
1 10 100
Early growth stagesFull vegetation
GanzelmeierGanzelmeier driftdrift curvescurves ((groundground sedimentsediment))VineyardVineyard
(% o
f vo
lum
e a
pp
lied
)

12.04
0.3
5.052.88
25.9814.41
0.11
0.97
0.1
1
10
100
1 10 100
p(%
del
vol
ume
dist
ribui
to) Primi stadi vegetativi
Piena vegetazione
GanzelmeierGanzelmeier driftdrift curvescurves ((groundground sedimentsediment))OrchardOrchard
(% o
f vo
lum
e a
pp
lied
) Early growth stagesFull vegetation

To assess spray drift measured cording to ISO 22866 methodology n Italian vineyards using different
air-assisted sprayers
and
To compare results obtained with BBA-JKI reference drift curves
OBJECTIVE OF THE STUDY
(funded by AGROFARMA)
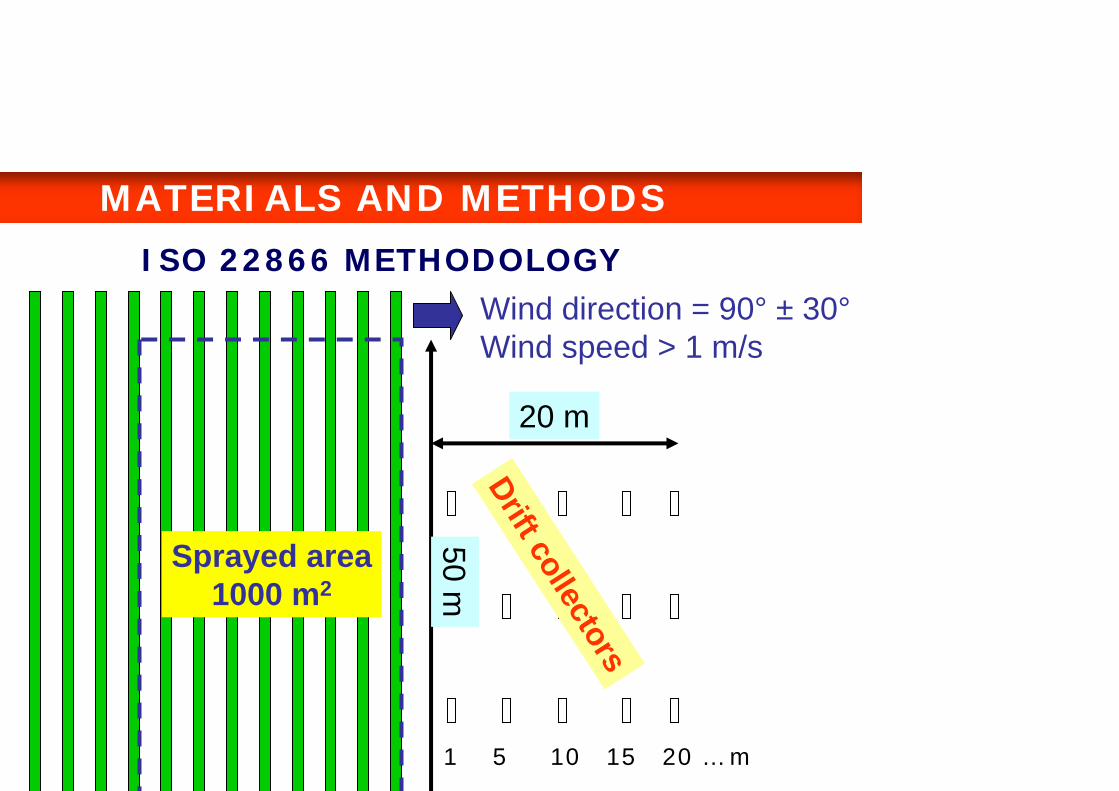
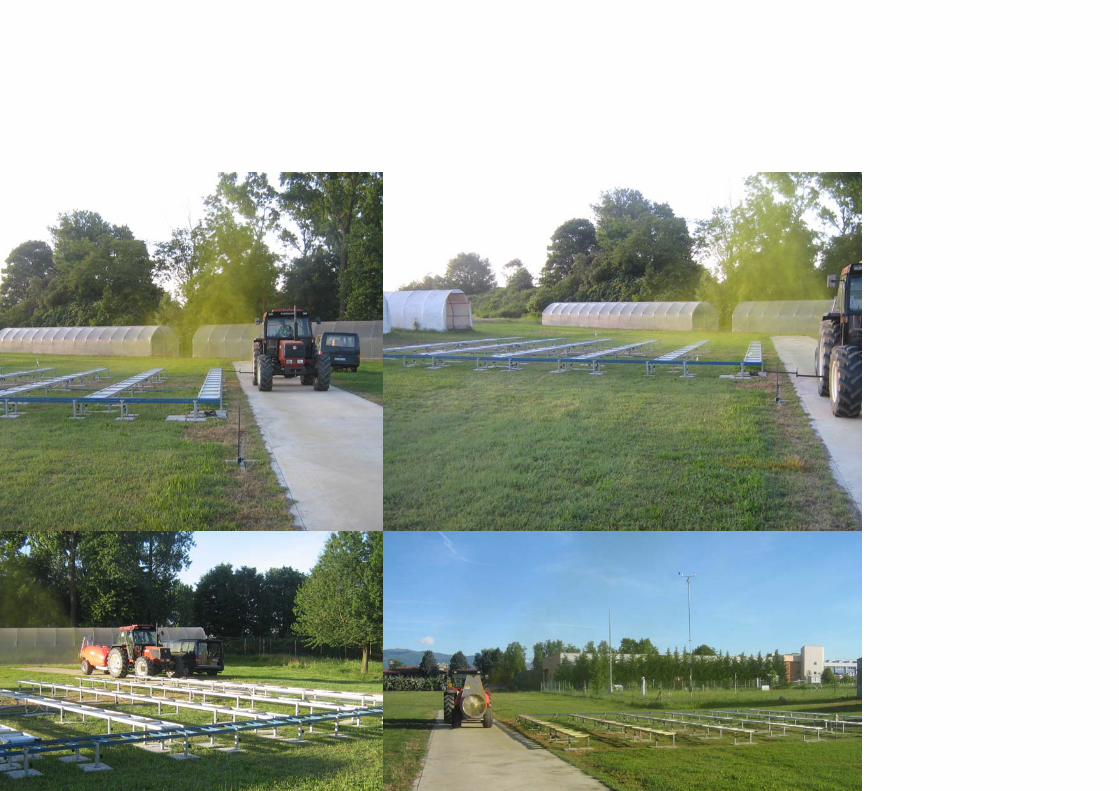
MATERIALS AND METHODS
50 m
Sprayed area1000 m2
Drift collectors
Wind direction = 90° ± 30°Wind speed > 1 m/s
20 m
ISO 22866 METHODOLOGY
1 5 10 15 20 … m

MATERIALS AND METHODS
Wind directionSamplers forairborne drift
15 10 7.5 5 3 1 mDownwind distances
Samplers forground drift
22866 METHODOLOGY
Application of water based solution of yellow

stssts werewere mademade in in TuscanyTuscany regionregion::Azienda ScienzaAzienda Scienza
C t t C d i (LI)C t t C d i (LI)
MATERIALS AND METHODS

TWO VINEYARD TYPES
Syrah trained at Guyot, yout 1.8 x 0.7 m (7800 ants/ha), LAI max. 1.6
Cabernet Sauvignonained at Guyot, layout 1.8 0.8 m (6850 plants/ha)AI max 1 0
MATERIALS AND METHODS
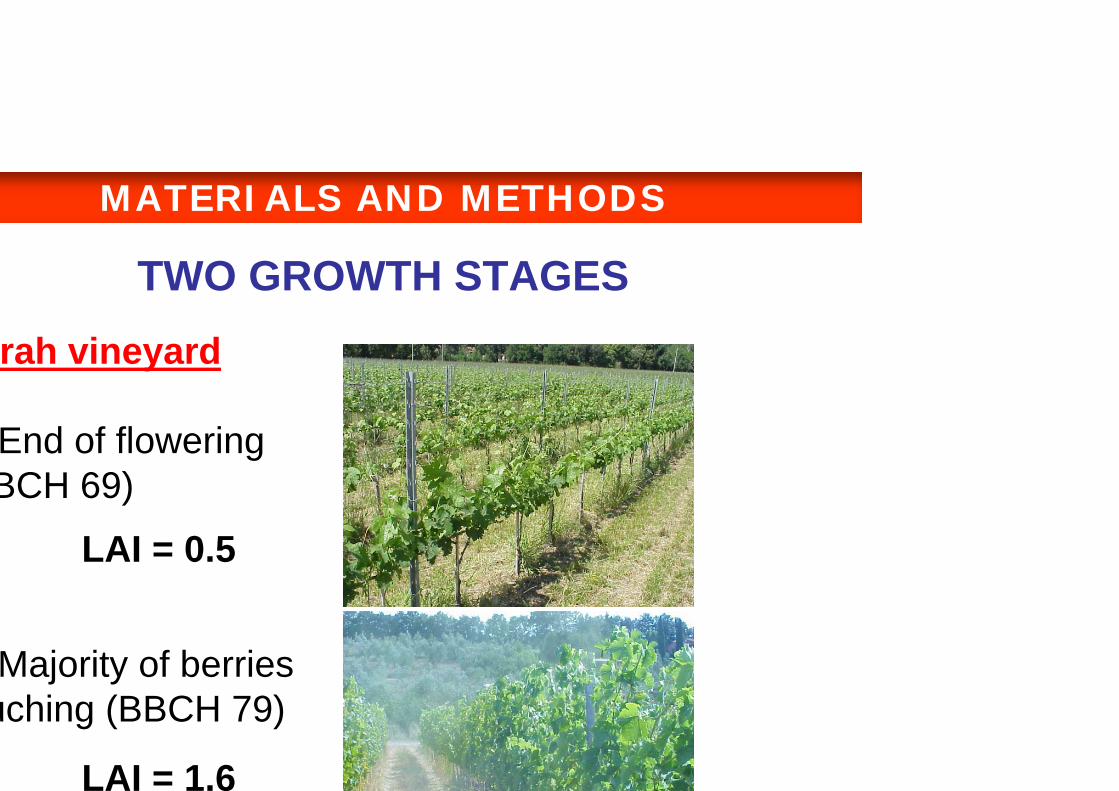
TWO GROWTH STAGESrah vineyard
End of floweringBCH 69)
Majority of berriesuching (BBCH 79)
LAI = 0.5
LAI = 1.6
MATERIALS AND METHODS

TWO GROWTH STAGESabernet Sauvignonneyard
End of loweringBCH 69)
Majority of berriesuching (BBCH 79)
LAI = 0.3
MATERIALS AND METHODS

MATERIALS AND METHODS
3 TYPES OF SPRAYERS TESTED
ONVENTIONAL AIR-SSISTED (AXIAL FAN)
ROSS FLOW AIR-ISTED
NEUMATIC
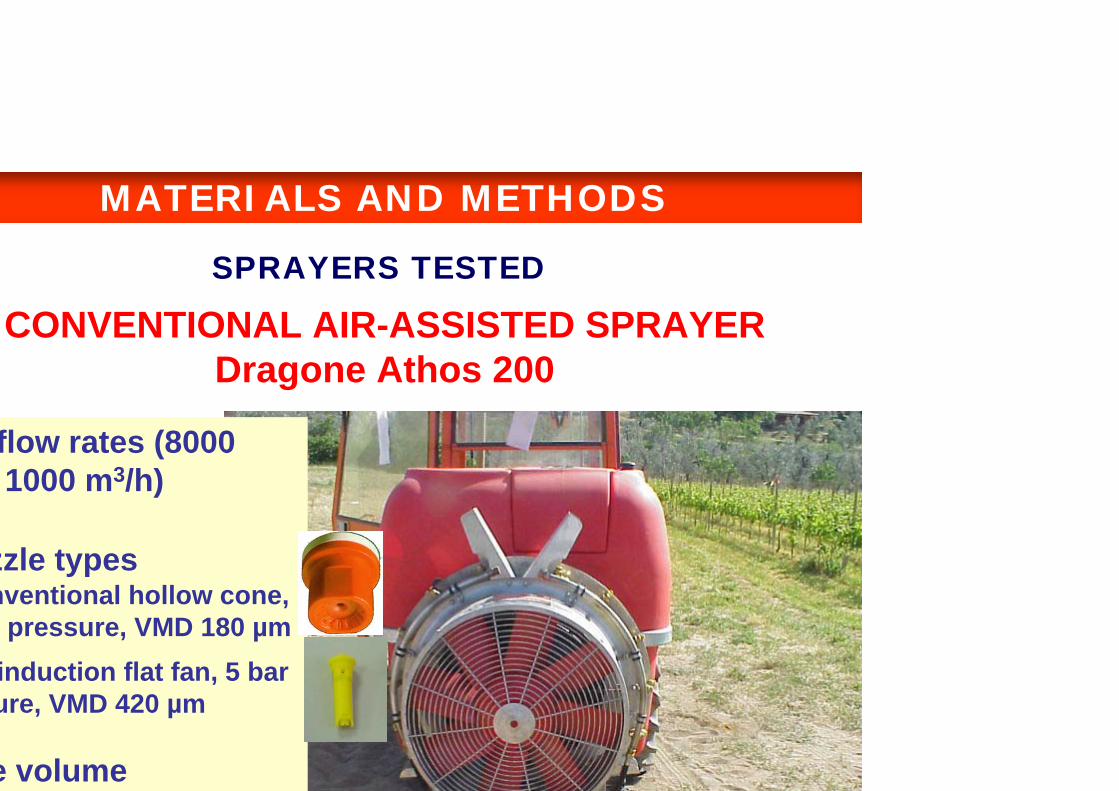
CONVENTIONAL AIR-ASSISTED SPRAYERDragone Athos 200
flow rates (8000 1000 m3/h)
zzle typesnventional hollow cone,
pressure, VMD 180 µminduction flat fan, 5 bar ure, VMD 420 µm
e volume
MATERIALS AND METHODS
SPRAYERS TESTED

CROSS FLOW AIR-ASSISTED SPRAYERDragone K2500
MATERIALS AND METHODS
SPRAYERS TESTED
flow rates (14000 20000 m3/h)
zzle typesnventional hollow cone,
pressure, VMD 180 µminduction flat fan, 5 bar ure, VMD 420 µm
e volume

PNEUMATIC SPRAYERCima Blitz 45T
single sprayerfiguration tested
o diffusors with fouruts each)
D 100 µm
ed air flow rate (6500 h)
MATERIALS AND METHODS
SPRAYERS TESTED
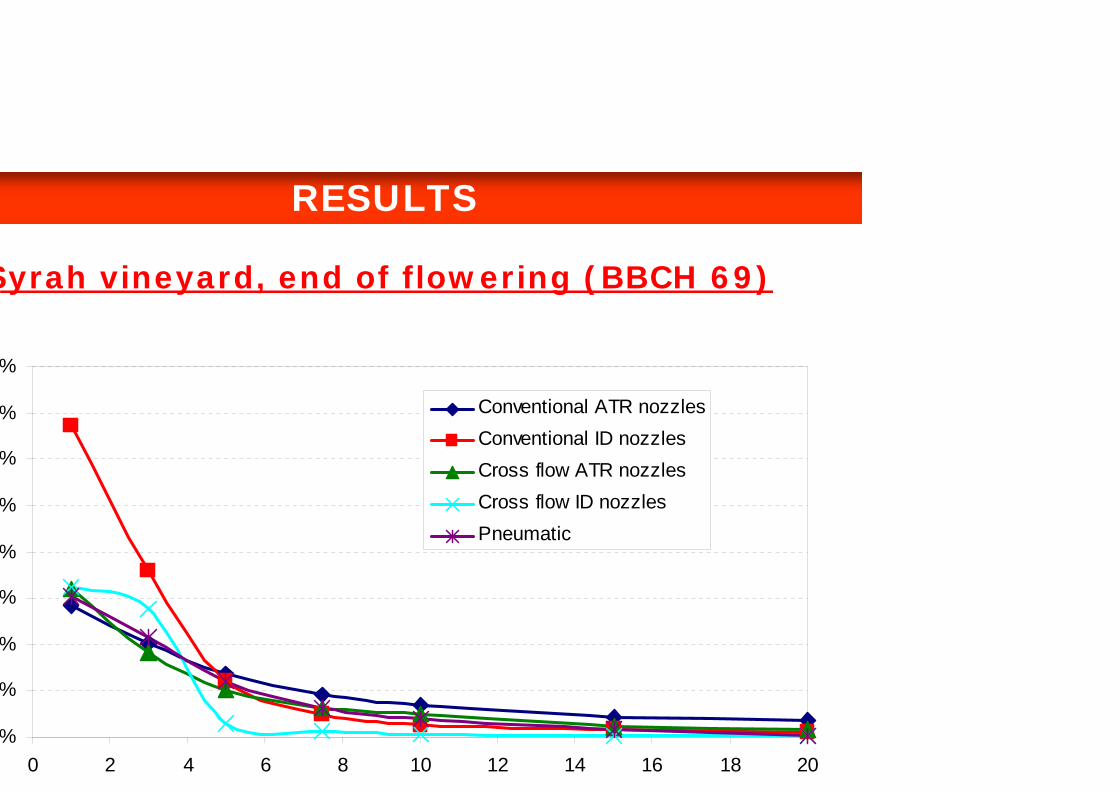
RESULTS
Syrah vineyard, end of flowering (BBCH 69)
%
%
%
%
%
%
%
%
%
0 2 4 6 8 10 12 14 16 18 20
Conventional ATR nozzlesConventional ID nozzlesCross flow ATR nozzlesCross flow ID nozzlesPneumatic
0%
%
2%
3%
4%
5%
6%
7%
8%
5 10 15 20
Downwind distance (m)
Conventional ATR nozzlesConventional ID nozzlesCross flow ATR nozzlesCross flow ID nozzlesPneumatic
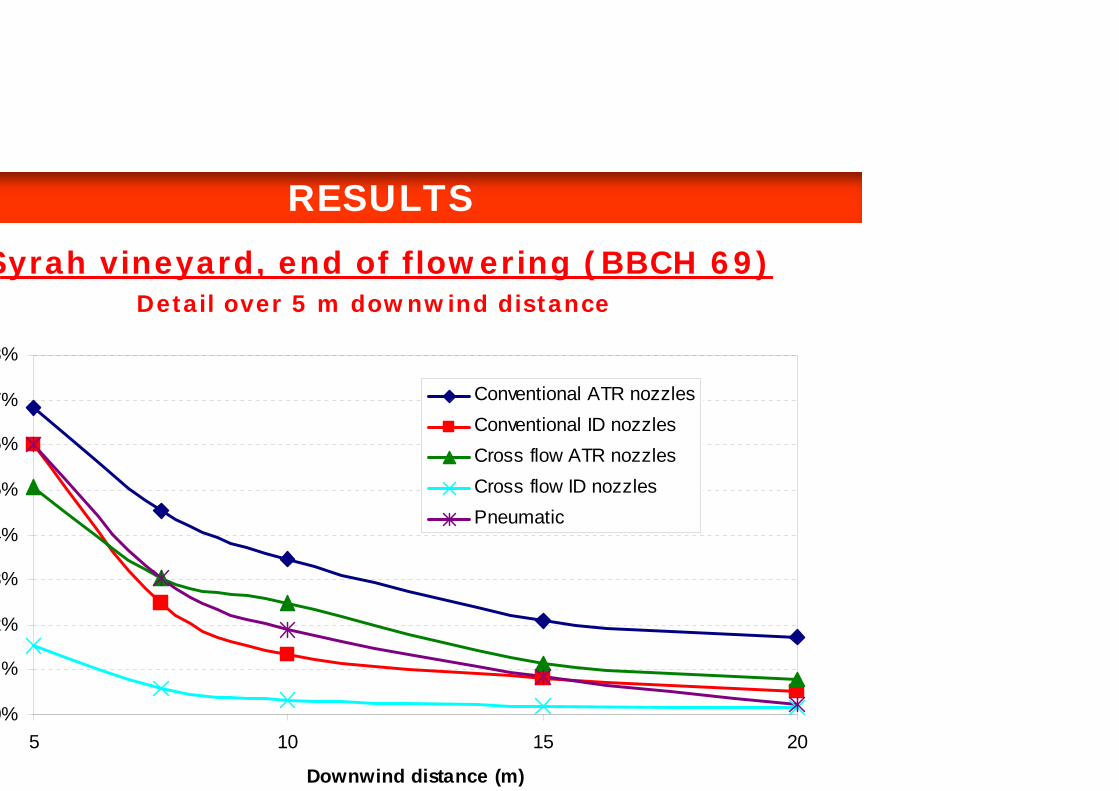
RESULTS
Syrah vineyard, end of flowering (BBCH 69)Detail over 5 m downwind distance

0%
5%
0%
5%
0%
5%
0 2 4 6 8 10 12 14 16 18 20
Conventional ATR nozzlesConventional ID nozzlesCross flow ATR nozzlesCross flow ID nozzlesPneumatic
RESULTS
Syrah vineyard, majority of berries touching(BBCH 79)

0%
%
2%
3%
4%
5%
6%
7%
5 10 15 20
( )
Conventional ATR nozzlesConventional ID nozzlesCross flow ATR nozzlesCross flow ID nozzlesPneumatic
RESULTS
Syrah vineyard, majority of berries touching(BBCH 79)
Detail over 5 m downwind distance

0%
5%
0%
5%
0%
5%
0%
5%
0%
5%
0 2 4 6 8 10 12 14 16 18 20
Conventional ATR nozzlesConventional ID nozzlesCross flow ATR nozzlesCross flow ID nozzlesPneumatic
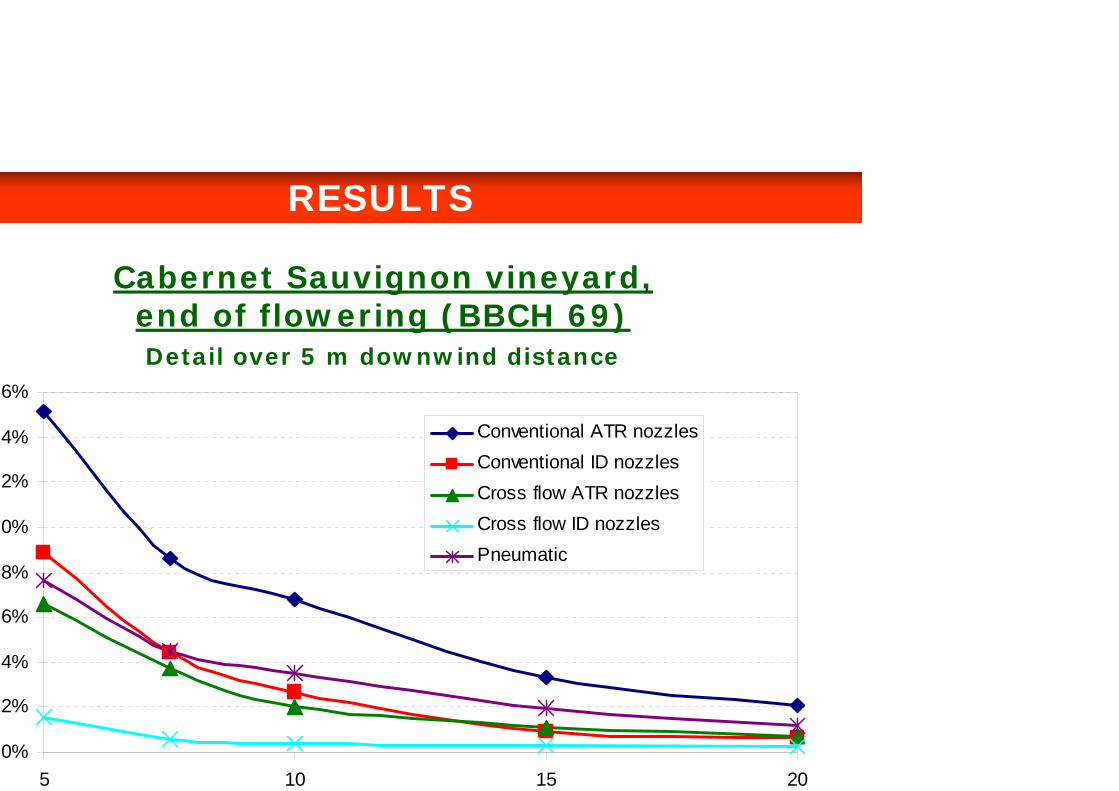
RESULTS
Cabernet Sauvignon vineyard,end of flowering (BBCH 69)
0%
2%
4%
6%
8%
0%
2%
4%
6%
5 10 15 20
Conventional ATR nozzlesConventional ID nozzlesCross flow ATR nozzlesCross flow ID nozzlesPneumatic
RESULTS
Cabernet Sauvignon vineyard,end of flowering (BBCH 69)Detail over 5 m downwind distance
0%
2%
4%
6%
8%
0%
2%
4%
6%
8%
0%
0 2 4 6 8 10 12 14 16 18 20
Conventional ATR nozzlesConventional ID nozzlesCross flow ATR nozzlesCross flow ID nozzlesPneumatic
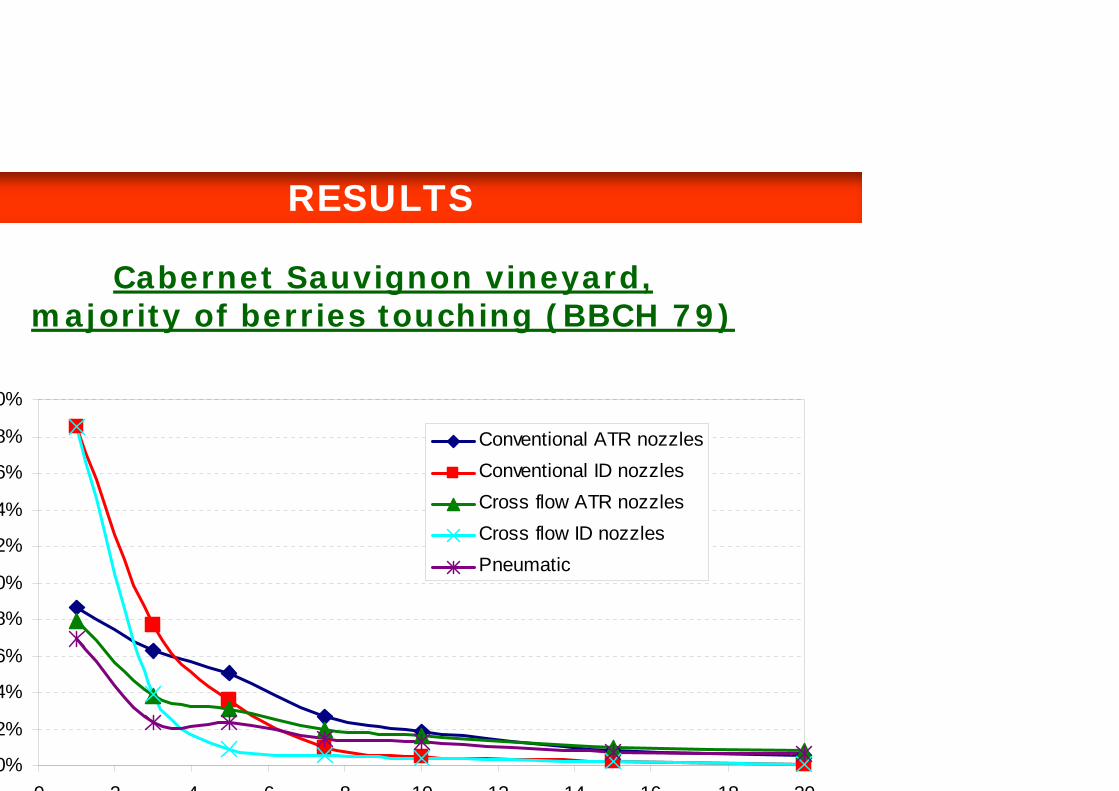
RESULTS
Cabernet Sauvignon vineyard,majority of berries touching (BBCH 79)

%
%
%
%
%
%
%
5 10 15 20
Conventional ATR nozzlesConventional ID nozzlesCross flow ATR nozzlesCross flow ID nozzlesPneumatic
RESULTS
Cabernet Sauvignon vineyard,majority of berries touching (BBCH 79)
Detail over 5 m downwind distance
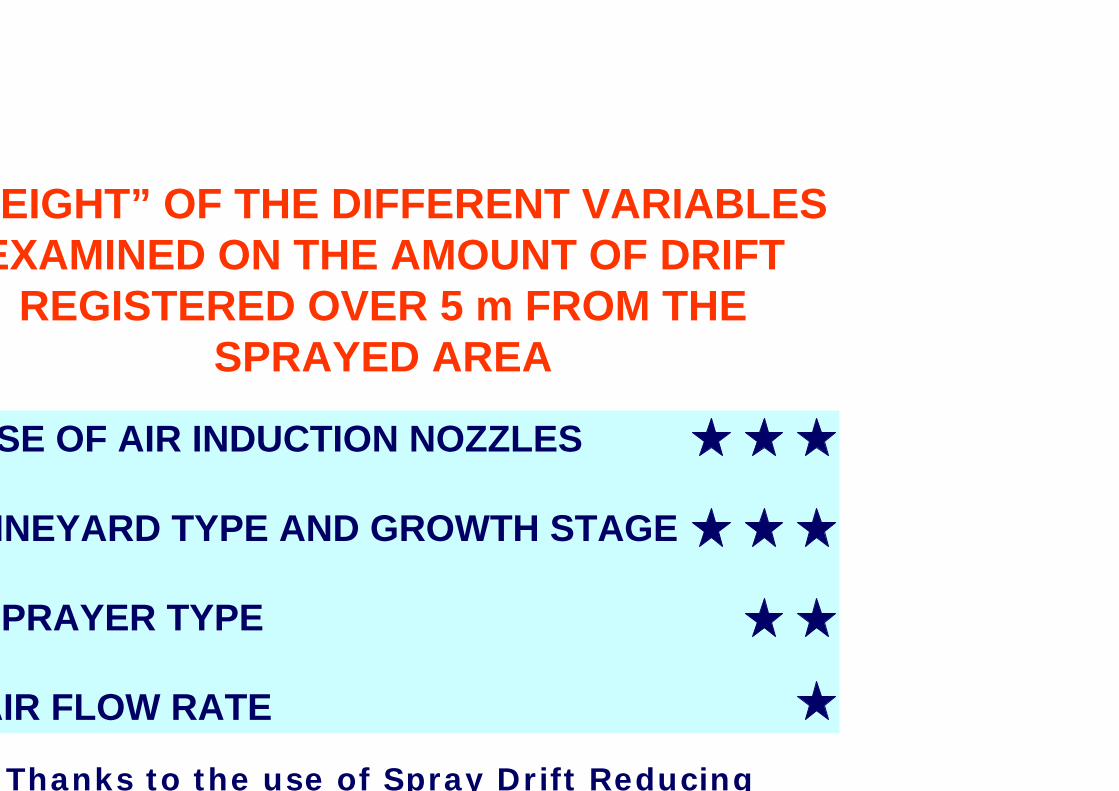
EIGHT” OF THE DIFFERENT VARIABLES EXAMINED ON THE AMOUNT OF DRIFT
REGISTERED OVER 5 m FROM THE SPRAYED AREA
SE OF AIR INDUCTION NOZZLES
INEYARD TYPE AND GROWTH STAGE
PRAYER TYPE
AIR FLOW RATE
Thanks to the use of Spray Drift Reducing

0%
1%
2%
3%
4%
5%
6%
7%
0 5 10 15 20 25
Downwind distance (m)
ATR nozzles
ID nozzles
Example of results of tests made in Syrah vineyard at end of flowering (BBCH 69)
using the cross flow sprayer
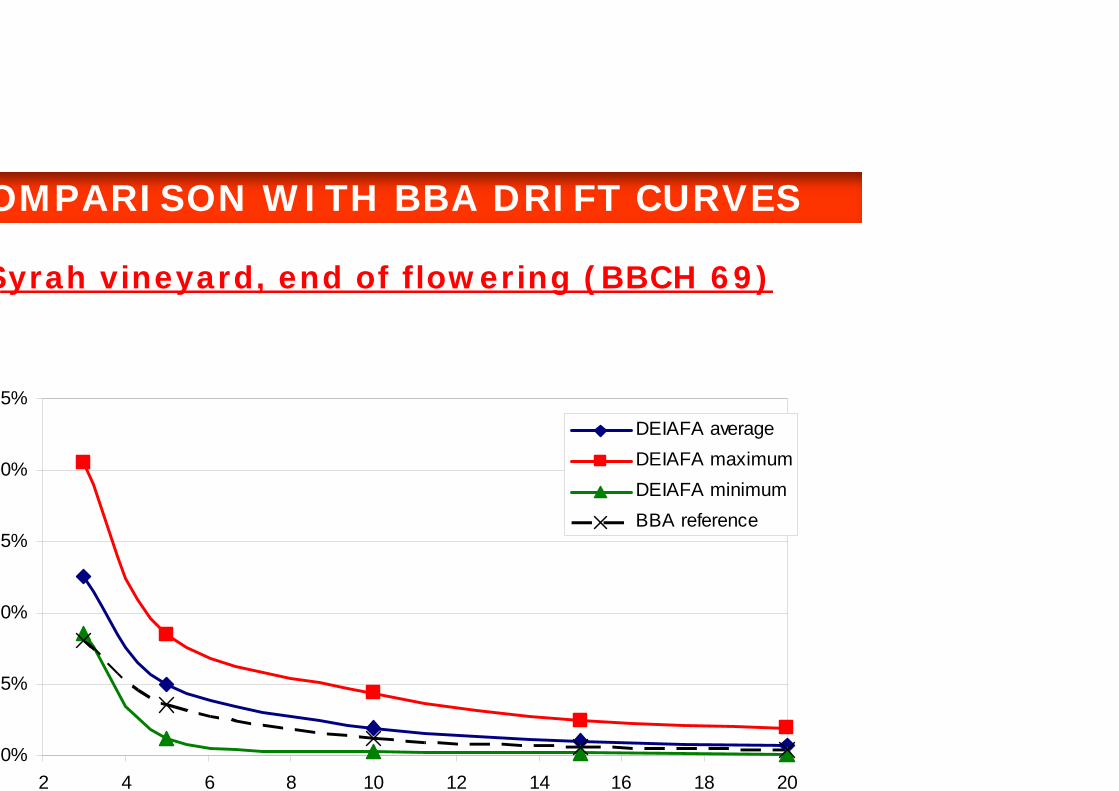
OMPARISON WITH BBA DRIFT CURVES
0%
5%
0%
5%
0%
5%
2 4 6 8 10 12 14 16 18 20
DEIAFA averageDEIAFA maximumDEIAFA minimumBBA reference
Syrah vineyard, end of flowering (BBCH 69)
0%
2%
4%
6%
8%
0%
2%
2 4 6 8 10 12 14 16 18 20
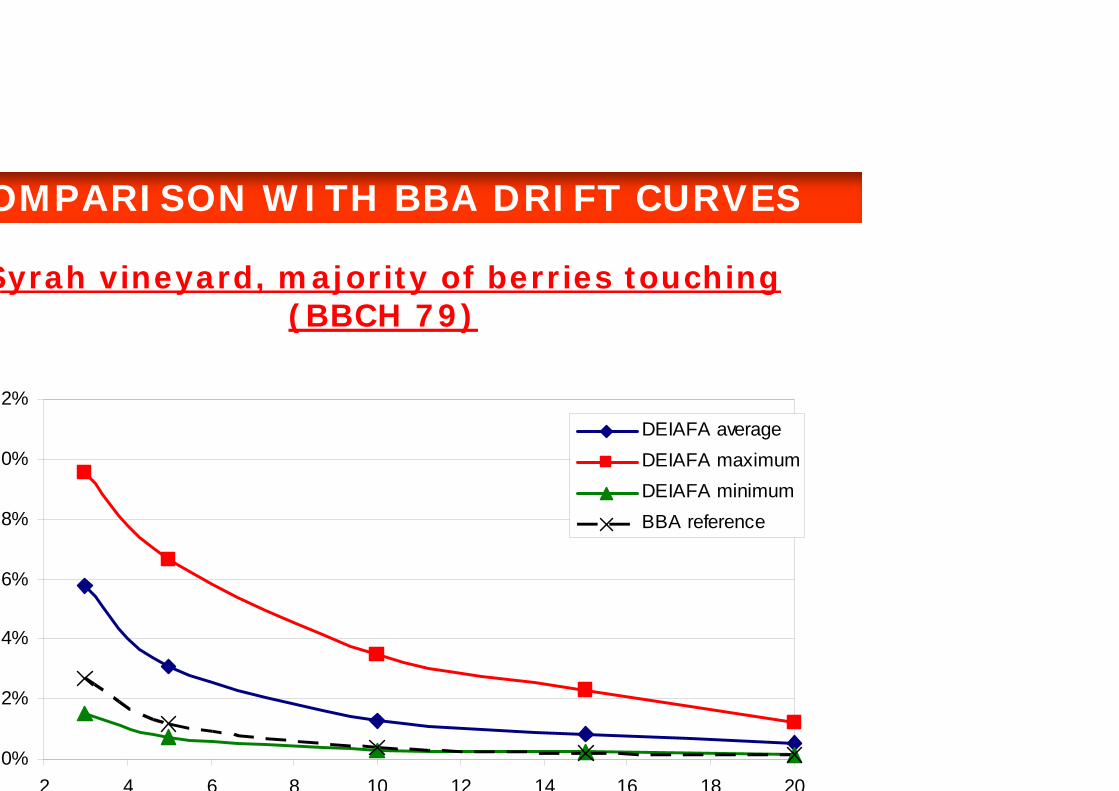
DEIAFA averageDEIAFA maximumDEIAFA minimumBBA reference
Syrah vineyard, majority of berries touching(BBCH 79)
OMPARISON WITH BBA DRIFT CURVES
0%
5%
10%
15%
20%
25%
30%
2 4 6 8 10 12 14 16 18 20
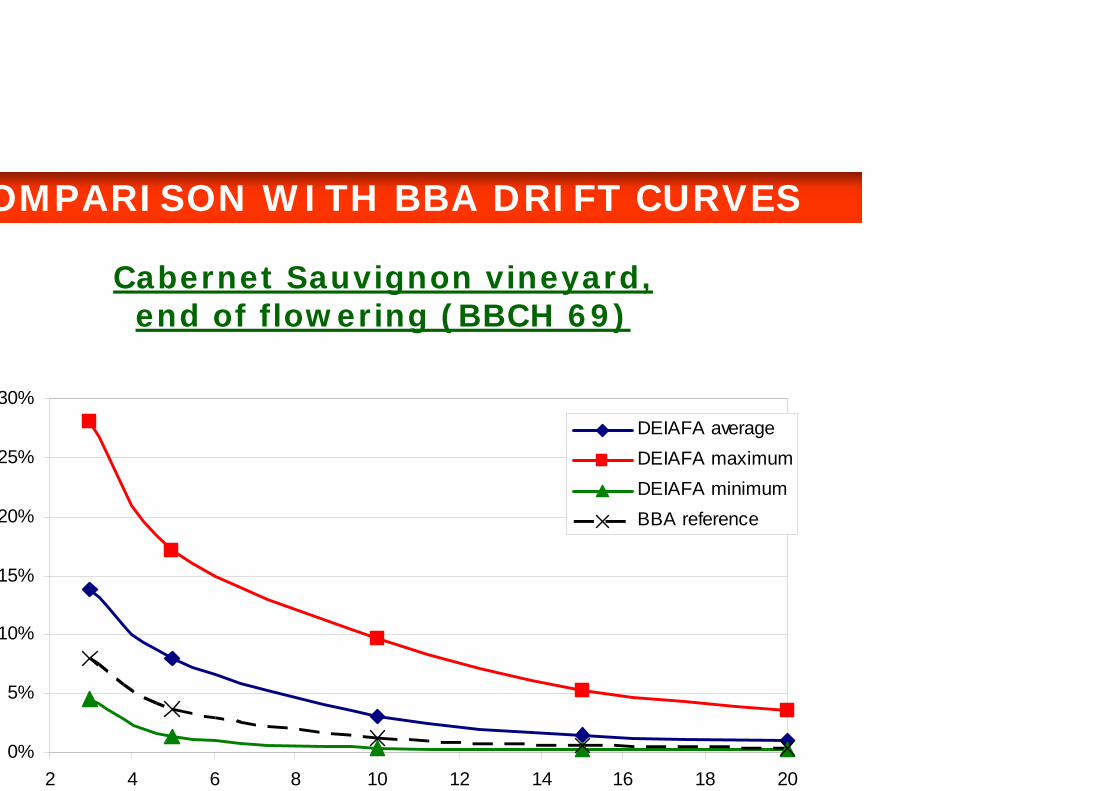
DEIAFA averageDEIAFA maximumDEIAFA minimumBBA reference
Cabernet Sauvignon vineyard,end of flowering (BBCH 69)
OMPARISON WITH BBA DRIFT CURVES

%
%
%
%
%
%
%
%
%
%
2 4 6 8 10 12 14 16 18 20
DEIAFA averageDEIAFA maximumDEIAFA minimumBBA reference
Cabernet Sauvignon vineyard,majority of berries touching (BBCH 79)
OMPARISON WITH BBA DRIFT CURVES
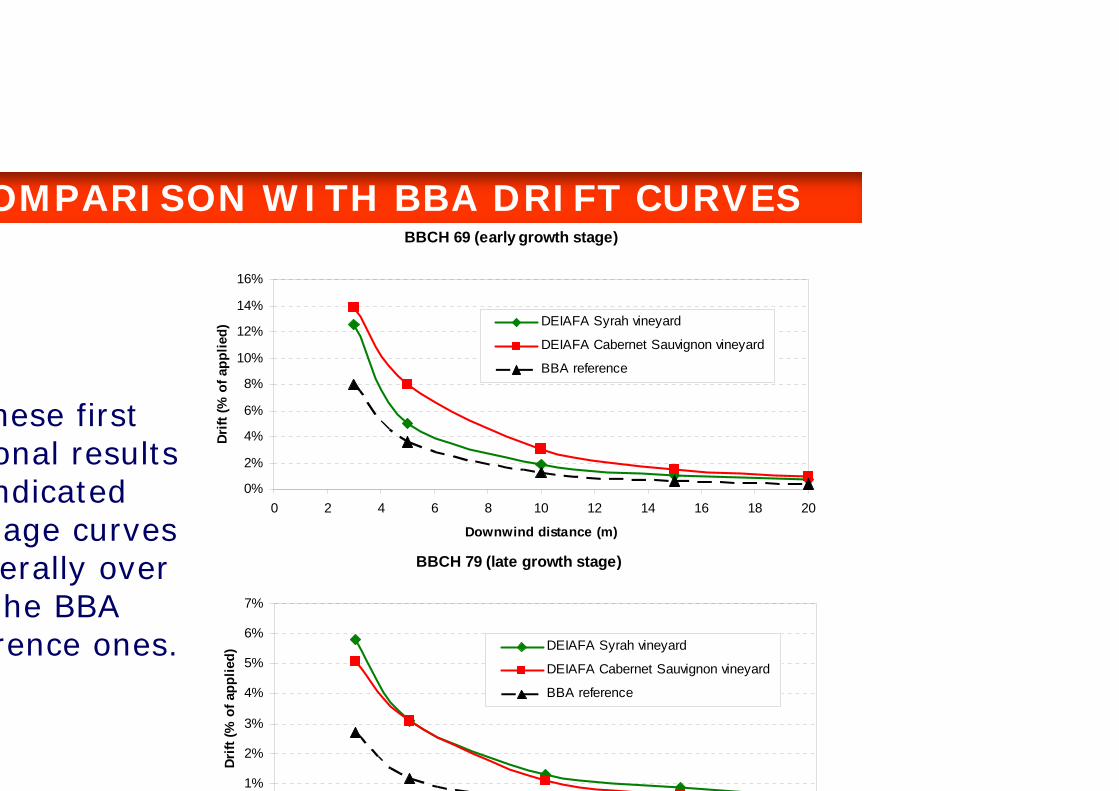
BBCH 69 (early growth stage)
0%
2%
4%
6%
8%
10%
12%
14%
16%
0 2 4 6 8 10 12 14 16 18 20
Downwind distance (m)
Drift
(% o
f app
lied)
DEIAFA Syrah vineyard
DEIAFA Cabernet Sauvignon vineyard
BBA reference
hese first onal results ndicated rage curves erally over the BBA rence ones.
OMPARISON WITH BBA DRIFT CURVES
BBCH 79 (late growth stage)
1%
2%
3%
4%
5%
6%
7%
Drift
(% o
f app
lied)
DEIAFA Syrah vineyard
DEIAFA Cabernet Sauvignon vineyard
BBA reference

CONCLUSIONS
DEIAFA drift curves are different from BBA curves (higher drift values)
POSSIBLE REASONS
fferent environmental conditions (wind peed and air temperature)
gher canopy density of the German neyards (different layout, training system, rieties, etc.)
ffi i t d ll dj t d i

CONCLUSIONS
o build reference drift curve for Italian vineyards more experimental data are
needed considering several different vine raining systems and application scenarios.
A specific research project is needed
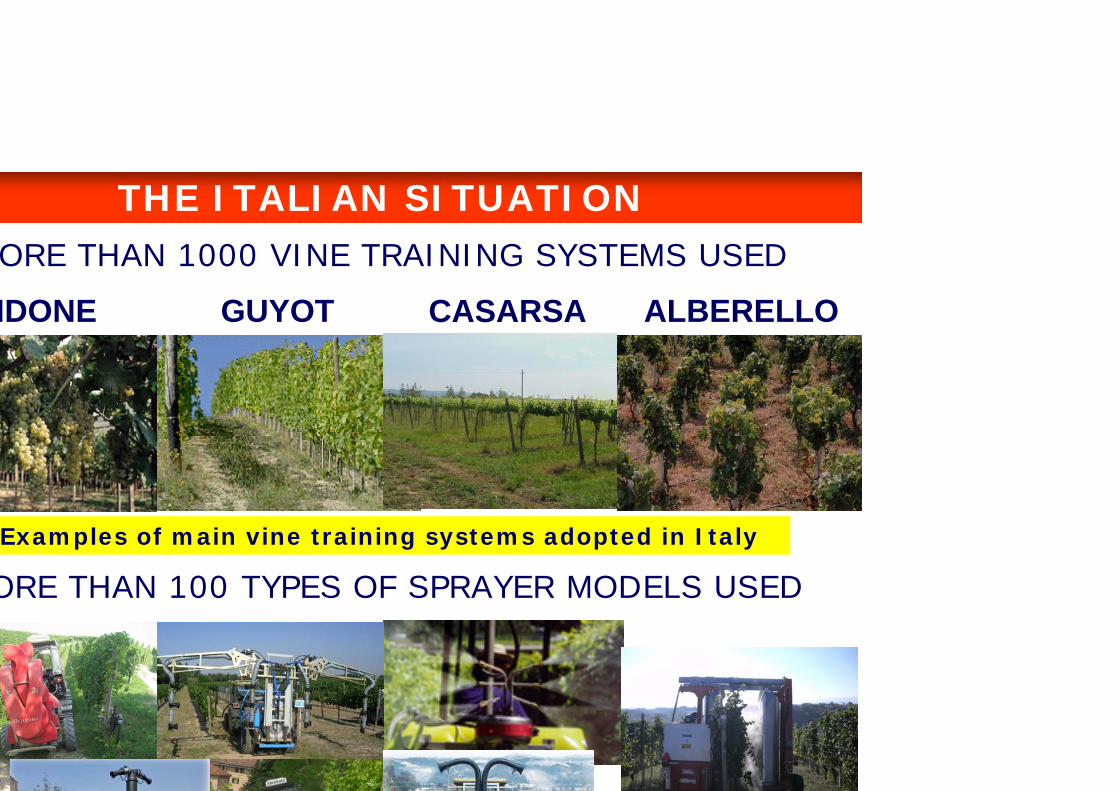
THE ITALIAN SITUATIONORE THAN 1000 VINE TRAINING SYSTEMS USED
ORE THAN 100 TYPES OF SPRAYER MODELS USED
NDONE CASARSA
Examples of main vine training systems adopted in Italy
GUYOT ALBERELLO

CONCLUSIONS
ational reference drift curves are necessary lso to allow authorities to modulate buffer zone size in function of the SDRT used
Sprayers classification in function of drift
SO 22866 methodology is too complicated for this purpose and provides limited
reproducibility of results
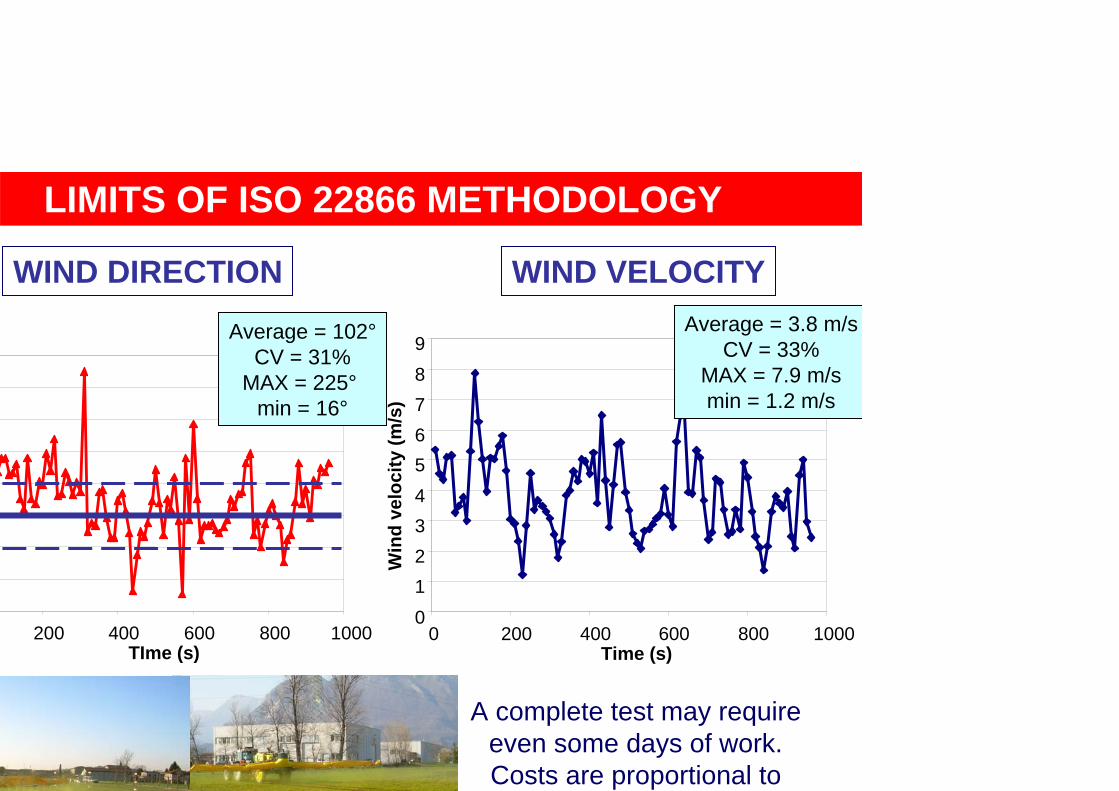
0123456789
0 200 400 600 800 1000Time (s)
Win
dve
loci
ty(m
/s)
Average = 3.8 m/sCV = 33%
MAX = 7.9 m/smin = 1.2 m/s
WIND VELOCITY
200 400 600 800 1000TIme (s)
WIND DIRECTION
Average = 102°CV = 31%
MAX = 225°min = 16°
A complete test may require even some days of work. Costs are proportional to
LIMITS OF ISO 22866 METHODOLOGY

CONCLUSIONS
DEIAFA is developing a system to measure and pare potential drift generated in absence of wind by fferent sprayer models using ad hoc test benches.
13 m
0.5 m
1.0 m
0.5 m

And thank you to AGROFARMA (National Crop Protection