The Master Clock Building at USNO Infrastructuread.usno.navy.mil/edboard/090113f.pdf · THE MASTER...
11
40 th Annual Precise Time and Time Interval (PTTI) Meeting THE MASTER CLOCK FACILITY AT USNO INFRASTRUCTURE Warren F. Walls U.S. Naval Observatory; Time Service Department 3450 Massachusetts Ave., NW; Washington, DC 20392 Email: [email protected] Abstract The U.S. Naval Observatory recently completed a new facility to house its rubidium fountains as well as hydrogen masers, cesium beam tube clocks, and future clocks. The design and performance of the building itself is key to providing a good environment to house the clocks. Additionally the measurement, dissemination, and future capabilities of the infrastructure electronics are critical to achieving mission goals and supporting requirements into the future. This paper reviews some of the building design choices and then describes the ac power, dc power, telemetry, and measurement system configurations. INTRODUCTION The United States Naval Observatory is in the process of building up six rubidium fountains to support and improve the clock ensemble that produces UTC(USNO). In order to provide the best environment for the new fountains, as well as other current and future clocks, a new building was designed and constructed at the USNO facility in Washington, DC. This paper looks at some of the features of this new building along with the support electronics, measurement gear, and distribution hardware. BASIC LAYOUT Figure 1. The Master Clock Facility – Building 50 1 of 11
Transcript of The Master Clock Building at USNO Infrastructuread.usno.navy.mil/edboard/090113f.pdf · THE MASTER...

40th Annual Precise Time and Time Interval (PTTI) Meeting
THE MASTER CLOCK FACILITY AT USNO INFRASTRUCTURE
Warren F. WallsU.S. Naval Observatory; Time Service Department
3450 Massachusetts Ave., NW; Washington, DC 20392Email: [email protected]
Abstract
The U.S. Naval Observatory recently completed a new facility to house its rubidium fountains as well as hydrogen masers, cesium beam tube clocks, and future clocks. The design and performance of the building itself is key to providing a good environment to house the clocks. Additionally the measurement, dissemination, and future capabilities of the infrastructure electronics are critical to achieving mission goals and supporting requirements into the future.
This paper reviews some of the building design choices and then describes the ac power, dc power, telemetry, and measurement system configurations.
INTRODUCTION
The United States Naval Observatory is in the process of building up six rubidium fountains to support and improve the clock ensemble that produces UTC(USNO). In order to provide the best environment for the new fountains, as well as other current and future clocks, a new building was designed and constructed at the USNO facility in Washington, DC. This paper looks at some of the features of this new building along with the support electronics, measurement gear, and distribution hardware.
BASIC LAYOUT
Figure 1. The Master Clock Facility – Building 50
1 of 11

40th Annual Precise Time and Time Interval (PTTI) Meeting
The outside of the new Master Clock Facility is shown in Figure 1. Eight clock rooms are contained in the middle of the building. The wing sections on the left and the right of the picture house the ac mains and fire suppression system. Large HVAC package units can be placed next to the wings of the building to produce cold air to keep the building on temperature. The outside surface of the building is an “Exterior Finish Insulation Systems” (EFIS). This is made up of a stucco type finish on top of about 3.5” of foam insulation. This along with cinder block, fiber glass insulation, and 5/8”-X drywall provides a fair amount of insulation for the building. The goal was to create a building that would maintain all of its rooms and the hallway like an environmental chamber.
Figure 2 shows the floor plan of the main part of the building. Clock Rooms 1 through 4 are initially configured to house hydrogen masers and Cs beam tube clocks. Figure 3 is a picture of Clock Room 4 fully populated with clocks. Clock Room 5 and Clock Room 6 (or Fountain Room 1 and Fountain Room 2) are each configured to house up to a pair of hydrogen masers and a pair of rubidium fountains. Figure 4 is a picture of the first fountain partially installed along with a hydrogen maser.
Figure 2. Room Layout
Figure 3. Clock Room 4 with 12 Cs Clocks and 5 Hydrogen Masers
2 of 11
40th Annual Precise Time and Time Interval (PTTI) Meeting
Figure 4. Installed Rb Fountain with Hydrogen Maser
The picture shown in Figure 3 illustrating Rooms 1 through 4 and the picture shown in Figure 4 illustrating half of what either Room 5 or Room 6 holds allows one a view of both the computer floor and the concrete piers. For vibration isolation the building was constructed with concrete piers that extend into the ground and are separate from the bottom concrete pad and the suspended computer floor that one walks on. The computer floor is suspended about 4 feet above the concrete pad’s base. In Figure 5 one can see the 9 piers in each of the first four clock rooms and the two longer piers in each of rooms 5 and 6 for the fountains.
Figure 5. Pier Layout
3 of 11

40th Annual Precise Time and Time Interval (PTTI) Meeting
One of the fountain piers can be seen more clearly in Figure 6. Large PVC pipes were placed in the concrete form and then trimmed to fit after the concrete cured. These PVC pipes allow easy installation of cables from the clocks down through the pier into either the power outlets or down into the cable trays.
Figure 6. Fountain Pier
Under the suspended floor in each room there are two cables trays, one stacked above the other. One cable tray is for RF signal cables and the other is for power and telemetry needs. Each concrete pier has a minimum of two PVC tubes going down through the pier. One goes to the RF tray and the other goes to the AC power outlets that are mounted on the pier. This tube also provides access to the power and telemetry tray. This allows one an easy and clean way to keep the power and telemetry cables away from the precision signals that are in the RF cables.
HVAC CONFIGURATION
One of the most important goals of this new building was to create clock vaults in near clean room configuration that behaves like a very stable temperature and humidity controlled environmental chamber. Outside the building on either end a large “HVAC Package Unit” can be placed that creates humidified cold air into the end of the building. This cold air travels down the main feed tube above the hallways. Figure 7 illustrates a side view of the building with the air flow configuration notated. From the main feed in Figure 7 (1) the cool air is delivered to each room through ducts with electric reheat (2) and into the plenum above each room (3). The air then flows down through perforated ceiling panels and into the room space itself. From the room it travels down through the floor (4) and returns to the HVAC package units via the large return pipe under the hallway (5). Sensors in each room servo the electric reheat and call for humidity. The system is required to hold a +/- 0.1C and better than 3% humidity stability at all times. The building was tested and these results have been proven under such strenuous test conditions as a units failing, sensor failure, controller failing, and others.
4 of 11

40th Annual Precise Time and Time Interval (PTTI) Meeting
1.) Cold Air in from compressor2.) Electric reheat3.) Air flow down through room4.) Air flows through floor tiles5.) Air return through hall center
Figure 7. HVAC Air Flow Cross Section
AC POWER FEED
Solid, protected, and redundant ac mains for the building are very important for sustaining the clocks over time. Figure 8 illustrates the general configuration of the ac power system. Automatic Transfer Switches (ATS) are used to select between different feeds from the power grid, different generators, and different UPS units to produce multiple circuits at the clock piers. This allows one to locally plug into more than one ac power source. The HVAC systems are supported by the generator backed power while the rest of the building has both generator and UPS backed power.
Feeds from Power Company Grids
Switch Gear
Multiple Diesel Power Generators
Switch Gear
Multiple UPS Units
Switch Gear
A, B, C Outlets in Building
HVAC System
Figure 8. AC Power Configuration
5 of 11
±0.1 °C3% RH
40th Annual Precise Time and Time Interval (PTTI) Meeting
DC POWER FEED
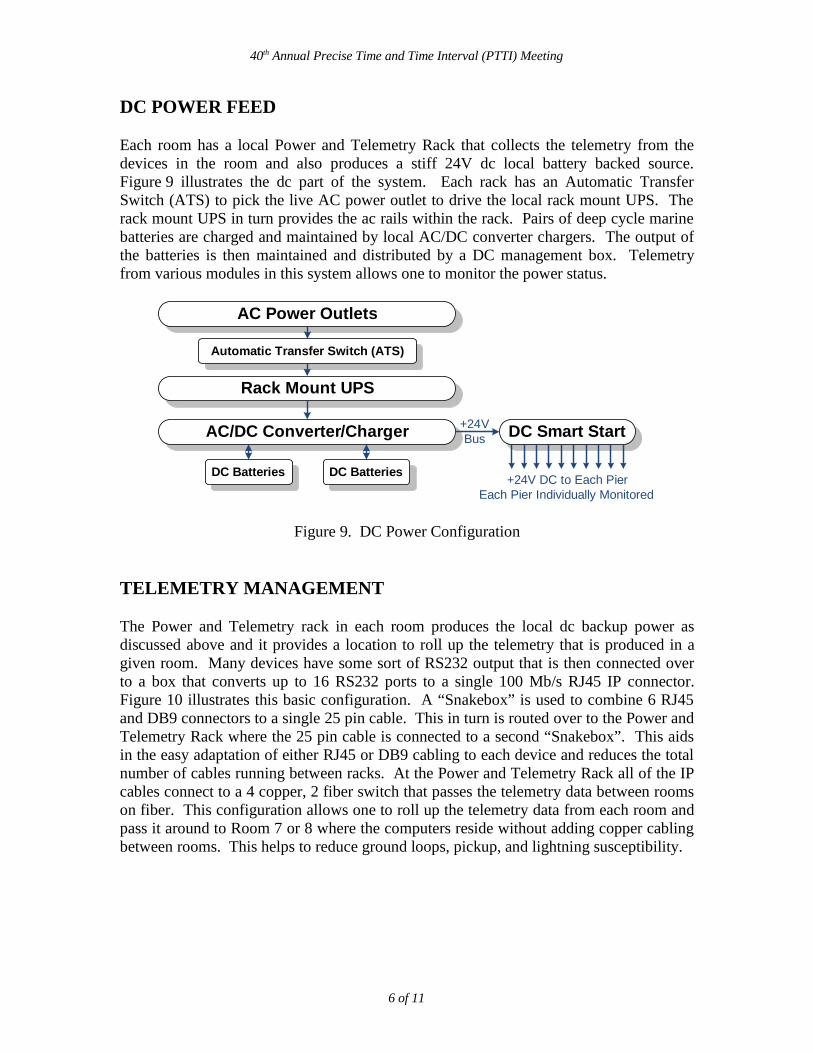
Each room has a local Power and Telemetry Rack that collects the telemetry from the devices in the room and also produces a stiff 24V dc local battery backed source. Figure 9 illustrates the dc part of the system. Each rack has an Automatic Transfer Switch (ATS) to pick the live AC power outlet to drive the local rack mount UPS. The rack mount UPS in turn provides the ac rails within the rack. Pairs of deep cycle marine batteries are charged and maintained by local AC/DC converter chargers. The output of the batteries is then maintained and distributed by a DC management box. Telemetry from various modules in this system allows one to monitor the power status.
AC Power Outlets
Automatic Transfer Switch (ATS)
Rack Mount UPS
AC/DC Converter/Charger
DC Batteries DC Batteries
DC Smart Start+24VBus
+24V DC to Each PierEach Pier Individually Monitored
Figure 9. DC Power Configuration
TELEMETRY MANAGEMENT
The Power and Telemetry rack in each room produces the local dc backup power as discussed above and it provides a location to roll up the telemetry that is produced in a given room. Many devices have some sort of RS232 output that is then connected over to a box that converts up to 16 RS232 ports to a single 100 Mb/s RJ45 IP connector. Figure 10 illustrates this basic configuration. A “Snakebox” is used to combine 6 RJ45 and DB9 connectors to a single 25 pin cable. This in turn is routed over to the Power and Telemetry Rack where the 25 pin cable is connected to a second “Snakebox”. This aids in the easy adaptation of either RJ45 or DB9 cabling to each device and reduces the total number of cables running between racks. At the Power and Telemetry Rack all of the IP cables connect to a 4 copper, 2 fiber switch that passes the telemetry data between rooms on fiber. This configuration allows one to roll up the telemetry data from each room and pass it around to Room 7 or 8 where the computers reside without adding copper cabling between rooms. This helps to reduce ground loops, pickup, and lightning susceptibility.
6 of 11

40th Annual Precise Time and Time Interval (PTTI) Meeting
Clock
Clock
Clock
Clock
UPS
%RH / °C
SnakeBox
SnakeBox
SnakeBox
SnakeBox
Digi-16RS232 to IP
Digi-16RS232 to IP
Cu –Fiber
Switch
Fiberto
Fiberfrom
RS232 Lines
RS232 Lines
InsidePower &
TelemetryRack
Clock Pier/Rack
Figure 10. Telemetry Configuration
PERFORMANCE GOALS
Looking at manufacturer’s advertised performance of hydrogen masers, cesium beam tube atomic clocks, high performance crystal oscillators, and finally the rubidium fountains one can come up with the expected phase noise and Allan deviation for each clock type. Different clock types have better performance at different intervals and offset frequencies. Therefore one uses a collection of different clocks to not only have redundancy to improve availability of the time scale, but to also leverage the advantages of each clock type at the appropriate time interval or frequency offset. Figure 11 is a table summarizing the phase noise performance while Figure 12 graphs the expected phase noise for the different clock types. Figure 13 is a table summarizing the Allan deviation that is graphed in Figure 14.
Figure 11. Phase Noise Comparison Table
7 of 11

40th Annual Precise Time and Time Interval (PTTI) Meeting
-180
-170
-160
-150
-140
-130
-120
-110
-100
-90
1 10
10
0
1,0
00
10
,000
10
0,00
0
Offset Frequency (Hz)
L(f
) P
has
e N
ois
e (d
Bc/
Hz)
Hmaser Cesium
Target OCXO
Figure 12. Phase Noise Comparison Graph
Averaging Time Hmaser Cesium OCXO
(s) σy(τ) σy(τ) σy(τ)
1 2.0 E-13 5.0 E-12 1.0 E-11
10 5.0 E-14 3.5 E-12 2.0 E-12
100 1.3 E-14 8.5 E-13 1.0 E-12
1,000 3.2 E-15 2.7 E-13 5.0 E-12
10,000 3.0 E-15 8.5 E-14 5.0 E-11
100,000 3.0 E-15 2.7 E-14 5.0 E-10
Averaging Time Rb Fountain AOG Stability Target
(s) σy(τ) σy(τ) σy(τ)
1 1.5 E-13 2.5 E-13 1.0 E-14
10 4.7 E-14 2.5 E-14 1.0 E-15
100 1.5 E-14 2.5 E-15 1.0 E-16
1,000 4.7 E-15 2.5 E-16 1.0 E-17
10,000 1.5 E-15 3.5 E-17 1.0 E-18
100,000 4.7 E-16 2.5 E-17 1.0 E-18
Frequency Stability Data
Figure 13. Allan Deviation Comparison Table
After looking at the performance of each clock type and projecting for needs in the future, a target noise floor for the measurement equipment and distribution amplifiers was selected. This target is also reflected in Figures 11 – 14.
8 of 11

40th Annual Precise Time and Time Interval (PTTI) Meeting
1 E-19
1 E-18
1 E-17
1 E-16
1 E-15
1 E-14
1 E-13
1 E-12
1 E-11
1 10
100
1,00
0
10,00
0
100,000
Averaging Time (s)
Alla
n D
evia
tio
n σ
y(τ)
AOG Stability Hmaser
Cesium Rb Fountain
Target OCXO
Figure 14. Allan Deviation Comparison Graph
MEASUREMENT SYSTEM
All of the clocks provide a minimum of a primary and redundant 5 MHz RF signal to Room 7, the measurement room. Figure 15 illustrates the clocks providing these two RF signals, one to each of the two measurement systems. Each RF signal connects to a high performance isolation amplifier that in turn provides signals to a coax switch matrix system that can route any clock signal over to a frequency counter. All hydrogen masers and fountains also provide a signal to the multi-channel real time measurement system. Additional ports are hard wired to the multi-channel measurement system so that select Cs clocks or any other new clocks can be easily connected to the measurement system.
PrimaryDistribution
Amplifier Slice
Clocks
RedundantDistribution
Amplifier Slice
Coax Switch
Coax Switch
Multi-ChannelMeasurement
System(MMS)
Multi-ChannelMeasurement
System(MMS)
FrequencyCounter
FrequencyCounter
Master ClockOutput
Primary RF5 MHz
Redundant RF5 MHz
SelectA Clock
SelectA Clock
Input B Input B
Input A(Reference)
Input A(Reference)
Master ClockOutput
Figure 15. Measurement System Configuration
9 of 11
40th Annual Precise Time and Time Interval (PTTI) Meeting
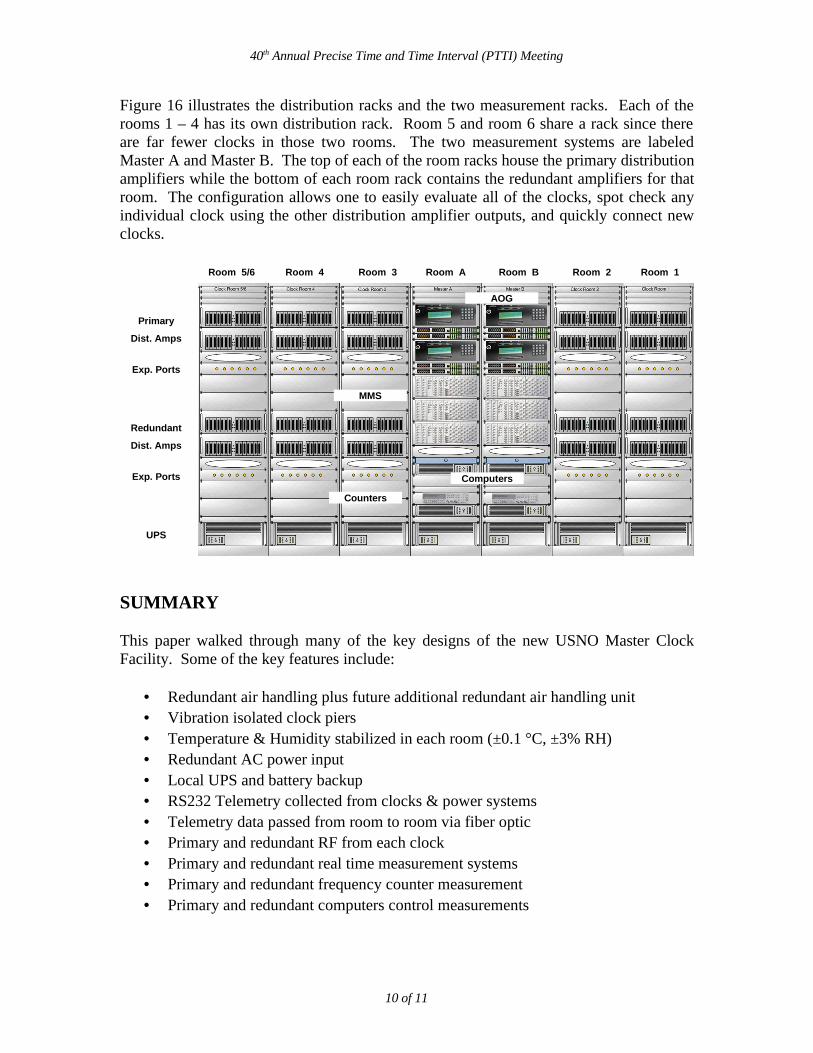
Figure 16 illustrates the distribution racks and the two measurement racks. Each of the rooms 1 – 4 has its own distribution rack. Room 5 and room 6 share a rack since there are far fewer clocks in those two rooms. The two measurement systems are labeled Master A and Master B. The top of each of the room racks house the primary distribution amplifiers while the bottom of each room rack contains the redundant amplifiers for that room. The configuration allows one to easily evaluate all of the clocks, spot check any individual clock using the other distribution amplifier outputs, and quickly connect new clocks.
Figure 16. Distribution and Measurement System
SUMMARY
This paper walked through many of the key designs of the new USNO Master Clock Facility. Some of the key features include:
• Redundant air handling plus future additional redundant air handling unit• Vibration isolated clock piers• Temperature & Humidity stabilized in each room (±0.1 °C, ±3% RH)• Redundant AC power input• Local UPS and battery backup• RS232 Telemetry collected from clocks & power systems• Telemetry data passed from room to room via fiber optic• Primary and redundant RF from each clock• Primary and redundant real time measurement systems• Primary and redundant frequency counter measurement• Primary and redundant computers control measurements
10 of 11
Room 5/6 Room 4 Room 3 Room A Room B Room 2 Room 1
Primary
Dist. Amps
Redundant
Dist. Amps
Exp. Ports
Exp. Ports
UPS
Counters
Computers
MMS
AOG

40th Annual Precise Time and Time Interval (PTTI) Meeting
ACKNOWLEDGEMENTS• Dr. Demetrios Matsakis and the Time Service Department for various help in the
process• System Engineering Division for installing most of the hardware• USNO Command and Science Department for funding the effort
REFERENCES[1.] W.F. Walls and F.L. Walls, “A Practical Guide to Isolation Amplifier Selection”, Frequency Control Symposium, 2007 Joint with the 21st European Frequency and Time Forum. IEEE International, May 29 2007-June 1 2007, pp. 557-562.[2.] L.M. Nelson and F.L. Walls, “Environmental Effects in Mixers and Frequency Distribution Systems”, 1992 IEEE Frequency Control Symposium, p. 831-837.[3.] Hati, D.A. Howe, F.L. Walls, and D. Walker, “Merits of PM noise measurements over noise figure: a study at microwave frequencies”, IEEE T. Ultrason. 53, pp. 1889-1894, 2006.[4.] J. A. Barnes, Andrew R. Chi, Leonard S. Cutler, Daniel J. Healy, Thomas E. McGunigal, James A. Mullen Jr., Warren L. Smith, Richard L. Sydnor, Robert F. C. Vessot, and Gernot M.R. Winkler, “Characterization of Frequency Stability,” Proc. Trans. On Instrum. And Meas. IM-20, 105 1971.[5.] F.L. Walls, John Gray, Abbie O’Gallagher, Roland Sweet, and Linda Sweet, “Time domain frequency stability calculated from the frequency domain description: Use of the Sigint Software package to calculate time domain frequency from the frequency domain”. NIST tech note NISTIR89-3916 Revised, 1991. Available for PCs from Total Frequency; 484 W. Spaulding ST, Lafayette, CO 80026.
11 of 11