The MacArthur-Bates Communicative Development …...The purpose of this study was to examine the...
94
Louisiana State University LSU Digital Commons LSU Master's eses Graduate School 2006 e MacArthur-Bates Communicative Development Inventory as an assessment tool for low-income, African American children Elizabeth Waters Wooden Louisiana State University and Agricultural and Mechanical College, [email protected] Follow this and additional works at: hps://digitalcommons.lsu.edu/gradschool_theses Part of the Communication Sciences and Disorders Commons is esis is brought to you for free and open access by the Graduate School at LSU Digital Commons. It has been accepted for inclusion in LSU Master's eses by an authorized graduate school editor of LSU Digital Commons. For more information, please contact [email protected]. Recommended Citation Wooden, Elizabeth Waters, "e MacArthur-Bates Communicative Development Inventory as an assessment tool for low-income, African American children" (2006). LSU Master's eses. 1529. hps://digitalcommons.lsu.edu/gradschool_theses/1529
Transcript of The MacArthur-Bates Communicative Development …...The purpose of this study was to examine the...

Louisiana State UniversityLSU Digital Commons
LSU Master's Theses Graduate School
2006
The MacArthur-Bates CommunicativeDevelopment Inventory as an assessment tool forlow-income, African American childrenElizabeth Waters WoodenLouisiana State University and Agricultural and Mechanical College, [email protected]
Follow this and additional works at: https://digitalcommons.lsu.edu/gradschool_theses
Part of the Communication Sciences and Disorders Commons
This Thesis is brought to you for free and open access by the Graduate School at LSU Digital Commons. It has been accepted for inclusion in LSUMaster's Theses by an authorized graduate school editor of LSU Digital Commons. For more information, please contact [email protected].
Recommended CitationWooden, Elizabeth Waters, "The MacArthur-Bates Communicative Development Inventory as an assessment tool for low-income,African American children" (2006). LSU Master's Theses. 1529.https://digitalcommons.lsu.edu/gradschool_theses/1529

THE MACARTHUR-BATES COMMUNICATIVE DEVELOPMENT INVENTORY
AS AN ASSESSMENT TOOL FOR
LOW-INCOME, AFRICAN AMERICAN CHILDREN
A Thesis
Submitted to the Graduate Faculty of the Louisiana State University and
Agricultural and Mechanical College in partial fulfillment of the
requirements for the degree of Master of Arts
in
The Department of Communication Sciences and Disorders
by Elizabeth Waters Wooden
B.A., Louisiana State University, 2004 May 2006

ii
ACKNOWLEDGMENTS
Dr. Janna Oetting… I sat in your class as an undergraduate student and discovered the
field of speech language pathology. Your guidance throughout writing this thesis has allowed
me to gain an enormous amount of knowledge and enjoy the research process. You are a true
mentor, and I promise to always build on what you’ve taught me.
Dr. Hugh Buckingham and Dr. Jan Norris… thank you for being on my thesis committee.
Your input was invaluable. Dr. Buckingham, we’ve been pals since the good old days over in
Coates. Thank you for imparting to me all your wisdom and for allowing me to experience being
a teaching assistant. Dr. Norris, the LLD after school program was an unbelievable introduction
into the clinical world. I learned so much from you and from all those children.
Mrs. Shannon Farho… I am grateful for all the background work that you and many
student clinicians completed in order to obtain the CDI inventories. Without them, my project
wouldn’t exist.
Mrs. Natalie Overall… through a tough first year and a pair of theses, we’ve made it.
Thank you for help with this project and for sharing so much knowledge with me. I am so glad
to have you as a colleague and a friend.
Mom, Dad, Kate, and T.H… you raised me to believe that I could do anything I set my
mind to. It’s a good thing I’m so hardheaded! You’ve all been my role models since the day I
was born; thanks for always leading me in the right direction.
Scott… you made me realize years ago that the goal in life is to have a positive impact on
others. You exemplify the “I’m Third” motto. I am so lucky to have your love and support
while I pursue my dreams. Your patience is amazing. Here’s what those late nights on the
computer were all about.

iii
TABLE OF CONTENTS
ACKNOWLEDGMENTS……………………………………...…………………………….. ii
LIST OF TABLES……………………………………………………………………………. v
LIST OF FIGURES…………………………………………………………………………... vii
ABSTRACT…………………………………………………………………………………... viii
CHAPTER 1. INTRODUCTION……………………………………………………………. 1 Relationship between Socioeconomic Status and Early Language Acquisition….…….. 2 The CDI as an Assessment Tool….…………………………………………………….. 5 Validity of the CDI….……………………...…………………………………………... 9 Validity of the CDI with Low-Income Children…………….………………………….. 13 Purpose of Research……...……………………………………………………………... 19 Predictions……………………………………………………………………………… 19
CHAPTER 2. METHODS…………………………………………………………………. 21 Participants……………….……………………………………………………………... 21 Procedure……………………………………………………………………………...... 23 Data Coding…………….………………………………………………………………. 23 Reliability…….…………………………………………………………………………. 24
CHAPTER 3. RESULTS……………………………...……………………………………... 25 Preliminary Analysis …….……………………………………………………………... 25 CDI Distribution Relative to the Normative Database…………………………………. 26 CDI Scores as a Function of Age……………………………………………………….. 27 CDI Scores as a Function of Gender……………………………………………………. 33 CDI Scores as a Function of Birth Order…..…………………………………………… 34 CDI Scores as a Function of Maternal Education………………………………………. 35 Item and Subsection Analysis…………………………………………………………... 37
CHAPTER 4. DISCUSSION………………………………………………………………… 41 Interpretation of Results………………………………………………………………… 41 Comparison of Findings to Previous Work…………………………………………….. 43 Limitations of the Study………………………………………………………………… 44 Implications of Research and Suggestions for Future Studies…………………………. 45
REFERENCES………………………………………………………………………………... 48
APPENDIX A. NUMBER OF CHILDREN BY AGE AND GENDER IN THE ORIGINAL AND
UPDATED SAMPLES: CDI/WG…………………………………………...……..
51

iv
B. NUMBER OF CHILDREN BY AGE AND GENDER IN THE ORIGINAL AND UPDATED SAMPLES: CDI/WS……...…………………………………………...
52
C. DEMOGRAPHIC PROFILES OF THE ORIGINAL AND UPDATED CDI NORMATIVE SAMPLES………………………………………………………......
53
D. SCORING PROCEDURES FOR THE CDI/WG AND CDI/WS FROM FENSON ET AL. (1993)…………………………………...…………………………………..
54
E. RELIABILITY INFORMATION………………...…………………………………
56
F. CDI/WG VOCABULARY CHECKLIST ITEM ANALYSIS………...……………
57
G. CDI/WS VOCABULARY CHECKLIST ITEM ANALYSIS……...……………… 68
VITA…..……………………………………………………………………………………… 85

v
LIST OF TABLES
1.
Speech and Language Measures by Maternal Education (Dollaghan et al., 1999)..…... 5
2.
CDI Measures of Vocabulary and Sentence Complexity in Low- and Middle- Income Samples from Arriaga et al. (1998)…………………………………………….………
15
3.
CDI Percentage of Low- and Middle-Income Samples Reported to be Combining Words from Arriaga et al. (1998)………………………………………………………
15
4.
CDI Raw Scores and CDI Percentile Scores from Roberts, Burchinal, and Durham (1999)…………………………………………………………………………………..
17
5.
CDI Scores in Two Samples from Fenson et al. (1993) and Feldman et al. (2000)…... 18
6. Participant Characteristics……………………………………………………………...
22
7. CDI/WG and CDI/WS Percentile Scores………………………………………………
25
8. Distribution of CDI Percentile Scores………………………………………………….
26
9. CDI/WG Raw Scores as a Function of Age in Months………………………………...
27
10. CDI/WG Data for T-Test Analysis of Age…..………………………………………...
27
11. CDI/WG Percentile Scores as a Function of Age in Months…………………………..
28
12. CDI/WG Data for Mann-Whitney U Analysis of Age…...…………………………….
28
13. CDI/WS Raw Scores as a Function of Age in Months………………………………...
29
14. CDI/WS Data for T-Test Analysis of Age..…………………………………………...
29
15. CDI/WS Percentile Scores as a Function of Age in Months…………………………...
30
16. CDI/WS Data for Mann-Whitney U Analysis of Age…..……………………………..
30
17. Pearson’s Correlations with Age……………………………………………………….
31
18. CDI/WG and CDI/WS Percentile Scores as a Function of Gender……………………
33
19. CDI/WG and CDI/WS Percentile Scores as a Function of Birth Order………………..
34
20. CDI/WG and CDI/WS Percentile Scores as a Function of Maternal Education………
36

vi
21. CDI/WG and CDI/WS Data for Mann-Whitney U Analysis of Maternal Education……………………………………………………………………………….
37
22. Item Analysis by CDI/WG Subsection…………………….. …………………..……..
38
23. Item Analysis by CDI/WS Subsection..………………………. ………………………
40
24. Comparison of Mean Percentile Scores (Arriaga et al., 1998)…………………..……. 43

vii
LIST OF FIGURES
1. Correlation between Age and Words Produced Raw Scores…………………………..
32
2. Correlation between Age and Words Produced Percentile Scores……………………. 32

viii
ABSTRACT
The purpose of this study was to examine the usefulness of the MacArthur- Bates
Communicative Development Inventory (CDI) as an assessment tool for low-income, African
American (AA) children. The data were from eighty-seven typically developing AA children,
aged 8 to 30 months; these children were recruited from childcare centers that served low-
income populations in Baton Rouge, Louisiana. Each participant’s primary caregiver completed
a biographical sketch and a CDI inventory. Two analyses were completed. The first analysis
examined the distribution of the CDI scores relative to the child’s age, gender, birth order, and
level of maternal education. The second analysis involved examination of the subsections and
items of the vocabulary checklist sections of both versions of the CDI.
For the first analysis, the children’s percentile scores were found to be normally
distributed. Raw scores on the CDI were also found to increase with the children's ages, and a
moderate correlation between CDI raw scores and age was identified. First-born children
exhibited higher levels of expressive language than their later-born peers. Additionally,
significant group differences were found between males and females on sections of the CDI
Words and Gestures inventory, but the direction of the main effects varied across sections.
Group differences were not significant for level of maternal education, but a restricted range of
educational levels may have contributed to this finding.
For the second analysis, results indicated that every item (except basement) from each of
the vocabulary sections was comprehended and/or produced by one or more of the children.
Sections with the greatest number of marked items included the Sound Effects and Animal
Sounds and Games and Routines. Together, these results indicate that the CDI can be considered
a useful tool for assessing the early language development of low-income, AA children.

1
CHAPTER 1 INTRODUCTION
Throughout her two years in the speech pathology master’s program, Catherine
experienced a wide variety of clinical practica. One of these experiences was with Early Steps,
Louisiana’s assessment and intervention program for children under the age of three years. This
placement increased her interest in early intervention and provided her with experience treating
children in the earliest stages of language development. At commencement, Catherine accepted
a position with a well-known provider of early intervention within the city.
Within the first week, Catherine knew she had chosen a job that ideally suited her
interests and skills. Given that her caseload consisted of primarily low-income, African
American (AA) children, she also knew she would need to select assessment tools that were
culturally appropriate for this type of child profile. As she prepared for evaluations, Catherine
pulled out the MacArthur-Bates Communicative Development Inventory (CDI). In graduate
school, she had learned that the CDI was a widely used tool capable of measuring a variety of
features in early language development. As she read through the manual, she questioned if this
tool was appropriate for the specific population she was serving. The literature suggested that
AA children from low-income families were at risk for misidentification due to differences in
their experiences and knowledge about the world when compared to children from middle-
income families (Seymour, Bland-Stewart, & Green, 1998). Would the CDI be an appropriate
component in the assessment battery she was developing for her low-income, AA caseload?
In response to Catherine’s dilemma and similar experiences of clinicians across the
nation, this study is designed to examine the utility of the CDI to assess the early language
development of low-income, AA children. The literature review for this study is organized into
four sections. First I review research that has documented the relationship between

2
socioeconomic status and early language acquisition. Secondly I describe the nature and format
of the CDI as an assessment instrument for early receptive and expressive language skills. The
third section contains a body of work that has established the CDI as a valid tool for the
assessment of typically developing and developmentally delayed children. The final section of
literature focuses on prior research that has specifically examined the validity of the CDI with
low-income populations. As will be shown, very little research has examined the usefulness of
the CDI for low-income, AA children.
Relationship between Socioeconomic Status and Early Language Acquisition
Many studies throughout the years have examined the effects of socioeconomic status on
the development of early childhood language. Some of these studies have used occupation as a
measure of socioeconomic status, while others have used level of maternal education.
Regardless, all of the research indicates that low-income children have less opportunity to
experience interactions which support language development than their middle- or upper-income
peers (Dollaghan, Campbell, Paradise, Feldman, Janosky, Pitcairn, & Kurs-Lasky, 1999; Hart &
Risley, 1995). Low-income children have also been found to have lower levels of receptive and
expressive language when they enter school (Elardo, Bradley, & Caldwell, 1977; Hart & Risley,
1995; Hoff-Ginsberg, 1991; Wallace, Roberts, & Lodder, 1998). Three of these studies are
reviewed to illustrate these findings.
Hart and Risley (1995) identified striking differences in the early childhood experiences
of children from different socioeconomic (SES) backgrounds. Forty-two families were part of
their three-year longitudinal study, and the data were caregiver-child language samples that were
collected in the children’s homes. On the basis of occupation, thirteen families were classified as

3
upper SES; ten were classified as middle SES; and thirteen were classified as lower SES, with
six of these families receiving federal aide.
Results of this study indicated that the frequency and diversity of words spoken to the
children varied depending on level of family income. For example, parents in upper SES
households spent an average of 48 minutes per hour interacting with their children at 24 to 25
months of age, while the lower SES family spent an average of only 17 minutes per hour
engaged in interaction with their children. Not only was the amount of time that parents spent
interacting with their children different across households, but the amount of language they
offered to their children also differed. Parents in upper SES families spoke an average of 487
utterances per hour to their children in contrast to an average of 178 utterances spoken to the
children by the lower SES families. The quality of the mother-child interaction also differed
across the groups. Upper- and middle-income families presented language considered to be
richer including more total words and a wider variety of language such as nouns, past tense
verbs, declarative sentences, and affirmative feedback than parents in low-income households.
Along with assessing children’s language environment and varying levels of language
exposure in the early years of development, Hart and Risley (1995) also examined the children’s
vocabulary production and growth over time. The effect of increased early exposure to language
was evidenced by the fact that when the children were 36 months, those from upper SES
households were found to have larger vocabularies (1,000 to 1,200 words) than those from low
SES households (400 to 600 words). A widening gap in vocabulary production could be seen as
early as 24 months of age.
Another study completed by Hoff-Ginsberg (1991) investigated the effects of both social
class and communicative setting on mothers’ interactions with their children. Mother-child

4
interaction was observed in the homes of 33 middle class and 30 working class families with
children ranging in age from 18 to 29 months. Each mother-child dyad was videotaped in four
settings: mealtime, dressing, book reading, and toy play. Some of the maternal language
measures examined included number of utterances, utterances per minute, number of roots, mean
length of utterance, and number of conversation eliciting utterances.
Mothers from the middle class homes produced a larger number of utterances than
working class mothers (258 vs. 215), and middle class mothers used utterances that elicited
conversations more often than the working class mothers (33.7 vs. 29.6). Mean length of
utterance was found to be very similar between the two groups though working class mothers
more often used utterances to direct their children’s behavior (22.3 vs. 15.8). This study
documented the existence of significant social class differences in the mother’s child-directed
speech. Results indicated that some class differences in child-directed speech might reflect
broad differences in the interaction styles of different social classes rather than a direct result of
poverty.
Finally, Dollaghan, Campbell, Paradise, Feldman, Janosky, Pitcairn, and Kurs-Lasky
(1999) designed a study to determine the effect of maternal educational level on children’s
spontaneous speech and language skills. Three levels of maternal education were examined: less
than high school graduate, high school graduate, and college graduate. The children’s language
was examined with four expressive language measures obtained from a spontaneous speech
sample and one measure of language comprehension obtained from the Peabody Picture
Vocabulary Test- Revised.
Results from this study are shown in Table 1. Analysis showed statistically significant
group differences as a function of educational levels for mean length of utterance in morphemes,

5
total number of different words, total number of words, and the receptive measures obtained
from the standardized tool. For example, children of mothers with less than a high school
education were found to produce fewer total words (454 vs. 533) and fewer different words (118
vs. 183) than children of mothers with some college experience. The only measure that did not
show a group effect was percentage of consonants correct.
Table 1 Speech and Language Measures by Maternal Education (Dollaghan et al., 1999)
Maternal Educational Level
Measure < High School High School College MLUm 2.73 2.97 3.29 NDW 118 141 183 TNW 454 501 533 PCC 78 80 81
PPVT-R 90 101 110
Note. MLUm = mean length of utterance in morphemes; NDW = number of different words; TNW = total number of words; PCC = percentage of consonants correct; PPVT–R = Peabody Picture Vocabulary Test–Revised standard score.
These three studies show that the language environment of low-income children is very
different from that of upper- and middle-income children. When compared to middle- and
upper-income mothers, those from low-income households were found to spend less time talking
to their children, expose their children to fewer different words, and use more prohibitions and
directive utterances with their children. Results indicated that children from low-income
households also produce shorter utterances and use fewer vocabulary words than their upper- and
middle-income peers.
The CDI as an Assessment Tool
The MacArthur-Bates Communicative Development Inventory (Fenson, Dale, Reznick,
Thal, Bates, Hartung, Pethick, and Reilly, 1993) is a nationally recognized parent report
instrument used to assess the early language development of children. The test manual indicates
that the CDI may be used to identify children at risk for a language delay, target specific

6
communicative skills for intervention, monitor results of treatment, screen and preselect children
at different levels of language development for participation in research studies, and examine the
influence of other variables on language development (Fenson, Dale, Reznick, Bates, Thal, &
Pethick, 1994). Because of the tool’s broad range of utility, the CDI now has versions available
in many languages (Bates, Caselli, & Casadio, 1990; Camaioni, Caselli, Longobardi, & Volterra,
1990; Jackson-Maldonado, Thal, Marchman, Bates, & Gutierrez-Clellen, 1993; Ogura &
Murase, 1991).
A compilation of more than twenty years of research served as the precursor to the
development of the current version of the CDI. By the late 1980s, the early version of the
instrument consisted of four forms: the Communicative Development Questionnaire (8-12
months), the Language and Gesture Inventory (12-18 months), the Early Language Inventory
(18-27 months), and the Grammatical Development Questionnaire (24-36 months). Preliminary
normative studies completed from 1987 to 1988 led to the modification of these four instruments
into the two inventories that exist today.
The CDI consists of two separate inventories: the CDI/Words and Gestures (CDI/WG)
for children 8 to 16 months and the CDI/Words and Sentences (CDI/WS) for children 16 to 30
months. Both of the versions allow parents to report on their child’s ability in several
components of language development and yield raw scores and percentile rankings for each of
the test components. The following is a detailed description of the two versions of the CDI.
The CDI/WG for 8- to 16-month-old children is composed of two major parts. Part I
contains a series of questions followed by a comprehensive vocabulary checklist. The first
section has three questions that focus on whether the child is responsive to language. The second
section asks the parent to identify phrases (from a list of 28 items) that the child understands.

7
The third section includes two questions concerning the child’s frequency of imitating words and
labeling objects. The major portion of Part I is a 396-item vocabulary checklist that is divided
into 19 semantic categories. Ten of the categories relate to nouns: animal names, vehicles, toys,
food and drink, clothing, body parts, furniture and rooms, small household items, outside things
and places to go, and people. The remaining seven categories are sound effects and animal
sounds, games and routines, verbs, adjectives, pronouns, question words, prepositions and
locations, quantifiers, and words about time. Parents identify items that the child understands
(receptive language) and items that the child understands and produces (expressive language).
Part II of the CDI/WG focuses on the child’s use of actions and gestures in order to
provide a more comprehensive evaluation of early communicative skills. The 63 gestures are
organized categorically into six sections. Section A “First Communicative Gestures” includes
items that signal the beginning of children’s intentional communication. Section B “Games and
Routines” contains items which help build a social interactive basis for communication. Section
C “Actions with Objects” and Section E “Imitating Other Adults Actions” assess the child’s
growing understanding of objects and their appropriate use. Items from Section D “Pretending
to be a Parent” are some of the first true types of symbolic gestures often used by children.
Section F determines if the child has begun to use imaginative play and asks the parent to
provide specific examples of the child making pretend substitutions during play. This section
provides supplementary qualitative information.
The CDI/WS for 16- to 30-month-old children also contains two parts. Part I is a 680
word vocabulary production checklist which is divided into 22 semantic categories. The
following eleven categories relate to nouns: animals, vehicles, toys, food and drink, clothing,
body parts, small household items, furniture and rooms, outside things, places to go, and people.

8
Additional categories include games and routines, verbs, adjectives, words about time, pronouns,
question words, prepositions and locations, quantifiers and articles, helping verbs, and
connecting words. Following the checklist are five questions regarding the child’s use of
decontextualized language including reference to the past, future, and absent objects and events.
Part II of the CDI/WS assesses morphological and syntactic development using 125 items
organized into five sections. Three of the sections assess the production of regular and irregular
bound morphemes such as plural –s, possessive –‘s, progressive –ing, past –ed, irregular plural
nouns, irregular past tense verbs, and over-regularized plural nouns and past tense verbs. The
final two sections of the inventory focus on multiword utterances. One of these sections is a
forced choice format that requires the parent to choose which member in each of 37 sentence
pairs characterizes the syntactical form their child most often uses. The final section asks the
parent to record three of the child’s longest utterances and provides qualitative information
similar to the final section of the CDI/WG form.
Detailed information on age, gender, and demographic profiles of the original and revised
normative samples for the CDI are seen in Appendices A, B, and C. Original normative data for
the inventories came from 1,789 children recruited from sites in New Haven, Seattle, and San
Diego. The original normative sample included a total of 659 CDI/WG inventories and 1,130
CDI/WS inventories. More recently, test developers have been working to update the normative
data for the CDI in an attempt to increase its utility for children from diverse family
backgrounds. Though the new normative data are not yet published, the percentile scores of the
sample are available on the test developers’ website. The updated sample includes a total of
2,252 inventories, 1,089 CDI/WG and 1,463 CDI/WS. As seen in Appendix C, the updated
normative data contains increased percentages of minority children and caregivers with lower

9
levels of education. This current dataset better reflects the current demographics of the United
States population.
Validity of the CDI
Given that the CDI is a tool that is used for both clinical and research purposes, numerous
studies have been completed in order to document its concurrent and predictive validity. Five
research studies that have examined the ability of the CDI to effectively characterize the early
language skills of children who are typically developing and who are developmentally delayed
are reviewed in this section (Dale, 1991; Dale, Bates, Reznick, & Morriset, 1989; Heilmann,
Weismer, Evans, & Hollar, 2005; Miller, Sedey, & Miolo, 1995; Thal, O’Hanlon, Clemmons, &
Fralin, 1999).
Dale et al. (1989) published research on the validity of the Early Language Inventory, an
early version of the CDI. Several special populations including high social risk, preterm, full
term, and precocious children were included in the study. The Early Language Inventory and
direct measures of language skills adapted from the Bayley Scales of Infant Development
(Bayley, 1969) were administered to children at 20 months of age. The study showed significant
correlations between the Part 1: Vocabulary Checklist of the inventory and the expressive
language subscore of the Bayley Scales of Infant Development (r ranged from .43 to .63). A low
relationship between vocabulary and SES was also noted, suggesting the possible utility of the
Early Language Inventory across a wide range of social classes.
Dale (1991) completed a more detailed study of the CDI comparing the use of the parent
report measure to both structured and naturalistic forms of assessment in determining the
vocabulary and syntactic development of 24-month-old typically developing children (N= 24).
The CDI measures of total vocabulary, total complexity, mean of three longest utterances, and

10
use of regular morphemes were involved in two comparisons. First the CDI measures were
compared to standardized tests including the Expressive One-Word Picture Vocabulary Test and
the Memory for Sentences subtest of the Stanford-Binet Intelligence Scale IV. When comparing
the CDI and the Expressive One-Word Picture Vocabulary Test, results indicated a moderately
strong correlation with total expressive vocabulary (r = .73) and a moderate correlation with
three of the syntax measures. These included total complexity, mean of three longest utterances,
and use of regular morphemes (r ranged from .50 to .54). Correlations were also moderately
strong for measures of total vocabulary, total complexity, and use of regular morphemes of the
CDI and the Memory for Sentences subtest of the Stanford-Binet Intelligence Scale IV, r = .75,
.66, and .75 respectively.
The CDI measures were then compared to a language sample which yielded measures of
mean length of utterance, vocabulary type-token ratio, total number of different words, the Index
of Productive Syntax, and regular bound morpheme use. Results indicated moderately strong
correlations of all the CDI measures with total number of different words, mean length of
utterance, and Index of Productive Syntax (r ranged from .60 to .79). Significant correlations
were also found for the CDI measures with vocabulary type-token ratio and regular bound
morpheme use (r ranged from .38 to .58). Together these findings indicate that the CDI
measures of vocabulary and syntactic development are related to both structured and naturalistic
forms of assessment for typically developing two-year-olds. In contrast, a negative correlation
of the pronominal reference portion of the CDI with all language sample measures was found (r
ranged from -.33 to -.51). This finding suggests a weakness in the pronominal reference section,
and modification of this component of the CDI is ongoing (Dale, 1991).

11
The following three studies were important to the validation of the CDI for children with
developmental disabilities. The rationale behind this research took into consideration that
parents are often informed at birth that their child is developmentally disabled and at risk for
compromised development. Researchers questioned whether parents of developmentally
disabled children would exhibit lower expectations of their children’s development and therefore
underestimate their children’s ability during parent report measures. If this hypothesis were
found true, then the CDI would be less useful in the assessment of this population (Miller, 1988).
A study by Miller, Sedey, and Miolo (1995) included 44 children with Down syndrome
and 46 typically developing children with mental ages ranging from 12 to 27 months.
Concurrent validity was examined by comparing results from the vocabulary checklist of the
CDI to the number of different words spontaneously produced during a thirty-minute language
sample and the number of expressive language items passed on the mental scales of the Bayley
Scales of Infant Development. Significant correlations between parent report vocabulary and the
two validation measures were obtained for both of the subject groups (r ranged from .70 to .82).
Predictive validity of the CDI was also examined by comparing children’s scores at 20 and 28
months. Results indicated that the children’s vocabulary checklists at the two ages were
moderately correlated (r = .63).
Thal et al. (1999) also tested the validity of the CDI to measure vocabulary and syntax for
another special population, preschool children with language impairment. The study included
twenty children 39 to 49 months of age with an identified language delay. The children with
specific language delay were older than the normative data for the CDI but had language levels
that fell within the range measured by the CDI. Scores on the CDI/WS were compared to
behavioral measures including the Expressive One-Word Picture Vocabulary Test, a subset of

12
the Stanford Binet Intelligence Scale, and a spontaneous language sample. Results indicated
moderate to strong correlations between parent report and behavioral measures of the children’s
vocabulary and syntax (r ranged from .52 to .86).
Finally, Heilmann, Weismer, Evans, and Hollar (2005) examined the utility of the CDI to
identify the language abilities of 38 late-talking toddlers. All parents completed the CDI/WS
when their children were 24 months of age, and then the children were directly assessed at 30
months of age along with parent completion of a second CDI. The direct assessment measures
were then compared to parent report measures obtained for the late talkers at 30 months of age,
and results supported earlier evidence suggesting that the CDI/WS is a valid tool to assess the
language skills of this age group. However, the correlations in this study were weaker and much
more variable than correlations in Miller et al.’s research (r = .38 to .67). Heilmann et al. (2005)
interpreted these findings as indicative of the restricted range of language abilities represented in
the late talkers in this study.
Taken together, these five studies combine to establish the CDI as an effective tool for
evaluating the language skills of children who are typically developing and children with
developmental delays whose language level falls within the 8- to 30-month-old level. This is the
age range at which the CDI normative data has been based.
Only one study has examined the validity of the CDI at the item level. This study was by
Bryant (2003). Her study focused on a subset of items on the CDI (i.e. specifically those related
to tense marking). The study included 18 two-year-old children, 12 of which were at risk for
specific language impairment and 6 of which had low average language development. CDI/WS
inventories were collected from the children’s parents, and two 20-minute language samples
from the children were recorded for analysis. Eight items from the Helping Verb section of the

13
CDI/WS and one item from the word endings section of Part I on the CDI/WS were classified as
reflecting early emergence of tense marking (i.e. am, are, did/didya, do, does, is, was, were). Six
items from the Sentence Complexity section of Part II on the CDI/WS were classified as
reflecting more advanced marking of tensing (i.e. auxiliary BE, copula BE, auxiliary DO, regular
past tense –ed). Then, both the emerging and more advanced tense markers recorded by parents
on the CDI/WS were compared to measures of tense marking recorded in the children’s language
samples.
Results of the study revealed that parent report of emerging tense markers on the
CDI/WS was moderately to highly correlated with language sample measures (r= .65, p= .002).
Additionally, CDI/WS parent report of the more advanced marking of tensing was moderately
correlated with measure from the language samples (r= .57, p= .007). These findings indicate
that the CDI/WS may be an effective tool for evaluating the emergence of tense marking, which
some argue may be important in the differential diagnosis of children with specific language
impairment and children with typical language development (Rice, 2003; 2004).
Validity of the CDI with Low-Income Children
Because of the noted effects of socioeconomic status on a child’s environment and early
development of language, research has also focused on examining the utility of various
standardized tests for sociodemographically diverse populations. A caution regarding the use of
the CDI with low-income minority samples is cited in its manual (Fenson et al. 1993).
According to the 1990 Bureau of Census figures, the demographic profile for people 18 to 34
years of age indicated that 23.2% had educational levels lower than a high school diploma, but
only 4.5% of the normative sample for the CDI had educational levels this low. Likewise, 13%
of people ages 18 to 34 years in the United States in 1990 were AA, yet only 4% of the

14
normative population for the CDI were from families who identified themselves as AA. Because
of these statistics and the advised caution by the developers of the CDI, the validity of the CDI
for low-income samples needs to be examined. Three studies have examined this issue (Arriaga,
Fenson, Cronan, and Pethick, 1998; Feldman, Dollaghan, Campbell, Kurs-Lasky, Janosky, &
Paradise, 2000; Roberts, Burchinal, & Durham, 1999).
Arriaga, Fenson, Cronan, and Pethick (1998) compared CDI scores of children from low-
and middle-income families. The CDI scores for the 103 low-income children were collected,
and the middle-income sample (N=309) was drawn from the CDI normative study. The middle-
income sample was matched to the low-income sample for age and gender. The CDI measures
of vocabulary, sentence complexity, and combining sentences for the two samples were analyzed
using a group comparison design.
Results from this study are presented in Tables 2 and 3. As shown in Table 2, low-
income children scored lower than the middle-income sample on vocabulary and sentence
complexity. CDI measures of vocabulary revealed a mean percentile score for the low-income
group of 29.74 and a mean percentile score for the middle-income sample of 50.04. Similarly,
the percentile score for sentence complexity for the low-income children was significantly lower
than those of the middle-income sample (31.15 vs. 51.69). In other words, CDI measures of
vocabulary and sentence complexity revealed an overall effect of SES resulting in a negative
shift of the entire low-income distribution of about 20%. As shown in Table 3, percentile scores
for children reported to be combining words increased irregularly, possibly as a result of the low
number of children in each age category. Nevertheless, the overall pattern of children reported
to be combining words appeared to be accelerated in the middle-income sample. These findings

15
highlight the importance of Fenson et al.’s (1993) caution against using the CDI for low
education/ low-income samples.
Table 2 CDI Measures of Vocabulary and Sentence Complexity in Low- and Middle- Income Samples from Arriaga et al. (1998)
Vocabulary
Sentence Complexity
N Percentile M (SD)
N Percentile M (SD)
Low-Income
Girls Boys Combined
44 59
103
22.82 (20.67) 34.90 (28.71) 29.74 (26.17)
30 35 65
17.67 (15.52) 42.71 (27.21) 31.15 (25.71)
Middle-Income
Girls Boys Combined
132 177 309
50.83 (27.90) 49.45 (26.51) 50.04 (27.08)
90 105 195
54.36 (27.47) 49.40 (25.16) 51.69 (26.30)
Table 3 CDI Percentage of Low- and Middle-Income Samples Reported to be Combining Words from Arriaga et al. (1998)
Age in Months Low-Income % Middle-Income % 16 0 (4) 25 (12) 17 33 (6) 50 (18) 18 0 (5) 40 (15) 19 29 (7) 75 (20) 20 71 (7) 81 (21) 21 33 (9) 85 (27) 22 57 (7) 81 (21) 23 86 (7) 86 (21) 24 80 (5) 93 (15) 25 89 (9) 96 (26) 26 100 (4) 92 (12) 27 70 (10) 100 (30) 28 100 (8) 100 (24) 29 100 (6) 100 (18) 30 100 (9) 100 (26)
Ns shown in parentheses.
Roberts, Burchinal, and Durham (1999) studied the validity of the CDI to accurately
measure vocabulary and grammatical development in 87 AA children. The children’s mothers’
mean maternal education level was 12.4 years; 69% of the families were from low-income
households. A shortened version of the CDI/WS instrument was administered at 18, 24, and 30

16
months of age to record measures of expressive vocabulary, irregular nouns and verbs, and
maximum sentence length. A battery of other standardized language tests was also administered
in order to track the children’s development of vocabulary and grammar between one and three
years of age. The final measure involved the Home Observation for Measurement of the
Environment Inventory for Infants, a tool used to assess various features of an infant’s home
environment (Caldwell & Bradley, 1984).
The study found that children’s raw scores on the CDI increased linearly with age.
Additionally, girls were found to use longer utterances than boys and more irregular forms.
However, percentile scores decreased as age increased resulting in percentile scores considerably
below the mean at 30 months of age (See Table 4). According to the authors, these results could
be attributed to a variety of factors. As children get older, language assessment instruments may
not measure their vocabulary as well as when they were younger. The authors also noted the
possibility that mothers may be underreporting their children’s vocabulary at 30 months of age.
The authors interpreted these results indicating that CDI percentile scores should be used
cautiously with samples of AA kids from predominantly low-income families (Roberts et al.,
1999).
Finally, Feldman and colleagues (2000) examined the measurement properties of the CDI
with a large sociodemographically diverse sample of one- and two-year-olds (N= 2,156). This
study was completed in Pittsburgh. Twenty percent of the participants were AA, and 42%
received Medicaid benefits. The CDI/WG was administered to children aged 10 to 13 months,
and the CDI/WS was administered to children aged 22 to 25 months. Each inventory was scored
and subsequently analyzed based on developmental trends and sociodemographic associations.

17
Table 4 CDI Raw Scores and CDI Percentile Scores from Roberts, Burchinal, and Durham (1999)
Age in Months
18 24 30
Number of vocabulary wordsa Percentile Score M (SD) 53.1 (30.7) 45.4 (27.3) 26.8 (30.8) Number of vocabulary wordsb Percentile Score M (SD) 61.3 (26.5) 52.4 (27.4) 34.3 (34.6) Number of irregular nouns and verbsa Percentile Score M (SD) 67.7 (21.1) 54.8 (24.2) 30.8 (23.6) Number of irregular nouns and verbsb Percentile Score M (SD) 72.5 (20.3) 58.0 (24.9) 34.0 (27.2) a Results including all children in the study. b Results omitting questionably high or low scores in the study.
Results from the study are presented in Table 5. Also included are comparative data from
the original norming of the CDI by Fenson et al. (1993). In the Pittsburgh study, each of the
continuous scale scores of the CDI was found to increase with age in months except for sentence
complexity scores. The scaled scores for subtest were found to slightly decrease between 24 and
25 months (10.2 vs. 9.8). Naming/labeling reported on the CDI/WG and in plural, progressive,
and past tense morphosyntactic forms reported on the CDI/WS also increased linearly with age.
Nevertheless, a great deal of variation in the children’s scores was noted, which can be seen in
elevated measures of the standard deviations. Age was found to be the only sociodemographic
factor that contributed significantly to scores on every section of the CDI/WG. For the CDI/WS,
girls were found to have higher mean scores than boys on all five sections of the inventory.
Therefore, age and gender were the two demographic factors that were significant for the two
versions of the CDI.
These findings sparked a debate among researchers in the field on how to best interpret
these data. Feldman et al. (2000) suggested that correlations among CDI continuous scale scores
and certain sociodemographic groups, though found to be inconsistent, served as an indication

18
that different scales of the CDI could be susceptible to differential reporting biases in varying
populations. Fenson, Bates, Dale, Goodman, Reznick, and Thal (2000) responded to Feldman’s
work by stating that the mean scores and standard deviations of the two studies were similar with
both showing trends of linear increase according to age in months. Fenson et al. (2000) also
suggested that the highly variable means and standard deviations of the CDI are reflections of
individual differences and high variability in early language development rather than being
reflections of insufficient measurement properties of the CDI.
Table 5 CDI Scores in Two Samples from Fenson et al. (1993) and Feldman et al. (2000)
Age in Months
CDI/WG 10 11 12 13
Phrases Understood Norming study Pittsburgh study
11.5 (6.7) 14.0 (6.3)
13.3 (5.8) 15.0 (6.4)
15.5 (5.6) 16.0 (6.4)
17.6 (6.5) 17.4 (6.2)
Vocabulary Comprehension Norming study Pittsburgh study
66.8 (60.2) 83.6 (68.8)
78.4 (75.1) 92.3 (74.0)
86.4 (49.2) 105.0 (77.2)
121.8 (68.9) 119.0 (77.4)
Total Gestures Norming study Pittsburgh study
18.4 (8.2) 21.8 (8.1)
23.0 (8.0) 23.2 (8.8)
27.8 (9.9) 26.6 (9.2)
33.2 (11.1) 29.7 (9.5)
Age in Months
CDI/WS 22 23 24 25
Vocabulary Production Norming study Pittsburgh study
268.9 (167.3) 249.2 (165.8)
334.9 (156.8) 281.9 (178.5)
311.7 (173.7) 302.4 (172.8)
366.0 (161.0) 312.4 (168.9)
Mean Sentence Length Norming study Pittsburgh study
3.8 (1.9) 3.0 (1.6)
4.7 (2.2) 3.5 (1.9)
4.7 (2.7) 3.8 (1.9)
5.5 (2.7) 3.9 (1.9)
Sentence Complexity Norming study Pittsburgh study
6.4 (7.3) 8.7 (8.1)
10.5 (10.2) 9.2 (8.3)
9.1 (9.6) 10.2 (8.7)
11.4 (10.2) 9.8 (8.5)
In summary, research has shown that children from low-income households are exposed
to fewer words and lower levels of language in the first years of their lives. They also have
lower receptive and expressive vocabularies than their upper- and middle-class peers. The CDI

19
is a parent report instrument that is often used to assess the early receptive and expressive
language skills of children under the age of three years. In numerous studies, the CDI has been
validated as an assessment tool for children who are typically developing and developmentally
delayed. Few studies have been completed to examine the usefulness of the tool with
sociodemographically diverse samples. Those that have, however, suggest that the CDI should
be used cautiously with children from low education/ low-income households. Very limited
attention has been directed at the individual items on the tool.
Purpose of Research
The purpose of this study was to examine the utility of the MacArthur-Bates Communicative
Development Inventory for assessing the language development of low-income, African
American children in the urban South. Recall, this type of research is needed to help clinicians,
like Catherine, evaluate the utility of the CDI for low-income, AA children. The following
questions guided this research.
1. How do the CDI scores distribute relative to the normative database?
2. How do the variables of age, gender, and birth order affect the distribution of the
children’s scores?
3. How does level of maternal education affect the distribution of the children’s scores?
4. Are there particular items and/or subsections on the CDI that are unknown to the
children?
Predictions
For the first question, it was predicted that the CDI percentile scores of the low-income,
AA sample in the present study would fall below average scores reported in the CDI normative
sample. More specifically, an overall negative shift in the distribution of the low-income, AA

20
scores when compared to the normative data for the CDI was predicted. This prediction was
based on research by Arriaga et al. (1998). It was also predicted that the CDI raw scores of the
low-income, AA sample would increase linearly with age in months across the two inventories.
These predictions were based on research by Feldman et al. (2000) and Roberts, Burchinal, and
Durham (1999). The distribution of the children’s scores however was unknown.
For the second question, it was predicted that percentile scores might be negatively
correlated with age in months based on findings by Roberts, Burchinal, and Durham (1999). It
was also predicted that the girls’ scores would be higher overall than the boys’ scores based on
similar findings by Feldman et al. (2000) and Roberts et al. (2000). For question three, a positive
correlation of years of maternal education and CDI raw scores was predicted based on Dollaghan
et al. (1999). Finally, no prediction was made regarding the children's knowledge of items and
subsections of the CDI due to the lack of data in previous research.

21
CHAPTER 2 METHODS
Participants
Eighty-seven participants were recruited from parent training programs, childcare
centers, local clinics, and public hospitals that serve low-income populations in and around
Baton Rouge, Louisiana. Participants were identified for study eligibility using the following
inclusionary criteria:
1. An African American caregiver who had a normally developing child, aged 8 to 30
months, who had been raised in a monolingual English speaking environment.
2. A child who was delivered full term (> 38 weeks), weighed at least 5.7 pounds at
birth, and presented no reported hearing loss, no major birth or medical
complications, and no diagnosed developmental disabilities.
Caregivers were not eligible to participate if they previously completed a CDI form,
received services for substance abuse or addiction, received services for other mental health
conditions, and/or received special education services when in school. Maternal education level
at or below 12 years (high school graduate) was used as the predictor of low income based on the
research by Laosa (1980). Specifically, in this study, maternal education level was identified as
the principal socioeconomic factor affecting language development.
An overview of participant characteristics can be seen in Table 6. A total of 91
inventories were collected; however, data from four of the participants were excluded from the
study. These four participants were excluded because their ages fell outside of the normative
range for the CDI version they were given (2 were 18 months of age and given the CDI/WG and
2 were 31 months of age and given the CDI/WS inventory). Therefore, the sample for this study
included 87 participants. For these 87 participants, their mothers were asked to complete one of

22
two versions of the MacArthur-Bates Communicative Development Inventory. The CDI/WG
was utilized for children ages 8 to 16 months of age, and the CDI/WS was used for children 16 to
30 months of age.
Table 6 Participant Characteristics
Boys (n = 45)
Girls (n = 42)
Total (N = 87)
CDI Inventory Words and Gestures 17 14 31 Words and Sentences 28 28 56 Ethnicity Caucasian 0 0 0 African American 42 42 84 Other 2 0 2 Maternal Education < High school 21 22 43 High school graduate 15 13 28 High school graduate + 8 7 15 College graduate 1 0 1 Paternal Education < High school 15 16 31 High school graduate 19 13 32 High school graduate+ 3 7 10 College graduate 1 0 1 Birth Order First-Born 24 22 46 Later-Born 18 19 37
Note: “< High school graduate” indicates fewer than 12 years of education. “High school graduate” indicates 12 years of education. “High school graduate +” indicates 13 to 16 years of education. “College graduate” indicates 17+ years of education.
Thirty-one participants, 17 males and 14 females, completed the CDI/WG inventory; and
fifty-six participants, 28 males and 28 females, completed the CDI/WS inventory. Age in
months for the entire sample ranged from 8 to 30 months with a mean age of 19.37 (SD = 6.485).
In the sample, 87 participants provided information regarding level of maternal education, and
75 of the participants provided information regarding level of paternal education. Mean maternal
education was 11.59 years (SD = 2.003), and mean paternal education was 11.65 years (SD =
1.827). Levels of maternal and paternal education ranged from 7 to 18 years; however, 98% of

23
the participants’ years of education fell at or below 12 years. In the sample, 83 participants
provided information regarding birth order. A total of 55.4% of the sample were first-born
children, and the remaining 44.6% of the sample ranged from second- to fourth-born children in
the family.
Procedure
Caregivers completed all study requirements on-site in childcare centers in and around
Baton Rouge, Louisiana. Each caregiver was asked to provide written consent in order to
participate in the study. A biographical sketch including information about the caregiver and
child was completed prior to acceptance to the study. After meeting eligibility criteria, a version
of the MacArthur-Bates Communicative Developmental Inventory was provided to each
participant. A certified speech language pathologist obtained signed consent forms, determined
participant eligibility through evaluation of the basic information form, and oversaw the
administration of the CDI forms. Undergraduate and graduate level student clinicians also took
part in data collection. Each participant was compensated $5.00 for completing the study, and
the certified speech language pathologist was compensated $10.00 for each CDI obtained for the
study. Funding was made available through an external grant from the San Diego State
University Foundation.
Data Coding
Each parent inventory was hand scored by the author according to the procedure stated in
the testing manual (See Appendix D). The raw score for each child was converted to percentiles
for each major section of the inventory. Two sets of percentile scores were recorded based on
normative tables in the CDI technical manual (Fenson et al. 1993) and on new normative tables
received from one of the test developers V. A. Marchman (personal communication, October 10,

24
2005). All biographical information, raw scores, and percentiles were entered into SPSS for
statistical analysis.
Reliability
A second examiner was trained to score the CDI forms according to test manual
procedures. The second examiner independently coded 20% of the inventories, and the results
were compared to the author’s results. For the CDI/WG, agreement between the two sets of raw
scores was 99.97%, and agreement between the two sets of percentile scores was 95.24%. For
the CDI/WS, agreement between the two sets of raw scores was 99.92%, and agreement between
the two sets of percentile scores was 90.28%. Given the low level of error that was found, the
scoring of the entire data set was considered reliable. The raw data used to calculate reliability
can be found in Appendix E.

25
CHAPTER 3 RESULTS
Preliminary Analysis
In order to compare the current sample to the normative database, raw data from the CDI
inventories were converted into percentile scores. Percentile scores were recorded based on the
original CDI normative data from the test manual (Fenson et al. 1993) and on the updated
normative data received from V. Marchman (personal communication, October 10, 2005).
Recall, the recent renorming effort increased the number and diversity of participants (See
Appendices A, B, and C). The distribution of percentile scores relative to the normative
databases can be seen in Table 7. For the CDI/WG inventory, four percentile scores are listed,
and for the CDI/WS inventory, three percentile scores are listed.
Table 7 CDI/WG and CDI/WS Percentile Scores
Original CDI Percentile Scores
Updated CDI Percentile Scores
r
CDI/WG Phrases Understood 64.13 (25.87) 58.39 (26.97) .982 Words Understood 61.48 (27.29) 53.39 (28.55) .989 Words Produced 49.42 (38.45) 53.39 (27.31) .913 Total Gestures 65.40 (29.17) 54.30 (28.50) .969 CDI/WS Words Produced 36.52 (31.14) 40.07 (29.88) .997 Irregular 51.85 (27.16) 55.20 (26.30) .967 Sentence Complexity 50.17 (28.16) 57.93 (25.82) .968
Mean percentile scores for the whole sample ranged from 36.52 to 65.40. Visual
inspection of the CDI/WG revealed that updated percentile scores were lower than the original
percentile scores for each section except the Words Produced section. For the CDI/WS, the
updated percentile scores were higher than the original percentile scores in all three sections of
the inventory. In both cases, however, the differences between the original and updated scores
were smaller than the standard deviations obtained within each normative system. Pearson’s

26
correlations were run to compare the percentile scores from the original and updated normative
databases. Strong correlations were found for each set of original and updated percentile scores
(r ranged from .913 to .997, all p values < .01). Based on the findings, the updated set of
percentile scores were used for all subsequent analyses.
CDI Distribution Relative to the Normative Database
Table 8 provides descriptive information about the distribution of the CDI percentile
scores that were derived from the normative database. A typical bell curve contains a wide range
of scores with a median of 50 percent and with quartiles of 25 and 75 percent. Upon visual
inspection, the study sample contained a wide range of derived percentile scores ranging from 3
to 99 across both inventories. The median of the CDI/WG sections was slightly higher than
normal with a range of 53 to 60, and the quartile scores also closely approximated expected
percentiles. Additionally, the median and quartile scores for the Irregular and Sentence
Complexity sections of the CDI/WS indicated a distributional pattern that overlapped with the
normative sample. However, the CDI/WS Words Produced section mean and quartiles were
found to be below average.
Table 8 Distribution of CDI Percentile Scores
Percentiles Minimum
Maximum 25 50 75
CDI/WG Phrases Understood 13 99 35.00 55.00 80.00 Words Understood 3 99 26.00 53.00 76.00 Words Produced 5 99 35.00 55.00 75.00 Total Gestures 3 99 27.50 60.00 75.00 CDI/WS Words Produced 3 99 17.00 28.00 60.25 Irregular 13 99 31.00 57.50 75.00 Sentence Complexity 10 99 37.50 60.00 82.50

27
CDI Scores as a Function of Age
Table 9 shows the CDI/WG raw scores as a function of age in months. The CDI/WG
participants were first grouped into four age categories rather than being examined individually
by months. Table 9 illustrates that as children aged, raw scores on the CDI/WG increased.
However, large standard deviations were found in each section. To examine the variable of age,
the data were divided into two age groups, 8- to 11-month-olds and 12- to 16-month-olds.
Descriptive information about these two groups can be found in Table 10. Independent t-test
results revealed significant group differences for the Phrases Understood and the Total Gestures
sections of the CDI/WG; t(18)=3.12, p=.006 and t(28)=3.63, p=.001 respectively.
Table 9 CDI/WG Raw Scores as a Function of Age in Months
CDI/WG Section
8 months N = 5
10 months N = 8
12 months N = 7
14 months N = 11
Phrases Understood 10.60 (6.31) 13.87 (8.87) 19.43 (4.20) 20.82 (5.25) Words Understood 77.80 (81.17) 90.25 (126.23) 105.00 (56.53) 156.00 (99.48) Words Produced 1.00 (1.73) 33.25 (86.01) 7.86 (11.04) 47.64 (61.37) Total Gestures 15.20 (7.46) 21.25 (14.56) 31.17 (7.25) 36.00 (12.33)
Table 10 CDI/WG Data for T-Test Analysis of Age
CDI/WG Sections
8 to 11 months N = 13
12 to 16 months N = 18
Independent T-Test Results
Phrases Understood 12.62 (7.87) 20.28 (4.79) t(18)=3.12, p=.006* Words Understood 85.46 (107.38) 136.17 (87.20) t(29)=1.45, p=.158 Words Produced 20.85 (67.70) 32.17 (51.55) t(29)=.529, p=.601 Total Gestures 18.92 (12.31) 34.29 (10.82) t(28)=3.63, p=.001*
* indicates significance at the .05 level.
The CDI/WG percentile scores as a function of age can be seen in Table 11. Upon visual
inspection, percentile scores were found to decrease overall from the 8-month-old group to the
14-month-old group though variation is seen in the 10- and 12-month-old groups. A Mann-
Whitney U test was used for analysis of group differences. A Mann-Whitney U test is utilized
for data reflecting percentile ranks and evaluates differences in the medians between two groups
of data. This analysis examined the differences in medians of two age groups, 8- to 11-month-

28
olds and 12- to 16-month-olds. Table 12 provides descriptive information regarding each group.
Results revealed no significant group differences in percentile scores for any sections of the
CDI/WG.
Table 11 CDI/WG Percentile Scores as a Function of Age in Months
CDI/WG Section
8 months N = 5
10 months N = 8
12 months N = 7
14 months N = 11
Phrases Understood 67.60 (26.48) 56.25 (31.72) 64.00 (20.01) 52.18 (29.11) Words Understood 76.40 (17.63) 50.50 (31.55) 53.86 (24.10) 44.73 (30.35) Words Produced 64.00 (15.17) 59.88 (23.33) 43.71 (26.56) 50.00 (34.24) Total Gestures 63.40 (29.37) 50.38 (29.41) 63.00 (22.76) 48.27 (31.74)
Table 12 CDI/WG Data for Mann-Whitney U Analysis of Age
CDI/WG Sections
8 to 11 months N = 13
12 to 16 months N = 18
Mann-Whitney U Test Results
Phrases Understood 60.62 (29.22) 56.78 (25.98) z=.421, p=.674 Words Understood 60.46 (29.26) 48.28 (27.71) z =1.20, p=.229 Words Produced 61.46 (19.96) 47.56 (30.80) z =1.06, p=.288 Total Gestures 55.38 (28.91) 53.47 (29.05) z =.168, p=.867
Table 13 shows the CDI/WS raw scores as a function of age. The participants who
completed the CDI/WS inventory were first divided into seven age categories. Upon visual
inspection, Table 13 reveals that CDI/WS raw scores increase with age. Large standard
deviations were found for each section. This finding was also seen in the CDI/WG raw scores.
The raw scores were also examined by performing an independent t-test to look at group
differences. For this analysis, the CDI/WS raw scores were divided into two age groups, 16- to
23-month-olds and 24- to 30-month-olds. Individual group information can be seen in Table 14.
Results of this analysis revealed significant group differences for all three sections of the
CDI/WS: Words Produced, t(54)=2.77, p=.008; Irregular, t(52)=2.10, p=.040; Sentence
Complexity, t(31)=3.35, p=.002.

29
Table 13 CDI/WS Raw Scores as a Function of Age in Monthsa
CDI/WS Section
17 months
19 months
21 months
23 months
25 months
27 Months
29 months
Words Produced
82.13
(91.14) 8
199.40
(213.87) 10
220.75
(182.86) 8
225.25
(123.31) 4
225.62
(172.61) 8
359.00
(177.38) 14
308.50 (93.21)
4
Irregular Usage
1.57 (2.30)
7
5.30 (8.06)
10
3.75 (2.71)
8
4.00 (2.94)
4
5.00 (6.61)
7
7.64 (6.91)
14
8.50 (3.51)
4
Sentence Complexity
5.25 (5.74)
4
4.60 (5.18)
5
2.17 (2.79)
6
4.67 (2.08)
3
5.29 (6.24)
7
16.62 (11.36)
13
9.67 (14.22)
3
a First row number indicates M; second row indicates SD; and third row indicates N.
Table 14 CDI/WS Data for T-Test Analysis of Age
CDI/WS Sections
16 to 23 months N = 29
24 to 30 months N = 27
Independent T-Test Results
Words Produced 177.45 (174.35) 305.07 (170.14) t(54)=2.77, p=.008* Irregular 3.71 (5.26) 7.00 (6.21) t(52)=2.10, p=.040* Sentence Complexity 3.76 (4.13) 12.04 (11.08) t(31)=3.35, p=.002*
* indicates significance at the .05 level.
As shown in Table 15, the CDI/WS percentile scores ranged from 16.25 to 89.50. This is
a much wider range of variability than found in the CDI/WG percentile scores. CDI/WS
percentile scores were found to decrease slightly with age, and mean percentile scores for the 29-
month-olds were considerably low in all three sections of the inventory (M = 16.25, 20.25, and
21.00). A Mann-Whitney U test was used to examine group differences in the CDI/WS
percentile scores according to age. The data for this analysis was divided into two groups, 16- to
23-month-olds and 24- to 30-month-olds. Group information can be seen in Table 16. Results
of the Mann-Whitney U test revealed significant group differences for Irregular and Sentence

30
Complexity sections; z=4.35, p=.000 and z=4.09, p=.000 respectively. However, no significant
group differences were found for the Words Produced section (z=1.690, p=.091).
Table 15 CDI/WS Percentile Scores as a Function of Age in Months
CDI/WS Section
17 months
19 months
21 months
23 months
25 months
27 Months
29 months
Words Produced
43.88
(32.27)
48.80
(36.54)
48.50
(30.96)
41.75
(25.97)
31.00
(25.30)
38.36
(30.45)
16.25 (6.13)
Irregular Usage 75.14 (17.03)
71.60 (18.89)
70.00 (14.64)
59.50 (14.30)
43.29 (26.87)
39.79 (25.82)
20.25 (5.25)
Sentence Complexity
89.50 (8.43)
83.80 (11.86)
67.67 (16.87)
67.67 (2.52)
39.29 (20.09)
50.08 (22.58)
21.00 (14.18)
Table 16 CDI/WS Data for Mann-Whitney U Analysis of Age
CDI/WS Sections
16 to 23 months N = 29
24 to 30 months N = 27
Mann-Whitney U Test Results
Words Produced 47.28 (31.45) 32.33 (26.52) z=1.69, p=.091 Irregular 70.43 (16.90) 38.81 (24.87) z=4.35, p=.000* Sentence Complexity 77.53 (15.34) 44.04 (22.59) z=4.09, p=.000*
* indicates significance at the .05 level.
Another way to examine the data as a function of age is through the use of a correlational
analysis. Results of a Pearson r correlational analysis with individual CDI sections can be seen
in Table 17. As shown in the first column of Table 17, CDI/WG and CDI/WS raw scores
revealed significant correlations with the children's ages in five of the seven sections of the
inventories. In the CDI/WG, the Phrases Understood and Total Gestures raw scores were
moderately correlated with age in months (r = .506 and .601, p values < .01). Weaker yet
significant correlations were also found between raw scores of all three CDI/WS sections and
age in months. Examination of the percentile scores revealed moderate to high negative
correlations between age in months and the CDI/WS Irregular and Sentence Complexity

31
percentile scores (r = -.647 and -.709, all p values < .01). These findings indicate that the
children’s percentile ranks decreased as they aged on these sections on the CDI/WS.
Table 17 Pearson’s Correlations with Age
CDI/WG
Correlation Raw Scores
Correlation Percentile Scores
Phrases Understood .506** -.213 Words Understood .328 -.316 Words Produced .254 -.175 Total Gestures .601** -.145 CDI/WS Words Produced .443** -.231 Irregular .323* -.647** Sentence Complexity .425** -.709**
* Correlation is significant at p<.05. ** Correlation is significant at p< .01.
In the above analysis, the variable of age was restricted to 8-14 months for each
inventory. The magnitude of a correlation can be limited if the range of scores examined are
restricted. Therefore, to further examine the relation between the children's age and their scores,
an ideal situation would be to combine the scores of the two inventories together. This
procedure increases the range of ages and scores that can be examined with a correlational
analysis. The only section that cuts across both inventories is the Words Produced section.
Therefore, the Words Produced scores across the CDI/WG and the CDI/WS inventories were
combined. A moderately high correlation (r = .657, p < .01) was found between Words
Produced raw scores relative to age in months. Figure 1 illustrates the increase in Words
Produced raw scores as the children age. A low but significant correlation was found between
Words Produced percentile scores relative to age in months (r = -.298, p < .01). Figure 2
illustrates the observed low correlation between the child’s age and their Words Produced
percentile scores.

32
Figure 1 Correlation between Age and Words Produced Raw Scores (r = .657, p < .01)
Figure 2 Correlation between Age and Words Produced Percentile Scores (r = .298, p < .01)

33
CDI Scores as a Function of Gender
Next, the CDI scores were examined as a function of gender. Raw scores were not
included in this analysis based on the potential interactions between gender and age. Therefore,
the percentiles seen in Table 18 were used for examining the variable of gender. Visual
inspection of the data revealed that the CDI/WG percentile scores were higher for males on all
four sections, and the CDI/WS percentile scores were higher for females across all three sections.
The data were also examined for group differences using a Mann-Whitney U test. Results can be
found in Table 18. For the CDI/WG, significant group differences were found for the Words
Understood section (z=2.35, p=.019) and the Total Gestures section (z=2.31, p=.021). No
significant group differences were seen in the CDI/WS.
Table 18 CDI/WG and CDI/WS Percentile Scores as a Function of Gender a
Male
Female
Mann- Whitney U Test Results
CDI/WG Phrases Understood 65.00
(24.45) 17
50.36 (28.58)
14
z=1.43, p=.152
Words Understood 63.94 (25.59)
17
40.57 (27.42)
14
z=2.35, p=.019*
Words Produced 61.53 (26.78)
17
43.50 (25.43)
14
z=1.93, p=.054
Total Gestures 64.94 (25.01)
17
40.38 (27.56)
13
z=2.31, p=.021*
CDI/WS
Words Produced 38.14 (29.08)
28
42.00 (31.07)
28
z=.549, p=.583
Irregular 49.37 (26.21)
27
61.04 (25.53)
27
z=1.53, p=.127
Sentence Complexity 57.79 (25.66)
19
58.05 (26.56)
22
z=.052, p=.958
* indicates significance at the .05 level.

34
CDI Scores as a Function of Birth Order
Table 19 presents the CDI percentile scores relative to the children’s birth order.
Although the children’s birth orders for the sample ranged from the first to fourth child in the
family, there were not a substantial number of children in each birth order level to examine them
in isolation. Therefore, for the purposes of analysis, the children were divided into first-born
(N=46) and later-born groups (N=37). Visual inspection of the percentile scores revealed that the
first-born children in this sample had higher percentile scores on all CDI measures of expressive
language than their later-born peers. However, a Mann-Whitney U test was used to analyze
group differences as shown in Table 19, and results indicated that no birth order differences
existed for either of the inventories.
Table 19 CDI/WG and CDI/WS Percentile Scores as a Function of Birth Order
First-Born
Later-Born
Mann-Whitney U Test Results
CDI/WG
Phrases Understood 55.06 (29.54)
16
61.08 (23.78)
13
z=.659, p=.510
Words Understood 51.38 (35.32)
16
56.62 (20.00)
13
z=.550, p=.583
Words Produced 58.94 (33.39)
16
47.31 (15.82)
13
z=1.36, p=.173
Total Gestures 52.40 (31.19)
15
52.31 (26.17)
13
z=.162, p=.872

35
Table 19 continued
First-Born
Later-Born
Mann- Whitney U Test Results
CDI/WS
Words Produced 47.20 (32.74)
30
33.25 (24.69)
24
z=1.45, p=.146
Irregular 61.75 (26.60)
28
50.38 (24.24)
24
z=1.57, p=.116
Sentence Complexity 63.45 (26.80)
29
54.53 (24.82)
19
z=1.17, p=.243
CDI Scores as a Function of Maternal Education
Based on report of maternal years of education, analysis was completed in order to
examine the effect of level of maternal education on CDI raw and percentile scores. Table 20
shows the CDI/WG and the CDI/WS percentile scores as a function of maternal education. For
the purposes of this analysis, maternal education was divided into three categories: less than high
school graduate, high school graduate, and high school graduate plus. Upon visual inspection,
the percentile scores for both inventories lowered slightly as the level of maternal education
increased. Again, a Mann-Whitney U test was performed. For the Mann-Whitney U analysis,
the data were divided into two groups. Mothers with 7 to 11 years of education were placed into
one group, and mothers with 12 to 18 years of education were placed into a second group. No
significant group differences were found based on level of maternal education. As can be seen in
Table 21, lack of significance may be attributed to few and unequal numbers of mothers
representing all levels of maternal education. Correlations between percentile scores and
maternal education level were also not significant.

36
Table 20 CDI/WG and CDI/WS Percentile Scores as a Function of Maternal Education
< High School Graduate
High School Graduate
High School Graduate +
CDI/WG
Phrases Understood 59.74 (24.16)
19
55.91 (33.49)
11
60.00 (00.00)
1
Words Understood 55.26 (28.25)
19
51.55 (31.21)
11
38.00 (00.00)
1
Words Produced 55.05 (26.05)
19
53.73 (29.74)
11
18.00 (00.00)
1
Total Gestures 54.28 (29.35)
18
53.82 (29.81)
11
60.00 (00.00)
1
CDI/WS
Words Produced 41.63 (29.81)
24
39.53 (34.86)
17
38.20 (25.51)
15
Irregular 55.65 (28.74)
23
55.71 (26.00)
17
53.86 (24.23)
14
Sentence Complexity 54.82 (24.54)
17
63.92 (25.90)
12
56.33 (28.64)
12
Note: “< High School Graduate” indicates fewer than 12 years of education. “High School Graduate” indicates 12 years of education. “High School Graduate +” indicates more than 12 years of education.

37
Table 21 CDI/WG and CDI/WS Data for Mann-Whitney U Analysis of Maternal Education
CDI/WG Sections
7 to 11 years
12 to 18 years
Mann- Whitney U Test
Results
Phrases Understood
59.74
(24.16) 19
56.25
(31.95) 12
z=.325, p=.745
Words Understood 55.26 (28.25)
19
50.42 (30.01)
12
z=.447, p=.655
Words Produced 55.05 (26.05)
19
50.75 (30.18)
12
z=.609, p=.542
Total Gestures 54.28 (29.35)
19
54.33 (28.48)
12
z=.127, p=.899
CDI/WS Sections
7 to 11 years
12 to 18 years
Mann- Whitney U
Test Results
Words Produced
41.63
(29.81) 24
38.91
(30.36) 32
z=.580, p=.562
Irregular 55.65 (28.74)
23
54.87 (24.82)
31
z=.044, p=.965
Sentence Complexity 54.82 (24.54)
17
60.13 (26.99)
24
z=.689, p=.491
Item and Subsection Analysis
For this analysis, only the items of the Vocabulary Checklist were included. Not
included was the Part II Actions and Gestures portion of the CDI/WG or the Part II Sentences
and Grammar portion of the CDI/WS. Visual inspection of the inventories showed that mothers
did not fill out these more advanced sections of the CDI as completely as the Vocabulary

38
Checklist section. The decision to use only the Vocabulary Checklist was also based on
practicality and the sheer number of items in the inventories (CDI/WG = 396; CDI/WS = 680).
Raw data for receptive and expressive language reported on the CDI/WG can be found in
Appendix F. A total receptive language score for each item was obtained by counting the
number of times an item was marked as “understands” or “understands and says” in the total of
31 CDI/WG inventories collected. A total expressive language score for each item was obtained
by counting only the number of times an item was marked as “understands and says.”
Percentages for each subsection were calculated based on the total number of items marked by
caregivers divided by the total number of possible items in the subsection. Table 22 highlights
findings from the item analysis based on subsections of the CDI/WG Vocabulary Checklist.
Table 22 Item Analysis by CDI/WG Subsection
CDI/WG Section
Percentage of Receptive Items Marked
Percentage of Expressive Items Marked
Sound Effects and Animal Sounds 44 23 Animal Names 19 6 Vehicles 29 9 Toys 51 12 Food and Drink 37 8 Clothing 30 6 Body Parts 41 9 Furniture and Rooms 35 7 Small Household Items 32 7 Outside Things and Places to Go 18 3 People 39 11 Games and Routines 52 15 Action Words 27 6 Words About Time 15 1 Descriptive Words 18 3 Pronouns 16 4 Question Words 14 4 Prepositions and Locations 28 5 Quantifiers 10 1
Visual inspection of the CDI/WG subsections revealed that items in each subsection of
the CDI/WG Vocabulary Checklist were marked, although the percentage of items marked

39
varied across subsections. A total of 9 of the 19 subsections (47%) on the CDI/WG Vocabulary
Checklist yielded percentages of marked receptive items at or above 30%. As shown in Table
22, the Games and Routines, Toys, Sound Effects and Animal Sounds, and Body Parts
subsections of vocabulary yielded the highest percentage of marked receptive language items
(52%, 51%, 44% and 41% respectively). Similarly, the Sound Effects and Animal Sounds,
Games and Routines, Toys subsections also yielded the highest percentage of expressive
language items (23%, 15%, and 12% respectively). Table 22 also shows that percentages for
both receptive and expressive language items tended to lower in the more advanced subsections
of the CDI/WG such as Pronouns, Question Words, and Quantifiers (16%, 14% and 10%).
Visual inspection of the individual CDI/WG items showed that the items Momma, Bye
Bye, Bottle, Daddy, Ball, and Baa Baa were the most commonly marked receptive language
items on the CDI/WG inventory (97%, 90%, 87%, 84%, 84%, and 84% respectively). Similarly,
the items Baa Baa, Bye Bye, Mommy, and Daddy were the most commonly marked expressive
language items on the CDI/WG inventory. Finally, examination of the data revealed that all the
items on the CDI/WG inventory were marked at least once as being understood by a child in the
study sample.
Next, the subsections of the CDI/WS Vocabulary Checklist were examined. Raw data
for the CDI/WS Vocabulary Checklist can be seen in Appendix G. A total expressive score for
each item was calculated based on the total number of times the item was marked in the 56
CDI/WS inventories collected. The percentage of times items were marked in each subsection of
the CDI/WS was calculated as shown in Table 23.
Upon visual inspection of the CDI/WS Vocabulary Checklist subsections, percentages for
individual subsections ranged from 19 to 63. Though the frequency of responses in each

40
subsection varied, items in each subsection of the CDI/WS Vocabulary Checklist were marked.
A total of 12 of the 22 subsections (55%) on the CDI/WS Vocabulary Checklist yielded
percentages of marked expressive items at or above 30%. The Sound Effects and Animal
Sounds subsection contained the most commonly marked items (63%) followed by Games and
Routines and Body Parts (53% and 50%). Subsequent item analysis revealed that Daddy,
Mommy, Dog, Shoe, and Woof Woof were the highest scoring items for expressive language
(96%, 95%, 93%, 86% and 86% respectively). Similar to items on the CDI/WG, every item
excluding one was marked by at least one of the caregivers as a word her child produced. The
item Basement was the only item never marked in the inventories collected.
Table 23 Item Analysis by CDI/WS Subsection
CDI/WS Section
Percentage of Expressive Items Marked
Sound Effects and Animal Sounds 63 Animals 35 Vehicles 38 Toys 40 Food and Drink 36 Clothing 33 Body Parts 50 Small Household Items 42 Furniture and Rooms 34 Outside Things 28 Places to Go 26 People 36 Games and Routines 53 Action Words 35 Descriptive Words 25 Words About Time 24 Pronouns 24 Question Words 23 Prepositions and Locations 24 Quantifiers and Articles 20 Helping Verbs 20 Connecting Words 19

41
CHAPTER 4 DISCUSSION
The purpose of this study was to determine the usefulness of the MacArthur-Bates
Communicative Development Inventory as an assessment tool for low-income, AA children.
Data were obtained from a sample of 87 CDI inventories completed by low-income, AA
participants, and the results were analyzed in order to answer the four main research questions
that guided the study. Chapter 4 is divided into four sections. The first section discusses the
results of the research questions that guided the study, and next section compares the findings of
the study to previous research. The limitations of the study are outlined in the third section.
Finally, the fourth section discusses the implications of the study and provides suggestions for
further research.
Interpretation of Results
The first research question explored how the scores from a low-income, AA sample
distributed relative to the normative database for the CDI. Strong correlations were found
between the original and updated CDI normative information for obtaining percentile scores.
Further analysis indicated that the present sample’s percentile scores follow a normal distribution
pattern with a mean overall percentile ranking of 54.87 for the CDI/WG and 51.07 for the
CDI/WS. In addition, the quartiles closely approximated a normal bell curve.
The second research question examined the variables of age, gender, and birth order and
their effects on the CDI raw and percentile scores. Analysis of the scores according to age,
gender, and birth order revealed large standard deviations in the raw scores for each group.
Visual inspection of the data indicated that children’s raw scores on both the CDI/WG and the
CDI/WS inventories increased as the children grew older. When the inventories were combined,
raw scores and age revealed a moderate to moderate-high correlation. Correlations between

42
percentile scores and age were negative but low. In addition, the CDI/WS percentile scores were
considerably low for the 29-month- old age group.
For gender, males were found to have higher raw and percentile scores on the CDI/WG,
whereas females were found to have higher raw and percentile scores on the CDI/WS. Group
differences, however, were only significant for the CDI/WG Phrases Understood and Total
Gestures sections. Finally on the CDI/WS, first-born children were found to have higher
percentile scores than their later-born peers, but group differences were not statistically
significant.
The third question explored the effect of level of maternal education on CDI raw and
percentile scores. Although CDI/WG raw scores were shown to increase along with years of
maternal education, an overall pattern of decreasing percentile scores as years of maternal
education increased was noted during visual inspection of the data. Nevertheless, no significant
group differences for maternal education were found. These findings could be attributed to the
few and unequal numbers of mothers in each group and the restricted range of maternal
education levels.
Finally, the fourth research question examined the items and subsections of the CDI.
Recall this analysis was limited to only the items of the Vocabulary Checklist of both
inventories. For both receptive language and expressive language reported on the CDI/WG, the
Sound Effects and Animal Sounds, Toys, and Games and Routines subsections of the
Vocabulary Checklist resulted in the highest percentage of marked items. Findings for the
CDI/WS inventory showed that the Sound Effects and Animal Sounds, Games and Routines, and
Body Parts subsections resulted in the highest percentage of marked items. Additionally, all of
the items on both the CDI/WG and CDI/WS checklists were marked by at least one caregiver,

43
with the exception of one item (basement) on the CDI/WS. Finally, individual item analysis
revealed that the items Momma, Bye Bye, Daddy, and Baa Baa were the most commonly marked
receptive and expressive language items on the CDI/WG inventory, and the items Daddy,
Mommy, Dog, Shoe, and Woof Woof were the most commonly marked expressive language items
on the CDI/WS inventory.
Comparison of Findings to Previous Work
Earlier research by Arriaga et al. (1998) revealed an overall negative shift of 20% in the
distribution of CDI/WS percentile scores for a low-income sample. Table 24 shows a
comparison of the data from Arriaga et al. (1998) and the findings from the current study. As
shown in the table, a slight shift in the overall distribution of CDI/WS percentile scores was
found for the low-income sample, but the magnitude was less dramatic (i.e., 40.07 vs. 50.04)
than what was reported by Arriaga (1998). In addition, the current low-income sample had
higher mean percentile scores for the Sentence Complexity section than both the low and middle-
income samples in the Arriaga et al. (1998) study. It is also important to note that large standard
deviations were found for all groups of collected data, a finding very similar to the pattern
presented in previous research. As is interpreted by Feldman et al. (2000), large standard
deviations can be attributed to the highly variable development of children’s receptive and
expressive language during the first three years of life.
Table 24 Comparison of Mean Percentile Scores (Arriaga et al. 1998)
Words Produced Sentence Complexity
Arriaga Middle Income 50.04 (27.08) 51.69 (26.30) Arriaga Low Income 29.74 (26.17) 31.15 (25.71) Current Study Low Income 40.07 (29.88) 57.93 (25.82)
Next, the relationship between age in months and CDI raw and percentile scores was
examined. Similar to the findings of Roberts, Burchinal, and Durham (1999) and Feldman et al.
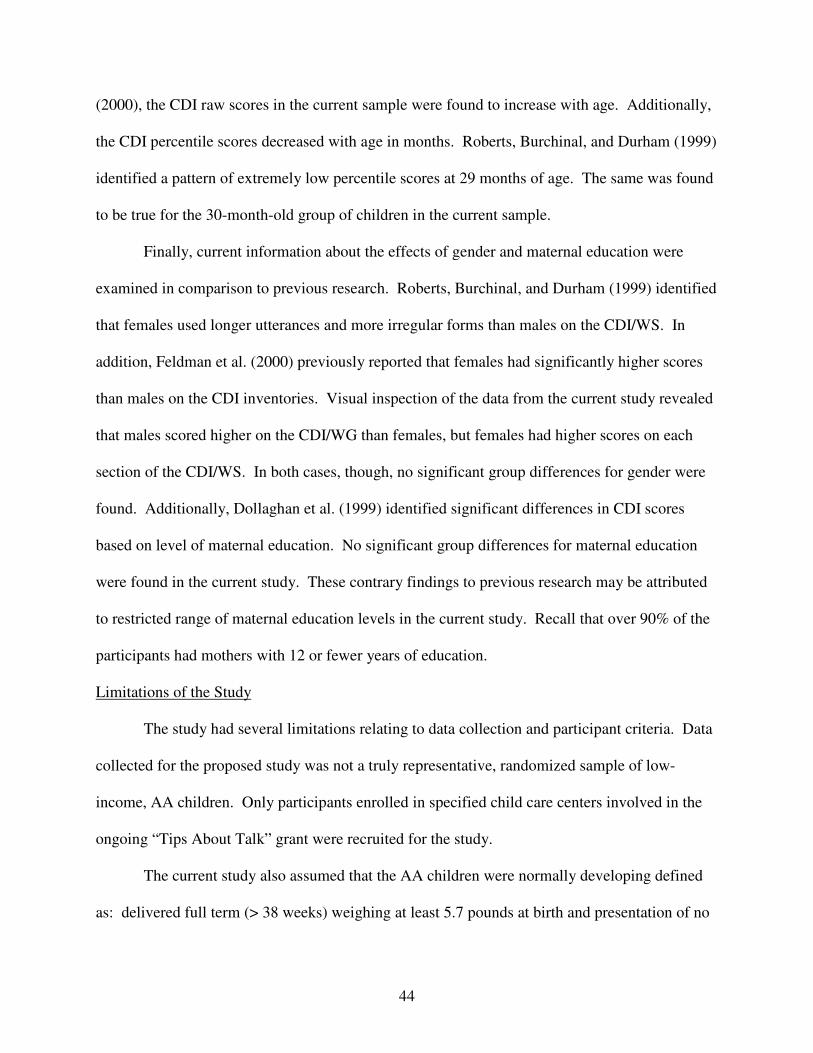
44
(2000), the CDI raw scores in the current sample were found to increase with age. Additionally,
the CDI percentile scores decreased with age in months. Roberts, Burchinal, and Durham (1999)
identified a pattern of extremely low percentile scores at 29 months of age. The same was found
to be true for the 30-month-old group of children in the current sample.
Finally, current information about the effects of gender and maternal education were
examined in comparison to previous research. Roberts, Burchinal, and Durham (1999) identified
that females used longer utterances and more irregular forms than males on the CDI/WS. In
addition, Feldman et al. (2000) previously reported that females had significantly higher scores
than males on the CDI inventories. Visual inspection of the data from the current study revealed
that males scored higher on the CDI/WG than females, but females had higher scores on each
section of the CDI/WS. In both cases, though, no significant group differences for gender were
found. Additionally, Dollaghan et al. (1999) identified significant differences in CDI scores
based on level of maternal education. No significant group differences for maternal education
were found in the current study. These contrary findings to previous research may be attributed
to restricted range of maternal education levels in the current study. Recall that over 90% of the
participants had mothers with 12 or fewer years of education.
Limitations of the Study
The study had several limitations relating to data collection and participant criteria. Data
collected for the proposed study was not a truly representative, randomized sample of low-
income, AA children. Only participants enrolled in specified child care centers involved in the
ongoing “Tips About Talk” grant were recruited for the study.
The current study also assumed that the AA children were normally developing defined
as: delivered full term (> 38 weeks) weighing at least 5.7 pounds at birth and presentation of no

45
reported hearing loss, no major birth or medical complications, and no diagnosed developmental
disability. These measures do not ensure that the children in the study were normally
developing, and no other standardized tests were administered to the AA children. Because the
study was testing the utility of the CDI, results depend on the children being normally
developing.
Due to the large number of items contained in the CDI inventories and the amount of
time available, all the items of the CDI inventories were not analyzed. Only portions of the
items in Part I of both inventories were examined; specifically, the subsections of the Vocabulary
Checklist were analyzed. This portion of the CDI was chosen based on its practicality in clinical
settings, yet examination of all of the items in the CDI inventories could have assisted in the
further evaluation of the appropriateness of the all of the items and further evaluation of how the
sections in each inventory relate to one another.
Finally, the low number of participants in the study may have affected the findings. No
specific guidelines for soliciting equal numbers of children for each age range and maternal
education level in the study sample were used. The few and unequal numbers of children in each
of these categories could have affected the findings regarding group differences and correlations
among variables. Inspection of the raw data provided descriptive information; yet in most cases,
larger and equal groups representing each variable would have positively impacted analysis of
group differences and the Pearson’s correlations.
Implications of Research and Suggestions for Future Studies
The impetus for the current study was to address Catherine’s dilemma and consider how
the current study impacts her clinical practice. Recall that Catherine is faced with the decision of
whether or not the CDI should be included in the assessment battery for her low-income, AA

46
caseload. The results of this study indicate that the CDI is a useful tool for assessing the early
receptive and expressive language skills of low-income, AA children.
The CDI has previously been described as an efficient parent report instrument for use
with typically developing and developmentally delayed populations, yet questions have been
raised regarding its use with demographically diverse populations. The results of the study
indicate that the tool provided normally distributed percentile scores for this sample of typically
developing low-income, AA children with means and quartile scores closely approximating
values representative of a normal bell curve. This finding suggests that the CDI is appropriate
for assessing low-income, AA children. Additionally, based on strong correlations found
between the original and updated percentile scores, it is recommended that test users obtain the
updated normative information available on the test developer’s website and use this normative
data in future assessment.
Future research with larger samples and various sociodemographic groups (i.e. low-
income, AA children who are developmentally delayed; low-income, white children; middle-
and upper- income, AA children) would be beneficial to the validation of the CDI to differentiate
normal vs. impaired children as well as provide increasing support of the CDI as an appropriate
assessment tool regardless of various sociodemographic variables.
Future research is also needed to further explore the observed low scores of the children
aged 29 to 30 months. Roberts, Burchinal, and Durham (1999) documented unusually low
percentile scores for 30-month-old children. Similar low percentile scores were found for the
29-month-old children in the current sample (16.25 to 21.00). The reason for this finding across
two studies remains unknown. Possibly low percentile scores in this age range reflect an
inability of parents to accurately report on their children’s language or they reflect the increasing

47
discrepancy in language scores of sociodemographically diverse children beyond the age of 24
months.

48
REFERENCES
Arriaga, R., Fenson, L, Cronan, T., & Pethick, S. (1998). Scores on the MacArthur Communicative Development Inventory of children from low-and middle-income families. Applied Psycholinguistics, 19, 209-223.
Bates, E., Caselli, M.C., & Casadio, P. (1990). A crosslinguistic study of early lexical
development using parental report. Poster presented at the International Conference on Infant Studies, Montreal, Canada.
Bayley, N. (1969). Bayley Scales of Infant Development. New York: The Psychological
Corporation.
Bryant, Cynthia (2003). Assessing the Emergence of Tense Marking in Young Children: Is Parent Report Valid? Master’s Thesis: Northern Illinois University, Dekalb, Illinois; August 2003.
Caldwell, B.M., & Bradley, R.H. (1984). Home Observation for Measurement of the
Environment (Rev. Ed). Little Rock, AR: University of Arkansas at Little Rock.
Camaioni, L., Caselli, M.C., Longobardi, E., & Volterra, V. (1990). Construction and validation of a parent report instrument for assessing communicative and linguistic development in the second year of life. Paper presented at the Fifth International congress for the Study of Child Language, Budapest, Hungary.
Dale, P.S. (1991). The validity of a parent report measure on vocabulary and syntax at 24
months. Journal of Speech and Hearing Research, 34, 565-571. Dale, P.S., Bates, E., Reznick, J.S., & Morriset, C. (1989). The validity of a parent report
instrument of child language at 20 months. Journal of Child Language, 16, 239- 249.
Dollaghan, C.A., Campbell, T.F., Paradise, J.L., Feldman, H.M., Janosky, J.E., Pitcairn,
D.N., & Kurs-Lasky, M. (1999). Maternal Education and Measures of Early Speech and Language. Journal of Speech, Language, and Hearing Research, 42, 1432-1443.
Elardo, R., Bradley, R., and Caldwell, B. M. (1977). A longitudinal study of the relation
of infants’ home environments to language development at age three. Child
Development, 48, 595-603. Feldman, H.M., Dollaghan, C.A., Campbell, T.F., Kurs-Lasky, M., Janosky, J.E., &
Paradise, J.L. (2000). Measurement properties of the MacArthur Communicative Development Inventories at ages one and two years. Child Development, 71, 310- 322.

49
Fenson, L., Bates, E., Dale, P., Goodman, J., Reznick, J.S., & Thal, D. (2000). Measuring variability in early child language: Don’t shoot the messenger. Child
Development, 71, 323-328. Fenson, L., Dale, P.S., Reznick, J.S., Bates, E., Thal, D., & Pethick, S. (1994).
Variability in early communicative development. Monographs of the Society for
Research in Child Development, 59(5), Serial No. 242). Fenson, L., Dale, P.S., Reznick, J.S., Thal, D., Bates, E., Hartung, J.P., Pethick, S., &
Reilly, J.S. (1993). The MacArthur Communicative Development Inventories:
User’s guide and technical manual. San Diego, CA: Singular Publishing Group. Hart, B., & Risley, T. (1995). Meaningful Differences in the everyday experience of
young American Children. Baltimore: Brooks. Heilmann, J., Weismer, S.E., Evans, J., Hollar, C. (2005). Utility of the MacArthur-Bates
Communicative Development Inventory in identifying language abilities of late-talking and typically developing toddlers. American Journal of Speech-Language Pathology, 14, 40-51.
Hoff-Ginsberg, E. (1991). Mother-child conversation in different social classes and
communicative settings. Child Development, 62, 782-796. Jackson-Maldonado, D., Thal, D., Marchman, V., Bates, E., & Gutierrez-Clellen, V.
(1993). Early lexical development in Spanish-speaking infants and toddlers. Journal of Child Language, 20, 523-549.
Laosa, L.M. (1980). Maternal teaching strategies in Chicano and Angllo-American families: The influence of culture and education on maternal education. Child
Development, 51, 759-765. Miller, J.F. (1988). The developmental synchrony of language development in children
with Down syndrome. In L. Nadel (Ed.), The Psychology of Down Syndrome (pp.167-198.) Cambridge, MA: MIT Press.
Miller, J.F., Sedey, A.L., & Miolo, G. (1995). Validity of parent report measures of
vocabulary development for children with Down’s syndrome. Journal of Speech
and Hearing Research, 38, 1037-1044.
Ogura, T., & Murase, Y. (1991). Communicative development inventory. Congress of Japanese Developmental Psychology, Tokyo, Shimane University, Matsue.
Rice, M.L. (2003). A unified model of specific and general language delay: Grammatical tense
as a clinical marker of unexpected variation. In Y. Levy & J. Schaeffer (Eds.), Language
competence across populations: Toward a definition of specific language impairment (pp.63-95). Mahwah, NJ: Lawrence Erlbaum Associates.

50
Rice, M.L. (2004). Growth models of developmental language disorders. In M. Rice & S. Warren, Developmental language disorders: From phenotypes to etiologies (pp. 207-240). Mahwah, NJ: Lawrence Erlbaum Associates.
Roberts, J.E., Burchinal, M., & Durham, M. (1999). Parent’s report of vocabulary and grammatical development of African American preschoolers: Child and environmental associations. Child Development, 70, 92-106.
Seymour, H.N., Bland-Stewart, L., & Green, L.J. (1998). Difference vs. deficit in child
African American English. Language, Speech, and Hearing Services in Schools, 29, 96-108.
Thal, D.J., O’Hanlon, L., Clemmons, M., & Fralin, L. (1999). Validity of a parent report
measure of vocabulary and syntax for preschool children with language impairment. Journal of Speech, Language, and Hearing Research, 42, 482-496.
Wallace, I., Roberts, J., and Lodder, D. (1998). Interactions of African American infants
and their mothers: Relations with development at 1 year of age. Journal of
Speech, Language, and Hearing Research, 41, 900-913.

51
APPENDIX A
NUMBER OF CHILDREN BY AGE AND GENDER IN THE ORIGINAL AND UPDATED SAMPLES: CDI/WG
a Source: Fenson et al., 1993, Table 4-1., p. 41.
b Source: Personal Communication, Virginia Marchman
Original Samplea Updated Sampleb
Age in months Girls (n) Boys (n) Girls (n) Boys (n)
8 32 35 32 36
9 37 32 48 41
10 35 32 64 72
11 38 46 45 50
12 45 41 79 78
13 40 36 57 59
14 42 42 58 53
15 32 33 50 44
16 33 30 41 43
17 -- -- 33 40
18 -- -- 37 29
Total 334 325 544 545

52
APPENDIX B
NUMBER OF CHILDREN BY AGE AND GENDER IN THE ORIGINAL AND UPDATED SAMPLES: CDI/WS
a Source: Fenson et al., 1993, Table 4-2., p. 42.
b Source: Personal Communication, Virginia Marchman
Original Samplea Updated Sampleb
Age in months Girls (n) Boys (n) Girls (n) Boys (n)
16 32 32 37 37
17 33 32 38 43
18 34 46 44 59
19 37 35 55 43
20 45 48 60 57
21 31 40 40 55
22 40 32 50 40
23 41 41 52 52
24 59 48 72 63
25 45 31 59 48
26 39 39 47 53
27 38 42 54 59
28 31 30 41 43
29 28 33 38 42
30 36 32 41 39
Total 569 561 728 733

53
APPENDIX C
DEMOGRAPHIC PROFILES OF THE ORIGINAL AND UPDATED
CDI NORMATIVE SAMPLES
a Source: Table 4-3 on page 43 of Fenson et al. (1993).
b Source: Personal Communication, Virginia Marchman
Demographic characteristic Original Norms (%)a Revised Norms (%)b
Ethnicity
White 86.9 73.1
Black 4.0 10.4
Asian 2.9 3.3
Hispanic 4.6 6.5
All others 1.6 6.4
Maternal Education
Some high school or less 4.5 7.6
High school diploma 17.9 23.9
Some college 24.3 24.8
College diploma or higher 53.3 43.8

54
APPENDIX D
SCORING PROCEDURES FOR THE CDI/WG AND CDI/WS FROM FENSON ET AL. (1993)
CDI/WG
PART I
Section A: First Signs of Understanding
Add the number of “Yes” responses to obtain the child’s total score.
Section B: Phrases Add the number of phrases the parent indicated that the child understands.
Section C: Starting to Talk Count each question as an affirmative response if the parent marked either “Often” or “Sometimes” for that question.
Section D: Vocabulary Checklist
Add the number of “understands and says” responses across all 19 categories to obtain the total score for vocabulary production. Add the number of either “understands” or “says” or “understands and says” across all 19 categories to obtain the total score for vocabulary comprehension.
PART II
Section A: First Communicative Gestures
Add the number of “Sometimes” or “Often” marked by the parent.
Section B through Section E Count the number of “Yes” responses marked by the parent.
Section F: Pretend Gestures Qualitative Data: Use substitution criterion to judge if child substitutes one object for objects typically used in familiar cultural activities. Record “no” if parent response is “no” or if no examples are provided.
CDI/WS
PART I
Section A: Vocabulary Checklist
Add the items checked by the parent across each of the 22 categories to obtain the child’s total score for vocabulary production.
Section B: How Children Use Words
Count each question as an affirmative response if the parent has marked either “Sometimes” or “Often”.
PART II Section A: Word Endings/Part 1 (Use of Suffixes)
Count each question if the parent has marked either “Sometimes” or “Often”.
Section B: Word Forms (Irregular Nouns and Verbs)
Add the items marked by the parent across the noun and verb sections to obtain a single total score.
Section C: Word Endings/Part 2 (Overregularizations)
Add the items marked by the parent across the noun and verb sections to obtain a single total score.
Section D: Examples of Children’s Three Longest
Mean Length of Utterance: If parent indicated that the child is not producing word combinations, MLU is

55
Sentences scored as 1. If fewer than three examples are provided, compute MLU based on number available. Samples should be broken down into single sentences. Regular inflectional morphemes, contractions, and negatives are counted as separate morphemes. All diminutives, irregular past tense verbs, third person singular verbs, plural nouns, catenatives, auxiliaries, compound words, proper nouns, and ritualized reduplications count as single morphemes.
Section E: Sentence Complexity Count the number of responses for which the parent has marked the second (more complex) of the two alternatives. Treat any questions for which the parent has marked both alternatives as if only the second alternative was chosen. Do not count questions left unanswered by the parent.

56
APPENDIX E
RELIABILITY INFORMATION
CDI/WORDS AND GESTURES CDI Form Items Possible Items in Agreement Percentiles Possible Percentiles in Agreement
08 492 492 12 11 19 492 492 12 12 28 492 492 12 11 38 492 492 12 11 60 492 491 12 11 66 492 492 12 12 73 492 492 12 12
Total 3443/3444 Reliability = 99.97% 80/84 Reliability= 95.24%
CDI/WORDS AND SENTENCES CDI Form Items Possible Items in Agreement Percentiles Possible Percentiles in Agreement
11 801 801 6 5 13 801 801 6 6 30 801 801 6 6 33 801 799 6 6 43 801 798 6 5 49 801 800 6 5 55 801 801 6 4 57 801 801 6 6 64 801 801 6 6 77 801 799 6 6 85 801 801 6 4 90 801 801 6 6
Total 9604/9612 Reliability = 99.92% 65/72 Reliability= 90.28%

57
APPENDIX F
CDI/WG VOCABULARY CHECKLIST ITEM ANALYSIS
CDI/WG ITEM RECEPTIVE TOTAL
N = 31
EXPRESSIVE TOTAL
N = 31
SOUND EFFECTS AND ANIMAL SOUNDS
Baa baa 26 (84%) 15 (48%)
Choo choo 10 (32%) 5 (16%)
Cockadoodledoo 8 (26%) 2 (6%)
Grrr 16 (52%) 11 (35%)
Meow 11 (35%) 5 (16%)
Moo 11 (35%) 5 (16%)
Ouch 15 (48%) 7 (23%)
Quack quack 9 (29%) 5 (16%)
Uh oh 20 (65%) 10 (32%)
Vroom 11 (35%) 6 (19%)
Woof woof 14 (45%) 9 (29%)
Yum yum 12 (39%) 5 (16%)
Total 163/372 (44%) 85/372 (23%)
ANIMAL NAMES
Animal 6 (19%) 1 (3%)
Bear 6 (19%) 1 (3%)
Bee 5 (16%) 1 (3%)
Bird 10 (32%) 3 (10%)
Bug 7 (23%) 2 (6%)
Bunny 5 (16%) 2 (6%)
Butterfly 5 (16%) 1 (3%)
Cat 14 (45%) 7 (23%)
Chicken 6 (19%) 2 (6%)
Cow 10 (32%) 4 (13%)
Deer 3 (10%) 0 (0%)
Dog 18 (58%) 10 (32%)
Donkey 2 (6%) 0 (0%)
Duck 8 (26%) 4 (13%)
Elephant 5 (16%) 1 (3%)
Fish 10 (32%) 4 (13%)
Frog 4 (13%) 1 (3%)
Giraffe 3 (10%) 0 (0%)
Goose 4 (13%) 0 (0%)
Horse 7 (23%) 1 (3%)
Kitty 8 (26%) 1 (3%)
Lamb 4 (13%) 0 (0%)

58
Lion 4 (13%) 1 (3%)
Monkey 6 (19%) 1 (3%)
Mouse 5 (16%) 1 (3%)
Owl 4 (13%) 1 (3%)
Penguin 2 (6%) 0 (0%)
Pig 8 (26%) 5 (16%)
Pony 2 (6%) 0 (0%)
Puppy 11 (35%) 4 (13%)
Sheep 3 (10%) 1 (3%)
Squirrel 2 (6%) 0 (0%)
Teddy bear 11 (35%) 5 (16%)
Tiger 4 (13%) 0 (0%)
Turkey 2 (6%) 0 (0%)
Turtle 2 (6%) 1 (3%)
Total 216/1116 (19%) 66/1116 (6%)
VEHICLES
Airplane 7 (23%) 1 (3%)
Bicycle 10 (32%) 4 (13%)
Bus 11 (35%) 3 (10%)
Car 14 (45%) 4 (13%)
Firetruck 5 (16%) 3 (10%)
Motorcycle 5 (16%) 1 (3%)
Stroller 14 (45%) 1 (3%)
Train 6 (19%) 3 (10%)
Truck 9 (29%) 4 (13%)
Total 81/279 (29%) 24/279 (9%)
TOYS
Ball 26 (84%) 8 (26%)
Balloon 12 (39%) 3 (10%)
Block 14 (45%) 3 (10%)
Book 20 (65%) 5 (16%)
Bubbles 11 (35%) 2 (6%)
Doll 9 (29%) 2 (6%)
Pen 12 (39%) 2 (6%)
Toy 23 (74%) 5 (16%)
Total 127/248 (51%) 30/248 (12%)
FOOD AND DRINK
Apple 9 (29%) 3 (10%)
Banana 14 (45%) 4 (13%)
Bread 16 (52%) 4 (13%)
Butter 4 (13%) 2 (6%)
Cake 11 (35%) 1 (3%)

59
Candy 16 (52%) 4 (13%)
Carrots 5 (16%) 1 (3%)
Cereal 19 (61%) 4 (13%)
Cheerios 7 (23%) 3 (10%)
Cheese 9 (29%) 5 (16%)
Chicken 15 (48%) 3 (10%)
Coffee 2 (6%) 1 (3%)
Cookie 18 (58%) 4 (13%)
Cracker 15 (48%) 4 (13%)
Drink 17 (55%) 3 (10%)
Egg 5 (16%) 1 (3%)
Fish 4 (13%) 0 (0%)
Food 18 (58%) 3 (10%)
Ice cream 11 (35%) 2 (6%)
Juice 22 (71%) 5 (16%)
Meat 15 (48%) 3 (10%)
Milk 19 (61%) 6 (19%)
Noodles 8 (26%) 1 (3%)
Orange 8 (26%) 2 (6%)
Peas 6 (19%) 0 (0%)
Pizza 7 (23%) 2 (6%)
Raisin 5 (16%) 0 (0%)
Spaghetti 11 (35%) 3 (10%)
Toast 8 (26%) 1 (3%)
Water 16 (52%) 3 (10%)
Total 340/930 (37%) 78/930 (8%)
CLOTHING
Beads 3 (10%) 1 (3%)
Bib 11 (35%) 0 (0%)
Boots 4 (13%) 1 (3%)
Button 5 (16%) 2 (6%)
Coat 8 (26%) 1 (3%)
Diaper 20 (65%) 3 (10%)
Dress 5 (16%) 0 (0%)
Hat 15 (48%) 2 (6%)
Jacket 10 (32%) 4 (13%)
Jeans 7 (23%) 1 (3%)
Necklace 3 (10%) 0 (0%)
Pajamas 5 (16%) 0 (0%)
Pants 12 (39%) 3 (10%)
Shirt 13 (42%) 4 (13%)
Shoe 20 (65%) 5 (16%)
Shorts 10 (32%) 3 (10%)
Sock 17 (55%) 4 (13%)

60
Sweater 5 (16%) 0 (0%)
Zipper 3 (10%) 0 (0%)
Total 176/589 (30%) 34/589 (6%)
BODY PARTS
Arm 12 (39%) 2 (6%)
Belly button 7 (23%) 4 (13%)
Cheek 2 (6%) 0 (0%)
Ear 18 (58%) 4 (13%)
Eye 17 (55%) 4 (13%)
Face 16 (52%) 2 (6%)
Foot 17 (55%) 4 (13%)
Finger 17 (55%) 3 (10%)
Hair 16 (52%) 3 (10%)
Hand 16 (52%) 4 (13%)
Head 14 (45%) 3 (10%)
Knee 4 (13%) 1 (3%)
Leg 12 (39%) 3 (10%)
Mouth 20 (65%) 3 (10%)
Nose 12 (39%) 4 (13%)
Owie/boo boo 10 (32%) 4 (13%)
Tooth 7 (23%) 2 (6%)
Toe 14 (45%) 3 (10%)
Tongue 12 (39%) 1 (3%)
Tummy 10 (32%) 2 (6%)
Total 253/620 (41%) 56/620 (9%)
FURNITURE AND ROOMS
Bathroom 17 (55%) 2 (6%)
Bathtub 21 (68%) 3 (10%)
Bed 21 (68%) 5 (16%)
Bedroom 8 (26%) 0 (0%)
Chair 10 (32%) 4 (13%)
Couch 11 (35%) 4 (13%)
Crib 9 (29%) 0 (0%)
Door 16 (52%) 5 (16%)
Drawer 4 (13%) 0 (0%)
Garage 2 (6%) 0 (0%)
High chair 7 (23%) 2 (6%)
Kitchen 13 (42%) 3 (10%)
Living room 8 (26%) 1 (3%)
Oven 8 (26%) 2 (6%)
Play pen 8 (26%) 0 (0%)
Potty 8 (26%) 2 (6%)
Refrigerator 14 (45%) 1 (3%)

61
Rocking chair 5 (16%) 1 (3%)
Sink 7 (23%) 0 (0%)
Stairs 5 (16%) 1 (3%)
Stove 10 (32%) 2 (6%)
Table 12 (39%) 4 (13%)
TV 20 (65%) 5 (16%)
Window 13 (42%) 2 (6%)
Total 257/744 (35%) 49/744 (7%)
SMALL HOUSEHOLD ITEMS
Blanket 18 (58%) 2 (6%)
Bottle 27 (87%) 10 (32%)
Bowl 13 (42%) 3 (10%)
Box 10 (32%) 3 (10%)
Broom 11 (35%) 3 (10%)
Brush 13 (42%) 2 (6%)
Clock 4 (13%) 0 (0%)
Comb 12 (39%) 2 (6%)
Cup 22 (71%) 4 (13%)
Dish 6 (19%) 0 (0%)
Fork 7 (23%) 2 (6%)
Glass 9 (29%) 2 (6%)
Glasses 4 (13%) 1 (3%)
Hammer 4 (13%) 0 (0%)
Keys 18 (58%) 3 (10%)
Lamp 4 (13%) 0 (0%)
Light 12 (39%) 1 (3%)
Medicine 7 (23%) 0 (0%)
Money 11 (35%) 3 (10%)
Paper 12 (39%) 3 (10%)
Penny 6 (19%) 3 (10%)
Picture 8 (26%) 2 (6%)
Pillow 11 (35%) 3 (10%)
Plant 2 (6%) 0 (0%)
Plate 7 (23%) 1 (3%)
Purse 7 (23%) 1 (3%)
Radio 11 (35%) 2 (6%)
Scissors 6 (19%) 1 (3%)
Soap 9 (29%) 1 (3%)
Spoon 12 (39%) 4 (13%)
Telephone 16 (52%) 4 (13%)
Toothbrush 11 (35%) 3 (10%)
Towel 8 (26%) 2 (6%)
Trash 9 (29%) 2 (6%)
Vacuum 7 (23%) 0 (0%)

62
Watch 4 (13%) 2 (6%)
Total 358/1116 (32%) 75/1116 (7%)
OUTSIDE THINGS AND PLACES TO GO
Backyard 5 (16%) 0 (0%)
Beach 2 (6%) 0 (0%)
Church 8 (26%) 1 (3%)
Flower 5 (16%) 1 (3%)
Garden 2 (6%) 0 (0%)
Home 8 (26%) 1 (3%)
House 10 (32%) 2 (6%)
Moon 3 (10%) 1 (3%)
Outside 15 (48%) 4 (13%)
Park 6 (19%) 2 (6%)
Party 4 (13%) 1 (3%)
Pool 3 (10%) 1 (3%)
Rain 6 (19%) 1 (3%)
Rock 3 (10%) 0 (0%)
School 10 (32%) 2 (6%)
Shovel 2 (6%) 0 (0%)
Sky 5 (16%) 0 (0%)
Slide 5 (16%) 2 (6%)
Snow 2 (6%) 0 (0%)
Star 3 (10%) 0 (0%)
Store 9 (29%) 1 (3%)
Sun 4 (13%) 0 (0%)
Swing 7 (23%) 1 (3%)
Tree 5 (16%) 1 (3%)
Water 11 (35%) 2 (6%)
Work 3 (10%) 0 (0%)
Zoo 5 (16%) 0 (0%)
Total 151/837 (18%) 24/837 (3%)
PEOPLE
Aunt 20 (65%) 3 (10%)
Baby 15 (48%) 7 (23%)
Babysitter 6 (19%) 0 (0%)
Babysitter’s name 7 (23%) 1 (3%)
Boy 9 (29%) 4 (13%)
Brother 6 (19%) 1 (3%)
Child 3 (10%) 0 (0%)
Daddy 26 (84%) 13 (42%)
Girl 9 (29%) 3 (10%)
Grandma 24 (77%) 8 (26%)
Grandpa 15 (48%) 4 (13%)

63
Lady 3 (10%) 1 (3%)
Man 4 (13%) 1 (3%)
Mommy 30 (97%) 13 (42%)
Child’s own name 21 (68%) 4 (13%)
People 4 (13%) 0 (0%)
Person 5 (16%) 0 (0%)
Sister 16 (52%) 2 (6%)
Teacher 10 (32%) 1 (3%)
Uncle 8 (26%) 1 (3%)
Total 241/620 (39%) 67/620 (11%)
GAMES AND ROUTINES
Bath 20 (65%) 4 (13%)
Breakfast 12 (39%) 1 (3%)
Bye or bye bye 28 (90%) 14 (45%)
Dinner 9 (29%) 0 (0%)
Don’t 18 (58%) 3 (10%)
Hello 15 (48%) 4 (13%)
Hi 19 (61%) 8 (26%)
Lunch 11 (35%) 1 (3%)
Nap 11 (35%) 3 (10%)
Night night 16 (52%) 5 (16%)
No 24 (77%) 10 (32%)
Patty cake 24 (77%) 6 (19%)
Peekaboo 25 (81%) 6 (19%)
Please 10 (32%) 3 (10%)
Shh/shush/hush 16 (52%) 6 (19%)
Thank you 11 (35%) 4 (13%)
Wait 12 (39%) 2 (6%)
Wanna/want to 9 (29%) 3 (10%)
Yes 14 (45%) 5 (16%)
Total 304/589 (52%) 88/589 (15%)
ACTION WORDS
Bite 17 (55%) 4 (13%)
Blow 5 (16%) 3 (10%)
Break 4 (13%) 1 (3%)
Bring 11 (35%) 2 (6%)
Bump 3 (10%) 0 (0%)
Clean 6 (19%) 0 (0%)
Close 10 (32%) 2 (6%)
Cry 9 (29%) 3 (10%)
Dance 10 (32%) 2 (6%)
Craw 4 (13%) 0 (0%)
Drink 16 (52%) 4 (13%)

64
Drive 5 (16%) 2 (6%)
Eat 20 (65%) 4 (13%)
Fall 7 (23%) 0 (0%)
Feed 7 (23%) 1 (3%)
Finish 3 (10%) 2 (6%)
Get 6 (19%) 4 (13%)
Give 9 (29%) 2 (6%)
Go 11 (35%) 4 (13%)
Help 2 (6%) 1 (3%)
Hit 11 (35%) 2 (6%)
Hug 16 (52%) 3 (10%)
Hurry 2 (6%) 0 (0%)
Jump 8 (26%) 1 (3%)
Kick 5 (16%) 1 (3%)
Kiss 21 (68%) 3 (10%)
Look 14 (45%) 5 (16%)
Love 10 (32%) 1 (3%)
Open 8 (26%) 3 (10%)
Play 12 (39%) 1 (3%)
Pull 6 (19%) 0 (0%)
Push 8 (26%) 0 (0%)
Put 7 (23%) 0 (0%)
Read 6 (19%) 2 (6%)
Ride 7 (23%) 1 (3%)
Run 6 (19%) 2 (6%)
Say 6 (19%) 0 (0%)
See 9 (29%) 3 (10%)
Show 5 (16%) 0 (0%)
Sing 7 (23%) 3 (10%)
Sleep 9 (29%) 2 (6%)
Smile 9 (29%) 3 (10%)
Splash 2 (6%) 0 (0%)
Stop 18 (58%) 7 (23%)
Swim 2 (6%) 1 (3%)
Swing 3 (10%) 0 (0%)
Take 4 (13%) 0 (0%)
Throw 8 (26%) 2 (6%)
Tickle 9 (29%) 2 (6%)
Touch 9 (29%) 0 (0%)
Watch 7 (23%) 1 (3%)
Walk 12 (39%) 2 (6%)
Wash 8 (26%) 2 (6%)
Wipe 9 (29%) 3 (10%)
Write 5 (16%) 1 (3%)
Total 453/1705 (27%) 98/1705 (6%)

65
WORDS ABOUT TIME
Day 3 (10%) 0 (0%)
Later 3 (10%) 0 (0%)
Morning 5 (16%) 1 (3%)
Night 5 (16%) 1 (3%)
Now 7 (23%) 0 (0%)
Today 3 (10%) 0 (0%)
Tomorrow 3 (10%) 0 (0%)
Tonight 7 (23%) 0 (0%)
Total 36/248 (15%) 2/248 (1%)
DESCRIPTIVE WORDS
All gone 24 (77%) 3 (10%)
Asleep 8 (26%) 0 (0%)
Bad 13 (42%) 4 (13%)
Big 3 (10%) 2 (6%)
Blue 2 (6%) 1 (3%)
Broken 2 (6%) 0 (0%)
Careful 5 (16%) 1 (3%)
Clean 4 (13%) 0 (0%)
Cold 5 (16%) 1 (3%)
Cute 6 (19%) 0 (0%)
Dark 4 (13%) 1 (3%)
Dirty 6 (19%) 2 (6%)
Dry 1 (3%) 0 (0%)
Empty 5 (16%) 0 (0%)
Fast 2 (6%) 0 (0%)
Fine 2 (6%) 0 (0%)
Gentle 2 (6%) 0 (0%)
Good 12 (39%) 2 (6%)
Happy 6 (19%) 0 (0%)
Hard 3 (10%) 1 (3%)
Hot 14 (45%) 5 (16%)
Hungry 10 (32%) 1 (3%)
Hurt 7 (23%) 1 (3%)
Little 3 (10%) 1 (3%)
Naughty 1 (3%) 0 (0%)
Nice 3 (10%) 1 (3%)
Old 2 (6%) 0 (0%)
Pretty 4 (13%) 1 (3%)
Red 2 (6%) 0 (0%)
Scared 5 (16%) 1 (3%)
Sick 3 (10%) 1 (3%)
Sleepy 11 (35%) 2 (6%)

66
Soft 3 (10%) 1 (3%)
Thirsty 8 (26%) 2 (6%)
Tired 5 (16%) 1 (3%)
Wet 8 (26%) 1 (3%)
Yucky 4 (13%) 1 (3%)
Total 208/1147 (18%) 38/1147 (3%)
PRONOUNS
Her 3 (10%) 0 (0%)
His 3 (10%) 0 (0%)
I 8 (26%) 2 (6%)
It 6 (19%) 1 (3%)
Me 6 (19%) 2 (6%)
Mine 5 (16%) 2 (6%)
My 5 (16%) 1 (3%)
That 4 (13%) 1 (3%)
This 3 (10%) 1 (3%)
You 9 (29%) 2 (6%)
Your 3 (10%) 0 (0%)
Total 55/341 (16%) 12/341 (4%)
QUESTION WORDS
How 2 (6%) 1 (3%)
What 7 (23%) 2 (6%)
When 3 (10%) 1 (3%)
Where 5 (16%) 1 (3%)
Who 4 (13%) 1 (3%)
Why 5 (16%) 1 (3%)
Total 26/186 (14%) 7/186 (4%)
PREPOSITIONS AND LOCATIONS
Away 6 (19%) 0 (0%)
Back 8 (26%) 1 (3%)
Down 11 (35%) 2 (6%)
In 7 (23%) 2 (6%)
Inside 7 (23%) 1 (3%)
Off 12 (39%) 2 (6%)
On 11 (35%) 3 (10%)
Out 9 (29%) 3 (10%)
There 5 (16%) 0 (0%)
Under 8 (26%) 0 (0%)
Up 11 (35%) 2 (6%)
Total 95/341 (28%) 16/341 (5%)

67
QUANTIFIERS
All 2 (6%) 0 (0%)
Another 2 (6%) 0 (0%)
More 5 (16%) 1 (3%)
None 4 (13%) 0 (0%)
Not 5 (16%) 1 (3%)
Other 2 (6%) 0 (0%)
Same 1 (3%) 0 (0%)
Some 4 (13%) 1 (3%)
Total 25/248 (10%) 3/248 (1%)

68
APPENDIX G
CDI/WS VOCABULARY CHECKLIST ITEM ANALYSIS
CDI/WS ITEM
EXPRESSIVE TOTAL
N = 56
SOUND EFFECTS AND ANIMAL SOUNDS
Baa baa 36 64%
Choo choo 30 54%
Cockadoodledoo 16 29%
Grrr 29 52%
Meow 39 70%
Moo 45 80%
Ouch 42 75%
Quack quack 31 55%
Uh oh 44 79%
Vroom 28 50%
Woof woof 48 86%
Yum yum 32 57%
Total 420/672 63%
ANIMALS
Alligator 10 18%
Animal 14 25%
Ant 24 43%
Bear 29 54%
Bee 24 43%
Bird 36 64%
Bug 30 54%
Bunny 23 41%
Butterfly 14 25%
Cat 44 79%
Chicken 27 48%
Cow 28 50%
Deer 10 18%
Dog 52 93%
Donkey 5 9%
Duck 36 64%
Elephant 16 29%
Fish 36 64%
Frog 20 36%
Giraffe 9 16%
Goose 8 14%
Hen 10 18%

69
Horse 27 48%
Kitty 25 45%
Lamb 8 14%
Lion 15 27%
Monkey 27 48%
Moose 7 13%
Mouse 17 30%
Owl 11 20%
Penguin 2 4%
Pig 34 61%
Pony 13 23%
Puppy 32 57%
Rooster 8 14%
Sheep 14 25%
Squirrel 15 27%
Teddybear 23 41%
Tiger 16 29%
Turkey 10 18%
Turtle 15 27%
Wolf 12 21%
Zebra 10 18%
Total 846/2408 35%
VEHICLES Airplane 29 52%
Bicycle 26 46%
Boat 18 32%
Bus 38 68%
Car 43 77%
Firetruck 17 30%
Helicopter 4 13%
Motorcycle 20 36%
Sled 4 7%
Stroller 21 38%
Tractor 8 14%
Train 30 54%
Tricycle 5 9%
Truck 38 68&
Total 301/784 38%
TOYS
Ball 46 82%
Balloon 35 63%
Bat 11 20%
Block 18 32%

70
Book 41 73%
Bubbles 30 54%
Chalk 5 9%
Crayon 24 43%
Doll 29 52%
Game 17 30%
Glue 11 20%
Pen 26 46%
Pencil 25 45%
Play dough 8 14%
Present 12 21%
Puzzle 10 18%
Story 17 30%
Toy 37 66%
Total 402/1008 40%
FOOD AND DRINKS Apple 30 54%
Applesauce 11 20%
Banana 34 61%
Beans 23 41%
Bread 32 57%
Butter 17 30%
Cake 30 54%
Candy 39 70%
Carrots 13 23%
Cereal 30 54%
Cheerios 12 21%
Cheese 31 55%
Chicken 30 54%
Chocolate 16 29%
Coffee 10 18%
Coke 13 18%
Cookie 36 64%
Corn 20 36%
Cracker 30 54%
Donut 21 38%
Drink 29 52%
Egg 24 43%
Fish 30 54%
Food 36 64%
French fries 29 52%
Grapes 22 39%
Green beans 9 16%
Gum 28 50%

71
Hamburger 22 39%
Ice 32 57%
Ice cream 25 45%
Jello 16 29%
Jelly 15 27%
Juice 37 66%
Lollipop 12 21%
Meat 28 50%
Melon 12 21%
Milk 34 61%
Muffin 8 14%
Noodles 22 39%
Nuts 12 21%
Orange 25 45%
Pancake 17 30%
Peanut butter 16 29%
Peas 13 23%
Pickle 20 36%
Pizza 23 41%
Popcorn 25 45%
Popsicle 21 38%
Potato 14 25%
Potato chip 36 64%
Pretzel 4 7%
Pudding 11 20%
Pumpkin 6 11%
Raisin 12 21%
Salt 13 23%
Sandwich 23 41%
Sauce 6 11%
Soda/pop 12 21%
Soup 13 23%
Spaghetti 25 45%
Strawberry 12 21%
Toast 12 21%
Tuna 6 11%
Vanilla 3 5%
Vitamins 8 14%
Water 40 71%
Yogurt 4 7%
Total 1380/3808 36%
CLOTHING
Beads 9 16%
Belt 28 50%

72
Bib 13 23%
Boots 20 36%
Button 14 25%
Coat 26 46%
Diaper 35 63%
Dress 18 32%
Gloves 15 27%
Hat 37 66%
Jacket 27 48%
Jeans 14 25%
Mittens 5 9%
Necklace 10 18%
Pajamas 12 21%
Pants 31 55%
Scarf 4 7%
Shirt 28 50%
Shoe 48 86%
Shorts 18 32%
Slipper 17 30%
Sneaker 5 9%
Snowsuit 3 5%
Sock 40 71%
Sweater 10 18%
Tights 4 7%
Underpants 11 20%
Zipper 13 23%
Total 515/1568 33%
BODY PARTS
Ankle 10 18%
Arm 32 57%
Belly button 19 33%
Buttocks/bottom 21 38%
Cheek 20 36%
Chin 20 36%
Ear 41 73%
Eye 46 82%
Face 35 63%
Feet 38 68%
Finger 31 55%
Hair 36 64%
Hand 38 68%
Head 37 66%
Knee 23 41%
Leg 31 55%

73
Lips 31 55%
Mouth 40 71%
Nose 40 71%
Owie/boo boo 31 55%
Penis 9 16%
Shoulder 12 21%
Tooth 30 54%
Toe 31 55%
Tongue 25 45%
Tummy 28 50%
Vagina 6 11%
Total 761/1512 50%
SMALL HOUSEHOLD ITEMS
Basket 14 25%
Blanket 29 52%
Bottle 33 59%
Box 28 50%
Bowl 29 52%
Broom 28 50%
Brush 34 43%
Bucket 12 21%
Camera 12 21%
Can 21 38%
Clock 21 38%
Comb 31 55%
Cup 43 77%
Dish 16 29%
Fork 27 48%
Garbage 18 32%
Glass 22 39%
Glasses 19 34%
Hammer 11 20%
Jar 11 20%
Keys 40 71%
Knife 20 36%
Lamp 11 20%
Light 33 59%
Medicine 20 36%
Money 32 57%
Mop 23 41%
Nail 14 25%
Napkin 18 32%
Paper 30 54%
Penny 23 41%

74
Picture 27 48%
Pillow 29 52%
Plant 13 23%
Plate 26 46%
Purse 25 45%
Radio 27 48%
Scissors 16 29%
Soap 32 57%
Spoon 33 59%
Tape 11 20%
Telephone 37 66%
Tissue/Kleenex 24 43%
Toothbrush 34 61%
Towel 26 46%
Trash 25 45%
Tray 8 14%
Vacuum 17 30%
Walker 9 16%
Watch 23 41%
Total 1165/2800 42%
FURNITURE AND ROOMS Basement 0 0%
Bathroom 28 50%
Bathtub 30 54%
Bed 39 70%
Bedroom 16 29%
Bench 6 11%
Chair 33 59%
Closet 19 34%
Couch 23 41%
Crib 7 13%
Door 43 77%
Drawer 12 21%
Dryer 11 20%
Garage 6 11%
High chair 8 14%
Kitchen 25 45%
Living room 14 25%
Oven 16 29%
Play pen 8 14%
Porch 9 16%
Potty 34 61%
Refrigerator 23 41%
Rocking chair 8 14%

75
Room 28 50%
Shower 13 23%
Sink 21 38%
Sofa 18 32%
Stairs 15 27%
Stove 19 34%
Table 24 43%
TV 40 71%
Washing machine 12 21%
Window 25 45%
Total 633/1848 34%
OUTSIDE THINGS
Backyard 14 25%
Cloud 14 25%
Flag 11 20%
Flower 25 45%
Garden 6 11%
Grass 28 50%
Hose 11 20%
Ladder 8 14%
Lawn mower 7 13%
Moon 17 30%
Pool 22 39%
Rain 35 63%
Rock 23 41%
Roof 10 18%
Sandbox 4 7%
Shovel 6 11%
Sidewalk 8 14%
Sky 21 38%
Slide 15 27%
Snow 5 9%
Snowman 6 11%
Sprinkler 3 5%
Star 23 41%
Stick 19 34%
Stone 7 13%
Street 16 29%
Sun 24 43%
Swing 19 34%
Tree 29 52%
Water 36 64%
Wind 11 20%
Total 483/1736 28%

76
PLACES TO GO
Beach 8 14%
Camping 2 4%
Church 25 45%
Circus 5 9%
Country 4 7%
Downtown 4 7%
Farm 8 14%
Gas station 10 18%
Home 30 54%
House 28 50%
Movie 14 25%
Outside 25 45%
Park 22 39%
Party 11 20%
Picnic 7 13%
Playground 8 14%
School 33 59%
Store 24 43%
Woods 4 7%
Work 15 27%
Yard 12 21%
Zoo 26 46%
Total 325/1232 26%
PEOPLE
Aunt 24 43%
Baby 43 77%
Babysitter 4 7%
Babysitter’s name 9 16%
Boy 29 52%
Brother 21 38%
Child 9 16%
Clown 9 16%
Cowboy 5 9%
Daddy 54 96%
Doctor 20 36%
Fireman 8 14%
Friend 14 25%
Girl 23 41%
Grandma 42 75%
Grandpa 35 63%
Lady 10 18%
Mailman 7 13%

77
Man 19 34%
Mommy 53 95%
Nurse 4 7%
Child’s own name 34 61%
People 10 18%
Person 4 7%
Pet’s name 11 20%
Police 17 30%
Sister 24 43%
Teacher 18 32%
Uncle 20 36%
Total 580/1624 36%
GAMES AND ROUTINES Bath 33 59%
Breakfast 16 29%
Bye 44 79%
Call (on phone) 28 50%
Dinner 14 25%
Give me five! 30 54%
Gonna get you! 24 43%
Go potty 29 52%
Hi 39 70%
Hello 33 59%
Lunch 16 29%
Nap 29 52%
Night night 42 75%
No 45 80%
Pattycake 38 68%
Peakaboo 43 77%
Please 31 55%
Shh/shush/hush 42 75%
Shopping 11 20%
Snack 22 39%
So big 13 23%
Thank you 44 79%
This little piggy 13 23%
Turn around 23 41%
Yes 45 80%
Total 747/1400 53%
ACTION WORDS Bite 36 64%
Blow 26 46%
Break 17 30%

78
Bring 20 36%
Build 11 20%
Bump 16 29%
Buy 21 38%
Carry 19 34%
Catch 22 39%
Chase 11 20%
Clap 32 57%
Clean 20 36%
Climb 15 27%
Close 19 34%
Cook 18 32%
Cover 17 30%
Cry 32 57%
Cut 14 25%
Dance 29 52%
Draw 17 30%
Drink 29 52%
Drive 18 32%
Drop 18 32%
Dry 16 29%
Dump 8 14%
Eat 41 73%
Fall 22 39%
Feed 19 34%
Find 17 30%
Finish 19 34%
Fit 12 21%
Fix 14 25%
Get 23 41%
Give 25 45%
Go 36 64%
Hate 8 14%
Have 19 34%
Hear 20 36%
Help 19 34%
Hide 20 36%
Hit 24 43%
Hold 24 43%
Hug 35 63%
Hurry 13 23%
Jump 25 45%
Kick 27 48%
Kiss 43 77%
Knock 23 41%

79
Lick 21 38%
Like 18 32%
Listen 19 34%
Look 30 54%
Love 33 59%
Make 10 18%
Open 34 61%
Paint 10 18%
Pick 14 25%
Play 32 57%
Pour 12 21%
Pretend 4 7%
Pull 20 36%
Push 24 43%
Put 16 29%
Read 27 48%
Ride 23 41%
Rip 6 11%
Run 28 50%
Say 18 32%
See 28 50%
Shake 13 23%
Share 17 30%
Show 13 23%
Sing 22 39%
Sit 23 41%
Skate 6 11%
Sleep 27 48%
Slide 11 20%
Smile 24 43%
Spill 11 20%
Splash 13 23%
Stand 17 30%
Stay 18 32%
Stop 37 66%
Sweep 18 32%
Swim 13 23%
Swing 16 29%
Take 17 30%
Talk 24 43%
Taste 16 29%
Tear 13 23%
Think 7 13%
Throw 18 32%
Tickle 18 32%

80
Touch 17 30%
Wait 20 36%
Wake 12 21%
Walk 29 52%
Wash 21 38%
Watch 21 38%
Wipe 19 34%
Wish 8 14%
Work 13 23%
Write 25 45%
Total 2043/5768 35%
DESCRIPTIVE WORDS Allgone 22 39%
Asleep 14 25%
Awake 12 21%
Bad 28 50%
Better 11 20%
Big 30 54%
Black 12 21%
Blue 18 32%
Broken 13 23%
Brown 10 18%
Careful 5 9%
Clean 17 30%
Cold 30 54%
Cute 13 23%
Dark 12 21%
Dirty 19 34%
Dry 11 20%
Empty 10 18%
Fast 12 21%
Fine 5 9%
First 12 21%
Full 16 29%
Gentle 4 7%
Good 23 41%
Green 12 21%
Happy 15 27%
Hard 11 20%
Heavy 14 25%
High 7 13%
Hot 33 59%
Hungry 21 38%
Hurt 20 36%

81
Last 8 14%
Little 15 27%
Long 9 16%
Loud 13 23%
Mad 12 21%
Naughty 2 4%
New 12 21%
Nice 13 23%
Noisy 11 20%
Old 14 25%
Orange 13 23%
Poor 5 9%
Pretty 17 30%
Quiet 11 20%
Red 16 29%
Sad 17 30%
Scared 14 25%
Sick 14 25%
Sleepy 23 41%
Slow 11 20%
Soft 11 20%
Sticky 10 18%
Stuck 6 11%
Thirsty 19 34%
Tiny 7 13%
Tired 17 30%
Wet 25 45%
White 8 14%
Windy 6 11%
Yellow 14 25%
Yucky 9 16%
Total 874/3528 25%
WORDS ABOUT TIME After 5 9%
Before 4 7%
Day 17 30%
Later 12 21%
Morning 22 39%
Night 32 57%
Now 15 27%
Time 10 18%
Today 10 18%
Tomorrow 9 16%
Tonight 14 25%

82
Yesterday 4 7%
Total 154/648 24%
PRONOUNS He 18 32%
Her 11 20%
Hers 8 14%
Him 15 27%
His 11 20%
I 27 48%
It 18 32%
Me 35 63%
Mine 29 52%
My 17 30%
Myself 6 11%
Our 8 14%
She 16 29%
That 15 27%
Their 5 9%
Them 9 16%
These 6 11%
They 12 21%
This 12 21%
Those 5 9%
Us 12 21%
We 14 25%
You 26 46%
Your 7 13%
Yourself 3 5%
Total 335/1400 24%
QUESTION WORDS How 8 14%
What 21 38%
When 8 14%
Where 10 18%
Which 4 7%
Who 18 32%
Why 21 38%
Total 90/392 23%
PREPOSITIONS AND LOCATIONS About 6 11%
Above 6 11%
Around 7 13%

83
At 19 34%
Away 8 14%
Back 15 27%
Behind 8 14%
Beside 4 7%
By 22 39%
Down 21 38%
For 8 14%
Here 13 23%
Inside/in 20 36%
Into 7 13%
Next to 1 2%
Of 7 13%
Off 31 55%
On 35 63%
On top of 5 9%
Out 23 41%
Over 9 16%
There 9 16%
To 15 27%
Under 13 23%
Up 24 43%
With 10 18%
Total 346/1456 24%
QUANTIFIERS AND ARTICLES A 22 39%
All 17 30%
A lot 12 21%
An 4 7%
Another 6 11%
Any 6 11%
Each 8 14%
Every 5 9%
More 21 38%
Much 6 11%
Not 11 20%
None 11 20%
Other 7 13%
Same 5 9%
Some 16 29%
The 11 20%
Too 21 38%
Total 189/952 20%

84
HELPING VERBS Am 13 23%
Are 6 11%
Be 16 29%
Can 16 29%
Could 8 14%
Did/ didya 14 25%
Do 20 36%
Does 6 11%
Don’t 15 27%
Gonna/ going to 9 16%
Gota/ got to 7 13%
Hafta/ have to 10 18%
Is 16 29%
Lemme/ let me 21 38%
Need/ need to 10 18%
Try / try to 6 11%
Wanna/ want to 16 29%
Was 7 13%
Were 5 9%
Will 7 13%
Would 7 13%
Total 235/1176 20%
CONNECTING WORDS And 12 21%
Because 8 14%
But 10 18%
If 7 13%
So 19 34%
Then 7 13%
Total 63/336 19%

85
VITA
Elizabeth Waters Wooden was born and raised in Saint Joseph, Louisiana. She received
her Bachelor of Arts degree in communication disorders from Louisiana State University in May
2004. She entered graduate school in August 2004 to pursue a Master of Arts degree in speech
language pathology. Mrs. Wooden worked as a graduate assistant in the Office of Graduate
Records and as a teaching assistant for the Department of Communication Sciences and
Disorders during her graduate program. Upon completion of her master’s degree in May 2006,
she plans to complete her clinical fellowship year and aspires to enter a doctorate program after
gaining experience in a clinical setting.