The LUISA-RHOMOLO combination for the evaluation of ...
16
1 The LUISA-RHOMOLO combination for the evaluation of territorial impact of European policies Carlo Lavalle *, Francesco Di Comite, Filipe Batista e Silva, Olga Diukanova, Pilar Vizcaino, Claudia Baranzelli, Vasco Diogo, Mert Kompil European Commission, Joint Research Centre, Directorate B – Growth and Innovation, Territorial Development Unit *[email protected] The views expressed purely those of the authors and may not in any circumstances be regarded as stating an official position of the European Commission. Abstract Recognition of the importance of the territorial dimension is at the core of the EU structural policies and has been since its inception. Public investments play an important role in affecting economic performance of regions by stimulating factor productivity improvements, productive capacity, capital accumulation, and creating complex spillover effects. Growth and job creation depend on the capacity to make the best use of all territorial assets and to build links with other territories to ensure that common assets are used in a coordinated and sustainable way. For example, the analysis of the national, regional and urban dimensions of Europe 2020 shows that the performance within a single Member State can vary widely. Recognizing the need to measure and to predict the impacts of public policies, European Commission (specifically DG REGIO and DG JRC) has developed a number of computable multi-regional models (LUISA, CAPRI, JRC-EU-TIMES, RHOMOLO, GEM-E3). These models differ in structure and underlying assumptions, and can be used individually in order to respond to specific policy questions. In this paper, we discuss the ways of interaction, data and projections exchange between two EU territorial assessment models: the LUISA and the RHOMOLO models. Such interaction would permit to align the base year data and models' assumptions, improve models' database, enrich evaluation of policy impacts, and widen the area of models' applicability, thus allowing to answer many important policy questions of regional development at the NUTS2 level. The work presented in this paper is in progress hence results and considerations herein discussed are of preliminary nature. Introduction The financial crisis has changed overarching territorial development trajectories and only now are we gathering data showing that the impact of policy and investments can vary if analysed at national or sub- national level. These differences show huge performance gaps within single Member States and suggest that some policies should be adapted to the specific situation of a region or a city via a place-based policy development and investments. Today policies need to include a larger territorial perspective as investment and growth often depend on opportunities in territories.
Transcript of The LUISA-RHOMOLO combination for the evaluation of ...
1
The LUISA-RHOMOLO combination for the evaluation of territorial impact of European
policies
Carlo Lavalle *, Francesco Di Comite, Filipe Batista e Silva, Olga Diukanova, Pilar Vizcaino, Claudia Baranzelli,
Vasco Diogo, Mert Kompil
European Commission, Joint Research Centre, Directorate B – Growth and Innovation, Territorial
Development Unit
The views expressed purely those of the authors and may not in any circumstances be regarded as stating an
official position of the European Commission.
Abstract
Recognition of the importance of the territorial dimension is at the core of the EU structural policies and has been since its inception. Public investments play an important role in affecting economic performance of regions by stimulating factor productivity improvements, productive capacity, capital accumulation, and creating complex spillover effects. Growth and job creation depend on the capacity to make the best use of all territorial assets and to build links with other territories to ensure that common assets are used in a coordinated and sustainable way. For example, the analysis of the national, regional and urban dimensions of Europe 2020 shows that the performance within a single Member State can vary widely.
Recognizing the need to measure and to predict the impacts of public policies, European Commission (specifically DG REGIO and DG JRC) has developed a number of computable multi-regional models (LUISA, CAPRI, JRC-EU-TIMES, RHOMOLO, GEM-E3). These models differ in structure and underlying assumptions, and can be used individually in order to respond to specific policy questions.
In this paper, we discuss the ways of interaction, data and projections exchange between two EU
territorial assessment models: the LUISA and the RHOMOLO models. Such interaction would permit to align
the base year data and models' assumptions, improve models' database, enrich evaluation of policy impacts,
and widen the area of models' applicability, thus allowing to answer many important policy questions of
regional development at the NUTS2 level.
The work presented in this paper is in progress hence results and considerations herein discussed are of
preliminary nature.
Introduction
The financial crisis has changed overarching territorial development trajectories and only now are we
gathering data showing that the impact of policy and investments can vary if analysed at national or sub-
national level. These differences show huge performance gaps within single Member States and suggest that
some policies should be adapted to the specific situation of a region or a city via a place-based policy
development and investments. Today policies need to include a larger territorial perspective as investment
and growth often depend on opportunities in territories.
2
Whilst EU Cohesion policy is designed to mitigate these differences and ensure that poorer regions have
means to address regional challenges, investments decision may trigger asymmetric and unexpected
territorial impacts.
A number of sources provide information (quantitative and qualitative) that can be used to assess the effect
of the Cohesion policy investments (for examples, see Bachtler and Gorzelak 2007; Gardiner et al. 2011;
Marzinotto 2012; European Commission 2014; European Commission 2017). These sources give an indication
of how effectively these investments have addressed differences and imbalances, and whether they have
strengthened the capacity of national and regional economies for sustainable development and long-term
economic, social and territorial cohesion. Data at regional and urban level, if properly structured and
analysed, can give valuable information to assess the local impact of Cohesion policy investments.
Increasing the levels of cohesion of the European territories presents several challenges because of the
intrinsically dual-sided nature of the policies which might have direct or indirect impacts on the territory.
From one side, the EU policies and programmes (e.g. TEN-T, CAP, ERDF/CF, EFSI etc.) respond to wider
European frameworks where the broader continental dimension is considered. From the other side, national
and sub-national policies set local strategies, priorities and plans and are often the ultimate implementers of
EU programmes.
Whether or not European and local perspectives coincide, the ex-ante evaluation of public investment effects plays an important role in anticipating economic performance and informing policy makers. Relying on the simulation results, local decision-makers can get an idea of the effects of planned policy interventions within and beyond regional borders. Making judgments based on a sound, well-defined and transparent analytical framework, regional policy makers can participate in the debates on policy design and select alternative courses of action to increase the benefits or mitigate the losses.
For answering policy questions it is very much needed, and at the same time difficult, to correlate causes with observed territorial effects, making different models dynamically interact with each other.
Top-down and bottom-up models are the two modelling paradigms to examine the linkages between the economy and specific sectors and for ex-ante evaluation of territorial development programs. The differences in modelling approaches are rooted in a complex interplay among the purpose, model structure, assumptions, data representation (e.g. physical flows or monetary terms).
The interaction of top-down and bottom-up modelling paradigms allows combining the disaggregated technological data of bottom-up models with macroeconomic feedbacks and projections of top-down models thus improving the precision of ex-ante policy evaluation and expanding models' applicability. However, the combination of bottom-up and top-down approaches constitutes a long-standing challenge in applied policy analysis.
Due to its ability to coherently link and integrate specialised macroeconomic, demographic and geospatial models with thematic spatial databases at different scales, the LUISA Territorial Modelling Platform can facilitate the interaction of top-down and bottom-up models. In this paper we consider improving the links between the RHOMOLO and LUISA models, making these models "talk to each other" by exchanging the input-output data and aligning models' projections. Firstly, we briefly introduce LUISA and RHOMOLO models in Sections 1 and 2, respectively. Then, in Sections 3 and 4 we describe the interaction workflows among the two models. In Section 5, we provide some examples on the applicability of these model interactions for the evaluation of energy-related Smart Specialization policies. In Section 6, we discuss how linkage and integration of LUISA and RHOMOLO is envisaged. Finally, in Section 7 we provide conclusions on the prospects of combining LUISA and RHOMOLO models for the evaluation of the territorial impact of EU policies.
3
1 The LUISA model
LUISA is a pan-European territorial modelling platform for ex-ante evaluation of regional and local impacts
of European policies and trends. LUISA was developed by the JRC following the EC guidelines on Impact
Assessment procedure, originally with the aim of developing a platform capable of performing more
integrated land-use change assessments, in order to fulfil the emerging policy needs of different services of
the EC. In its current configuration, LUISA is based upon the notion of land function – a new concept for
cross-sector integration and for representing complex system dynamics. LUISA aims to contribute to the
understanding, modelling and assessment of the impacts of land functions dynamics as they interact from
local to global scales in the context of multiple and changing drivers. A land function can, for example, be
societal (e.g. provision of housing, leisure and recreation), economic (e.g. provision of production factors -
employment, investments, energy – or provision of manufacturing products and services – food, fuels,
consumer goods, etc) or environmental. Land functions are temporally and spatially dynamic, and are
constrained and driven by natural, socio-economic, and techno-economic processes. The ultimate product
of LUISA is a set of spatially explicit indicators that can be combined according to the ‘function’ of interest
and/or to the sector under assessment.
LUISA allocates (in space and time) the demand and supply of resources (biotic and abiotic, including primary
energy resources), the settlement of socio-economic activities (e.g. housing, industry, services, etc.) and
infrastructures (e.g. transport, energy, etc.). Biophysical suitability, policy targets and regulatory constraints,
economic criteria and other factors are dynamically considered in LUISA for the allocation of population,
land-based economic activities and resources. The projected territorial patterns cover all EU member states,
EFTA and Western Balkan countries at a detailed geographical resolution (100m), typically until 2050.
LUISA relies on inputs from several external models, coherently linking specialised macroeconomic,
demographic and geospatial models with thematic spatial databases that provide information on, for
example, the provision and access to services (e.g. public structures, ecosystems, recreational and cultural
sites, etc.) and availability of infrastructures for housing, transport, energy, etc.
For its the baseline configuration, LUISA typically uses the output of the computable general equilibrium
(CGE) macro-economic model (typically the ‘GEM-E3’ General Equilibrium Model for Energy-Economy-
Environment model) which provides annual GVA growth rates with national and sectoral detail. The
growth rates are used to project GVA from the base year (e.g. 2015) and generate a trajectory of future
GVA that describes the Reference scenario (baseline). Macro-economic feedbacks are integrated in
LUISA modelling framework by using the regional, sectoral-specific GVA projections to derive the land
demand for industrial, commercial and services land uses, which is then spatially allocated using the
allocation model of LUISA. Alterations to the baseline (or reference) scenario can then be created by
introducing policy alternatives or shocks (e.g. investments) in the modelling framework.
Considering the large social and economic differences between regions within a same country, it essential to
build the LUISA baseline and policy scenarios using regional (i.e. at the NUTS2 or NUTS3 level) rather than
country-level projections. The elaboration of baseline (or reference) scenario is endogenous in LUISA, based
upon a process of downscaling of socio-economic parameters available a National scale (Batista et al., 2016).
2 The RHOMOLO model
The dynamic multi-regional general equilibrium model RHOMOLO was developed by the Regional Economic
Modelling Team of the JRC.B.3 unit with the objective to provide scientific support to EU policymaking by
evaluating the policy instruments available under the Cohesion Policy toolkit.
4
The model settings follow closely Mercenier et al. (2016). The regional structure of the model follows the
European Nomenclature of Territorial Units for Statistics at the level two (NUTS2) since they are the basic
regions for the application of regional policies. The current version of RHOMOLO covers the Social Accounting
Matrixes (SAMs) of 270 NUTS2 regions of all EU Member States and each regional economy is disaggregated
into six NACE Rev. 1.1 sectors (agriculture, manufacturing and construction, business services, financial
services, public services, and R&D). Regional SAMs are complemented with the matrixes of trade and
transport flows based on López-Cobo (2016) and Álvarez-Martínez and López-Cobo (2016). Transport costs
for trade between regions are of iceberg type and are sector- and region-pair specific. An asymmetric trade
cost matrix was derived from the European Commission’s transport model TRANSTOOLS (see Brandsma and
Kancs, 2015; Brandsma et al., 2015). Goods are consumed by households, governments and firms. Industries
can function in perfectly or monopolistically competitive settings. Labour is disaggregated by high-, medium-
and low skilled groups. R&D output is produced at a national level; high-skilled labour is the only production
input to the national R&D good. National R&D good is consumed by the regional non-R&D sectors within a
country; it is neither exported nor imported to other countries. Unemployment is modelled through a wage
curve (Blanchflower and Oswald, 1995) that negatively relates real wages to the unemployment rate.
Due to the high dimensionality implied by its extensive regional disaggregation, the dynamics of the model
are kept relatively simple: expectations of economic agents are assumed to be myopic, as they optimize
within a one-year period, and the model is solved recursively year by year. Due to myopic expectations, the
recursive framework acts as a "surprise-announcement of policy changes" which can result in steep economic
adjustment paths.1
The econometric techniques are applied in order to determine the influence of ERDF (or ECP) funding on
specific model parameters (for example, funds designated to Human Capital bring upon the labour
productivity improvements; funding for Research, Technical Development and Innovation generate
improvements in total factor productivity; funds aimed at investment in Infrastructure are modelled as a
reduction of the transport costs).
Computer simulations with RHOMOLO are used to examine geographic features of economic activity which
influence the speed and extent of economic development thus allowing for geographical disaggregation of
country-wide policy impacts and also for evaluation of policies that implemented at regional level. Model
results help to identify the territories where the benefits or loses can be concentrated, and clarify which
impacts can be attributed to a specific policy interventions, and which were attained due to spillover effects.
This helps to identify priority areas for investment, and policy interventions and also provide a basis for
comparing net welfare benefits with prospective investment costs.
Typical outputs of RHOMOLO capture policy-caused changes by all data that are contained in the regional
Social Accounting Matrixes. It includes Gross Domestic Product (GDP) per NUTS2 regions, Gross Value Added
(GVA) per sector, consumption of goods, factors, trade flows, household income, public expenditure,
investments, unemployment rates, migration, price changes etc.
RHOMOLO is the widely used instrument for ex-ante economic impact assessment of public investments
because of its ability to capture the spatial linkages, interactions and spillovers between regional economies.
However, because of its aggregated industry structure, RHOMOLO do not include technological details, thus
tending to undercount technological changes induced by prices adjustments. In this respect, the regional
data from LUISA model can be used to disaggregate the energy supply and demand, agricultural production
1 In contrast, forward-looking CGEs are solved simultaneously for all periods, as agents optimize intertemporally, which works as a "prior announcements of policy changes", so that due to the rational expectations, economic agents can adjust to shocks before they happen, thus, producing a smooth adjustment trajectory.
5
and land use in RHOMOLO. In its turn, RHOMOLO would provide LUISA with sectors demand of intermediate
inputs and factors, their relative prices and outputs. In the following sections we describe the possibilities of
the alignment between LUISA and RHOMOLO models.
3 RHOMOLO- LUISA workflow
In order to provide the LUISA model with macro-economic feedbacks and sectoral projections at the scale of
NUTS2 regions, the macroeconomic projections of RHOMOLO model can be employed by the LUISA model
to estimate demand for goods and factors from industry and household sectors and eventually include the
impacts of sectorial investment in the dynamic regional baseline.
Such interaction starts with the alignment of base year data and models' assumptions. In order to improve
the macro-economic feedbacks of LUISA, the regional dynamic projections of RHOMOLO are calibrated
accordingly with the population projections of LUISA.
Projections of GDP, GVA, employment, migration, output, trade flows and relative prices are obtained
through computer simulations with RHOMOLO at the NUTS2 level. These projections can then be further
disaggregated to the NUTS3 level and used for the computer simulations with LUISA.
Hence, the RHOMOLO-LUISA workflow can be generally described as below:
1. Annual regional growth rates from economic projections are used to generate a baseline scenario estimate
of the GVA (2009 onwards);
2. RHOMOLO outputs consist of two separate results: a baseline (no policy is applied), and simulation (the
policy is applied);
3. A ‘policy effect’ parameter is obtained by calculating the ratio between the baseline and the policy
outputs, and it can be interpreted as the effect of Cohesion policy in regional economy;
4. The ‘policy effect’ parameter is then used to obtain a policy scenario estimates of the GVA (region and
sector specific);
5. The GVA per sector is ‘translated’ into demand for additional industrial, commercial and services
land, by means of an ‘intensity approach’;
6. An interval of minimum and maximum land demand is generated per region, based on variance of
observed past trends;
7. Land demand for new ICS land use is allocated using the discrete allocation module of the LUISA. The
allocation is resolved regionally, and it is determined essentially by the overall suitability for ICS areas and
competition between land uses.
4 LUISA - RHOMOLO workflow
The current version of RHOMOLO has a rather aggregated representation of the industry structure, featuring
only 5 sectors: Agriculture, Manufacturing & Construction, Business services, Financial services, Public
services and R&D. Despite the fact that the energy sector is a crucial part of EU economy that is interlinked
with all sectors, currently the energy-related responses of policy shocks are hidden inside the Manufacturing
& Construction composite.
However, LUISA (and other related input models such as JRC-EU-TIMES and CAPRI) models can provide
RHOMOLO with detailed data and projections of agricultural land use and production and of energy supply,
6
thus allowing for the explicit representation in RHOMOLO of the interconnected sectors that play crucial role
in the EU economy: energy, agriculture & transport.
Disaggregation of the industry structure of RHOMOLO using LUISA data permits the following:
1 Improving the quality of RHOMOLO database
2 Enriching the evaluation of policy impacts permitting to capture the influence of any policy on the key
sectors of the EU economy (energy, agriculture and transport), assessing policy impacts on energy
efficiency, energy saving, land-use/competition for land, capturing corresponding environment and
human health impacts.
3 Widening the area of RHOMOLO applicability, by allowing explicit modelling of energy, agriculture and
transport policies together with a wide range of S3 policies.
The tables and charts below illustrate how the data derived from LUISA can be used to disaggregate the
economic structure of RHOMOLO:
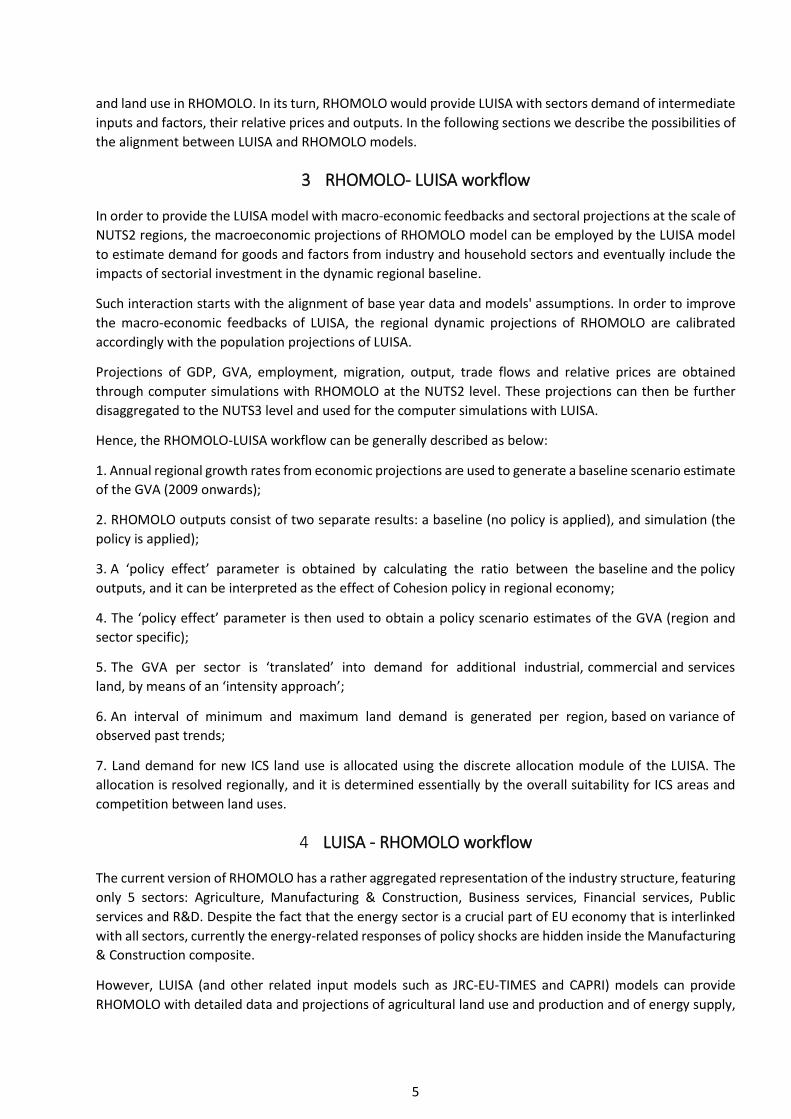
1. The following disaggregated regional data from the LUISA model can be used to separate the electricity, fuel extraction and petroleum refinement sectors from the “Manufacturing & Construction” composite sector of RHOMOLO: availability of mines, oil wells refineries and natural gas deposits in the NUTS2 regions; electricity generation by fuel type; electricity generation from renewable sources; electricity transmission; electricity networks; use, production and installed capacity of power plants. That allows for the disaggregation of energy supply, demand and inter-regional energy trade, and for the representation of different substitution possibilities among fuels, between energy and non-energy resources in production and final demand in RHOMOLO. As shown on the figures, adoption of a nested production and consumption structure with many levels of disaggregation permits to feature energy saving trough substitution between energy and non-energy inputs, allowing for evaluation of energy efficiency measures.
Figure 1 Modelling electricity production in RHOMOLO using LUISA data 2
2 Considering that extensive regional disaggregation of RHOMOLO may cause computational complexities, as
large models face a persistent trade-off between dynamic scope, geographical and sectoral details, it is
preferable to feature interfuel substitution rather than substitution between power generation technologies
electricity production
LT
transmission &
distribution
operation &
maintenance
nuclear hydro
power
generation
fossil fuels
oil gas
coal
renewables
win
d
sun
geo
therm
al
bio
mass
bio
gas
LT
CES CES oil&gas
CES

7
Figure 2 Modelling the production structure of coal mining, oil, gas extraction and petroleum
refinement sectors in RHOMOLO using LUISA data
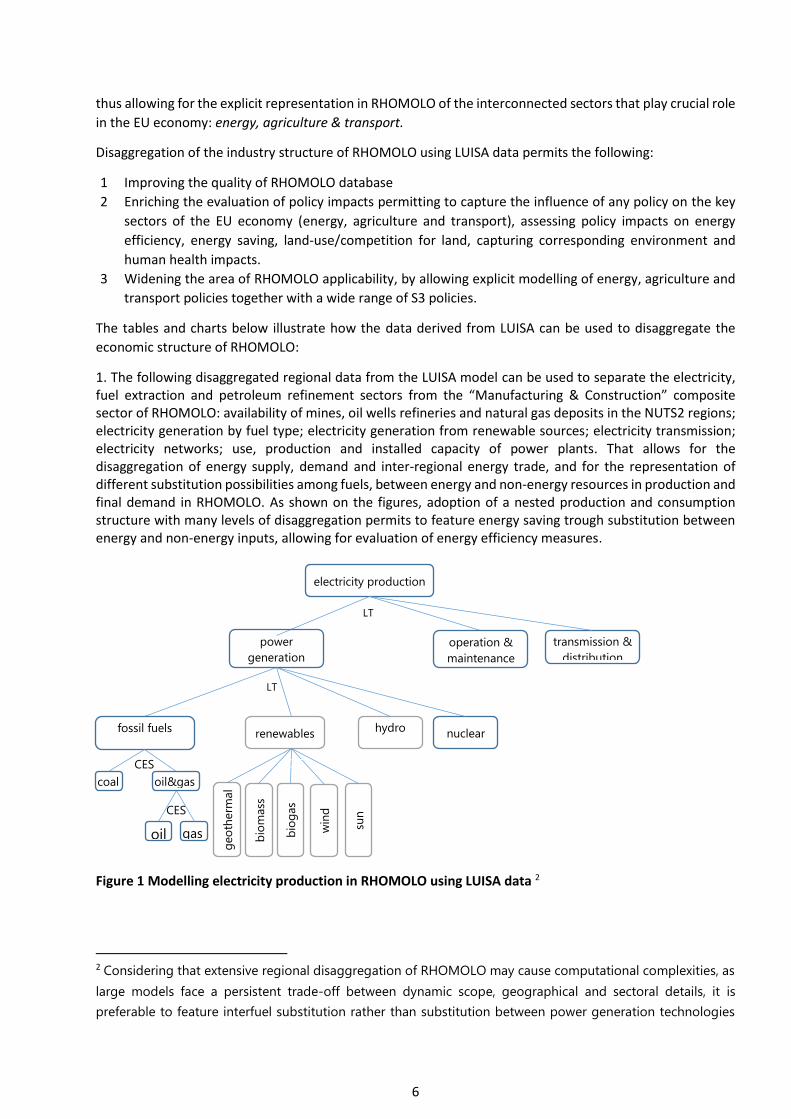
2. Due to the close interlinkages between the energy and agricultural sectors, it is important to also properly
represent the agricultural sector in RHOMOLO. The agricultural sector in RHOMOLO is currently modelled as
producing a composite agricultural good. Provision of LUISA data on land use by agricultural activities,
forestry and recreation allows not only to incorporate land as a production factor, introducing competition
for land between different agricultural uses, forestry and recreation (Figure 3), but also disaggregate the
agricultural sector by output and by-products that are used for power generations and biofuels (Figure 4).
and load differentiation Electricity production can also be modelled at a country level adopting a mechanism
of electricity distribution among the NUTS2 regions.
CES
CES
LT
LT
intermediate inputs & factors
CES
CES
capi
tal
oil&gas coal
energy&factors bundle
labo
ur electricity
oil
main or own fuel resource
()
fuel extraction /
petroleum refinement
…
non-energy intermediate inputs
gas
energy factors
fuels
CES
CES
8
Figure 3 Modelling competition for land in RHOMOLO using LUISA data3
Figure 4 Modelling the production structure of agricultural activities in RHOMOLO using LUISA data
3. The provision of LUISA regional data on outputs of agricultural sector, bioenergy production, electricity
generation from renewable sources, productivity of agricultural land, production, trade and consumption of
fertilizers can then be used in RHOMOLO to specify the nested cost structure of different agricultural
activities and their by-products (i.e. livestock and manure, poultry and poultry litter, food crops and food
crops waste, energy crops). Disaggregation of the agricultural sector featuring the different activities and by-
products is shown on
Figure 4.
3 For this exercise regional data on land use and outputs of agricultural sector from LUISA (JRC-Ispra) have to be combined with data on land rents
from the CAPRI model (JRC-Sevilla).
Livest
ock
(meat
&d
air
y)
LT
LT CES
energy&factors
…
non-energy intermediate
inputs
factors
CES
CES
oil&gas coal
electricity
oil gas
energy
fuels
CES
CES
CES CES
cap
italy
t
lab
ou
r
labour &
capital
lan
d
fert
iliz
ers
land &
fertilizers
agricultural activity
(e.g. food crops)
agricultural by-product
(e.g. food crops waste)
LT
9
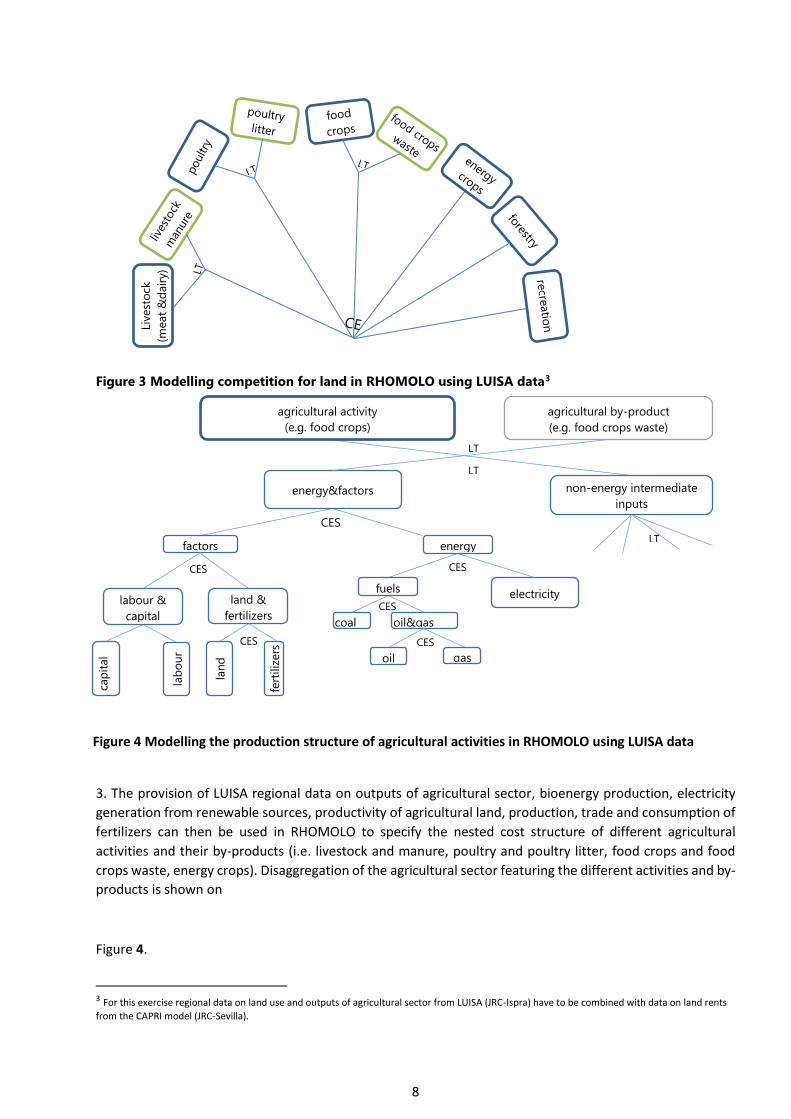
Figure 5 Modelling the production structure of bioenergy activities in RHOMOLO using LUISA data4
4. Hence, the provision of LUISA data permits to feature in RHOMOLO the supply of bioenergy inputs by agricultural sector (
Figure 4), their conversion into bioenergy products (Figure 5) and subsequent consumption in electricity generation (Figure 1) and transportation (Figure 6). Furthermore, the disaggregation of transport sector in RHOMOLO using LUISA data on biogas, biofuels, petroleum refinement, provision of transportation services enables modelling a wide range of transport-related policies, accounting for biofuels-biogas-petroleum substitution possibilities in transportation (Figure 6).
4 Similar production functions or supply curves can be adopted for modelling other renewable and back-stop technologies.
CE
S
agri materials
livestock
manure
food crops
waste
wood
residuals
poultry
litter
capital
Biogas
CE
S
CE
S
agri materials
food crops
waste energy
crops
CE
S
capital
Biomass/Biofuel
10
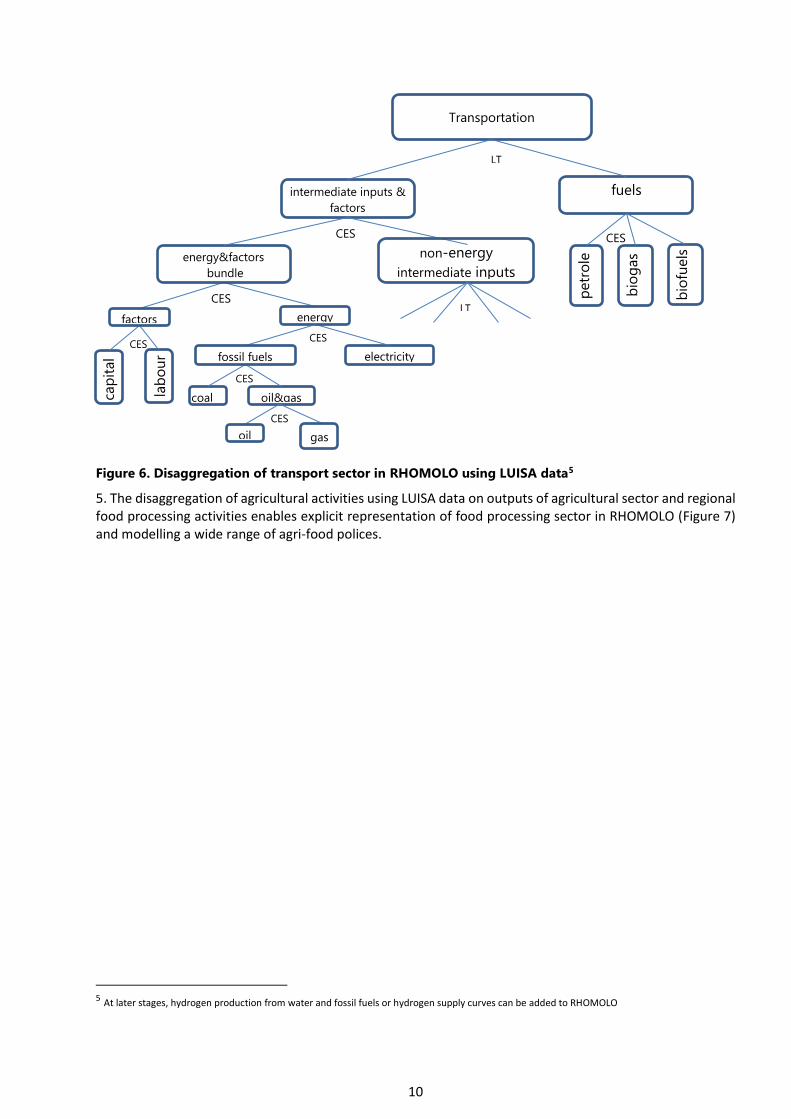
Figure 6. Disaggregation of transport sector in RHOMOLO using LUISA data5
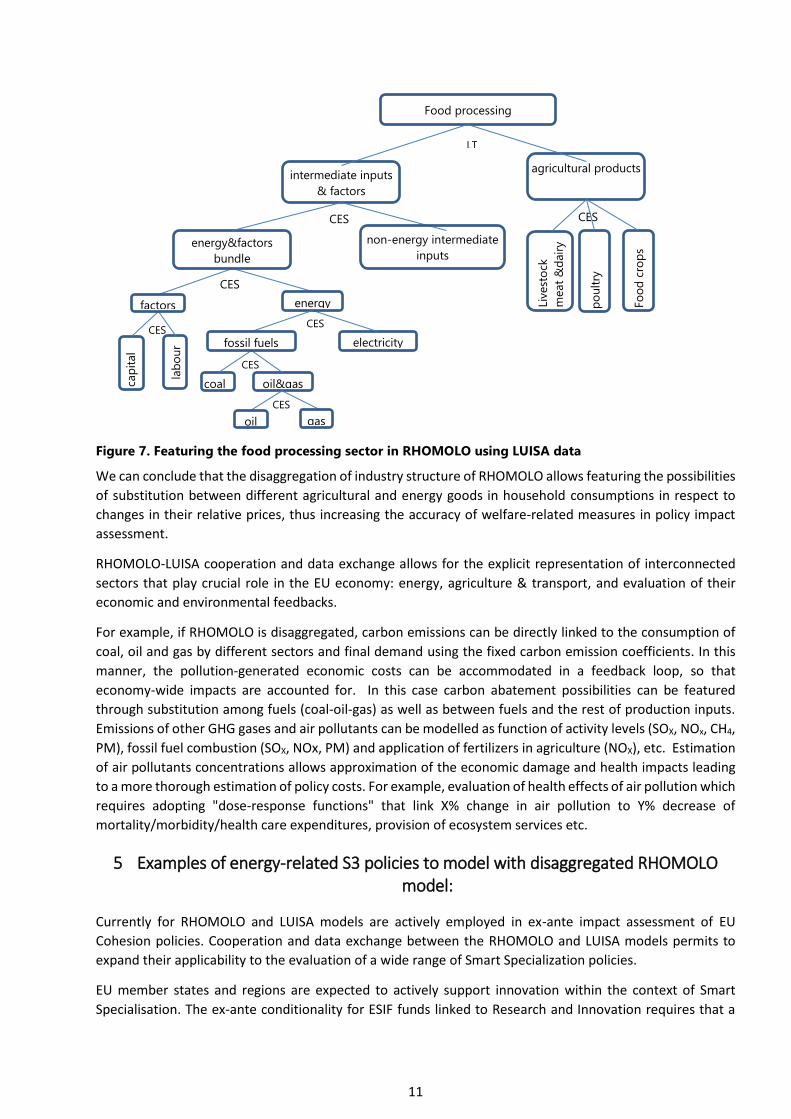
5. The disaggregation of agricultural activities using LUISA data on outputs of agricultural sector and regional food processing activities enables explicit representation of food processing sector in RHOMOLO (Figure 7) and modelling a wide range of agri-food polices.
5 At later stages, hydrogen production from water and fossil fuels or hydrogen supply curves can be added to RHOMOLO
CES
CES
LT
LT
intermediate inputs &
factors
CES
CES
cap
ital
oil&gas coal
energy&factors
bundle
lab
ou
r electricity
oil
fuels
Transportation
…
non-energy
intermediate inputs
gas
energy factors
fossil fuels
CES
CES
bio
fuels
petr
ole
um
CES
bio
gas
11
Figure 7. Featuring the food processing sector in RHOMOLO using LUISA data
We can conclude that the disaggregation of industry structure of RHOMOLO allows featuring the possibilities
of substitution between different agricultural and energy goods in household consumptions in respect to
changes in their relative prices, thus increasing the accuracy of welfare-related measures in policy impact
assessment.
RHOMOLO-LUISA cooperation and data exchange allows for the explicit representation of interconnected
sectors that play crucial role in the EU economy: energy, agriculture & transport, and evaluation of their
economic and environmental feedbacks.
For example, if RHOMOLO is disaggregated, carbon emissions can be directly linked to the consumption of
coal, oil and gas by different sectors and final demand using the fixed carbon emission coefficients. In this
manner, the pollution-generated economic costs can be accommodated in a feedback loop, so that
economy-wide impacts are accounted for. In this case carbon abatement possibilities can be featured
through substitution among fuels (coal-oil-gas) as well as between fuels and the rest of production inputs.
Emissions of other GHG gases and air pollutants can be modelled as function of activity levels (SOX, NOx, CH4,
PM), fossil fuel combustion (SOX, NOx, PM) and application of fertilizers in agriculture (NOX), etc. Estimation
of air pollutants concentrations allows approximation of the economic damage and health impacts leading
to a more thorough estimation of policy costs. For example, evaluation of health effects of air pollution which
requires adopting "dose-response functions" that link X% change in air pollution to Y% decrease of
mortality/morbidity/health care expenditures, provision of ecosystem services etc.
5 Examples of energy-related S3 policies to model with disaggregated RHOMOLO model:
Currently for RHOMOLO and LUISA models are actively employed in ex-ante impact assessment of EU
Cohesion policies. Cooperation and data exchange between the RHOMOLO and LUISA models permits to
expand their applicability to the evaluation of a wide range of Smart Specialization policies.
EU member states and regions are expected to actively support innovation within the context of Smart
Specialisation. The ex-ante conditionality for ESIF funds linked to Research and Innovation requires that a
CES
CES
LT
intermediate inputs
& factors
CES
CES
cap
ital
oil&gas coal
energy&factors
bundle
lab
ou
r electricity
oil
agricultural products
Food processing
non-energy intermediate
inputs
gas
energy factors
fossil fuels
CES
CES
Fo
od
cro
ps
Livest
ock
meat
&d
air
y
CES
po
ult
ry
12
national or regional research and innovation strategy for smart specialisation is in place, contains a
monitoring mechanism and adopt a framework outlining available budgetary resources for research and
innovation (European Parliament and Council, 2013).
We can envisage that disaggregated RHOMOLO model can be applied to evaluation and impact assessment
to virtually all S3 thematic objectives. Among them we can distinguish the following:
energy efficiency improvements, energy saving;
deployment of low carbon, renewable and backstop technologies;
smart grids-related policies, relying on econometric studies that translate policy funding into the increased efficiency of electricity transmission & distribution;
biofuels/biogas/hydrogen fuelled transportation-related policies
assessment of health benefits associated with alternative agricultural practices (e.g. organic vs non-organic farming, etc.) and agro-food production (e.g. dietary supplements, enriched products),
efficiency of food production and distribution.
6 Integration of LUISA and RHOMOLO models
A further step on the linkage between the LUISA and RHOMOLO models towards a linkage / integration of
both models, would imply a dynamic and iterative processing of both models where each model would run
on basis of the results produced by the other model.
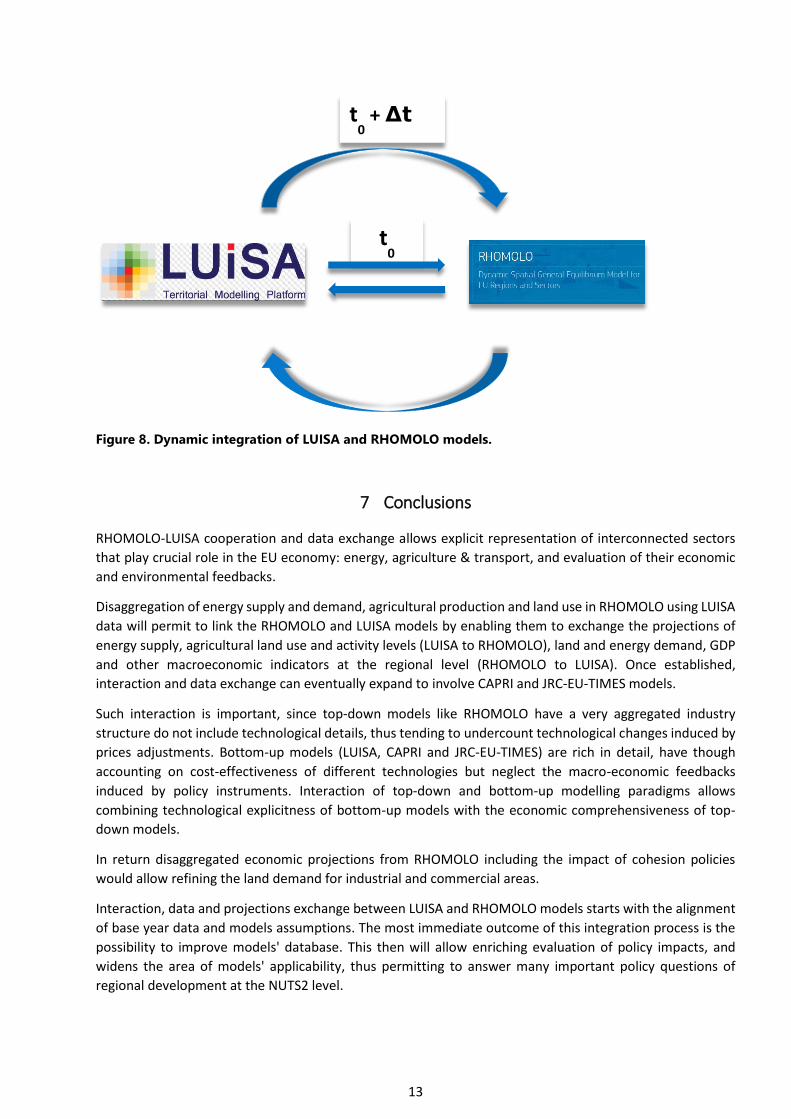
The general workflow as represented in Figure 8 would consist of the following steps:
1. Alignment of LUISA and RHOMOLO models for the base year (t0) including the same CP scenario
policies;
2. LUISA model runs for t0 with the common scenario assumptions;
3. Refinement of RHOMOLO regional SAMs, specifically with information regarding agricultural, energy
and transport sectors, based on LUISA results on land use demand for the base year;
4. RHOMOLO model runs for t0 with the common scenario assumptions and refinements from 3 and
estimates the effect of CP implementation;
5. Economic indicators of policy-caused changes from RHOMOLO are incorporated into LUISA for the
subsequent run in t0 + Δt;
6. LUISA results in land use demand for the year t0 + Δt determine new inputs for running RHOMOLO
in year t0 + Δt.
7. 5. And 6. are repeated recursively until the end of the period of simulation.
13
Figure 8. Dynamic integration of LUISA and RHOMOLO models.
7 Conclusions
RHOMOLO-LUISA cooperation and data exchange allows explicit representation of interconnected sectors
that play crucial role in the EU economy: energy, agriculture & transport, and evaluation of their economic
and environmental feedbacks.
Disaggregation of energy supply and demand, agricultural production and land use in RHOMOLO using LUISA
data will permit to link the RHOMOLO and LUISA models by enabling them to exchange the projections of
energy supply, agricultural land use and activity levels (LUISA to RHOMOLO), land and energy demand, GDP
and other macroeconomic indicators at the regional level (RHOMOLO to LUISA). Once established,
interaction and data exchange can eventually expand to involve CAPRI and JRC-EU-TIMES models.
Such interaction is important, since top-down models like RHOMOLO have a very aggregated industry
structure do not include technological details, thus tending to undercount technological changes induced by
prices adjustments. Bottom-up models (LUISA, CAPRI and JRC-EU-TIMES) are rich in detail, have though
accounting on cost-effectiveness of different technologies but neglect the macro-economic feedbacks
induced by policy instruments. Interaction of top-down and bottom-up modelling paradigms allows
combining technological explicitness of bottom-up models with the economic comprehensiveness of top-
down models.
In return disaggregated economic projections from RHOMOLO including the impact of cohesion policies
would allow refining the land demand for industrial and commercial areas.
Interaction, data and projections exchange between LUISA and RHOMOLO models starts with the alignment
of base year data and models assumptions. The most immediate outcome of this integration process is the
possibility to improve models' database. This then will allow enriching evaluation of policy impacts, and
widens the area of models' applicability, thus permitting to answer many important policy questions of
regional development at the NUTS2 level.
t0
t0 + Δt
14
List of Abbreviations
CGE Computable General Equilibrium Model
CP Cohesion Policy
ESIF European Structural and Investment Funds
GDP Gross Domestic Product
IO Input-Output
JRC Joint Research Centre
NACE Nomenclature statistique des Activités économiques dans la Communauté Européenne
SAM Social Accounting Matrix
S3 Smart Specialisation Strategy
LT Leontief production function, means that goods are complements, i.e. only fixed
proportions of each good can be used in production/consumption;
CES Constant Elasticity of Substitution production function which defines non-zero substitution
between goods in response to their price changes;
CET Constant Elasticity of Transformation production function defines possibilities of land
transformation between different activities in response to their price changes.
15
References
Álvarez-Martínez, M.T., and López-Cobo, M. (2016). National Social Accounting Matrices for the EU-27 in 2010: Building a new database for RHOMOLO, JRC Technical reports, JRC101673, European Commission, DG Joint Research Centre.
Bachtler J., and Gorzelak G. (2007). Reforming EU Cohesion Policy: A reappraisal of the performance of the structural funds. Policy Studies 28: 309-326, DOI: 10.1080/01442870701640682.
Baranzelli, C., Vandecasteele, I., Barranco, R. R., i Rivero, I. M., Pelletier, N., Batelaan, O., & Lavalle, C.
(2015). Scenarios for shale gas development and their related land use impacts in the Baltic Basin, Northern
Poland. Energy Policy, 84, 80-95.
Baranzelli, C., Jacobs-Crisioni, C., Batista e Silva, F., Perpiña Castillo, C., Barbosa, A., Arevalo Torres, J.,
Lavalle, C. (2014), The Reference scenario in the LUISA platform – Updated configuration 2014. JRC Science
and Policy Reports. Joint Research Centre, European Commission
Baranzelli, C., Aurambout, J.-P., Lavalle, C. (2016), European Regional Energy Balance and Innovation
Landscape (EREBILAND) - Energy demand of buildings. Deliverable 4: Case Studies of Optimisation.
http://dx.doi.org/10.2791/462472
Barbosa, A., Vallecillo, S., Baranzelli, C., Jacobs-Crisioni, C., Batista e Silva, F., Perpiña-Castillo, C., Lavalle, C.,
Maes, J. (2016), Modelling built-up land take in Europe to 2020: an assessment of the Resource Efficiency
Roadmap measure on land. Journal of Environmental Planning and Management: 1-25
http://dx.doi.org/10.1080/09640568.2016.1221801
Batista e Silva, F., Dijkstra,L., Vizcaino Martinez,P., Lavalle,C.(2016),Regionalisation of demographic and
economic projections – Trend and convergence scenarios from 2015 to 2060, JRC Science for policy
report. EUR27924 EN; doi: 10.2788/458769.
European Commission, DG REGIO (2014). Open Data Portal for the European Structural Investment Funds. Achievements. [En ligne] 2014. https://cohesiondata.ec.europa.eu/programmes/2014IT16M2OP002
European Commission, JRC (2014). Smart Specialisation Platform. ESIF-viewer, visualising planned investments using European Structural and Investment Funds. [Online] 2014. http://s3platform.jrc.ec.europa.eu/esif-viewer
European Commission (2014), Investment for Jobs and Growth: the 6th Report on Economic, Social and
Territorial Cohesion. Luxemboug, Publications Office of the European Union
European Commission (2017), Competitiveness in low-income and low-growth regions: The lagging regions
report. Commission Staff Working Document. European Commission, Brussels
European Parliament and Council (2013) Regulation (EU) No 1301/2013 of 17 December 2013 on the European Regional Development Fund and on specific provisions concerning the Investment for growth and jobs goal. s.l. : European Commission, 2013
Gardiner, B., Brandsma, A., Ivanova, O. and Kancs d'A. (2011) RHOMOLO: A Dynamic General Equilibrium
Modelling Approach to the Evaluation of the EU's Regional Policies. 51st Congress of the European Regional
Science Association: "New Challenges for European Regions and Urban Areas in a Globalised World", 30
August - 3 September 2011, Barcelona, Spain
López-Cobo, M. (2016). Regionalisation of Social Accounting Matrices for the EU-28 in 2010. A regional
database for RHOMOLO at NUTS 2 level, JRC Technical reports JRC104029, European Commission, DG Joint
Research Centre.

16
Marzinotto B. (2012) : The growth effects of EU cohesion policy: A meta-analysis, Bruegel Working Paper,
No. 2012/14
Mercenier, J., Álvarez-Martinez, M., Brandsma, A., Di Comite, F., Diukanova, O., Kancs, d’A., Lecca, P., López-
Cobo, M., Monfort, Ph., Persyn, D., Rillaers, A., Thissen M. and Torfs W. (2016). RHOMOLO v2 Model
Description: A spatial computable general equilibrium model for EU regions and sectors, JRC Technical reports
JRC100011, European Commission, DG Joint Research Centre, EUR 27728 EN, doi:10.2791/18446.