Working Papers - European...
24
A series of short papers on regional research and indicators produced by the Directorate-General for Regional Policy by A. Ferrara, O. Ivanova, d'A. Kancs n° 02/2010 Working Papers Modelling the Policy Instruments of the EU Cohesion Policy
Transcript of Working Papers - European...

A series of short papers on regional research and indicators produced by the Directorate-General for Regional Policy
by A. Ferrara, O. Ivanova, d'A. Kancs
n° 02/2010
Working Papers
Modelling the Policy Instruments of the EU
Cohesion Policy

2
Disclaimer: Dr Alessandro Ferrara works at DG Regional Policy, European Commission, Dr Olga Ivanova at the Netherlands Organisation for Applied Scientific Research, TNO, and Dr d'Artis Kancs at the Institute for Prospective Technological Studies, Joint Research Centre, European Commission. Views expressed in this paper are the sole responsibility of the authors and do not necessarily correspond to those of the European Commission.

3
1. IntroductionThe objective of this paper is to describe how to model the policy instruments of public investment policies in a Computable General Equilibrium (CGE) framework1. The discussion will take place in the context of EU Cohesion Policy (ECP) and by presenting the aforementioned model using the Regional Holistic Model (RHOMOLO), a multi-regional and multi-sectoral dynamic general equilibrium model with endogenous growth engines. This model is currently being developed and tested for the Directorate-General for Regional Policy (DG REGIO) by a consortium led by the Netherlands Organisation for Applied Scientific Research (TNO) and in cooperation with the Joint Research Centre-Institute of Prospective Technological Studies (JRC-IPTS).
The structure of this piece of work rests on five main sections which will be described in turn:
• the policy background including ECP objectives, financial instruments, programming, and policy instruments;
• the key principles of model policy instruments relating to the policy objectives, the policy mix, the policy impacts and the trade-off between complexity/analytical capacity of the model and the model’s feasibility in terms of mathematical tractability and data requirements;
1 CGE models are a class of economic models that use actual economic data to estimate how an economy might react to changes in policy, technology or other external factors. A model consists of: (a) formulas describing agent behaviour, market mechanism equations, and closure rules; (b) databases consistent with the said formulas. The model formulas tend to be neo-classical, assuming profit maximization by producers, and household demand based on optimising behaviour.
• the application of the said principles to RHOMOLO, focusing on demand- and supply-side effects;
• the data requirements for implementing such modelling;
• the outstanding modelling issues to be considered in the research agenda.
2. Non-technical description of RHOMOLO model
The regional holistic model (RHOMOLO) is currently being built for five European countries (Germany, Poland, Slovakia, Czech Republic and Hungary) including all their NUTS 2 regions (NUTS 1 in the case of Germany). The model integrates the economic, environmental and social dimensions in a unique framework, hence the adjective ‘holistic’.
RHOMOLO could be used not only for the ex-ante ECP impact assessment but also for ex-post impact assessment, other policy simulations and comparison between the policy scenarios. RHOMOLO incorporates the following important features:
• linking regions within a New Economic Geography (NEG) framework;
• having inter-temporal dynamic features with endogenous growth engines;
• including detailed public sector interventions;
• incorporating a multi-level governance system.
Each European country in RHOMOLO consists of several NUTS 2 (or NUTS 1 in the case of Germany) regions, which are connected by interregional trade flows of goods and services as well as interregional migration flows. Trade takes place between the regions of the same country as well as between the regions of two different countries. The pattern of interregional trade flows depends upon the preferences of consumers for buying goods from particular destinations and upon the prices of goods and associated transportation costs. Transportation costs in RHOMOLO differ by type of good and depend upon the distance between the regions of origin and destination. The larger this distance is the higher the transportation costs.
Interregional migration in RHOMOLO takes place only within the same country in the present version of the model. This is justified by the quality and availability of the data on international migration. Net immigration flow to each region of RHOMOLO depends upon the relative difference between the real wages
n° 02/2010
Modelling the Policy Instruments of the EU Cohesion Policy
Contents1. Introduction ................................................................................................3
2. Non-technical description of RHOMOLO model .................3
3. Background .................................................................................................4
4. Modelling policy instruments .........................................................5
5. Modelling policy instruments in RHOMOLO ..........................9
6. Data requirements ...............................................................................12
7. Research agenda ..................................................................................14
Appendix ........................................................................................................15
References ......................................................................................................23
4
in the region and the country average. It also depends upon the relative difference between the rate of unemployment in the region and the country average. Regions with higher real wages and lower unemployment rates will have higher net immigration.
Each NUTS 2 (or NUTS 1) region in RHOMOLO includes various economic agents: several types of households, production sectors, regional and federal government. Households in RHOMOLO are differentiated by five income classes which makes it possible to capture their specific consumption patterns and savings behaviour. Households with higher incomes consume more luxury goods and have higher savings.
Production sectors in RHOMOLO are differentiated according to Eurostat classification and include 23 different types of production sectors. Each sector produces only one type of good or service. Service sectors in RHOMOLO include both market and public sectors. Production sectors use various inputs in order to produce their output. These inputs are used in accordance with sector-specific production technology and include labour, machinery, buildings, other goods and services.
Labour in RHOMOLO is differentiated in three levels of education. Production sectors use workers with these different skills and some sectors such as high-tech or research and development use a higher proportion of highly-educated labour as compared to sectors such as agriculture and mining.
Wages are sector-specific and vary according to educational levels. They are determined by a negotiation process between the firms and trade unions and depend on labour productivity and on the bargaining power of trade unions. This makes it possible to capture differences in the institutional arrangements across EU countries.
Workers can become unemployed in RHOMOLO and unemployment rates can vary between education levels. The level of unemployment depends upon the situation of the labour market and in particular upon the mismatch between the available unemployed labour and posted vacancies. The unemployed get unemployment benefits from the government.
Production and consumption in RHOMOLO are associated with air pollution and generation of waste water and solid waste. RHOMOLO includes all main types of greenhouse gas (GHG) and non-greenhouse gas (non-GHG) emissions and the associated damage valued in monetary terms. Waste can be treated differently in RHOMOLO including deposit into land and water, incineration and recovery. Waste water can be cleaned and used again in the process of water production.
RHOMOLO is a dynamic model and allows for the analysis of each period of the simulation time horizon. This horizon is currently set at 2030 but it can be extended to longer time periods. For each year of the time horizon, RHOMOLO calculates a set of various economic, social and environmental indicators.
The economic growth rate in RHOMOLO depends positively on investments in R&D and education. By investing in R&D and education each region is able to catch up faster with the technological leader region and better adopt its technologies.
Time periods in RHOMOLO are linked by savings and investments. By the end of each time period, households, firms and government in the model save a certain amount of money. This money goes to the investment bank, distributing it as investments between
the production sectors of the various regions. The allocation decisions of the investment bank sectors depend on the sector’s financial profitability.
RHOMOLO belongs to the same family of CGE models as the QUEST model. The main differences include:
• RHOMOLO is a regional model and includes interregional trade and migration. It also models a multi-level governance system;
• RHOMOLO includes a more detailed representation of production technology;
• RHOMOLO has a more detailed sector dimension;
• RHOMOLO has a detailed social and environmental dimension;
• RHOMOLO has a less detailed representation of the financial sector;
• RHOMOLO does not use forward-looking expectations, hence it does not assume that economic agents have perfect information about the future.
As regards similarities between the two models, the following remarks can be made:
• they have a similar representation of the labour market, unemployment and wage formation;
• they have similar modelling of consumer preferences and federal government;
• both models include endogenous growth engines: it is assumed that by investing in R&D and education, higher economic growth can be achieved.
3. Background
3.1 European Cohesion Policy objectives
The ultimate ECP objective is to promote economic growth and employment and to simultaneously reduce regional disparities interpreted mainly in terms of regional income per capita and rates of unemployment. Within this ultimate objective, the relevant provisions of law2 identify the following three derived objectives:
• the convergence objective concerned with speeding up the convergence of the least developed Member States and regions. This objective focuses in particular on promoting investments in physical infrastructure, human capital, R&D and aid to productive sectors;
• the objective of regional competitiveness and employment covering all of the rest of the EU outside the convergence regions, which focuses in particular on investing in human resources and R&D and promoting entrepreneurship and environmental protection;
• the objective of European territorial cooperation which targets strengthening cross-border cooperation, transnational cooperation, interregional cooperation and exchanges of experience.
2 See Art. 3(2) of the Council Regulation (EC) No. 1083/2006 of 11 July 2006 laying down general provisions on the European Regional Development Fund, the European Social Fund and the Cohesion Fund (here after 'General Regulation').

5
To implement these objectives3, the policy instruments relating to investment in specific sectors and areas and with different intensity of aid are used within a well-identified programming, lasting seven years in the current programming. Accordingly, attention will be turned now to an overall presentation, firstly of the ECP instruments and secondly of the related ECP programming.
3.2 European Cohesion Policy instruments
Since the foundation of the European Community, in order to promote investment in different forms (physical, human, R&D, aid to productive sectors) a number of financial instruments have been introduced such as the European Social Fund (ESF), the Guidance section of the European Agricultural Guarantee and Guidance Fund (EAFFG) and the European Regional Development Fund (ERDF). Currently, more than fifty years after the Treaty of Rome, the ECP financial instruments are the ERDF, ESF and Cohesion Fund. In this regard, the use of these policy instruments is characterised by:
• targeting specific sectors of investment in well-identified eligible areas;
• modulating the intensity of aid by applying a number of co-funding rules.
Eligible sectors of investment and areasEligibility for co-funding within the ECP is defined according to two main elements: area and sector of investment. To this end, different eligibility rules apply for each of the three financial instruments. The ERDF can finance investment in regions relating to the three objectives of convergence, regional competitiveness and employment, and European territorial cooperation. Although the eligible sectors of investment are very wide, the ERDF finances mainly physical infrastructure, R&D, human capital and aid to productive investments. As to the ESF, this instrument finances mainly human capital and labour-market related investments in regions relating to the objectives of convergence and of regional competitiveness and employment. Finally, the Cohesion Fund finances projects in the field of transport, environment and energy if investment will have a beneficial impact on the environment. The Cohesion Fund may finance interventions in countries whose GNI is less than 90% of the EU-25 GNI, or where they would have been eligible assuming the same threshold for the EU-15.
Co-funding rulesAs to the level of co-funding, the following rules apply: at the National Strategic Reference Framework level, the principle of additionality and the capping rules4; at operational programme level, maximum co-funding for eligible expenditure5; and at investment project level, the funding gap given by the difference between the discounted investment costs and the discounted net revenue to identify eligible expenditure6. These rules result in using matching grants subject to the principle of additionality whose total amount and overall financial leverage depend mainly on the level of GDP, and whose specific matching rates depend on the project’s self-financing ratios7.
3 For an overview of these objectives see for example European Union, Cohesion Policy 2007-13. Commentaries and official text, 2007, pp. 10-26.
4 See Art. 15 and Annex II(7) of the General Regulation, respectively.5 See Annex III of the General Regulation.6 See Art. 55(2) of the General Regulation. It is worth noting that the funding gap does not apply
to investment projects whose financing is classified as State aid (see Art. 55(6)).7 This ratio is the complement to the one of the funding gap and is given by the ratio of
discounted net revenue and discounted investment costs.
3.3 European cohesion programming
Regional Policy is a policy with shared competence between the European Union and the Member States. Starting with the first Delors package (1988-1993), the use of such financial resources has been framed into a general programming framework which is currently made up of three main programming instruments: development plans, the so-called National Strategic Reference Frameworks; investment programmes mainly relating to regions and sectors of investment (e.g. transport or research), the so-called operational programmes; and specific investment projects.
It is worthwhile emphasizing that NSRFs identify broad policy guidelines within which operational programmes identify specific plans of expenditure. The main operational programmes are presented by region (regional operational programmes) or by the competent national ministry (sector operational programmes). The third level of planning is then represented by actual investment projects implementing the different aspects of the operational programmes.
Concerning the time schedule, at the beginning of each programming period, after the budget has been allocated to each country, Member State authorities present National Strategic Reference Frameworks and operational programmes to the European Commission. Here the negotiation is mainly about the allocation to specific sectors of investment and the maximum co-funding rates.
4. Modelling policy instrumentsThe objective of this section is to describe the key principles concerning the modelling of the ECP instruments. To this end, this section will consider in turn: the distinction between policy objectives and instruments; linking policy instruments to model variables; assessing policy impacts; and the trade-off between the model capability for policy analysis and its feasibility in terms of mathematical tractability and data requirements.
4.1 Policy instruments, target variables and direct impacts
The incorporation of the ECP programmes into an economic model requires us first of all to link policy instruments to model variables. This link is made by relating policy instruments to target variables and secondly by linking the latter to the directly impacted economic variables. To this end, let us first define these different variables and then give an example. Firstly, a policy 'instrumental variable' is a variable under the decision maker’s area of control. This means that the government may impact upon those variables with different instruments (e.g. grants, taxation, quotas, etc.). Secondly, by using such instruments, a specific variable is impacted, these are called target variables. In the case of public investment policies these target variables are normally represented by the level of (public or private) investment (e.g. transport infrastructure investment). Thirdly, the impact on the targeted variables has a direct impact on the economy depending on the type of investment made. For example in the case of transport, the direct impact on the economy can be represented by a reduction in transport costs or time savings. In order to better emphasise the difference between policy instruments and target variables, it is also worth noting that government normally

6
can (efficiently) impact only on policy instrument variables. For example, in the case of R&D, in order to facilitate new ideas in research and development and hence improve the productivity in a region, the government may increase public R&D expenditure, but not directly total factor productivity (TFP). In this case, TFP would be the target variable, and R&D expenditure would be the instrumental variable8. A counter example can be given by unemployment benefits. Here the aim is to guarantee a minimum level of income for people experiencing unemployment. These two policies clearly highlight the difference between an in-kind and cash-transfer policy9.
Now let us consider in turn a schematic representation of the relationship between policy instruments and target variables (Table 1), and between target variables and direct effects on the economy (Table 2) within the ECP scenario.
Table 1 - ECP instruments and target variables
Specific investment policy
Policy instruments(Supported sector
and intensity of the support)
Target variables
Support to physical infrastructure, human capital, and R&D
Investment in physical infrastructure
Stock of sector-specific physical capital
R&D expenditures R&D expenditures
Expenditures on improvement or
creation of human capital
Stock of human capital and/or changes in
parameters of labour market part
Aid to productive sector* Investment subsidies
Fixed costs for supported firms/
industries
* Model also allows for output subsidies which can be used for modelling agricultural policy.
The first column of Table 1 reflects two kinds of policies on which the ECP is based: support for physical infrastructure (including environment), human capital and R&D; support for productive investments. From another standpoint, those policy instruments can also be grouped into two broad categories: regional and sector policy instruments. The former are investments relating to regional infrastructure or production factors, the latter are monies paid directly to industries and firms.
The second column concerns policy instruments which in the ECP case are related to support to selected sectors and reduction of actual investment costs borne by investors using different matching grants. This clearly emphasises: (1) the conditionality aspect of co-funded investments (the specific sector and location of the investment); (2) the reduction of the relative investment cost according to the different matching rates used (the higher the co-funding, the lower the investment cost).
Finally, the third column of Table 1 represents the model variables impacted by the two policy instruments. If broad categories of expenditure are considered, clearly the impacted variables are also aggregated. In the third column, in fact, it can be generally seen that an increase in ECP expenditure results in an increase in the related form of capital in that specific sector and region.
8 For this reason, in economic models dealing with investment policies, policy instruments are modelled as exogenous parameters and targeted variables as endogenously determined variables.
9 See Cullis, J. and Jones, P., pp. 233-236, but also Tresch, R. W.
4.2 Choosing target variables
The choice of appropriate targeted variables in the model is determined by a number of factors. Firstly, the degree of aggregation within the category determines the specificity of the targeted variable. To this end, let us consider Table 2 where the policy instruments are differentiated according to the sector of investment.
Table 2 - Policy instruments and target variablesSpecific policy
instrumentsTarget variables Direct effects
Transport infrastructure
Stock of transport infrastructure
Decrease in interregional and intra-regional transportation
costs
Environmental infrastructure
Physical capital stock of waste management
facilities
Increase in the share of incinerated waste
Environmental infrastructure
Physical capital stock of waste water treatment facilities
Increase in the productivity of water
sector
EnergyPhysical capital stock of energy producing
sectors
Decrease in emissions per unit of energy use
ICT Stock of ICT infrastructure
Increase in the total factor productivity of the relevant sectors
R&D support to universities
Investment in R&D of universities
Increase in the total factor productivity of the relevant sectors
R&D support to large industries and SMEs
Investment in R&D of large industries, SMEs
Increase in the total factor productivity of the relevant sectors
Human capital (labour market functioning)
Investment in the functioning of market
institutions
Changes in parameters of labour market
Human capital (education) Stock of human capital
Higher stock of human capital; increase
in the total factor productivity of the
relevant sectors
As mentioned, column 1 represents a preliminary disaggregation of the policy instruments of each investment policy. For example, physical infrastructure can be disaggregated into transport, environment, energy and ICT infrastructure. In addition, it is possible to notice that the difference between targeted variables (mainly given by additional investment in the different forms of capital) arises also because of the impacted variables. This clearly allows modellers to provide policy analysis with greater insights resulting in significant policy implications in terms of budget allocation.
Secondly, the target variables also depend on the specificity of the ECP programmes, and on the detail of the model. The specificity of the ECP programmes determines how specific the particular ECP instrument is with respect to its implementation options within the economy and hence within the model. Some ECP programmes are rather specific in terms of their implementation possibilities whereas others offer policymakers alternative options for their implementation. For example, let us consider the case of investment in firms directly linked to research and innovation10 where it is precisely defined that this
10 This will be shown to be the category of expenditure No 6 according to the codification adopted within the ECP scenario (see Appendix 1).

7
policy invests public money in private R&D. This will result in increased expenditure on R&D and lead to an improvement in the region’s productivity. In contrast, expenditure categories such as those targeting the promotion of partnership, pacts and initiatives through the networking of relevant stakeholders can include different expenditure and be differently modelled11. In the former case, there will be only one or a few matching instrumental variables within the model, e.g. increase in expenditure on R&D; in the latter case many policy instrumental variables can be used to introduce the particular ECP programme into the model, e.g. increase in productivity of production sectors or decrease in fixed costs of production.
Thirdly, it should also be noted that the sectoral, regional, household and firm-related detail of the model also determines to what extent several ECP instruments have to be jointly implemented into the model through the same instrumental variable (despite the fact that these policy instruments address different target variables). For example, if firms in the model are heterogeneous with respect to their size, expenditure relating to assistance for R&D in large firms and SMEs12 can be implemented into the model separately. By contrast, in a model with no heterogeneity in the size of firms within one sector, such as RHOMOLO, both types of R&D investment need to be implemented similarly.
In conclusion, the choice of target variables depends on: (1) the disaggregation of the government expenditure; (2) the specificity of the same expenditure; (3) the degree of detail allowed within the model of the economy. In addition, Table 2 highlights that greater disaggregation also allows for consideration of different policy effects, the understanding of which allows in turn the model to facilitate better policy optimisation13. It is for this reason, that our attention is turned next to the issue of policy impacts.
4.3 Policy impacts
Public investment policies are characterised by two main stages: an implementation and an operational stage. The former occurs when investments are realised (e.g. the construction of a railway), the latter takes place when investments are completed and users (e.g. train travellers) are benefiting from them (e.g. through time savings or reduction of transport costs). In this regard, it is worth noting that during the implementation stage, most of the impacts are on the demand side whereas during the operational stage, impacts are in particular on the supply side. On the demand side, the impacts of public investment policies are always related to an increase in (regional or national) government expenditure, such as the increased demand for local services and goods, increase in the demand for labour and other production factors. In contrast, supply-side effects change (usually an increase) the stocks of production factors or infrastructure and/or their accumulation rates as well as technological parameters of production and other functions. They can be related to both the public and private sector. Although supply-side impacts are the main interest of policy interventions, both the demand- and the supply-side effects together with the induced general equilibrium effects jointly
11 This will be shown to be the category of expenditure No 80 according to the codification adopted within the ECP scenario (see Appendix 1).
12 This will be shown to be the category of expenditure No 4 according to the codification adopted within the ECP scenario (see Appendix 1).
13 If for example physical infrastructure is considered, this disaggregation would make it possible to answer the question of whether or not it is more convenient to invest money in specific physical infrastructure (e.g. transport or energy).
determine the net policy outcome and hence the total effect on national/regional economies14. From a modelling standpoint, the following remarks need to be made here.
As regards demand-side effects, it is important to identify when money is actually spent. This is because EU money is committed at the beginning of each year by the European Commission whereas the reimbursement to Member States’ authorities can occur throughout the year. In addition, the amounts committed (commitments) each year may be different from the amounts actually spent and reimbursed (payments). In addition, the impact over government budget constraint(s) can be modelled in terms of impact on taxation, deficit or re-allocation of other Member States’ government expenditure. Moreover, key points for modelling in this regard are those related to co-funding rates and the application of the principle of additionality.
Concerning supply-side effects per se, the so-called spillover elasticities15 must be identified. To emphasise the importance of such elasticities it is worth stressing that if they were equal to zero, then the ECP intervention would result only in Keynesian, demand-side impacts. In other words, the value assumed by spillover elasticities assesses the added value of the Cohesion Policy as compared to a cash-transfer policy. A number of relevant modelling issues can be identified when deriving such elasticities. First, their values depend on a number of complex factors including not only the structure of the economy, and government policies, but also and in particular on the quality of the NSRFs and the effectiveness of their implementation. Accordingly, it is worth noting that the most consistent approach for addressing such elasticities is to derive them endogenously within the structure of the model16. Secondly, the data requirements for deriving micro-founded spillover elasticities from information about actual investment projects can be particularly challenging17. Thirdly, from a modelling standpoint it is necessary to differentiate these elasticities by sector of investment, in order to assess the impact of alternative policy mixes within the same broad categories of expenditure (e.g. alternative transport mode infrastructure mixes within the category of transport infrastructure). Finally, it is necessary to take into account that spillover elasticities are lagged as compared to when money is actually spent. This is due to the fact that investment projects are often not completed in one year. In addition, it should also be considered that in the ECP scenario, investment projects may overlap two programming periods.
4.4 Model analytical capacity and its feasibility
From the discussion so far, it clearly emerges that the greater the level of detail, the greater the model’s capability to be used for policy analysis. However, it should also be borne in mind that highly complex models can result in a very high number of equations and can therefore be difficult to solve computationally18. In parallel, data requirements can easily become unbearable. To this end, a sensitive key question to be addressed by modellers is
14 Greater discussion on demand- and supply-side effects will be made in section 6 of this paper.15 Here we use the definition of spillover as being any indirect effect of public expenditure.16 To this end, it is worth emphasising that spillover elasticities in the HERMIN models are set
exogenously. In the QUEST model they are endogenous to some extent.17 In this regard, it is worth noting that the current spillover elasticities used in the HERMIN models
are not micro-founded and that they have been identified by considering the relevant US literature. Reference should also be made as regards the criticisms raised by the European Court of Auditors (2006) on the use of the HERMIN models to assess ECP impacts. The issue is currently being tackled in a new study launched by the Commission in 2010.
18 To this end, it is worth noting that the current version of RHOMOLO implemented in over 61 regions and 5 countries includes approximately 130 000 equations.
8
the identification of the trade-off between model capability and feasibility. To this end, the writers found themselves presented with the following issues.
Policy insights and disaggregation of investment by sectorDuring the programming period 2007-2013, according to the provisions of Annex II, Part A of the Commission Regulation (EC) No 1828/2006 of 8 December 200619 (hereafter ‘the Implementing Regulation’), the total ECP expenditure should be classified in 86 categories of expenditure20. As stated above, the implementation of the 86 ECP expenditure categories into an economic model is faced with a trade-off between the model’s capacity to be used for policy insights, and modelling feasibility in terms of technical complexity and data availability. In the case of RHOMOLO, the need to disaggregate the supply-side effects of the different sectors of investment to optimise budget allocation has already been mentioned. For example, if supply-side effects are identified only for highly aggregated categories of expenditure such as physical infrastructure, clearly this will not support decision-making related to choices between alternative transport or energy investment or within transport between different transport modes. However, it should also be borne in mind that the greater the level of disaggregation, the greater the need for micro-data and the more difficult it is to design a corresponding micro-macro approach. Data requirements in particular can often be unavailable for specific programmes as regards stock indicators and spillover elasticities.
Policy insights and aggregation of categories of expenditureWhere the aim of policymakers is to find an optimal combination of policy measures (in terms of budget allocation), it is easier to work with the limited number of policy options. This means that instead of looking for an optimal combination of 86 ECP expenditure categories, the policymaker might search for an optimal combination of 10-15 main aggregate policy instruments. A main policy instrument is an aggregate of several ECP expenditure categories. The reason is that an increase in the number of available policy instruments leads to an exponentially increasing number of their possible combinations.
In addition, it should be emphasised that by disaggregating expenditure and therefore policy impacts, spillovers between sectors of investment can be neglected. To this end, it is also worth emphasising that assuming standard spillover elasticities related to broad categories of expenditure is also based on highly simplified assumptions.
Following the above arguments, a balance between a disaggregated modelling of expenditure categories and its feasibility in terms of the solvability of the mathematical problem and data availability needs to be found21. For this reason, we are next going to consider alternative approaches to aggregating expenditure categories. To this end, it is worth noting that each approach can be seen from a bottom-up approach: specific
19 This document can be found at www.cc.cec/dgintranet/regio/documents/20072013/a_sf_reg2007_2013/corrigendum_commission_reg.pdf
20 See Appendix 1.21 In this regard, it is important to distinguish between detailed modelling of policy instruments
and detailed presentations of policy results. It is certainly true that synthesis can be very important for the presentation and communication of policy insights to policymakers.
categories of expenditure sectors of investment broad categories of investment; or from a top-down approach: broad categories of investment sectors of investment specific categories of expenditure.
Aggregation by policy impactsFrom a bottom-up perspective, this approach is based on aggregating the expenditure categories according to the kind of impacts, or from a top-down view it is based on disaggregating expenditure within a very broad category of expenditure according to direct effects. In the example of transport investment this can be a case of aggregating the investment in railways, motorways, multi-modal transport, as this kind of investment has the impact of reducing transport costs22. This kind of expenditure however, has a different impact to that of the intelligent transport system which may be argued to enhance the TFP of the sector. If this distinction is also made about the geographical effects, then the aggregation of expenditure including urban and interregional investments can also be desirable23. At a higher level of aggregation, for example, investments in renewable energies, energy efficiency and co-generation, and clean urban transport can be associated with consideration of their impact on the reduction of emissions24. This approach clearly constitutes a refinement as compared to the consideration of expenditure in very broad categories of expenditure relating for example to physical infrastructure. However, this aggregation may be questioned by the fact that aggregated expenditure can be related to different sectors and from here only reduced insights can be offered to decision-makers in terms of budget allocation.
Aggregation by sectors of investmentAnother approach is to aggregate expenditure categories by sector of investment. This aggregation is also more consistent with modelling as sectors of investment are parts of models and, hence, the ECP expenditure categories can be directly linked to the corresponding model variables. At the most aggregated level, the ECP categories of expenditure can be aggregated into four groups: infrastructure, human capital, R&D and aid to the productive sector. This is the aggregation scheme used for the ECP modelling in the QUEST model (Directorate-General for Economic and Financial Affairs), and in the Cohesion System of HERMIN models (Directorate-General for Regional Policy). In addition to being sounder from a modelling standpoint, this more standard approach also allows for comparative analyses within existing models. However, in contrast with the former approach, its main limitation is that it does not distinguish between the categories of expenditure within the same sector generating different policy impacts. Re-using the example above, although investment in transport infrastructure generates different impacts to those for investment in intelligent transport systems, they would be aggregated in the same expenditure and the same transmission channel. In addition, if distinction is made between the geographical location of the effects, then urban investments will impact within the regional economy whereas trans-European networks may impact upon the economy of more regions and
22 These investments refer to categories 16, 17, 20, 21, 26, 27 of the ECP expenditure classification.23 This would make it possible to consider separately categories 20 Railways, and 21 Railways
TEN-T.24 ECP categories of expenditure No 39-43 and 52.

9
even different countries25. Hence, for many policy questions this aggregation scheme might be too broad.
Aggregation by sectors of investment and policy impactsFollowing the analysis made above, a possible balance can be found by aggregating the categories of expenditure using several criteria simultaneously, that is, an aggregation made according to: (a) sectors of the investment (e.g. transport); (b) the nature of the impacts (e.g. reduction in transport costs). In addition, under the assumption that smaller categories of expenditure within the same broader category26 may have lower or negligible impacts on regional economies, the modelling of the ECP categories of expenditure can be prioritised by considering their budgetary importance.
In other words, a balanced approach can be based on: (1) aggregating the ECP expenditure according to the sector of investment; (2) identifying in each of these groups the most important categories according to their budgetary allocations; (3) aggregating within these groups, expenditure with similar policy impacts. This approach would make it possible to provide a good balance between model capability for policy insights and empirical feasibility.
5. Modelling policy instruments in RHOMOLO
5.1 Policy impacts: Overview
As stated above, ideally, policy instruments should be implemented into the model so that they exactly replicate all impacts of the Cohesion Policy on regional economies both on the demand and on the supply side.
On the demand side, ECP impacts relate to:
• increases in governmental spending made up of: (a) increases in governmental consumption of particular goods and services (for both regional and national governments), and demand for labour and other production factors; (b) investments in physical infrastructure and capital stocks of sectors, which increases the demand for physical investment goods such as construction, machinery, electronics, etc.;
• impact on the government budget constraint due to co-financing rules requiring relocation of the financial resources of national and regional governments and/or generation of new resources to cover the additional expenditures.
On the supply side, ECP effects include:
• changes in the available stocks of resources, that is, changes in the amount of production input, both sector-specific and in general, related to both private and public investments; under this heading, we will also explain how transportation costs and environmental effects are modelled in RHOMOLO;
• subsidies and transfers given to production sectors, which they can use to improve their productive environment;
25 In addition, different mixtures of the two types of transport infrastructure investment would generate different results from the former two.
26 This is an important remark as expenditure on human capital is in general significantly smaller than expenditure on physical infrastructure.
• technological changes including changes in the efficiency of one or several production inputs, and changes in technological parameters.
Usually, the supply-side impacts are the main interest of policy interventions. The implementation of the ECP instruments should reliably capture both the supply- and demand-side effects. The general equilibrium structure of RHOMOLO allows for representation of the inter-sectoral supply-side spillovers.
In order to capture the demand-side effects of ECP, the increase in governmental expenditure on various goods and services is calculated. First, the 86 ECP categories of expenditure can be directly associated to the 23 types of commodities and services in RHOMOLO. This is done for 13 types of ECP instruments. In the case of Cohesion Policy categories of expenditure related to the increase in governmental expenditure which could not be directly associated to RHOMOLO commodities and services, it is assumed that they increase the governmental expenditures proportionally to the share of the base year.
Secondly, a group of ECP instruments related to building physical infrastructure and physical capital of production sectors is identified. These expenditures are assumed to be distributed as additional demand for physical investment goods such as construction, machinery, electronics, etc. These physical investment goods can be bought not only from the region where ECP expenditure is taking place but also from other regions of the country. The shares of physical investment goods by type and by region are calculated using the data of the base year from regional Social Accounting Matrices (SAMs).
Thirdly, the next step is to identify a group of ECP instruments representing subsidies or transfers to production sectors and reducing their production costs. Where these transfers are given to SMEs, the ECP expenditure is distributed between sectors according to the SME production value in that particular sector. If, in contrast, transfers are given to all sectors, they are distributed to each of them proportionally to their own value of production. In such case, the channel of demand-side effect is also the channel of supply-side effect.
All ECP instruments have their own supply-side effects. We group 86 ECP instruments into the following groups which:
1. Have a direct impact on capital stock of one of the RHOMOLO sectors
2. Reduce transportation costs between the regions
3. Reduce the emission coefficient of GHG emissions
4. Increase the share of incinerated waste
5. Increase the share of treated waste water
6. Increase R&D expenditure and hence influence TFP
7. Increase human capital stock and hence influence TFP
In order to represent the effects of these different EP instruments in the model, the following features are incorporated. Firstly, the capital stock of each sector in RHOMOLO is accumulated over time; the new capital stock is equal to old capital stock minus depreciation plus new investments. Additional ECP investments increase the capital stock of regional production sectors and have positive effects upon their output.

10
Secondly, variable freight transport costs in the model are represented as a function of available kilometres of road and rail as well as regional population density. Total freight transport costs consist of constant and variable parts. Only the variable part can be influenced via a reduction in travel time generated by investments in transport infrastructure. As it depends upon the number of kilometres of rail and road and population density, the functional form of average time costs is estimated econometrically based on the ESPON data for NUTS 3. The data on variable and fixed costs of freight transport are taken from the TRANSTOOLS model. ECP expenditure is translated based on statistics from the International Transport Forum into the number of new kilometres of rail and road. This new infrastructure has an effect on time costs and hence on the total freight transport costs via savings in gasoline and drivers' wages.
Thirdly, the amount of emission per unit of GDP is assumed to be a function of governmental expenditure on environmental protection and energy intensity of the economy. Based on the time-series data from Eurostat we estimate the effect of the increase in governmental expenditure on environmental protection upon the emission coefficient.
Fourthly, the increase in the share of incinerated waste is assumed to be proportional to an increase in expenditure on waste management relative to the base year.
Fifthly, the increase of the share of treated waste water waste is assumed to be proportional to an increase in expenditure on waste water management relative to the base year.
Sixthly, the increase of R&D expenditure influencing TFP is modelled via the semi-endogenous growth TFP equation.
Finally, the increase in human capital stock influencing TFP is modelled via the semi-endogenous growth TFP equation.
5.2 Policy impacts: Demand side
Governmental expenditures on consumption goods and services and investmentThe implementation of the ECP results in an increase in governmental expenditures on various goods and services. This includes the following two results: (a) an increase in purchases of physical investment goods and services such as buildings/construction, machinery and electronics covered by the governmental budget; (b) an increase in governmental demand for a consumption bundle of goods and services such as health and education services, electronics and electricity.
A part of the ECP spending, used to improve the physical capital (technology) of the production sectors, is translated into an increase in the purchase of physical investment goods and services such as buildings/construction, machinery and electronics. The overall amount of money invested in the improvement of physical capital represents the governmental subsidies to investments in production sectors and is split between different physical investment goods and services. The split is made according to the base year (2007) data on fixed capital formation from country- and region-specific SAMs. These SAMs represent the main part of the RHOMOLO database and are constructed based on the national supply and use tables, national accounts and regional data on consumption and production. Fixed capital formation
data provides information about the composition of physical capital goods, bought in the base year, in order to become the new physical capital stock for the production sectors.
In addition, ECP includes some measures which are used to: provide assistance to firms; improve available stock of human capital; and improve market function and policy efficiency. These ECP measures are associated with additional governmental purchases of services relating to education and R&D sectors as well as additional expenditures on health and social work. In most cases, it is possible to make a direct mapping/link between the ECP measure and the type of goods and/or service which has to be bought by the government in order to support the policy measure. In several cases this was not possible due to non-homogeneity of the ECP measure. ECP expenditures belonging to these categories are split between different types of goods and services purchased by the government according to the shares of governmental expenditure in the base year from the regional SAMs described above. The link between the ECP and RHOMOLO categories of expenditure is shown in Appendix 2 whereas that between ECP expenditure and physical capital goods and services is shown in Appendix 3.
Public financingAccording to the provisions of the relevant regulations, national and regional governments need to finance part of the overall ECP expenditure. In RHOMOLO, national and regional governments have different financing options to cover the co-funding including: a reduction of their other governmental expenditures; increasing taxes such as income tax, corporate tax and VAT; issuing 30-year government bonds; and borrowing from the central bank (this increases money supply in the economy).
Before running simulations with RHOMOLO, the financing mix needs to be chosen. Each of the presented options has its own channels of influence on the economy and leads to different economic and social effects. Next, the impacts of the different financing options are considered.
Regarding the reduction of other governmental expenditures, if such an option is chosen then national and regional governments influence mostly the sale and output of the sectors traditionally associated with governmental demand including health and social work, education, public administration and defence. The reduction in governmental demand for these services leads to reducing their output and employment and to negatively impacting the household budget.
As for increasing VAT and income tax, this option is assumed to reduce the available after-tax household income and results in decreasing household demand for traditional goods and services such as food and beverages, textiles, electronics and transport equipment. The reduction in necessity goods (food and beverages) will be minimal as the shock will mainly reduce the consumption of other goods and services. Thus, the decrease in household demand will lead to a decrease in production of textile, electronics and transport equipment sectors and their respective employment.
Concerning the possibility of issuing 30-year government bonds, it is assumed that national government has a possibility of (or better = 'has an option of') borrowing money from the real economy
11
and repaying it with interest in 30 years time. Borrowing from the real economy leads to a reduction in total savings in the economy and hence reduces private investment in the production sectors. By repaying the money with interest after a 30-year period, the government increases annual savings with the repaid amount, and in turn increases in the overall savings in the economy are invested into the production sectors.
As regards the option of borrowing from the central bank, the government increases the overall money supply in the economy leading to increasing the general inflation in the country, and potentially diminishing household utility. An increase in general inflation makes domestic goods relatively more expensive than foreign goods, which leads to increased imports.
5.3 Policy impacts: Supply side
Stock of physical capital of production sectorsA number of important ECP measures are associated with improvements in production technology and/or infrastructure and lead to increased physical capital for those sectors. Physical capital is modelled in a similar way to human capital stock. It is assumed that the stock of physical capital is determined according to an accumulation law. The accumulation law represents the technology of producing physical capital stock in the economy. According to this technology, a part of the physical capital depreciates each time period. New stock of the physical capital is produced using as inputs the former stock of physical capital and investments of the representative firm.
ECP expenditures aimed at improving technology and physical infrastructure are modelled in RHOMOLO as new investments in sector-specific physical capital. These new investments increase the overall stock of sector-specific physical capital and increase the production capacity of sectors. In RHOMOLO, the ECP categories increasing physical capital are associated with the 23 production sectors of the model so that a particular type of ECP expenditure is associated with the particular type of production sector. For example investment in education infrastructure relates to an increase of physical capital in the education sector. Appendix 4 shows the match between ECP expenditure categories and an increase in the physical capital of RHOMOLO sectors.
Transportation costs RHOMOLO is built upon the framework of Spatial CGE (SCGE)27 modelling and incorporates the representation of NUTS 2 (NUTS 1 for Germany) regions. Within the SCGE framework the regions are connected by trade in goods and services, relocation of factors and economic activity and income flows. The trading of goods between regions is costly, as it is necessary to pay for the services of the national transport sector. This implies positive transportation costs. Transportation costs in RHOMOLO are both good-specific and differentiated between the origin and destination regions. The greater the distance between the regions, the higher the transportation costs.
ECP includes several important categories of expenditure associated with investments in road and rail transport infrastructure, and leads to a reduction in freight transportation costs. In RHOMOLO, econometric analyses are used to model
27 In a nutshell, a Spatial CGE is an augmented version of the Computable General Equilibrium (CGE) model, which has an explicit regional dimension.
the link between transport infrastructure investments and transportation costs. The global congestion curve – linking the average travel time of each region with its capacity measured in terms of kilometres of road and rail and its transportation flows measured in terms of population – is estimated by using cross-section data from the ESPON database at NUTS 3 level. Travel time is calculated through regressions taking into account the kilometres of road, kilometres of rail, kilometres of road divided by population and kilometres of rail divided by population. The data of country-specific costs of building additional kilometres of road and transport network are obtained from international transportation statistics. In order to assess how additional ECP investments influence transportation costs, ECP investment is firstly converted into additional kilometres of road and rail infrastructure, and secondly, into travel time savings calculated by regression.
Freight transportation costs are made up of fixed and variable costs. Only variable costs can be influenced by travel time savings. Travel time savings reduce the use of fuel, and hence make transportation cheaper. However, as fixed costs of freight transport constitute the largest part of costs, they are not significantly affected by the changes in travel time. Data from the TRANSTOOLS model on fixed and variable costs of transportation are used in order to calculate the relative changes in freight transportation costs used in RHOMOLO simulations. To derive the relative changes, the new costs are divided by old costs. Interregional and intra-regional freight transportation costs are fixed exogenously in RHOMOLO. In order to simulate the effect of the improvement in transport infrastructure these costs are multiplied with the calculated relative changes in transportation costs.
Change in interregional transportation costs in RHOMOLO leads to changes in trade flows between regions and has a direct influence upon the regional distribution of production and consumption. The overall decrease in transportation costs makes final goods cheaper, and increases their demand and their production. Appendix 5 synoptically presents the ECP expenditure categories impacting upon interregional transportation costs.
Environmental effectsEmissions. Environmental externalities in RHOMOLO are associated with GHG and non-GHG emissions as well as with hazardous and non-hazardous waste. Emissions are associated with both energy use and overall output levels of the sectors and are modelled using fixed emission coefficients. Emission coefficients are specific to each type of GHG and non-GHG emissions and represent the amount of tons of emissions in CO2 equivalent per unit of energy input and/or output. Each ton of emissions can then be monetised into its global or local damage using estimates from the EXTERNE project.
ECP includes several measures aimed at reducing emissions and enhancing environmental protection. These measures (should) affect the emission coefficients of RHOMOLO and reduce the amount of GHG and non-GHG emissions. In order to model the impact of increasing expenditure on environmental protection upon the value of emission coefficients (emissions in tons of CO2 equivalent per unit of energy use or output), regressions are run

12
using time-series data for the last 15 years at the country level from Eurostat28.
Reduction in emission coefficients due to ECP expenditure is exogenously fixed under RHOMOLO runs. Ceteris paribus, the decrease in emission coefficients reduces the overall amount of emissions and their monetary costs. Appendix 6 shows the ECP expenditure determining the change in the emission coefficients in RHOMOLO.
Solid Waste. Generation of hazardous and non-hazardous waste is associated with the production of sectors and consumption of households. The modelling is based on using fixed waste coefficients per unit of production or consumption activity. It is assumed that the waste generated can be differently managed such as in landfill sites or in incinerators. Costs and benefits depend on the related treatment. ECP co-finances investments in waste treatment management including investments in the physical infrastructure of waste treatment. In this regard, the key assumptions are that: (a) the government is able to increase the recovered share of waste by increasing expenditure on waste treatment; (b) increasing waste treatment capacity is proportional to an increase in expenditure; (c) increasing the share of recovered waste (produces energy) results in lower environmental damage from waste and reduces its monetary value given that no other economic changes take place.
Waste Water. Water is an important input to the production process as well as an essential final consumption good. Water production is performed by the regional sector called 'Collected and purified water, distribution services of water' according to the NACE 95 classification of Eurostat. Total output of clean water is determined by the availability of renewable water resources as well as capacity of water purifying plants.
Governmental investments in water purification are translated into higher capacity of purification plants. We assume that the capacity of water purification plants is linearly related to the government expenditure on these plants.
In the model, additional government expenditure on water purification is translated into additional capacity of water purification plants. This additional capacity is further translated into higher output productivity of the water sector using the information about water balance and renewable water resources in the region. The newly calculated output productivity is kept exogenously fixed under the simulations with RHOMOLO.
Production sector subsidiesAs aforementioned, ECP includes subsidies to production sectors, which can be used to improve efficiency and the technology of production processes. Such subsidies include different kinds of supporting SMEs including for example, assistance for R&D29, or promotion of environmentally-friendly products and technology. In order to model these production subsidies in RHOMOLO, the total amount of this expenditure for each ECP category of expenditure is split between 23 production sectors of the model. The split of subsidies to SMEs is based on the statistical information about the share of value added associated with SMEs in each production sector. Sectors with
28 The regression explains the variation in emissions per unit of output (EMISSt) dependent upon the logarithm of energy intensity of the economy (EIt) and the logarithm of the amount of governmental expenditure on environment (EXPt): EMISSt = a1 + a2EIt + a3EXPt + et ECP leads to an increase in government expenditure on environment; hence it increases EXPt and reduces the emission coefficient EMISSt. Reduction in EMISSt is an input to the simulations with RHOMOLO.
29 This will be category of expenditure No 4 (see Appendix 1).
a higher share of SMEs receive a higher share of production subsidies. In the case of other types of production subsidies, the list of eligible sectors for each type of ECP is identified and the total subsidies are split and allocated to each sector according to their value added. Sectors with higher value added get higher subsidies. Subsidies for production sectors are implemented in RHOMOLO as lump-sum subsidies to production sectors and decrease production costs in each time period. Appendix 7 shows the match between ECP expenditure categories, production subsidies and assistance to SMEs.
Technological changesThe specification of growth in RHOMOLO is based on the semi-endogenous growth models of economic growth and catch-up that are widely used in the literature in a leader-follower context of economic development. In this framework, productivity growth is generated through own innovations, knowledge spillovers and technology adoption (catching-up). The sector and region-specific productivity growth depends on an exogenous region-specific parameter and on the TFP level relative to the technological frontier and region’s absorptive capacity. The absorptive capacity is modelled as a function of human capital, R&D expenditure and sectoral specialisation (represented by location quotient and the Krugman specialisation index).
The stock of human capital for each regional and education level does not only depend on the time spent by households on education. It also depends positively upon the investments in education by households and national and regional government. The stock of human capital is equal to the human capital stock in the previous time period minus the amount of retired people plus the newly generated human capital. The amount of newly generated human capital depends upon the amount of time and money invested by households and government in human capital. Education and training normally requires several years to be completed, which results in a delayed effect of investments in human capital. In the case of higher education, for example, investments made 2-3 years ago will impact upon the stock of human capital only now. The same is true of other types of human capital investments. Each type of human capital investment has its own specific time lag with which it affects the stock of human capital.
A certain amount of ECP expenditure is associated with additional investment into human capital and expenditure on R&D. An increase in human capital leads to an increase in the capacity of a region to absorb new knowledge (implement new technological developments) and results in a higher level of TFP via the TFP equation (see Appendix 9 for more details). Additional expenditure on R&D has a direct impact upon sector-specific TFP through the TFP equation. Increase in TFP of regional production sectors leads in general to an increase in production, decrease in imports, and lower prices of final consumption goods. Appendix 8 presents the match between ECP expenditure categories and endogenous growth engines of RHOMOLO.
6. Data requirementsThe modelling of the ECP policy instruments in a framework of Spatial Computable General Equilibrium within New Economic Geography elements, such as RHOMOLO, requires a wide variety of data for each country included in the model. In addition, regional-level data and European-wide information is needed to complete
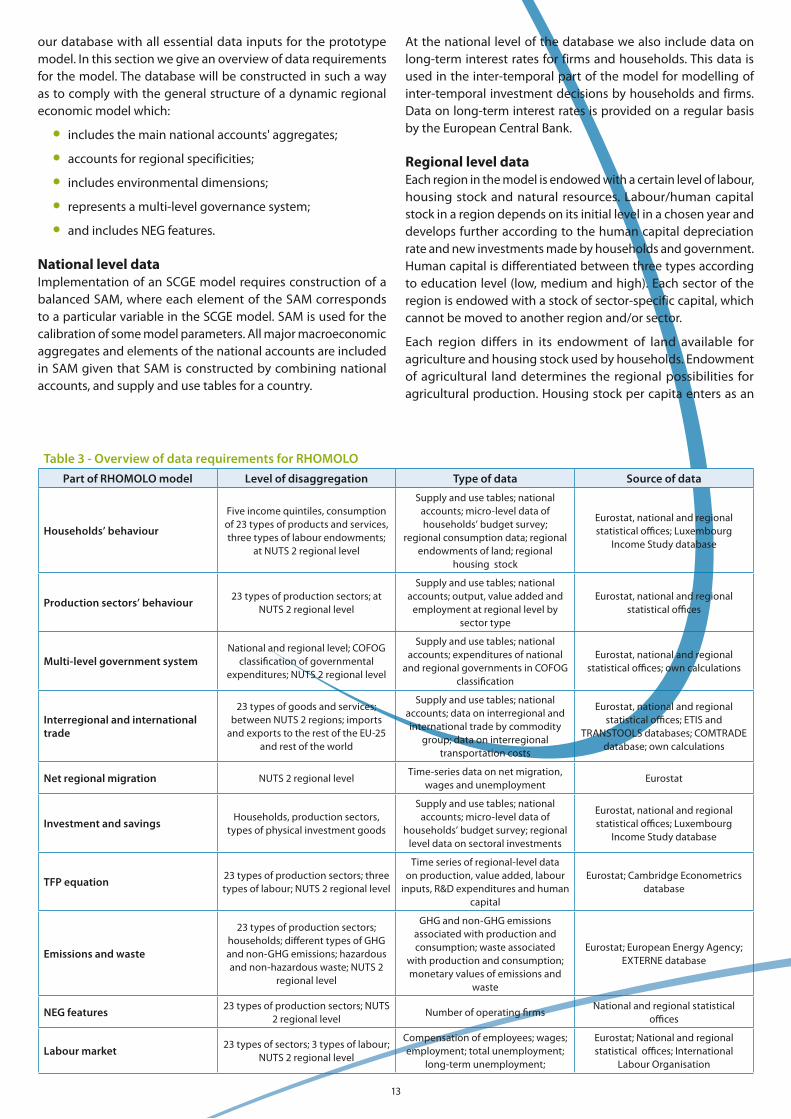
13
our database with all essential data inputs for the prototype model. In this section we give an overview of data requirements for the model. The database will be constructed in such a way as to comply with the general structure of a dynamic regional economic model which:
• includes the main national accounts' aggregates;
• accounts for regional specificities;
• includes environmental dimensions;
• represents a multi-level governance system;
• and includes NEG features.
National level dataImplementation of an SCGE model requires construction of a balanced SAM, where each element of the SAM corresponds to a particular variable in the SCGE model. SAM is used for the calibration of some model parameters. All major macroeconomic aggregates and elements of the national accounts are included in SAM given that SAM is constructed by combining national accounts, and supply and use tables for a country.
At the national level of the database we also include data on long-term interest rates for firms and households. This data is used in the inter-temporal part of the model for modelling of inter-temporal investment decisions by households and firms. Data on long-term interest rates is provided on a regular basis by the European Central Bank.
Regional level dataEach region in the model is endowed with a certain level of labour, housing stock and natural resources. Labour/human capital stock in a region depends on its initial level in a chosen year and develops further according to the human capital depreciation rate and new investments made by households and government. Human capital is differentiated between three types according to education level (low, medium and high). Each sector of the region is endowed with a stock of sector-specific capital, which cannot be moved to another region and/or sector.
Each region differs in its endowment of land available for agriculture and housing stock used by households. Endowment of agricultural land determines the regional possibilities for agricultural production. Housing stock per capita enters as an
Table 3 - Overview of data requirements for RHOMOLOPart of RHOMOLO model Level of disaggregation Type of data Source of data
Households’ behaviour
Five income quintiles, consumption of 23 types of products and services, three types of labour endowments;
at NUTS 2 regional level
Supply and use tables; national accounts; micro-level data of households’ budget survey;
regional consumption data; regional endowments of land; regional
housing stock
Eurostat, national and regional statistical offices; Luxembourg
Income Study database
Production sectors’ behaviour 23 types of production sectors; at NUTS 2 regional level
Supply and use tables; national accounts; output, value added and
employment at regional level by sector type
Eurostat, national and regional statistical offices
Multi-level government systemNational and regional level; COFOG
classification of governmental expenditures; NUTS 2 regional level
Supply and use tables; national accounts; expenditures of national
and regional governments in COFOG classification
Eurostat, national and regional statistical offices; own calculations
Interregional and international trade
23 types of goods and services; between NUTS 2 regions; imports
and exports to the rest of the EU-25 and rest of the world
Supply and use tables; national accounts; data on interregional and international trade by commodity
group; data on interregional transportation costs
Eurostat, national and regional statistical offices; ETIS and
TRANSTOOLS databases; COMTRADE database; own calculations
Net regional migration NUTS 2 regional levelTime-series data on net migration,
wages and unemploymentEurostat
Investment and savings Households, production sectors, types of physical investment goods
Supply and use tables; national accounts; micro-level data of
households’ budget survey; regional level data on sectoral investments
Eurostat, national and regional statistical offices; Luxembourg
Income Study database
TFP equation 23 types of production sectors; three types of labour; NUTS 2 regional level
Time series of regional-level data on production, value added, labour
inputs, R&D expenditures and human capital
Eurostat; Cambridge Econometrics database
Emissions and waste
23 types of production sectors; households; different types of GHG and non-GHG emissions; hazardous and non-hazardous waste; NUTS 2
regional level
GHG and non-GHG emissions associated with production and consumption; waste associated
with production and consumption; monetary values of emissions and
waste
Eurostat; European Energy Agency; EXTERNE database
NEG features 23 types of production sectors; NUTS 2 regional level
Number of operating firmsNational and regional statistical
offices
Labour market 23 types of sectors; 3 types of labour; NUTS 2 regional level
Compensation of employees; wages; employment; total unemployment;
long-term unemployment;
Eurostat; National and regional statistical offices; International
Labour Organisation

14
additional factor into the household utility function and influences the households’ decision to migrate to a certain region.
As for the NEG approach, we need data on interregional trade flows, capital and labour mobility, and regional unemployment. Main data sources for regional level data will again be national statistical institutes, Eurostat and some additional databases like the one from Cambridge Econometrics.
European level dataAll production and consumption activities in the model will be associated with emissions and environmental damage. The model incorporates the representations of all major GHG and non-GHG emissions. Emissions in the model are associated either with the use of energy by firms and households or with the overall level of the firms’ outputs.
7. Research agendaIn order to improve the reliability of the representation of ECP expenditure categories in RHOMOLO we should focus on several inter-related issues:
1. Econometric regressions used to calculate the change in transport costs, shares of incinerated waste and emission coefficients have been estimated/based on rather aggregated macro data and can be further elaborated and estimated using alternative databases.
2. In the present version of RHOMOLO we have estimated a set of regressions for the determination of changes in emission coefficients, interregional and intra-regional transport costs and the share of incinerated waste as dependent upon the value of relevant ECP investments. These estimations were made on the basis of a limited set of macro-level data. In order to improve the modelling of these important parameters in RHOMOLO we could first use an alternative and richer dataset based on either micro-level data of specific investment projects or regional-level data, and secondly, we could test some alternative formulations of econometric equations. We could also explore the possibility of enriching the model by incorporating more econometrically estimated relationships into it.
3. In some particular cases, the mapping between RHOMOLO commodities/sectors and ECP expenditure categories needs more work. This is for example true in the case of subsidies to production sectors. In the present version of RHOMOLO these subsidies are divided between the sectors proportionally to their value added. However, from past implementation of ECP we know that this is not correct. There is a set of sectors which does not receive subsidies and hence they have to be excluded from the mapping. This is just one example of possible improvement. In general, we should continue our work on mapping RHOMOLO commodities/sectors and ECP expenditure categories by using experience and information from past projects and previous experiences with ECP.
4. Greater modelling should be carried out with reference to the impact of ECP intervention on government budget constraints, in particular by taking into account the modelling of different levels of Member States’ authorities; here
attention should be paid to the fact that assuming the same objectives and constraints across tiers of government would, de facto, result in considering one level of government.
5. It should be more accurately modelled how different matching rates for sectors of investment are incorporated into the models; values related to financial rates of return should also be identified according to relevant cost-benefit analysis, as well as methods for identifying the sectoral financial rates of return from those of specific projects.
6. Alternative modelling of ECP intervention could be explored by explicitly including matching grants as lowering sector investment costs.
7. Expenditure categories should be classified more clearly into those which have intra-regional and interregional impacts.
8. Some ECP expenditure categories, such as for example 'Promotion of biodiversity and nature protection (including NATURA 2000) and 'Protection and development of natural heritage', do not have any supply-side effects in RHOMOLO at the moment. Even though modelling of supply-side effects associated with these categories of expenditure represents an interesting scientific challenge, it should not be given a high priority since the budgetary importance of these expenditure categories is low.
9. One key issue to be further explored is the application of modelling nested-policy instruments consistent with the theory of multi-stage (optimal) budgeting30.
10. Attention should be paid to the use of alternative data sources including the micro-level data of the European Community Household Panel, EU Labour Force Survey, EU SILC and AMADEUS. These data sources make it possible to build up better regional data and this will require significant work.
11. New Eurostat time-series data on interregional migration can be used in order to improve the migration part of RHOMOLO. Both functional form and parameters can be changed based on this new data set.
12. The present version of RHOMOLO is based on the Directorate-General Mobility and Transport (DG MOVE) database on interregional freight flows and transportation costs called ETIS. This database is a basis for the TRANSTOOLS model used by IPTS and DG MOVE. This database should be improved further in several forthcoming studies. RHOMOLO should be updated once the improved database becomes available.
30 See in this regard, Deaton, A. and Muellabaur, J., pp. 127-137.

15
AppendixAppendix 1 - Full list of ECP expenditure categories
Expenditure category No of expenditure category
R&TD activities in research centres 1
R&TD infrastructure (including physical plant, instrumentation and high-speed computer networks linking research centres) and centres of competence in a specific technology 2
Technology transfer and improvement of cooperation networks between small businesses (SMEs), between these and other businesses and universities, post-secondary education establishments of all kinds, regional authorities, research centres and scientific and technological poles (scientific and technological parks, technopoles, etc.)
3
Assistance to R&TD, particularly in SMEs (including access to R&TD services in research centres) 4
Advanced support services for firms and groups of firms 5
Assistance to SMEs for the promotion of environmentally-friendly products and production processes (introduction of an effective environment managing system, adoption and use of pollution prevention technologies, integration of clean technologies into firm production)
6
Investment in firms directly linked to research and innovation (innovative technologies, establishment of new firms by universities, existing R&TD centres and firms, etc.) 7
Other investment in firms 8
Other measures to stimulate research and innovation and entrepreneurship in SMEs 9
Telephone infrastructures (including broadband networks) 10
Information and communication technologies (access, security, interoperability, risk-prevention, research, innovation, e-content, etc.) 11
Information and communication technologies (TEN-ICT) 12
Services and applications for the citizen (e-health, e-government, e-learning, e-inclusion, etc.) 13
Services and applications for SMEs (e-commerce, education and training, networking, etc.) 14
Other measures for improving access to and efficient use of ICT by SMEs 15
Railways 16
Railways (TEN-T) 17
Mobile rail assets 18
Mobile rail assets (TEN-T) 19
Motorways 20
Motorways (TEN-T) 21
National roads 22
Regional/local roads 23
Cycle tracks 24
Urban transport 25
Multimodal transport 26
Multimodal transport (TEN-T) 27
Intelligent transport systems 28
Airports 29
Ports 30
Inland waterways (regional and local) 31
Inland waterways (TEN-T) 32
Electricity 33
Electricity (TEN-E) 34
Natural gas 35
Natural gas (TEN-E) 36
Petroleum products 37
Petroleum products (TEN-E) 38
Renewable energy: wind 39
Renewable energy: solar 40
Renewable energy: biomass 41
Renewable energy: hydroelectric, geothermal and other 42
Energy efficiency, co-generation, energy management 43
Management of household and industrial waste 44

16
Management and distribution of water (drinking water) 45
Water treatment (waste water) 46
Air quality 47
Integrated prevention and pollution control 48
Mitigation and adaptation to climate change 49
Rehabilitation of industrial sites and contaminated land 50
Promotion of biodiversity and nature protection (including NATURA 2000) 51
Promotion of clean urban transport 52
Risk prevention (including the drafting and implementation of plans and measures to prevent and manage natural and technological risks) 53
Other measures to preserve the environment and prevent risks 54
Promotion of natural assets 55
Protection and development of natural heritage 56
Other assistance to improve tourist services 57
Protection and preservation of the cultural heritage 58
Development of cultural infrastructure 59
Other assistance to improve cultural services 60
Integrated projects for urban and rural regeneration 61
Development of life-long learning systems and strategies in firms; training and services for employees to step up their adaptability to change; promoting entrepreneurship and innovation 62
Design and dissemination of innovative and more productive ways of organising work 63
Development of specific services for employment, training and support in connection with restructuring of sectors and firms, and development of systems for anticipating economic changes and future requirements in terms of jobs and skills
64
Modernisation and strengthening of labour market institutions 65
Implementing active and preventive measures on the labour market 66
Measures encouraging active ageing and prolonging working lives 67
Support for self-employment and business start-up 68
Measures to improve access to employment and increase sustainable participation and progress of women in employment to reduce gender-based segregation in the labour market, and to reconcile work and private life, such as facilitating access to childcare and care for dependent persons
69
Specific action to increase migrants' participation in employment ... 70
Pathways for integration and re-entry into employment for disadvantaged people; combating discrimination in accessing and progressing in the labour market and promoting acceptance of diversity at the workplace
71
Design, introduction and implementation of reforms in education and training systems in order to develop employability, improving the labour market relevance of initial and vocational education and training, and updating skills of training personnel with a view to innovation and a knowledge-based economy
72
Measures to increase participation in education and training throughout the life-cycle, including through action to achieve a reduction in early school leaving, gender-based segregation of subjects and increased access to and quality of initial vocational and tertiary education and training
73
Developing human potential in the field of research and innovation, in particular through post-graduate studies and training of researchers, and networking activities between universities, research centres and businesses
74
Education infrastructure 75
Health infrastructure 76
Childcare infrastructure 77
Housing infrastructure 78
Other social infrastructure 79
Promoting partnership , pacts and initiatives through the networking of relevant stakeholders 80
Mechanisms for improving good policy and programme design, monitoring and evaluation at national, regional and local level, and capacity building in the delivery of policies and programmes 81
Compensation of any additional costs due to accessibility deficit and territorial fragmentation 82
Specific action addressed to compensate additional costs due to market size factors 83
Support to compensate additional costs due to climate conditions and relief difficulties 84
Mechanisms for improving good policy and programme design, monitoring and evaluation at national, regional and local level, and capacity building in the delivery of policies and programmes 85
Compensation of any additional costs due to accessibility deficit and territorial fragmentation 86

17
Appendix 2 - ECP and RHOMOLO expenditure
Expenditure categoryNo of expenditure
categoryGovernmental expenditure
on RHOMOLO sector
R&TD activities in research centres 1 Research and development
Technology transfer and improvement of cooperation networks between small businesses (SMEs), between these and other businesses and universities, post-secondary education establishments of all kinds, regional authorities, research centres and scientific and technological poles (scientific and technological parks, technopoles, etc.)
3 Split according to base year data
Assistance to R&TD, particularly in SMEs (including access to R&TD services in research centres) 4 Split according to base year data
Advanced support services for firms and groups of firms 5 Split according to base year data
Assistance to SMEs for the promotion of environmentally-friendly products and production processes (introduction of effective environment managing system, adoption and use of pollution prevention technologies, integration of clean technologies into firm production)
6 Split according to base year data
Investment in firms directly linked to research and innovation (innovative technologies, establishment of new firms by universities, existing R&TD centres and firms, etc.) 7 Research and development
Other investment in firms 8 Split according to base year data
Other measures to stimulate research and innovation and entrepreneurship in SMEs 9 Split according to base year data
Information and communication technologies (access, security, interoperability, risk-prevention, research, innovation, e-content, etc.) 11 Split according to base year data
Services and applications for the citizen (e-health, e-government, e-learning, e-inclusion, etc.) 13 Split according to base year data
Services and applications for SMEs (e-commerce, education and training, networking, etc.) 14 Split according to base year data
Other measures for improving access to and efficient use of ICT by SMEs 15 Split according to base year data
Rehabilitation of industrial sites and contaminated land 50 Split according to base year data
Promotion of biodiversity and nature protection (including NATURA 2000) 51 Split according to base year data
Risk prevention (including the drafting and implementation of plans and measures to prevent and manage natural and technological risks) 53 Split according to base year data
Other measures to preserve the environment and prevent risks 54 Split according to base year data
Promotion of natural assets 55 Split according to base year data
Protection and development of natural heritage 56 Split according to base year data
Other assistance to improve tourist services 57 Split according to base year data
Protection and preservation of the cultural heritage 58 Split according to base year data
Development of cultural infrastructure 59 Split according to base year data
Other assistance to improve cultural services 60 Split according to base year data
Integrated projects for urban and rural regeneration 61 Split according to base year data
Development of life-long learning systems and strategies in firms; training and services for employees to step up their adaptability to change; promoting entrepreneurship and innovation
62 Split according to base year data
Design and dissemination of innovative and more productive ways of organising work 63 Split according to base year data
Development of specific services for employment, training and support in connection with restructuring of sectors and firms, and development of systems for anticipating economic changes and future requirements in terms of jobs and skills
64 Split according to base year data
Modernisation and strengthening labour market institutions 65Public administration and
defence: compulsory social security
Implementing active and preventive measures on the labour market 66Public administration and
defence: compulsory social security
Measures encouraging active ageing and prolonging working lives 67Public administration and
defence: compulsory social security
Support for self-employment and business start-up 68Public administration and
defence: compulsory social security
Measures to improve access to employment and increase sustainable participation and progress of women in employment to reduce gender-based segregation in the labour market, and to reconcile work and private life, such as facilitating access to childcare and care for dependent persons
69Public administration and
defence: compulsory social security
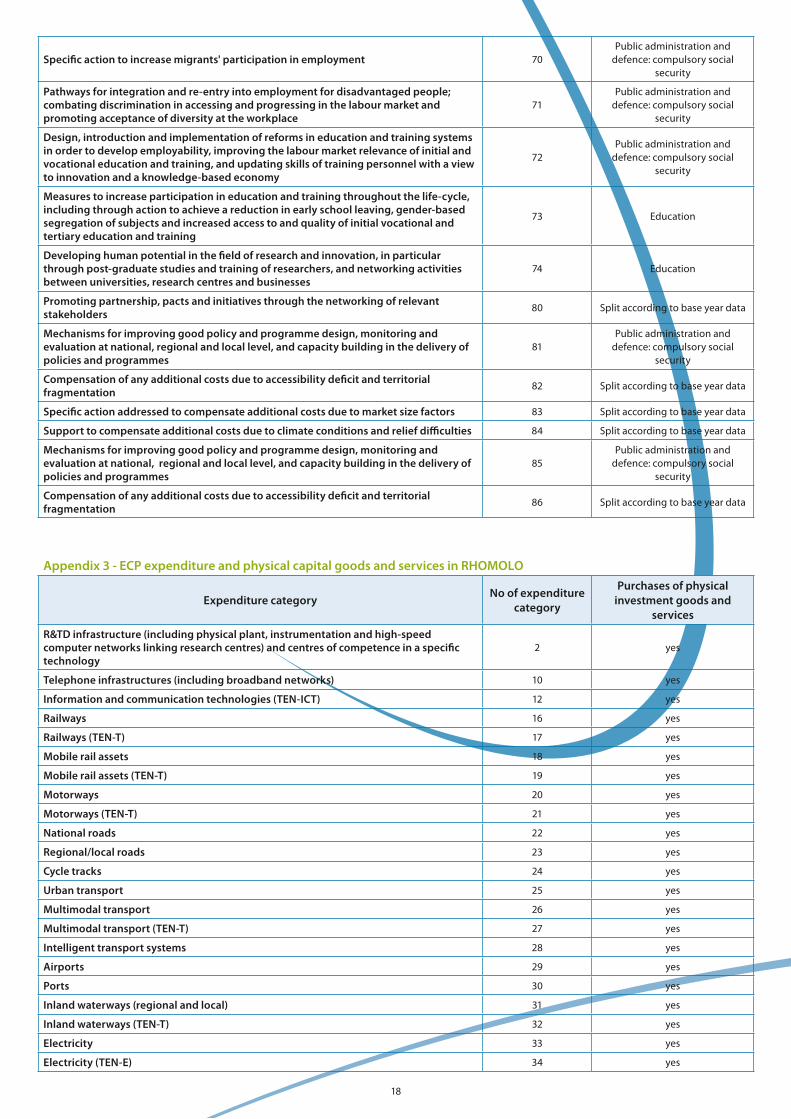
18
Specific action to increase migrants' participation in employment 70Public administration and
defence: compulsory social security
Pathways for integration and re-entry into employment for disadvantaged people; combating discrimination in accessing and progressing in the labour market and promoting acceptance of diversity at the workplace
71Public administration and
defence: compulsory social security
Design, introduction and implementation of reforms in education and training systems in order to develop employability, improving the labour market relevance of initial and vocational education and training, and updating skills of training personnel with a view to innovation and a knowledge-based economy
72Public administration and
defence: compulsory social security
Measures to increase participation in education and training throughout the life-cycle, including through action to achieve a reduction in early school leaving, gender-based segregation of subjects and increased access to and quality of initial vocational and tertiary education and training
73 Education
Developing human potential in the field of research and innovation, in particular through post-graduate studies and training of researchers, and networking activities between universities, research centres and businesses
74 Education
Promoting partnership, pacts and initiatives through the networking of relevant stakeholders 80 Split according to base year data
Mechanisms for improving good policy and programme design, monitoring and evaluation at national, regional and local level, and capacity building in the delivery of policies and programmes
81Public administration and
defence: compulsory social security
Compensation of any additional costs due to accessibility deficit and territorial fragmentation 82 Split according to base year data
Specific action addressed to compensate additional costs due to market size factors 83 Split according to base year data
Support to compensate additional costs due to climate conditions and relief difficulties 84 Split according to base year data
Mechanisms for improving good policy and programme design, monitoring and evaluation at national, regional and local level, and capacity building in the delivery of policies and programmes
85Public administration and
defence: compulsory social security
Compensation of any additional costs due to accessibility deficit and territorial fragmentation 86 Split according to base year data
Appendix 3 - ECP expenditure and physical capital goods and services in RHOMOLO
Expenditure category No of expenditure category
Purchases of physical investment goods and
services
R&TD infrastructure (including physical plant, instrumentation and high-speed computer networks linking research centres) and centres of competence in a specific technology
2 yes
Telephone infrastructures (including broadband networks) 10 yes
Information and communication technologies (TEN-ICT) 12 yes
Railways 16 yes
Railways (TEN-T) 17 yes
Mobile rail assets 18 yes
Mobile rail assets (TEN-T) 19 yes
Motorways 20 yes
Motorways (TEN-T) 21 yes
National roads 22 yes
Regional/local roads 23 yes
Cycle tracks 24 yes
Urban transport 25 yes
Multimodal transport 26 yes
Multimodal transport (TEN-T) 27 yes
Intelligent transport systems 28 yes
Airports 29 yes
Ports 30 yes
Inland waterways (regional and local) 31 yes
Inland waterways (TEN-T) 32 yes
Electricity 33 yes
Electricity (TEN-E) 34 yes

19
Natural gas 35 yes
Natural gas (TEN-E) 36 yes
Petroleum products 37 yes
Petroleum products (TEN-E) 38 yes
Renewable energy: wind 39 yes
Renewable energy: solar 40 yes
Renewable energy: biomass 41 yes
Renewable energy: hydroelectric, geothermal and other 42 yes
Energy efficiency, co-generation, energy management 43 yes
Management of household and industrial waste 44 yes
Management and distribution of water (drinking water) 45 yes
Water treatment (waste water) 46 yes
Air quality 47 yes
Integrated prevention and pollution control 48 yes
Mitigation and adaptation to climate change 49 yes
Promotion of clean urban transport 52 yes
Education infrastructure 75 yes
Health infrastructure 76 yes
Childcare infrastructure 77 yes
Housing infrastructure 78 yes
Other social infrastructure 79 yes
Appendix 4 - ECP expenditure and physical capital in RHOMOLO’s sectors
Expenditure category No of expenditure category
RHOMOLO sector where physical capital has
increased
R&TD activities in research centres 1
R&TD infrastructure (including physical plant, instrumentation and high-speed computer networks linking research centres) and centres of competence in a specific technology
2Research and development;
education; real estate, renting and other business activities
Telephone infrastructures (including broadband networks) 10 Post and telecommunication
Information and communication technologies (TEN-ICT) 12Post and telecommunication; research and development;
education; health and social work
Mobile rail assets 18 Transport and storage
Mobile rail assets (TEN-T) 19 Transport and storage
Cycle tracks 24 Transport and storage
Urban transport 25 Transport and storage
Multimodal transport 26 Transport and storage
Multimodal transport (TEN-T) 27 Transport and storage
Intelligent transport systems 28 Transport and storage
Airports 29 Transport and storage
Ports 30 Transport and storage
Inland waterways (regional and local) 31 Transport and storage
Inland waterways (TEN-T) 32 Transport and storage
Electricity 33 Electricity and gas
Electricity (TEN-E) 34 Electricity and gas
Natural gas 35 Electricity and gas
Natural gas (TEN-E) 36 Electricity and gas
Petroleum products 37 Electricity and gas
Petroleum products (TEN-E) 38 Electricity and gas
Management and distribution of water (drinking water) 45 Water supply
Education infrastructure 75 Education
Health infrastructure 76 Health and social work
Other social infrastructure 79 Health and social work
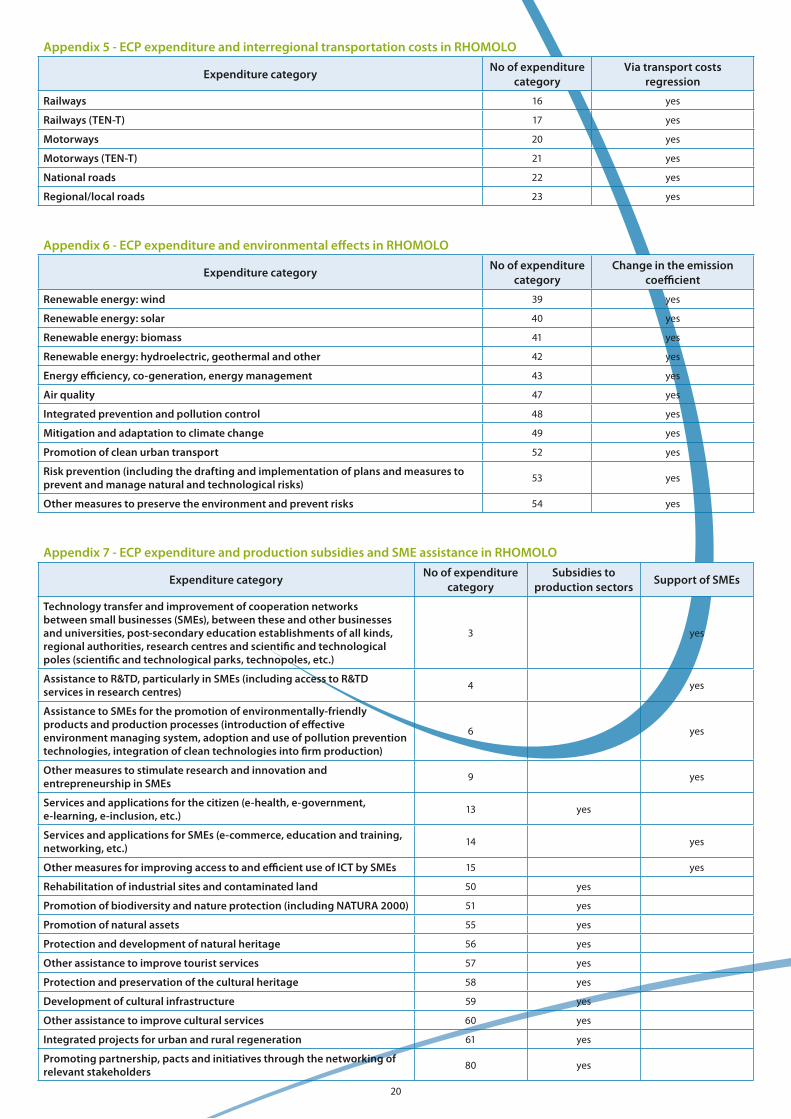
20
Appendix 5 - ECP expenditure and interregional transportation costs in RHOMOLO
Expenditure categoryNo of expenditure
categoryVia transport costs
regression
Railways 16 yes
Railways (TEN-T) 17 yes
Motorways 20 yes
Motorways (TEN-T) 21 yes
National roads 22 yes
Regional/local roads 23 yes
Appendix 6 - ECP expenditure and environmental effects in RHOMOLO
Expenditure categoryNo of expenditure
categoryChange in the emission
coefficient
Renewable energy: wind 39 yes
Renewable energy: solar 40 yes
Renewable energy: biomass 41 yes
Renewable energy: hydroelectric, geothermal and other 42 yes
Energy efficiency, co-generation, energy management 43 yes
Air quality 47 yes
Integrated prevention and pollution control 48 yes
Mitigation and adaptation to climate change 49 yes
Promotion of clean urban transport 52 yes
Risk prevention (including the drafting and implementation of plans and measures to prevent and manage natural and technological risks) 53 yes
Other measures to preserve the environment and prevent risks 54 yes
Appendix 7 - ECP expenditure and production subsidies and SME assistance in RHOMOLO
Expenditure category No of expenditure category
Subsidies to production sectors Support of SMEs
Technology transfer and improvement of cooperation networks between small businesses (SMEs), between these and other businesses and universities, post-secondary education establishments of all kinds, regional authorities, research centres and scientific and technological poles (scientific and technological parks, technopoles, etc.)
3 yes
Assistance to R&TD, particularly in SMEs (including access to R&TD services in research centres) 4 yes
Assistance to SMEs for the promotion of environmentally-friendly products and production processes (introduction of effective environment managing system, adoption and use of pollution prevention technologies, integration of clean technologies into firm production)
6 yes
Other measures to stimulate research and innovation and entrepreneurship in SMEs 9 yes
Services and applications for the citizen (e-health, e-government, e-learning, e-inclusion, etc.) 13 yes
Services and applications for SMEs (e-commerce, education and training, networking, etc.) 14 yes
Other measures for improving access to and efficient use of ICT by SMEs 15 yes
Rehabilitation of industrial sites and contaminated land 50 yes
Promotion of biodiversity and nature protection (including NATURA 2000) 51 yes
Promotion of natural assets 55 yes
Protection and development of natural heritage 56 yes
Other assistance to improve tourist services 57 yes
Protection and preservation of the cultural heritage 58 yes
Development of cultural infrastructure 59 yes
Other assistance to improve cultural services 60 yes
Integrated projects for urban and rural regeneration 61 yes
Promoting partnership, pacts and initiatives through the networking of relevant stakeholders 80 yes

21
Compensation of any additional costs due to accessibility deficit and territorial fragmentation 82 yes
Specific action addressed to compensate additional costs due to market size factors 83 yes
Support to compensate additional costs due to climate conditions and relief difficulties 84 yes
Compensation of any additional costs due to accessibility deficit and territorial fragmentation 86 yes
Appendix 8 - ECP expenditure and endogenous growth engines of RHOMOLO
Expenditure categoryNo of expenditure
categoryVia TFP equation
Via Human Capital Accumulation
R&TD activities in research centres 1 yes
Technology transfer and improvement of cooperation networks between small businesses (SMEs), between these and other businesses and universities, post-secondary education establishments of all kinds, regional authorities, research centres and scientific and technological poles (scientific and technological parks, technopoles, etc.)
3 yes
Assistance to R&TD, particularly in SMEs (including access to R&TD services in research centres) 4 yes
Advanced support services for firms and groups of firms 5 yes
Assistance to SMEs for the promotion of environmentally-friendly products and production processes (introduction of effective environment managing system, adoption and use of pollution prevention technologies, integration of clean technologies into firm production)
6 yes
Investment in firms directly linked to research and innovation (innovative technologies, establishment of new firms by universities, existing R&TD centres and firms, etc.)
7 yes
Other investment in firms 8 yes
Other measures to stimulate research and innovation and entrepreneurship in SMEs 9 yes
Development of life-long learning systems and strategies in firms; training and services for employees to step up their adaptability to change; promoting entrepreneurship and innovation
62 yes
Design and dissemination of innovative and more productive ways of organising work 63 yes yes
Development of specific services for employment, training and support in connection with restructuring of sectors and firms, and development of systems for anticipating economic changes and future requirements in terms of jobs and skills
64 yes yes
Modernisation and strengthening of labour market institutions 65 yes yes
Implementing active and preventive measures on the labour market 66 yes yes
Measures encouraging active ageing and prolonging working lives 67 yes yes
Support for self-employment and business start-up 68 yes yes
Measures to improve access to employment and increase sustainable participation and progress of women in employment to reduce gender-based segregation in the labour market, and to reconcile work and private life, such as facilitating access to childcare and care for dependent persons
69 yes yes
Specific action to increase migrants' participation in employment 70 yes yes
Pathways for integration and re-entry into employment for disadvantaged people; combating discrimination in accessing and progressing in the labour market and promoting acceptance of diversity at the workplace
71 yes yes
Design, introduction and implementation of reforms in education and training systems in order to develop employability, improving the labour market relevance of initial and vocational education and training, and updating skills of training personnel with a view to innovation and a knowledge-based economy
72 yes yes
Measures to increase participation in education and training throughout the life-cycle, including through action to achieve a reduction in early school leaving and gender-based segregation of subjects and increased access to and quality of initial vocational and tertiary education and training
73 yes yes
Developing human potential in the field of research and innovation, in particular through post-graduate studies and training of researchers, and networking activities between universities, research centres and businesses
74 yes yes

22
Appendix 9 - Modelling total factor productivity in RHOMOLO
The general structure of RHOMOLO extends to include endogenous growth elements such as technological progress and human capital accumulation. Development of these two factors is based on the behavioural decisions of the households and firms in the model as well as upon public expenditure. Decisions about the amount of investment in R&D and human capital (education) are taken by economic agents in such a way as to equalise marginal expenditures and marginal revenues.
Specifically, the specification of endogenous growth in the model is based on models of economic growth and catch-up that are widely used in the literature in a leader-follower context of economic development (e.g. see Barro and Sala-i- Martin 1995; 1997; Howitt 2000). In this framework, productivity growth is generated through own innovations, knowledge spillovers and technology adoption (catching-up). In its basic form, the leader-follower model leads to a reduced-form equation for total factor productivity (TFP) growth such as the one below:
This equation states that productivity growth of sectors in region r depends on some exogenous region-specific parameter a, and on the TFP level relative to the frontier for region r (indicated by an asterisk, where the frontier relevant to region r by definition satisfies the condition: .
The second captures the region r’s potential for TFP growth through technology transfer via the distance to the frontier
*1 r
r
TFPTFP
−
,
and its absorptive capacity, b. The greater this distance and the higher the absorptive capacity, the greater the potential for growth through technology transfer. The basic framework results in short-run growth rates being endogenous and long-run relative productivity levels being endogenous (but constant), implying that long-run growth rates converge31. These properties imply that we can classify the growth equation as a semi-endogenous growth model. Productivity relative to the frontier is endogenous. Still, the model remains realistic in that it maintains the long-run stability properties of neo-classical growth theory. These characteristics are to a large extent consistent with well-established empirical stylised facts on growth and productivity. The framework is flexible in the sense that many insights generated in the endogenous growth literature and from econometric studies on growth determinants can easily be accommodated by the model.
Our quest to improve the estimates of the TFP equation (and of the model in general), leads us to a superior specification compared to that which was presented in the second interim report. This includes (1) measures of human capital (H) based on average number of years per active person, and (2) the Compound
31 The dynamics of catch-up imply that relative productivity levels will be constant in the long-run. As a result, growth rates will converge and be equal across regions in the long-run. The level of long-run relative productivity is endogenous and derived as follows. The steady state is characterised by equality of TFP growth rates: This implies that relative productivity of region r, will ultimately be equal to:
TFP growth rate32. As we show in section 3.2, the problem of high collinearity between human capital and human capital-technology gap interaction is reduced using this measure of human capital, thereby allowing us to endogenise absorptive capacity, thus building on the work of Benhabib and Spegiel (2005) and extending the baseline specification to incorporate other exogenous sector and/or region-specific variables. These include R&D expenditure shares (RD), sectoral specialisation (location quotient, LQ) and diversity which is also used in the previous specification. However, instead of using the Herfindahl index as a measure of diversity which is sensitive to scale effects, we replace it with the Krugman Specialisation Index (KSI)33.
The new specification takes the form:
The last term of the above equation represents the technology adoption function comprising of technology transfer and absorptive capacity and hence it endogenises the term b. This term indicates that in addition to the innovative capacity role of human capital, improvement in human capital enhances the closing of the technology gap between the technology leader and follower. Higher levels of human capital are associated with a faster catching-up process and thus a higher growth of TFP.
32 Note that in the previous (second) interim report, our measure of human capital is based on the proportion of active population with a higher level of education (secondary and tertiary) as had been commonly used in several European studies. See for example, Badinger and Tondl (2003) and Greunz (2003). As for the TFP growth rate, it was previously computed using the growth of the Divisia Index which is approximated in discrete time by the Tornqvist Index.
33 The Krugman Specialisation Index takes zero value if region i has an industrial structure identical to the rest of the EU, indicating that region i is not specialised, and takes a maximum value of 2 if it has no sectors in common with the rest of the EU, reflecting strong sectoral specialisation.
s r s r
s r r r s r r r s r e
TFP
TFP LnH b KSI a LQ a RD a LnH a a P F T , *
,
, 4 , 3 2 1 0 ,
^ 1 +
− + + + + + =
,, , , *
,
ˆ 1 r sr s r s r s
r s
TFPTFP a b
TFP
= + −

23
References1. Baldwin, R., Forslid, R., Martin, P., Ottaviano, G.I.P., Robert-Nicoud, F., Economic geography and
public policy, Princeton University Press, Princeton, 2003.
2. Barro, R.J., ‘Economic Growth in a Cross Section of Countries’, The Quarterly Journal of Economics, No 106(2), 1991, pp. 407-443.
3. Benhabib, J. and Spiegel, M.M., ‘Human Capital and Technology Diffusion’, Handbook of Economic Growth, vol. 1A, P. Aghion and S.N. Durlauf editions, Elsevier Science, Amsterdam, North-Holland, 2005.
4. Cullis, J. and Jones, P., Public Finance and Public Choice, 2nd edition, Oxford University Press, Oxford, 1998.
5. Dasgupta, P., Human Well-being and the Natural Environment, Oxford University Press, Oxford, 2001, p. 160.
6. Dixon, P.B., and Rimmer, M.T., Dynamic General Equilibrium Modelling for Forecasting and Policy: A Practical Guide and Documentation of MONASH, Elsevier, Amsterdam, 2002.
7. Deaton A. and Muellabaur, J., Economics and consumer behaviour, Cambridge University Press, Cambridge, 1988.
8. European Court of Auditors, ‘Special Report No 10/2006 on the ex-post evaluation Special Report of the Court of Auditors No 10/2006 on ex-post evaluations of Objectives 1 and 3 programmes 1994-1999 (Structural Funds) together with some of the Commission’s Replies’, Official Journal of the European Union, C302/1, 2006.
9. European Union, Cohesion Policy 2007-13. Commentaries and official texts. Office for Official Publications of the European Communities, Luxembourg, 2007.
10. Feenstra, R.C., Advanced International Trade: Theory and Evidence, Princeton University Press, Princeton and Oxford, 2004.
11. Fujita, M. and Thisse, J., ‘Does Geographical Agglomeration Foster Economic Growth?' and 'Who Gains and Loses from it?’ CEPR DP 3135, 2002.
12. Grossman, G. and Helpman, E., Innovation and Growth in the World Economy, MIT Press, Cambridge MA, 1991.
13. Islam, N., ‘Growth empirics: A panel data approach’, Quarterly Journal of Economics, No 110(4), 1127-70, 1995.
14. Krugman, P.R., ‘Scale Economies, Product Differentiation, and the Pattern of Trade’, American Economic Review, No 70: 950–9 (1980).
15. Pissarides, C.A., Equilibrium Unemployment Theory, Basil Blackwell, Oxford, 1990.
16. Tresch, R.W., Public Finance: A Normative Theory, 2nd edition, Elsevier Science, London and San Diego, 2002.

Editor: Eric VON BRESKA © European Commission, Regional PolicyThe texts of this publication do not bind the Commission
Any question, comment or contribution should be sent to the following address:
For further information, please consult:http://ec.europa.eu/regional_policy/index_en.htm