The Leptin Connection
215
MY LEPTIN PRESCRIPTION JUNE 29, 2011 BY JACK KRUSE COMMENTS (1092) READERS SUMMARY: 1. How do I start? 2. What are the guidelines to remain mindful of? 3. The fuel is the food, but how you eat that fuel is more important 4. How does Leptin tie into the quilt survivability index? I have been asked by many to put a short post out about how I reverse Leptin resistance in my own clinic for my patients. After reading all of the comments left here, at MDA, and on Jimmy Moore’s forum, I decided that it was a good idea. 1. First make sure you really are Leptin resistant (LR) to begin with. The easiest way to do this if you are heavy is to look in the mirror. If you’re overweight you definitely are Leptin resistant. If you still have a large appetite and crave carbohydrates, especially at night, these are also signs that you are likely Leptin resistant. If you are fit or in decent shape and not sure based upon the above symptoms, I would tell you to go get a blood test and check your reverse T3. It will be elevated. I also recommend simultaneously checking a salivary cortisol level. With LR, you will always see higher cortisol levels later in the day. 2. To regain Leptin Sensitivity (LS) follow a strict Epi- Paleolithic diet as outlined in here The type of fuel you eat is important initially in eliminating the foods that cause Leptin receptors to become nonfunctional.
-
Upload
angela-gibson -
Category
Documents
-
view
245 -
download
1
description
Articles on recent research into Leptin from various credited sources on the internet.
Transcript of The Leptin Connection
MY LEPTIN PRESCRIPTIONJUNE 29, 2011 BY JACK KRUSE COMMENTS (1092)
READERS SUMMARY:1. How do I start?2. What are the guidelines to remain mindful of?3. The fuel is the food, but how you eat that fuel is more important4. How does Leptin tie into the quilt survivability index?
I have been asked by many to put a short post out about how I reverse Leptin resistance in my own clinic for my patients. After reading all of the comments left here, at MDA, and on Jimmy Moore’s forum, I decided that it was a good idea.
1. First make sure you really are Leptin resistant (LR) to begin with. The easiest way to do this if you are heavy is to look in the mirror. If you’re overweight you definitely are Leptin resistant. If you still have a large appetite and crave carbohydrates, especially at night, these are also signs that you are likely Leptin resistant. If you are fit or in decent shape and not sure based upon the above symptoms, I would tell you to go get a blood test and check your reverse T3. It will be elevated. I also recommend simultaneously checking a salivary cortisol level. With LR, you will always see higher cortisol levels later in the day.
2. To regain Leptin Sensitivity (LS) follow a strict Epi-Paleolithic diet as outlined in hereThe type of fuel you eat is important initially in eliminating the foods that cause Leptin receptors to become nonfunctional.
A. Try to eat as soon as possible upon rising in the morning, ideally within 30 minutes of waking. Make sure that breakfast has little to no carbs (less than 50 grams), and has a lot of protein and fat. I use as a general rule 50-75 grams of protein with most patients. Some patients can use less and some need more. The key point of knowing how much is right for you is your hunger later in the day. If you remain ravenous throughout the day, you need to eat more protein in the morning. If you can hold off eating until dinner you probably are at homeostasis for you. If you can skip both meals you likely are overdoing it at breakfast. As for sources, I suggest pastured or organic eggs first, served with left over dinner scraps of grass fed meats, poultry, or fish. A third option, although less ideal, would be whey protein or protein shakes.
B. Try to limit carb intake to 25 grams if you are overweight by more than 30 lbs. If you are fit and have a small amount of weight to lose, (less than 30 lbs.) you can titrate up your carb loads. Even then, I do not advocate potatoes or rice as some Paleo diets allow for. You will be able to eat them eventually, but try to avoid starches until you have mastered your cravings and hunger. Do not count calories; it is not needed at this point. Any time I eat carbs I use liberal amounts of butter, heavy cream, coconut or palm oil. I do not recommend other oils initially such as olive oils or industrial seed oils. I would also avoid nut oils at the initial stages. My personal favorite is coconut oil because of the great metabolic effects of MCT, and how it helps heal the guts of LR folks.
3. How and when you eat your fuel is MORE IMPORTANT than any other factor, including the food itself.A. Never snack at all. This is meant initially and forever. Snacking completely stresses the liver’s metabolism and is just not recommended. Your liver needs to re-learn how to use gluconeogenesis normally again when you are asleep and awake. Snacking just destroys the timing and circadian clocks that work in unison with Leptin.B. Try to eat three meals a day initially; but as your hunger and cravings fade you can adapt to two a day.C. Try to eat breakfast as early as possible from rising.D. Do not work out before or after breakfast.E. Try to allow 4-5 hours between dinners and sleep time.F. If you decide to incorporate working out, do it after 5 PM.G. Within an hour of sunset try to make your surroundings as dark as possible.H. If you have trouble falling asleep I suggest 3-5 minutes of body weight exercises right before bed (pushups or air squats are fine, but avoid this if your evening cortisol is high).I. If you’re inclined to, try becoming mindful when you first lay down. I use transcendental meditation techniques to help me clear my mind and concentrate on improving my thinking. (Optional; but this is awesome if your eveningcortisol is high).
4. Most people will notice a change in their cravings and hunger within 4-6 weeks.
Other changes I advise of my patients, is to supplement with prescription grade fish oils. The dose depends upon their HS CRP and salivary cortisol levels.
5. Signs that you are becoming Leptin Sensitive (LS) again
A. Men will notice quick weight loss.B. Women will notice mood changes first (calmer/sleepy) and their sleep will improve (huge clue). Their clothes will fit differently but weight may not change drastically initially because of effects on the pituitary. This will change too if they continue moving forward.C. You will notice a change in your sweating pattern.D. You will notice you have better recovery from exercise and your energy levels seem to have risen.E. Your hunger is gone and so are your cravings.F. When you awaken you will feel very refreshed like you slept well.Generally when the signs are all present, I then really push HIIT exercise with heavy weights.
6. (QUILT SURVIVABILITY) = (Total Energy – Growth and immunity expense) X (RESOURCES) X (efficiency) X (awareness of our environment). You wont understand
this until we pass EMF 5-EMF-8.Stated in levee form where:Cell longevity = LS – IGF-1 + immunity X Food Quality X leakiness of Mitochondria X environmental cues
SOURCE: http://www.jackkruse.com/my-leptin-prescription/

Understanding Our Bodies: Leptin (The Fullness Hormone)Jun 15, 2009 | By: Christie Wilcox
Featured, Health & Disease, Understanding Our Bodies
Time and time again, I tell you guys that the best way to stay healthy is to stay informed. Read labels, I say. Know what you’re eating. Know what you’re not eating. Know this, know that, etc and make informed decisions. Well, part of making informed decisions is understanding how your body works. And for that reason, I’ve decided to dive into a bit of physiology.Even informed consumers tend to know very little about how their appetites actually work. What makes you hungry or full? Why do some foods fill us up more than others? What exactly is going on in our bodies, anyway?I figured you just might want to know. So here is part one of a new series I call “Understanding Our Bodies” – nutrition based on how our bodies work. And to kick it off is a little explanation of the fullness hormone: Leptin.What is Leptin?Leptin is a hormone that is tied closely to regulating energy intake and expenditure, including appetite, metabolism and hunger. It is the single most important hormone when it comes to understanding why we feel hungry or full. When present in high levels, it signals to our brain that we’re full and can stop eating. When low, we feel hungry and crave food. It does this by stimulating receptors in our hypothalamus, the part of our brains which regulates the hormone system in our bodies. When leptin binds to receptors in this part of our brains, it stimulates the release of appetite-suppressing chemicals. People with leptin disorders eat uncontrollably.
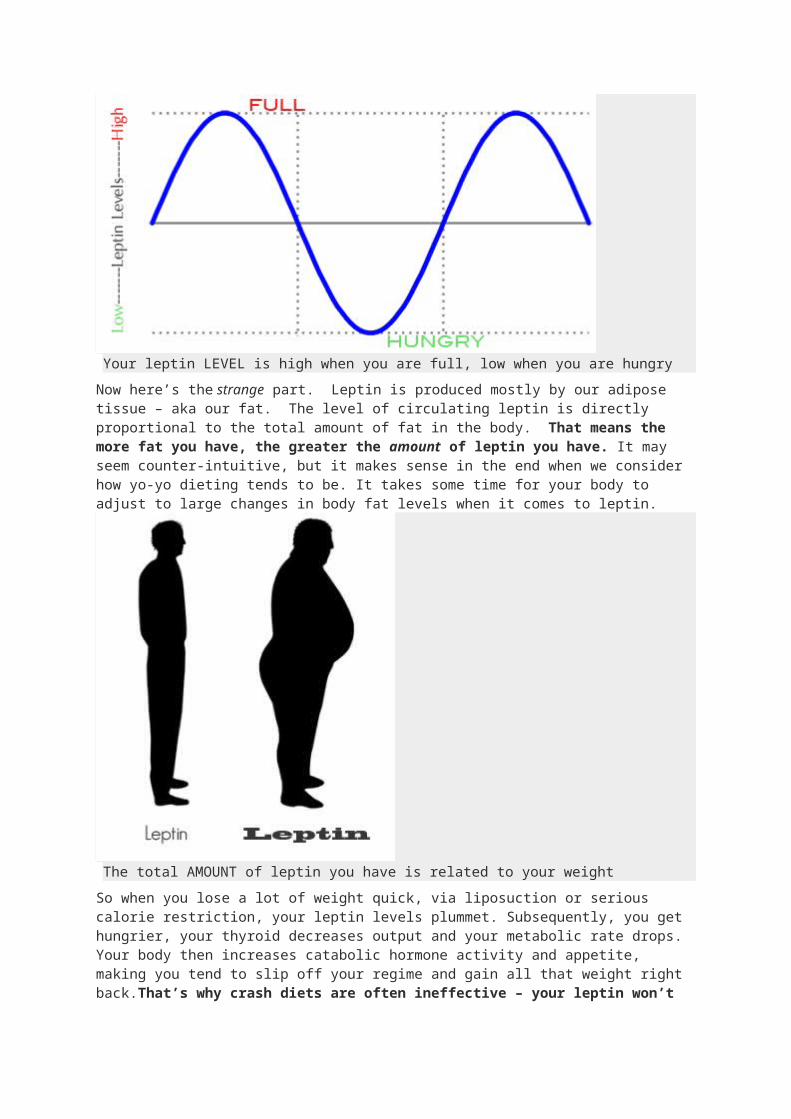
Your leptin LEVEL is high when you are full, low when you are hungry
Now here’s the strange part. Leptin is produced mostly by our adipose tissue – aka our fat. The level of circulating leptin is directly proportional to the total amount of
fat in the body. That means the more fat you have, the greater the amount of leptin you have. It may seem counter-intuitive, but it makes sense in the end when we consider how yo-yo dieting tends to be. It takes some time for your body to adjust to large changes in body fat levels when it comes to leptin.
The total AMOUNT of leptin you have is related to your weight
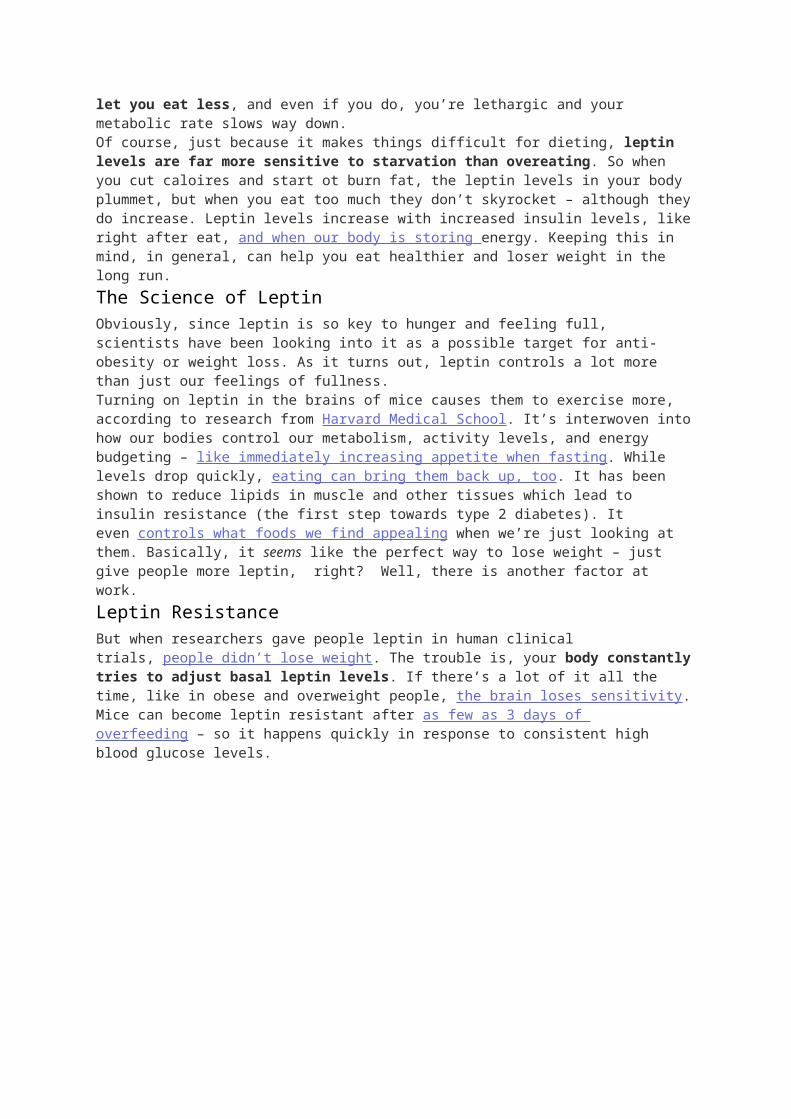
So when you lose a lot of weight quick, via liposuction or serious calorie restriction, your leptin levels plummet. Subsequently, you get hungrier, your thyroid decreases output and your metabolic rate drops. Your body then increases catabolic hormone activity and appetite, making you tend to slip off your regime and gain all that weight right back.That’s why crash diets are often ineffective – your leptin won’t let you eat less, and even if you do, you’re lethargic and your metabolic rate slows way down.Of course, just because it makes things difficult for dieting, leptin levels are far more sensitive to starvation than overeating. So when you cut caloires and start ot burn fat, the leptin levels in your body plummet, but when you eat too much they don’t skyrocket – although they do increase. Leptin levels increase with increased insulin levels, like right after eat, and when our body is storing energy. Keeping this in mind, in general, can help you eat healthier and loser weight in the long run.The Science of LeptinObviously, since leptin is so key to hunger and feeling full, scientists have been looking into it as a possible target for anti-obesity or weight loss. As it turns out, leptin controls a lot more than just our feelings of fullness.Turning on leptin in the brains of mice causes them to exercise more, according to research from Harvard Medical School. It’s interwoven into how our bodies control our metabolism, activity levels, and energy budgeting – like immediately increasing appetite when fasting. While levels drop quickly, eating can bring them back up, too. It has been shown to reduce lipids in muscle and other tissues which lead to insulin resistance (the first step towards type 2 diabetes). It even controls what foods we
find appealing when we’re just looking at them. Basically, it seems like the perfect way to lose weight – just give people more leptin, right? Well, there is another factor at work.Leptin ResistanceBut when researchers gave people leptin in human clinical trials, people didn’t lose weight. The trouble is, your body constantly tries to adjust basal leptin levels. If there’s a lot of it all the time, like in obese and overweight people, the brain loses sensitivity. Mice can become leptin resistant after as few as 3 days of overfeeding – so it happens quickly in response to consistent high blood glucose levels.
When obese, your leptin LEVELS spike radically because you have higher leptin AMOUNTS in your body (causing leptin resistance in the brain)
When it does this, it takes more and more leptin before our bodies feel full. When we get fatter, our bodies produce more leptin, and we become resistant to it. So obese people actually have unusually high leptin levels, but are not responsive to it. Even when healthy people eat a much lower calorie diet for a little while, levels decrease, and they feel hungrier and less energetic, even if they haven’t lost weight yet. To lose weight and keep it off, you have to give your body time to adjust to the new, lowered leptin level, so it sets that as “normal” and you feel full when you’re supposed to.
Yes, he is.
The bad news is that not just excess weight can lead to leptin resistance. A new study published in the American Journal of Physiology found that high fructose diets can induce leptin resistance. These sugars actually impair the leptin’s ability to cross the blood-brain barrier and reach the hypothalamus. So even when the leptin levels are high, not enough is reaching the brain to tell the body to stop eating.How do you use this information to lose weight or keep healthy?First things first: quit the crash diets. You aren’t going to do your body any favors by losing weight too quickly. If you are trying to lose weight, though, there’s one thing you can do to help your body out: cheat. Seriously.When you cut calories dramatically, your body acts like its starving and your leptin levels plummet. You’ll be hungry and generally have lower energy levels and want to eat more. So, once a week or so, cheat. Really cheat. Have a nice, high-calorie meal.Your body then senses the rush of fuel and boosts leptin levels, increasing your metablism and priming your body for fat loss. Cheating helps ease your body down to lower daily leptin levels without making it feel too starved. That way, as you lose the weight, your body adjusts and realizes that the reduced leptin levels are normal not starving. And you get to enjoy something delicious – come on, it’s a win-win!
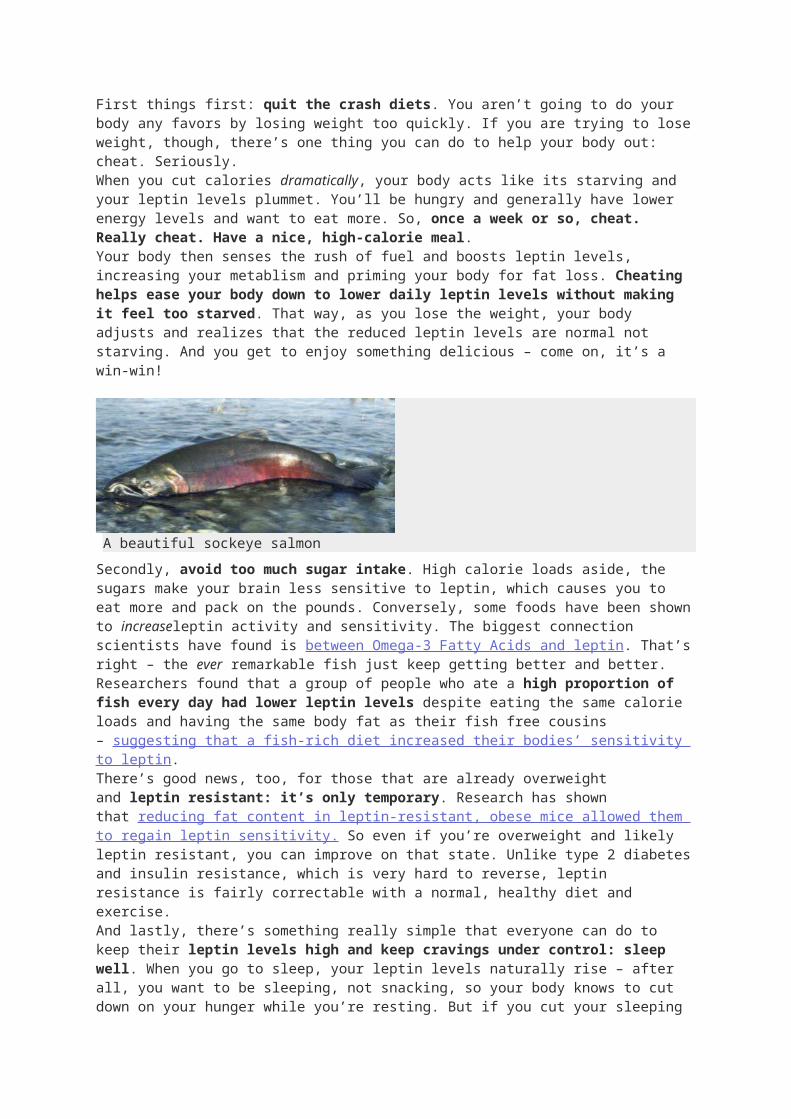
A beautiful sockeye salmon
Secondly, avoid too much sugar intake. High calorie loads aside, the sugars make your brain less sensitive to leptin, which causes you to eat more and pack on the pounds. Conversely, some foods have been shown to increaseleptin activity and sensitivity. The biggest connection scientists have found is between Omega-3 Fatty Acids and leptin. That’s right – the ever remarkable fish just keep getting better and better. Researchers found that a group of people who ate a high proportion of fish every day had lower leptin levels despite eating the same calorie loads and having the same body fat as their fish free cousins – suggesting that a fish-rich diet increased their bodies’ sensitivity to leptin.There’s good news, too, for those that are already overweight and leptin resistant: it’s only temporary. Research has shown that reducing fat content in leptin-resistant, obese mice allowed them to regain leptin sensitivity. So even if you’re overweight and likely leptin resistant, you can improve on that state. Unlike type 2 diabetes and insulin resistance, which is very hard to reverse, leptin resistance is fairly correctable with a normal, healthy diet and exercise.And lastly, there’s something really simple that everyone can do to keep their leptin levels high and keep cravings under control: sleep well. When you go to sleep, your leptin levels naturally rise – after all, you want to be sleeping, not snacking, so your body knows to cut down on your hunger while you’re resting. But if
you cut your sleeping short, your body tries to adjust by making you hungry again. Research has found that shorter sleep periods (6 hours or less instead of lower overall daily leptin levels, cause an increase in appetite, and even make people crave carbs and other fattening foods. So its important for your body to rest well to maintain its natural hormonal balance, allowing you to look and feel your best.In summary:
Stop crash diets
Eat ONE large meal per week to spark leptin-based weight loss
Avoid processed sugar
Eat Omega-3 (in fish/flaxseed/walnuts)
Sleep well
Like any other system in our bodies, the our hormonal appetite controls are sensitive to our daily habits and routines. The better a routine you have – sleeping well, eating right, and exercising, the more balanced your system will be and the better you will feel.Stay tuned for more deep dives into the physiology of nutrition with the next installment of Understanding Our Bodies!References:
1. Williams, K., Scott, M., & Elmquist, J. (2009). From observation to experimentation: leptin action in
the mediobasal hypothalamus American Journal of Clinical Nutrition, 89 (3), 985-990
DOI: 10.3945/ajcn.2008.26788D
2. Havel, P. (2007). Role of adipose tissue in body-weight regulation: mechanisms regulating leptin
production and energy balance Proceedings of the Nutrition Society, 59 (03)
DOI:10.1017/S0029665100000410
3. Huo, L., Gamber, K., Greeley, S., Silva, J., Huntoon, N., Leng, X., & Bjørbæk, C. (2009). Leptin-
Dependent Control of Glucose Balance and Locomotor Activity by POMC Neurons Cell Metabolism,
9 (6), 537-547 DOI: 10.1016/j.cmet.2009.05.003
4. Pratley RE, Nicolson M, Bogardus C, & Ravussin E (1997). Plasma leptin responses to fasting in
Pima Indians. The American journal of physiology, 273 (3 Pt 1) PMID: 9316457
5. Chin-Chance C, Polonsky KS, & Schoeller DA (2000). Twenty-four-hour leptin levels respond to
cumulative short-term energy imbalance and predict subsequent intake. The Journal of clinical
endocrinology and metabolism, 85 (8), 2685-91 PMID: 10946866
6. Enriori, P., Evans, A., Sinnayah, P., Jobst, E., Tonelli-Lemos, L., Billes, S., Glavas, M., Grayson, B.,
Perello, M., & Nillni, E. (2007). Diet-Induced Obesity Causes Severe but Reversible Leptin
Resistance in Arcuate Melanocortin Neurons Cell Metabolism, 5 (3), 181-194
DOI:10.1016/j.cmet.2007.02.004
7. Zelissen, P., Stenlof, K., Lean, M., Fogteloo, J., Keulen, E., Wilding, J., Finer, N., Rossner, S.,
Lawrence, E., Fletcher, C., McCamish, M., & , . (2005). Effect of three treatment schedules of
recombinant methionyl human leptin on body weight in obese adults: a randomized, placebo-
controlled trial Diabetes, Obesity and Metabolism, 7 (6), 755-761 DOI: 10.1111/j.1463-
1326.2005.00468.x
8. Wang, J., Obici, S., Morgan, K., Barzilai, N., Feng, Z., & Rossetti, L. (2001). Overfeeding Rapidly
Induces Leptin and Insulin Resistance Diabetes, 50 (12), 2786-2791
DOI:10.2337/diabetes.50.12.2786
9. Keim NL, Stern JS, & Havel PJ (1998). Relation between circulating leptin concentrations and
appetite during a prolonged, moderate energy deficit in women. The American journal of clinical
nutrition, 68 (4), 794-801 PMID: 9771856
10. Shapiro A, Mu W, Roncal C, Cheng KY, Johnson RJ, & Scarpace PJ (2008). Fructose-induced leptin
resistance exacerbates weight gain in response to subsequent high-fat feeding. American journal of
physiology. Regulatory, integrative and comparative physiology, 295 (5) PMID: 18703413
11. Peyron-Caso E, Taverna M, Guerre-Millo M, Véronèse A, Pacher N, Slama G, & Rizkalla SW (2002).
Dietary (n-3) polyunsaturated fatty acids up-regulate plasma leptin in insulin-resistant rats.The
Journal of nutrition, 132 (8), 2235-40 PMID: 12163668
12. Winnicki M, Somers VK, Accurso V, Phillips BG, Puato M, Palatini P, & Pauletto P (2002). Fish-rich
diet, leptin, and body mass. Circulation, 106 (3), 289-91 PMID: 12119240
13. Enriori, P., Evans, A., Sinnayah, P., Jobst, E., Tonelli-Lemos, L., Billes, S., Glavas, M., Grayson, B.,
Perello, M., & Nillni, E. (2007). Diet-Induced Obesity Causes Severe but Reversible Leptin
Resistance in Arcuate Melanocortin Neurons Cell Metabolism, 5 (3), 181-194
DOI:10.1016/j.cmet.2007.02.004
14. Nedeltcheva AV, Kilkus JM, Imperial J, Kasza K, Schoeller DA, & Penev PD (2009). Sleep curtailment
is accompanied by increased intake of calories from snacks. The American journal of clinical
nutrition, 89 (1), 126-33 PMID: 19056602
15. Taheri, S., Lin, L., Austin, D., Young, T., & Mignot, E. (2004). Short Sleep Duration Is Associated with
Reduced Leptin, Elevated Ghrelin, and Increased Body Mass Index PLoS Medicine, 1 (3)
DOI: 10.1371/journal.pmed.0010062
SOURCE: http://nutritionwonderland.com/2009/06/understanding-our-bodies-leptin-the-fullness-hormone/

8 Dangers of Human Growth Hormone!
There are many websites, anti aging clinics, nutritional supplement companies and high profile individuals like Sylvester Stallone who dismiss the dangers of human growth hormone injections. Instead they paint a tempting picture of how it can increase the quality of your life by:
Increasing muscle tone and strength while decreasing body fat!
Increasing your energy, endurance, and stamina especially in the bed room!
Restoring your hair color while giving you a thicker and healthier head of hair!
Elevating your mood to keep you from feeling depressed!
Reducing the wrinkles on your face and tightening your skin!
Improving your blood pressure, cholesterol levels, and vision!
Improving your memory and mental clarity!
Improving sexual potency for both men and women!
Sounds wonderful, doesn’t it? To be forever young, vibrant, athletic and virile! How much would you pay to get results like this? Would you spend a couple hundred dollars to a grand or more? Well that’s exactly what some people do.
They reject the real and substantial dangers of human growth hormone injections for these promises. This article will help you separate fact from friction. It will help you realize that there are natural ways to allow your body to maximize its ability to produce and regulate this important hormone without the dangerous side effects of synthetic human growth hormone. Let’s start out by answering a few basic questions.
What is Human Growth Hormone?Human growth hormone (HGH) is a hormone secreted by the anterior lobe of your pituitary gland. This hormone is sometimes called somatotropin. The release of this hormone is controlled by your hypothalamus which is centrally located in your brain just above your brain stem. This almond sized portion of your brain links the nervous system to your endocrine system via the pituitary gland. It plays a major role in your overall metabolism as well as your lean muscle to body fat ratio.
Human growth hormone will also stimulate cells in the liver to secrete polypeptide molecules known as somatomedins. The most studied is insulin-like growth factor-1 (IGF-1). Together HGH and IGF-1 influence every system in your body such as:
Muscular development
Connective tissue growth and repair
Skeletal strength and structure
Regulation of various metabolic functions
Aiding normal brain function
Aiding heart health and function
The release of human growth hormone declines with age. It is estimated that after the age category of 18 – 25 the magnitude of the HGH pulse from the pituitary gland declines by 50% every seven years. As human growth hormone declines so does the levels of IGF-1. This results in a number of undesirable symptoms that are generally associated with the aging process. Symptoms like fat accumulation around the midsection, loss of muscle mass and cognitive function, decreased strength and endurance, increased bone frailty and disruption in sleeping patterns.
How HGH Became the Elixir for Vibrant Life! Before we talk about the dangers of human growth hormone when artificially brought into the body we need to understand how it became the designer injection for curing the aging process. To do that we need to go back to 1990 when The New England Journal of Medicine published a landmark study by Rudman and his colleagues entitled “Effects of human growth hormone in men over 60 years old.” This study involved 21 men aged 61 to 81. Although apparently healthy they had low levels of IGF-1. Twelve of the men were given growth hormone injections three times a week for six months. They were than compared to 9 men who received no treatment.
Those receiving the HGH treatments experienced a decrease in fat tissue, an increase in lean body tissue or muscle mass, and an improvement in lumbar spine density. The general media picked up on these positive findings but ignored the editorial warnings that were also part of this study. Those warnings talked about the side effects experienced by some of the subjects, the unknown long-term effects of administering HGH to healthy adults, the expensive costs associated with HGH injections, and the question of whether there really was any substantial improvement in the quality of life versus someone who was committed to an age appropriate exercise program.
Like so much of modern medical advertising, people are sold the idea that a pill or injection can cure their ills and discomforts. Out of this a billion dollar industry was spawned. “Anti-aging specialists” with newly invented tests to determine your“biological age” populated the landscape. They prescribed expensive hormone shots coupled with designer dietary supplements to help you slow down and/or reverse the aging process. In reality, what most of these “anti-aging specialists” did was reverse the size of peoples’ bank account.
Because of the consistent misuse of the Rudman article from 1990, The New England Journal of Medicine took an unprecedented step to correct the record by issuing the following statement:
“If people are induced to buy a ‘human growth hormone releaser’ on the basis of research published in the Journal, they are being misled. In order to warn those who visit our Web site for this reason, this Perspective article and Dr. Vance’s commentaries will from now on appear with the article by Rudman et al. each time it is downloaded.”
Dangers of Human Growth Hormone!To be completely transparent, there is a need for human growth hormone injections for a specific population group. HGH has been shown to be useful in the treatment of children and adults who have significant growth hormone deficiencies. However, theAmerican Association of Clinical Endocrinologists strongly warns against the use of growth hormone injections for those with overweight/obesity issues or as an anti-aging treatment.
Robert N. Butler, M.D., the noted gerontologist has also weighed in on this matter. According to Dr. Butler, “Although hormone-replacement trials have yielded some positive results (at least in the short term), it is clear that negative side effects can also occur in the form of increased risk for cancer, cardiovascular disease, and behavior changes.”
One of the main dangers of human growth hormone injections is the unregulated effect it can have on the overproduction of IGF-1 concentrations. This can lead to some very serious side effects like:
Swelling in the arms and legs
Carpal tunnel and arthritis-like symptoms
Headaches and general muscle pain
Diabetes
Abnormal growth of the bones and internal organs
High blood pressure
General bloating
Hardening of the arteries
For these reasons, human growth hormone injections should always be done prudently and with a qualified medical practitioner who has clinical experience in managing this type of hormonal deficiency.
Natural Strategies for Optimizing Human Growth HormoneThe dangers of human growth hormone injections are real and substantial. Most of these dangers center on the body’s inability to control the effects of HGH injections through a series of hormonal checks and balances. Fortunately, there are natural strategies that can safely improve your body’s ability to produce HGH without the side effects. They are:
1. Adequate Sleep – The highest concentration of HGH activity occurs during deep sleep. There are numerous studies that have clearly shown that inadequate sleep and irregular sleeping patterns can substantially reduce the about of human growth hormone secretion. According to Dr. Richard Auchus, a professor of endocrinology at the University of Texas Southwestern Medical Center in Dallas:
2. “Growth hormone and testosterone production peak during sleep. You can actually get people to test pathologically low for growth hormone by waking them repeatedly during the night. I always tell people that if you want to maximize your growth hormone, get a good night’s sleep.”
2. Avoid high glycemic foods – Insulin is a direct inhibitor of HGH secretion. High glycemic foods can play havoc with your insulin levels causing them to spike or surge above normal, healthy levels. Not only does this increase your risk for developing type II diabetes but it can also have a powerful affect on reducing human growth hormone secretion.
3. Trim your abdominal fat – If you’re carrying excess fat around the mid-section then you will impaired your body’s ability to produce HGH. Typically, a person with excess stomach or abdominal fat is also suffering from both insulin and leptin resistance. By working to restore your body’s leptin sensitivity you can accomplish three positive health benefits: reduced body fat, improved blood sugar control, and improve human growth hormone and IGF-1 production.
4. Exercise – The type, duration, and level of intensity of your exercise program will have varying effects on HGH secretion. There are multiple studies that show how an exercise intensity that pushes your body to a lactate threshold can trigger an excised-induced HGH release for at least 24 hours. Most athletes create this lactic acid formation to stimulate HGH release by using high intensity, short duration exercises. However, several studies have shown that properly administered circuit training programs that utilize relatively light resistances can be just as effective in stimulating the production of human growth hormone.
5. Late night snack – Your last snack before bedtime can have an impact on your fat stores or your HGH production but not both. High carbohydrate snacks before bedtime will only feed your fat cells. They do nothing to stimulate the production of human growth hormone. However, a high-protein, low-carbohydrate snack about an hour before bedtime can serve a dual purpose. Because it’s low carbohydrate it minimizes insulin release. (Remember insulin is counterproductive to HGH secretion.) Because it’s high in essential amino acids it aids your body’s natural ability to produce human growth hormone. Just keep your snack under 200 calories and at least an hour before bedtime.
6. L-arginine – This essential amino acid, when properly brought into your system, can increase the release of HGH. However, the combination of L-arginine intake with exercise, especially resistance training or interval training exercises, can produce even greater increases in human growth hormone.
7. Glutamine – Your body’s most abundant amino acid is glutamine. Studies have shown that consuming even a modest amount of glutamine (2000 mg) can increase HGH levels.
8. Glycine – This essential amino acid also has the potential to benefit human growth hormone production. Research has shown that glycine plays a critical role in initiating normal patterns of REM sleep. In a 2007 study published inSleep and Biological Rhythms, researchers showed that glycine administered orally just prior to bedtime significantly improved the quality of sleep for the test subject. The test subjects were chronic insomniacs. In addition to helping improve their sleep patterns, one of the side benefits was an improvement in the HGH production. This would make sense since proper sleep is a critical factor in the body’s ability to properly regulate its circadian release of human growth hormone.
ConclusionsProper levels of human growth hormone are important for good health and wellness. The question is whether you choose to take steps to improve your human growth hormone levels naturally or synthetically.
The dangers of human growth hormone injections are real. These dangers become even greater when you choose methods that are administered by unqualified individuals. To counter the dangers of human growth hormone injections I’ve given you eight safe and natural methods. Methods that will help your body optimize its ability to proper manufacture HGH.
In our quest to stay young and healthy we are often tempted to circumvent the natural checks and balance our body has to help us maintain good health. This is especially true when dealing with hormonal issues. Thankfully there are several methods that you can use to safely and naturally utilize your body’s internal mechanisms to help you maximize your body’s ability to produce human growth hormone. Mechanisms that will help you avoid the dangers of human growth hormone injections and still slow down the aging process.
Until next time, may we both age youthfully!
Synergistically yours,
P.S. I would recommend the following articles to help you properly nourish your cells as you incorporate effective anti aging solutions in your wellness program:
The Best Anti Aging Advice is Grounded in The 1% Solution
Water, is it the Best Ingredient for Slowing Down the Aging Process?
The Dark Cola Drink Verses Water!
How Do Food, Metabolic, and Digestive Enzymes Factor in an Anti Aging Strategy?
These 5 Steps To Better Sleep Can Positively Affect Your Health!
The Acid Alkaline Balance: Does Your Body’s pH Cause Cancer and Other Diseases? Part 1
The Acid Alkaline Balance: Does Your Body’s pH Cause Cancer and Other Diseases? Part 2
How Advanced Glycation End Products Cause You to AGE!
SOURCE: http://www.aging-no-more.com/dangers-of-human-growth-hormone.html
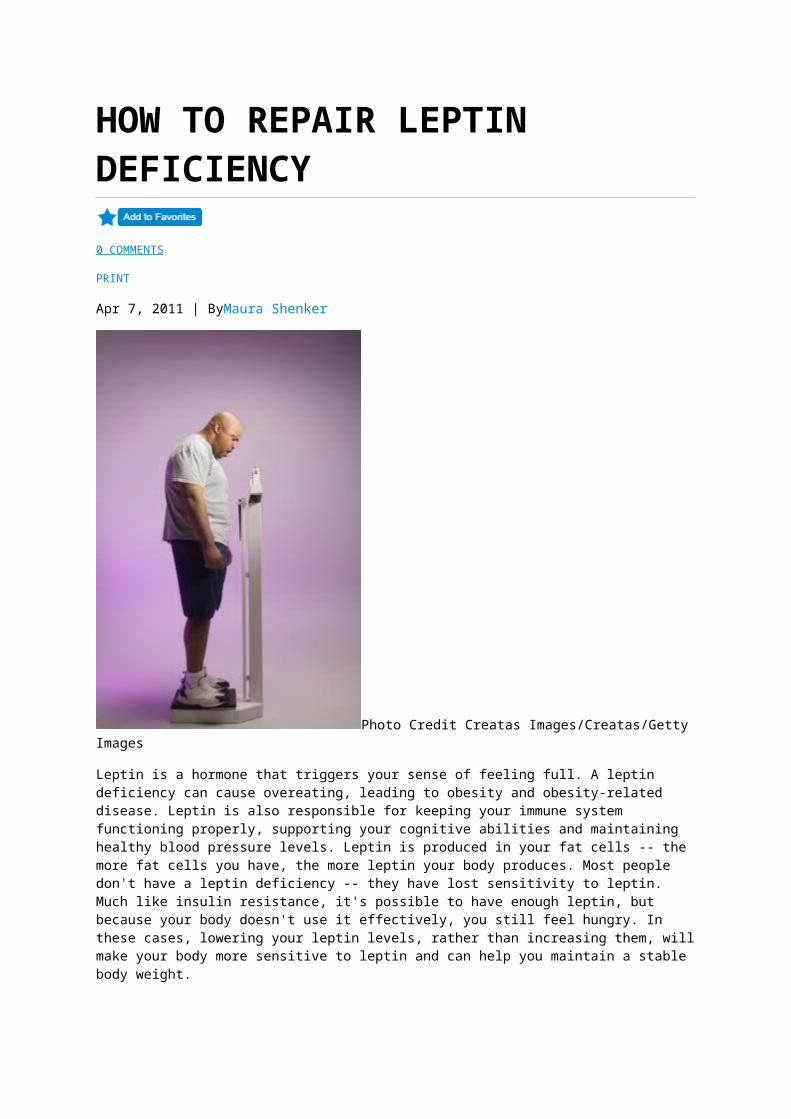
HOW TO REPAIR LEPTIN DEFICIENCY
0 COMMENTS
Apr 7, 2011 | ByMaura Shenker
Photo Credit Creatas Images/Creatas/Getty Images
Leptin is a hormone that triggers your sense of feeling full. A leptin deficiency can cause overeating, leading to obesity and obesity-related disease. Leptin is also responsible for keeping your immune system functioning properly, supporting your cognitive abilities and maintaining healthy blood pressure levels. Leptin is produced in your fat cells -- the more fat cells you have, the more leptin your body produces. Most people don't have a leptin deficiency -- they have lost sensitivity to leptin. Much like insulin resistance, it's possible to have enough leptin, but because your body doesn't use it effectively, you still feel hungry. In these cases, lowering your leptin levels, rather than increasing them, will make your body more sensitive to leptin and can help you maintain a stable body weight.Step 1Determine if you're leptin deficient or leptin-resistant -- the symptoms may be the same. If you're leptin deficient, you'll need to increase your levels of leptin. It's rare to not produce enough leptin. Most people are leptin resistant. If you're leptin resistant, you don't want to increase leptin levels -- you want to increase your sensitivity to leptin by losing weight. A simple A1C blood test can check for leptin resistance, as can a urine protein test or a TSH thyroid test.
advertisement

Sponsored Links
Natural Serotonin Booster Proven formula increases serotonin to relieve depression & anxiety.amoryn.com
Step 2Get a good night's sleep. Melatonin, the hormone that regulates your body's internal clock, is closely linked with leptin production. Your body produces the most leptin overnight while you sleep. Anything that disrupts your sleep can disrupt leptin production.Step 3Eat foods high in polyunsaturated omega-3 fats. CLA, conjugated linoleic acid, is a type of omega-3 fatty acid that can boost leptin production and help reduce sugar cravings -- both of which might contribute to weight loss. Losing weight may increase your leptin sensitivity so your body can use the leptin you do produce more effectively.Step 4Increase your calcium and magnesium intake. Eating dairy foods and leafy green vegetables, such as kale, that contain these two minerals will help boost cellular energy levels. When your cells have more energy, they can produce more leptin. Magnesium, in particular, pushes your cells to work harder.Sponsored Links
Bio-identical hormones Prepared individually per patient Life changing for men and womenwww.reakiri.co.za
Ask an Endocrinologist Doctors Will Answer You in Minutes! Questions Answered Every 9 Seconds.Health.JustAnswer.com
Check Symptoms Online Instantly Check Your Symptoms & Find Treatment Options. Search Now!iTriageHealth.com
50 Fat-Burning Exercises Burn fat & get ripped fast with these extreme fat-burning exercisesMaxWorkouts.com
TIPS AND WARNINGS
Insulin resistance and high glucose levels affect leptin production. Keeping your blood sugar levels stable and exercising regularly will help your body produce more leptin.
Although leptin supplements are available, they must be taken under a doctor's supervision. Increasing your natural production of leptin is the best long-term solution to leptin deficiency.
REFERENCES
Vitamin Research Products: The Hormonal Key to Fat Reduction and Heart Health "Good Morning America": The Role of Leptin in Weight Loss University of Maryland Medical Center: Melatonin McGuckin Chiropractic: Rethinking Weight Loss Article reviewed by Eric Lochridge Last updated on: Apr 7, 2011
Read more: http://www.livestrong.com/article/416298-how-to-repair-leptin-deficiency/#ixzz2PDhAK2Ec
Research Review: Leptin, ghrelin, weight loss – it’s complicatedby HELEN KOLLIAS | February 25th, 2011
3
13 1469
It’s a grim statistic: Most people who go on a diet and lose weight end up regaining that weight within a year.Doesn’t sound too promising.
Why does this happen? Well, there are many reasons.
The big one is that people view a “diet” as a short-term solution and don’t
really change their behaviours — which is why our Lean Eating coaching
program focuses on sustainable, permanent change.
Another reason is that our bodies have appetite- and weight-regulating
hormonal mechanisms that try to maintain homeostasis (aka keep things the
same) over the long haul. When we consistently take in less energy (in the
form of food) than we expend through basal metabolism and activity (as in a
diet or famine), our bodies respond by making us hungrier.
Our bodies don’t generally want to change. They like everything to stay the
same. If we try to change things, our bodies will respond with compensation
mechanisms, such as revving up our appetite hormones.
Two important hormones that shape our appetite and hunger signals are leptin
and ghrelin.
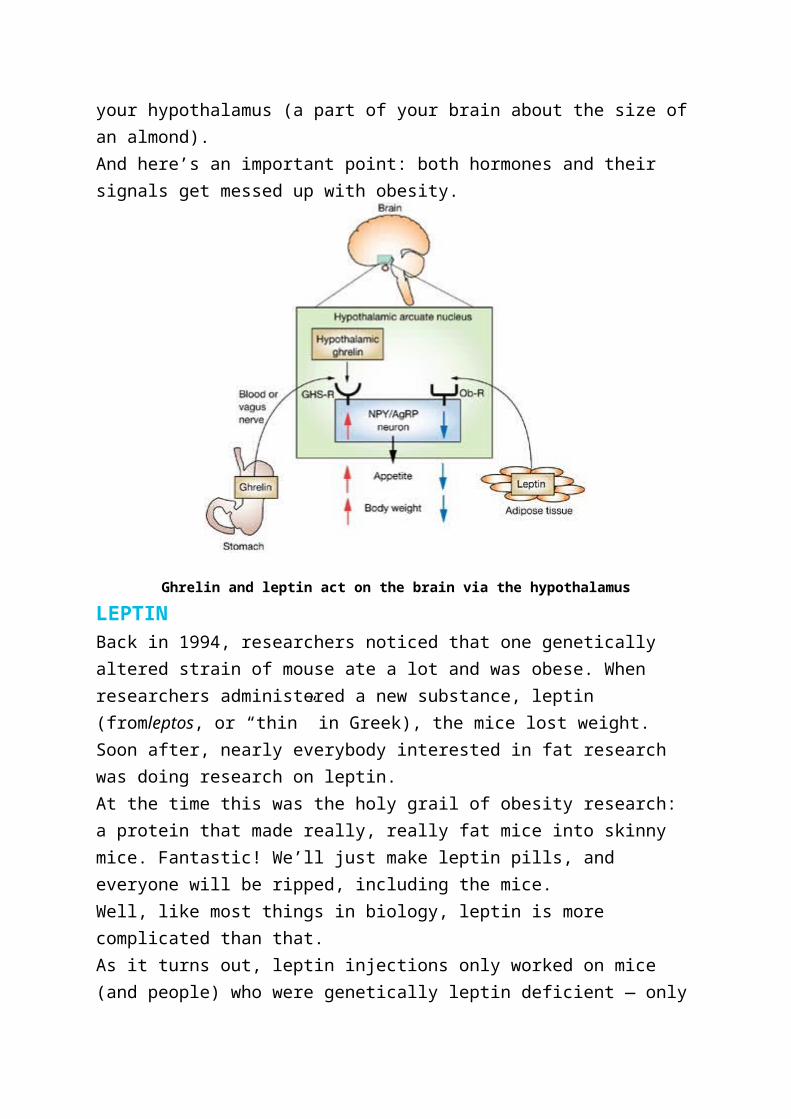
Hormonal control of appetite and body fatLeptin and ghrelin seem to be the big players in regulating appetite, which
consequently influences body weight/fat. When we get hungrier, we tend to
eat more. When we eat more, obviously, we maintain our body weight or gain
that weight back.
Both leptin and ghrelin are peripheral signals with central effects. In other
words, they’re secreted in other parts of the body (peripheral) but affect our
brain (central).
Leptin is secreted primarily in fat cells, as well as the stomach, heart,
placenta, and skeletal muscle. Leptin decreases hunger.
Ghrelin is secreted primarily in the lining of the stomach.
Ghrelin increases hunger.
Both hormones respond to how well-fed you are; leptin usually also correlates
to fat mass — the more fat you have, the more leptin you produce. Both
hormones activate your hypothalamus (a part of your brain about the size of
an almond).
And here’s an important point: both hormones and their signals get messed up
with obesity.

Ghrelin and leptin act on the brain via the hypothalamus
LEPTINBack in 1994, researchers noticed that one genetically altered strain of mouse
ate a lot and was obese. When researchers administered a new substance,
leptin (fromleptos, or “thin” in Greek), the mice lost weight.
Soon after, nearly everybody interested in fat research was doing research on
leptin.
At the time this was the holy grail of obesity research: a protein that made
really, really fat mice into skinny mice. Fantastic! We’ll just make leptin pills,
and everyone will be ripped, including the mice.
Well, like most things in biology, leptin is more complicated than that.
As it turns out, leptin injections only worked on mice (and people) who were
genetically leptin deficient — only about 5-10% of obese subjects. The other
90-95% were out of luck.
HOW DOES LEPTIN WORK?Leptin is made by adipose tissue (aka fat) and is secreted into the circulatory
system, where it travels to the hypothalamus. Leptin tells the hypothalamus
that we have enough fat, so we can eat less or stop eating. Leptin may also
increase metabolism, although there is conflicting research on this point. (1)
Generally, the more fat you have, the more leptin you make; the less food
you’ll eat; and the higher your metabolic rate (possibly). Conversely, the less
fat you have, the less leptin you have, and the hungrier you’ll be.
Basically, for weight loss — the more leptin the better.
LEPTIN RESISTANCEYou’d think, then, that fatter folks would somehow magically stop eating or
start losing weight once their leptin levels were high enough. Unfortunately,
you can become leptin resistant (2).
In that case, you can have a lot of fat making a lot of leptin, but it doesn’t work.
The brain isn’t listening. No drop in appetite. No increased metabolism. Your
brain might even think you’re starving, because as far as it’s concerned,
there’s not enough leptin. So it makes you even hungrier.
It’s a vicious cycle.
1. Eat more, gain body fat.
2. More body fat means more leptin in fat cells.
3. Too much fat means that proper leptin signalling is disrupted.
4. The brain thinks you’re starving, which makes you want to eat more.
5. You get fatter. And hungrier.
6. You eat more. Gain more fat.
7. And so on.
Leptin resistance is similar to insulin resistance (and they also share common
signalling pathways). Insulin resistance occurs when there’s lots of insulin
being produced (for example, with a diet high in sugar and simple
carbohydrate), but the body and brain have stopped “listening” to insulin’s
effects.
Interestingly, both types of resistance seem to occur together in obese people,
though obese men who tend to have more internal belly fat (visceral fat) have
higher insulin levels, and women who tend to have more fat under their skin
have higher leptin levels (2).
Another leptin resistance fun fact is that fructose seems to induce leptin
resistance (3).
There are a few possible explanations for how leptin resistance actually
works. One theory is that leptin can’t get to the hypothalamus because the
proteins that transport it across the blood brain barrier aren’t working or aren’t
there, since there’s a buildup of leptin in the cerebral spinal fluid that bathes
the brain (4).
Regardless of the actual mechanics, the important point here is that past a
certain level, having more body fat can screw up your appetite signals and
actually make you hungrier.
GHRELINGhrelin was discovered 7 years after leptin, but after the leptin letdown, there
was much less fanfare.
Leptin is a hormone that is a result of a buildup of fat, so it’s a long term
regulator of body weight. Meanwhile, ghrelin is the short term Hey I’m hungry
when do we eat?regulator.
Your stomach makes ghrelin when it’s empty. Just like leptin, ghrelin goes into
the blood, crosses the blood-brain barrier, and ends up at your hypothalamus,
where it tells you you’re hungry (1,5).
Ghrelin is high before you eat and low after you eat.
If you want to lose weight you want less ghrelin, so you don’t get hungry. If
you want to gain weight, say if you’re scrawny, then you want more ghrelin —
or at least you want it to stay high as you eat, so you’ll want to eat more.
Both hormones, as I mentioned, regulate appetite and hunger, and both of
them regulate homeostasis — in this case, keeping you adequately fed. When
you try to lose fat, your body will probably respond by changing hormone
levels so that you get hungrier.
Obviously, this presents a challenge for folks trying to lose fat and keep it off
— leading, perhaps, to the dreaded “yo-yo dieting” phenomenon.
Research questionCan leptin and ghrelin levels provide some explanation for the ups and downs
that dieters experience? And could this relationship be more complicated than
we expect?
This week’s review looks at how leptin and ghrelin levels are related to weight
regain after dieting. (The title kind of gives the punch line away.)
Crujeiras AB, Goyenechea E, Abete I, Lage M, Carreira MC, Martínez JA,
Casanueva FF. Weight regain after a diet-induced loss is predicted by higher
baseline leptin and lower ghrelin plasma levels. J Clin Endocrinol Metab. 2010
Nov;95(11):5037-44. Epub 2010 Aug 18.
MethodsResearchers put over 160 obese and overweight men and women with an
average BMI over 31.1 kg/m2 on a calorie restricted diet for 8 weeks.
This diet was 30% less (500-600 kcal/day) than the participants’ total energy
expenditure, with 15% of calories from protein, 30% from fat and 55% from
carbohydrates. There was no change in physical activity, just less food.
Researchers measured body weight, body fat and waist girths. They also took
blood samples. Measures were taken before dieting (week 0), right after the
dieting (week 8), and 6 months later (32 weeks).
ResultsAfter 8 weeks on the diet, people lost an average of 5% body weight. Men lost
5.9% on average, and women lost 4.5%. They lost an average of 1.6% body
fat and 4.1 cm off their waists.
GAINERS AND LOSERSBut the average doesn’t give us the whole story. Some folks lost more than
5% of their weight, while others lost less. This may seem self-evident and not
that interesting… until you look at their blood samples.
Dieters who lost more weight (>5%) had a bigger drop in leptin and insulin
compared to dieters who lost less weight (<5%). Somehow losing weight is
correlated to drops in leptin and insulin.
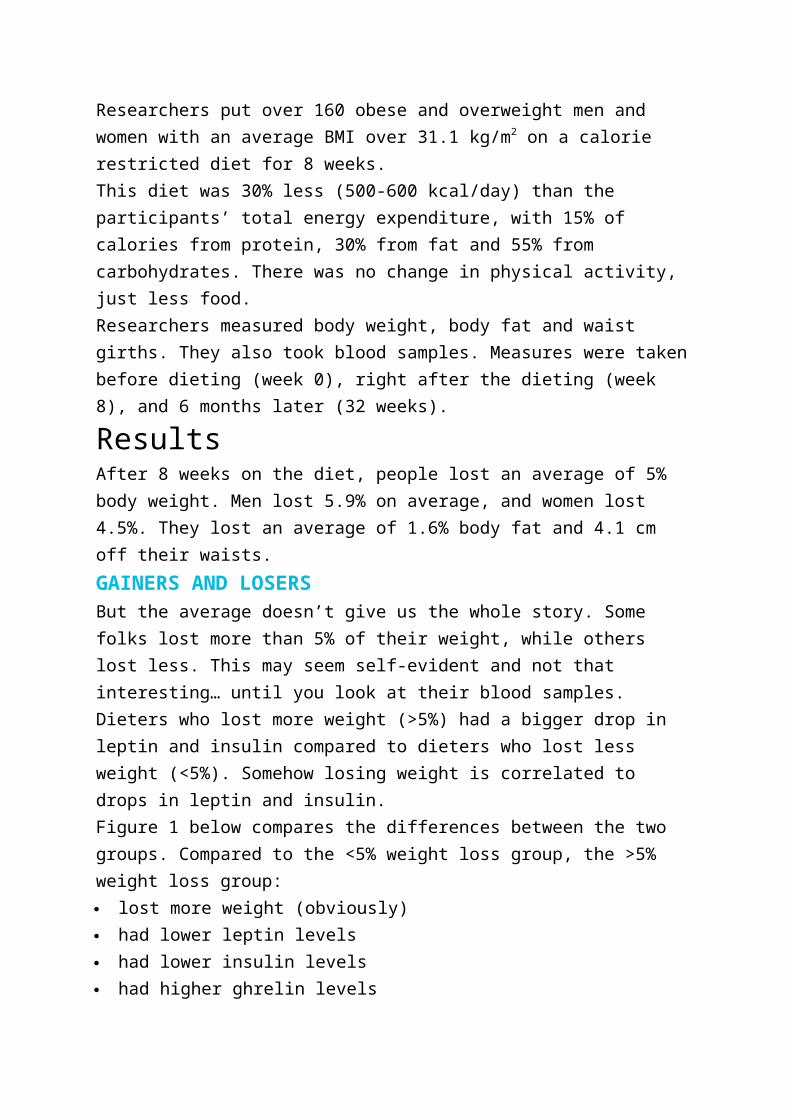
Figure 1 below compares the differences between the two groups. Compared
to the <5% weight loss group, the >5% weight loss group:
lost more weight (obviously)
had lower leptin levels
had lower insulin levels
had higher ghrelin levels
Figure 1: Differences between >5% and <5% weight loss groups
This is pretty much what you’d expect.
Six month after the diet ended, this split continued. About half the group lost
more weight; half the group re-gained the weight they lost.
Blood levels of leptin and ghrelin were correlated to weight loss or regain —
and this effect often depended on sex.
Women with lower blood leptin at the end of dieting were more likely to
maintain their weight loss, but ghrelin didn’t seem to make a difference.
Men with higher ghrelin levels at the end of dieting were more likely to
regain weight, but leptin didn’t seem to matter.
For both men and women, insulin levels at the end of dieting didn’t seem to
matter in the long term, although insulin levels did increase when weight
went back up.
For both men and women, ghrelin levels were higher (meaning they were
hungrier) at the end of dieting, but in weight losers, ghrelin levels dropped.
Huh.
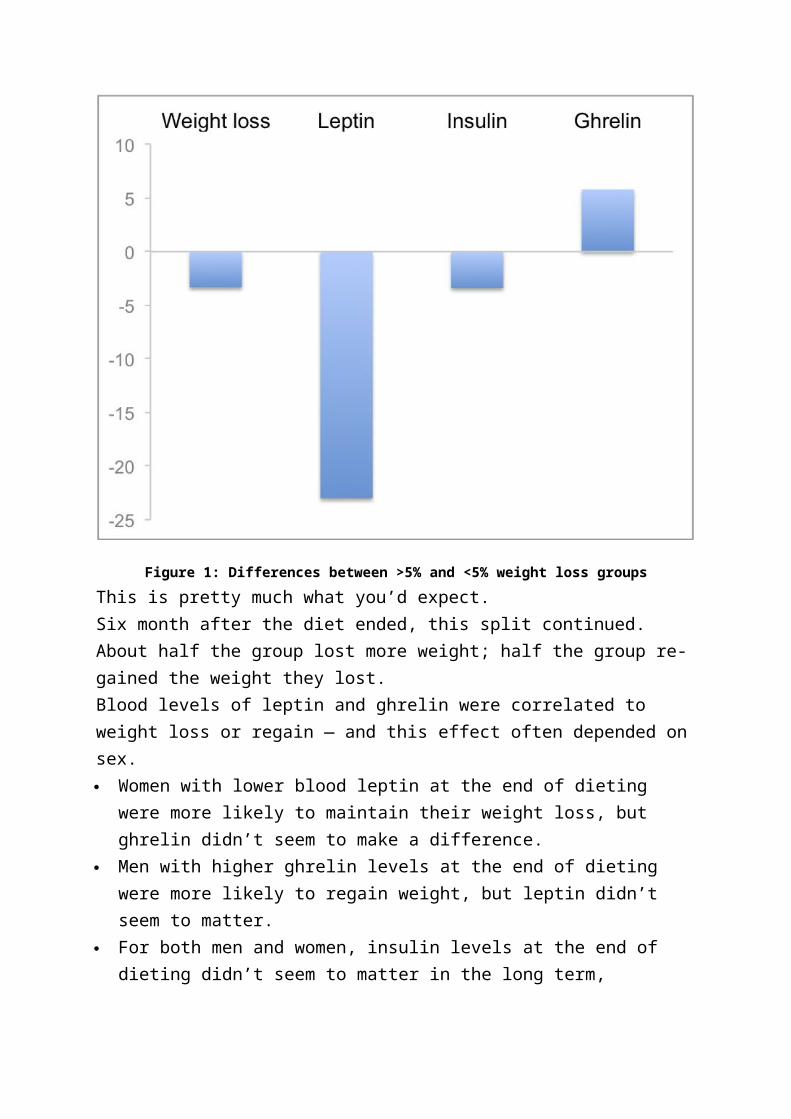
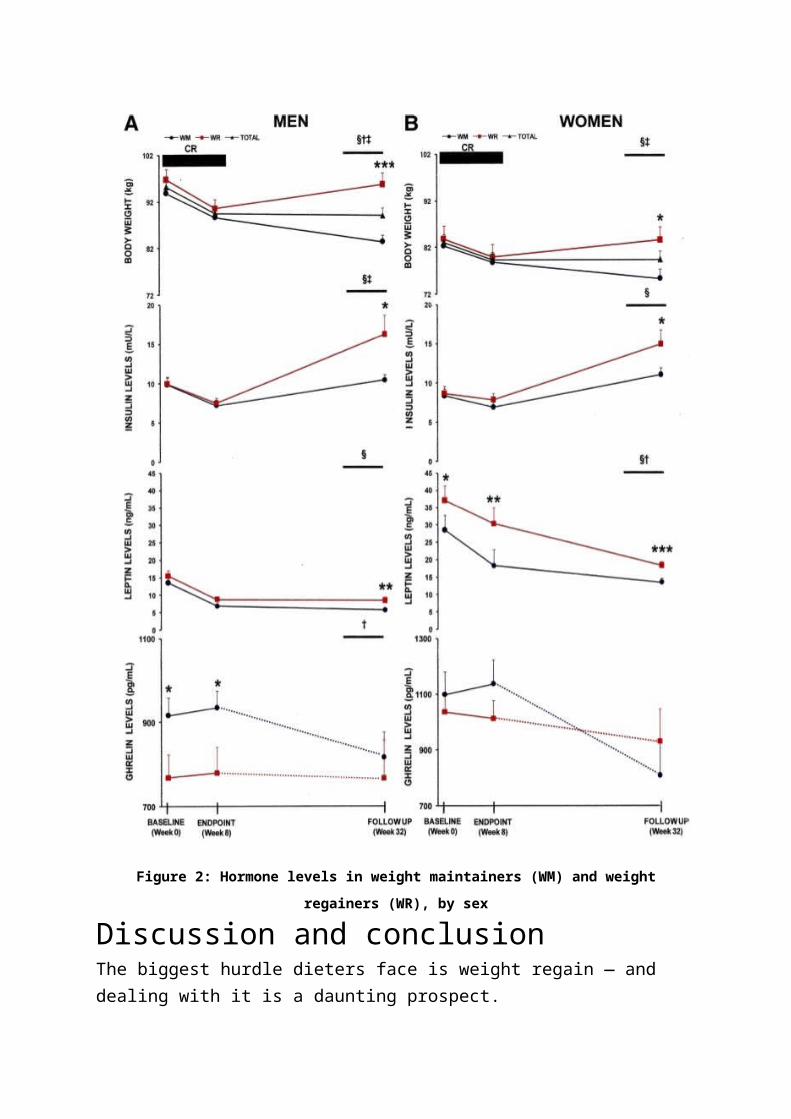
Figure 2 shows the changes in hormone levels between weight maintainers
(WM) and weight regainers (WR) at the start of the diet (0 weeks), end of the
diet (8 weeks), and 6 months later (32 weeks). WRs are indicated by the red
lines; WMs are the black lines with circles.
Figure 2: Hormone levels in weight maintainers (WM) and weight regainers (WR), by sex
Discussion and conclusionThe biggest hurdle dieters face is weight regain — and dealing with it is a
daunting prospect.
Appetite is controlled by a host of complex, interacting factors. This study
suggests that the hormonal mechanisms may be different for men and women
— and among men and women.
This difference may reflect the different hormonal environments in men and
women. For instance:
Ghrelin seems to be affected by growth hormone release, which differs in
men and women.(6)
Leptin seems to influence reproduction and fertility in women, which is
related to women’s body fat levels. Women appear to be much more
sensitive than men to leptin levels… unless men are given estrogen.(6)
Intranasally administered insulin makes men less hungry and lose weight,
but makes women hungrier and gain weight… unless women’s estrogen
levels, or men’s testosterone levels, are low.(6)
However, there were also important differences within groups as well. Some
men lost weight while others regained it. Some women lost weight while
others regained it.
As the researchers point out, these findings suggest “the existence of two
different populations according to the leptin and ghrelin levels [are] influencing
the response outcomes”.
We’d expect that folks who regain weight easily would have lower leptin and
higher ghrelin — making them hungrier. Not so in this study. The researchers
propose that these results “are consistent with a disruption in the sensitivity to
these hormone signals, probably in the central nervous system of those
subjects with a higher predisposition to regain body weight.”
This suggests that in obese people, leptin and ghrelin signals may not always
work in ways that we expect. Obesity can disrupt normal appetite signalling.
There is probably more to the story, and we’ll need more research to
understand all the elements of weight loss.
MANY FACTORS IN WEIGHT LOSSThus it appears that there are many important factors that shape successful
weight loss.
If you’re looking for the silver bullet that will magically kill hunger and strip
body fat off you, give up now.
Metabolic endocrinology appears to be only slightly more complicated than a
nuclear reactor and brain surgery combined. No single hormone controls body
composition, appetite, and hunger — and your individual hormonal profile may
be relatively unique.
What’s also notable is that dieters who lost more weight on the diet had more
significant changes in their appetite. They were probably hungrier while losing
that weight.
DOES THE DIET MATTER?A few things that likely are contributing to weight regain are that this was
a diet. Reduce calories for 8 weeks, lose the weight, then hope things work
out for you. Obviously since it worked for some people, this method has some
merit.
But as the data show, short-term diets alone don’t have a great success rate
in the long run.
The macronutrient breakdown of this diet could also be relevant. It’s relatively
low in protein, moderate in fat, and high in carbohydrate. We might see
different hormonal effects with, say, a low-carb, high-fat, high-protein diet.
(See last week’s Research Review on high-protein diets if you want to know
more.)
WHAT ELSE CAN I DO?Strictly looking at improving ghrelin and leptin levels, some studies have
shown that taking fish oil and getting regular sleep help. (7-9)
Other factors that help long term weight loss include:
increased physical activity
getting social support
behaviour change techniques (e.g. goal-setting) (10).
Bottom lineMany interacting hormones shape our appetite and hunger. Several factors
affect these hormones and our response to them. So if you’re looking for a
single solution — or rely on a short-term diet as a quick fix — you’ll probably
be disappointed.
But there’s good news: There are many things that you can do that will lead to
lasting body composition change.
1. Take fish oil. Omega 3 fatty acids are linked to decreased hunger. (7)
2. Sleep. Lack of sleep leads to more ghrelin and less leptin, as well as
disrupted glucose and insulin metabolism. (8,9)
3. Don’t get discouraged by these kinds of studies. Other research
shows that it is possible to lose weight and keep it off — you just have
to do a bit more than pop a leptin pill or do a few jumping jacks.
The National Weight Control Registry tracks the features of successful
losers. These include behaviour change, a commitment to good nutrition,
and regular exercise.
4. Understand that when losing fat, you might be hungrier. That’s normal.
5. Enrol in the Lean Eating program. We’ve helped thousands of folks lose
weight and keep it off for good. (And if you’re already in Lean Eating,
congratulations! You’re well on your way!)
ReferencesClick here to view the information sources referenced in this article.
INTERMITTENT FASTING, SET-POINT AND LEPTIN
8:15 AM | Posted by Martin BerkhanI ranted a little about diet approach, leptin and the set-point theory on bodybuilding.com.
Figured it could make for a decent post here. I added some extras in the form of a short review on the effects of intermittent fasting on leptin.
---
Short background on leptin and set-point
Leptin is a master-hormone with downstream effects on other hormones related to metabolism (T3/T4, neuropeptide-Y, epinephrine, among many others).
In the long-term, leptin is regulated by total amount of fat mass. A drop in leptin affects the other hormones negatively and vice versa. Low leptin leads to an increase in hunger and a decrease in metabolic rate, much like high leptin leads to a decrease in hunger and an increase in metabolic rate.
Generally speaking, lean people have low levels of leptin while obese have high levels of leptin. However, in the latter case, leptin resistance develops. This is likely an effect of chronically elevated leptin, much like insulin resistance is an effect of chronically elevated insulin.
The set-point theory of body weight-regulation is intimately connected to leptin and has a strong genetic component to it. Naturally lean people maintain a low body fat set-point by being leptin-sensitive; they can maintain a low body fat percentage and function optimally even with low leptin. But most of us aren't so lucky, which is why getting really lean is typically a difficult task.
Dieting in the single digit body fat-range
Lyle McDonald paints a dark picture of life in the low body fat percentage-range. Yet I and my clients maintain a low body fat % without any of the often cited symptoms, such as anhedonia, low libido and a general sense of weakness. It's hard to argue against the literature on the topic, since it's substantial and shows that these side-effects indeed occur. However, it bears mentioning that the studies looking at leptin levels after dieting are limited in the sense that they often use conventional dieting strategies that entail a pronounced weekly calorie deficit for both men and women.
I too experienced the aforementioned side-effects in the past, That is, before I finally "got it right." What does that mean exactly?
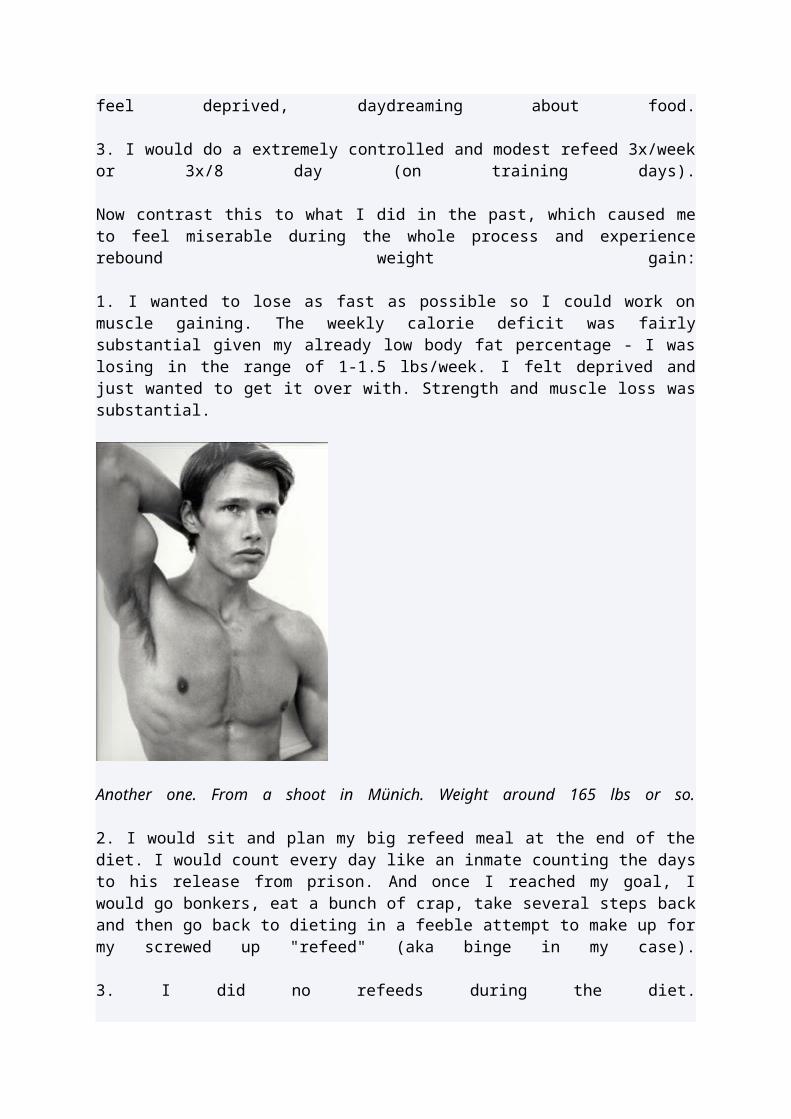
Me at a skinny 165 lbs. Editorial work in Milan. My approach to dieting back then wasn't exactly ideal.
During my last cutting diet, that is the one that took me to 5.5% where I have hovered ever since, I did the following things right:
1. I lost the final pounds of fat very slowly and the weekly calorie deficit was subtle. The scale moved down as slow as one pound every other week. On the other hand, I barely felt like I was dieting and I maintained strength and muscle surprisingly well.
2. I was able to make a smooth transition into maintenance. I did not count the days until the diet ended, and I did not sit and plan a big refeed to celebrate when I was done. I didn't feel deprived, daydreaming about food.
3. I would do a extremely controlled and modest refeed 3x/week or 3x/8 day (on training days).
Now contrast this to what I did in the past, which caused me to feel miserable during the whole process and experience rebound weight gain:
1. I wanted to lose as fast as possible so I could work on muscle gaining. The weekly calorie deficit was fairly substantial given my already low body fat percentage - I was losing in the range of 1-1.5 lbs/week. I felt deprived and just wanted to get it over with. Strength and muscle loss was substantial.

Another one. From a shoot in Münich. Weight around 165 lbs or so.
2. I would sit and plan my big refeed meal at the end of the diet. I would count every day like an inmate counting the days to his release from prison. And once I reached my goal, I would go bonkers, eat a bunch of crap, take several steps back and then go back to dieting in a feeble attempt to make up for my screwed up "refeed" (aka binge in my case).
3. I did no refeeds during the diet.
So what's the lesson here and how does it relate to the topic at hand?
Leptin: science versus real world
Leptin is controlled primarily by two things, which are
a) Short term: acute energy balance. A high calorie deficit causes leptin to drop lower than what can be explained by fat loss, and a caloric surplus raises leptin higher than what can be explained by fat gain.
b) Long term: total amount of fat mass. Fat cells are factories for leptin production. Not having many factories obviously impairs production and the aboslute amount of leptin in circulation.
If A can be manipulated via a subtle energy deficit and regular refeeds of the right macrocomposition (carb refeedsacutely increase leptin, while fat has no effect), this should prove beneficial to circulating leptin levels during the diet. It might prove fruitful to "trick" the last few pounds of fat off while venturing into the single digits. Another cyclical diet that has much in common with this strategy is The Ultimate Diet 2.0 though I'm in favor of more frequent, more modest, refeeds and no glycogen depletion outside what occurs with a low-moderate training volume.
If anecdotal reports mean something, this is my standard approach for clients and it's working well. I'm not an isolated case. For example, have a look at Andreaz in this post on maintaining low body fat. And we're no ectomorphs by any means. I grew up fat. Science dictates I wouldn't be able to stay this way (low body fat) without feeling completely miserable, but that's just not the case. The avatar pic was taken at the end of 2007, and I've stayed that way ever since. But I failed many times in the past. Only when I learned patience did I attain my goal.
Now, this little theory of mine, that fat needs to be lost very slowly in the single digit range, still leaves questions as it pertains to B, which is that leptin is ultimately controlled by total amount of fat mass.
Several years and 30 lbs later, I finally "got it right".
Low fat mass equals low leptin. Can leptin sensitivity increase if weight is maintained on a low body fat % for a prolonged period of time? Sadly, there are no studies to suggest that for the time being. Can it increase through other means? Well, exercise and fish oil seem to improve leptin transport, so there's that.
But what I think people really want to know is how intermittent fasting affects leptin levels and there's some interesting research on that topic.
Intermittent fasting and leptin
Generally speaking, studies show a neutral effect on average leptin levels during intermittent fasting. While the fasting period decreases circulating leptin, this is compensated by a big boost when refeeding. In comparison to conventional meal frequencies, intermittent fasting induces a "peak and valley"-pattern in leptin synthesis. Leptin secretion is thus entrained to the meal pattern and shifting meal timing causes a comparable shift in plasma leptin rhythm.
However, there are some interesting discrepancies here in that women actually show a big increase in mean leptin levels during intermittent fasting. This occurs even in the absence of
weight gain which is all the more fascinating. In the quoted study, despite calorie intake being elevated in comparison to baseline intake, the women actually lost weight and lowered waist circumference and body fat percentage. Intermittent fasting was also shown to decrease neuropeptide-Y, a hormone that stimulates hunger. This could probably be explained by elevated leptin levels, but there was no linear correlation between the two in this case.
Similar effects have also been shown to occur in men. That is, fat loss occurred without any reduction in leptin - and these were fairly lean athletes to begin with.
Intermittent fasting may also be of benefit when dieting in the single digit range due to the effect of fasting on the fat mobilizing hormones epinephrine and norepinephrine. When you’re in the single digit body fat range, you’re likely to have low circulating levels of leptin. One of leptin’s downstream effects is on epinephrine and norepinephrine output. Low leptin equals impaired output of the aforementioned hormones. This is part of how leptin regulates metabolic rate. However, it seems that these hormones increase regardless during fasting. That is, leptin is not able to exert it’s usual power over these hormones. In this case, their increase cannot be mediated by leptin which allows fat mobilization to go on unabated during fasting.
That's it for now. There's plenty more on this topic, but I'll save that for some other time.
Summary
* Fat loss in the single digit body fat-range needs to be slow and tempered. In my experience, this allows for a smooth transition into maintenance and minimizes muscle loss. I also believe it might lessen the negative effect of dieting on leptin, which ultimately makes maintenance of low body fat achievable. I think most people diet too hard, which has a profoundly negative effect on leptin - and this is part of the reason why the weight gain rebound is so common in folks who finally manage to reach their goal (and then screw up everything by binging).
* Planned and regular refeeds should be in place. This affects leptin positively and allows for maintenance of muscle and strength. Even if your goal ultimately is fat loss, entering an anabolic phase with post-workout overfeeding will serve you well.
* Intermittent fasting seems to have interesting effects on leptin synthesis. Whether this has benefits for low body fat maintenance or circulating mean leptin levels is up for speculation for the time being.
---
For more on leptin and set-point, read this and this. I've also talked about the effects of our obesogenic environment on set-point and weight regulation in this post. Somewhat related to the topic at hand, I've also posted on strategies for maintaining low body fat.
Bodyweight Regulation: Leptin Part 1
As I noted Set Points, Settling Points and Bodyweight Regulation Part 2, although I’ve been using bodyweight/body fat during this discussion, it’s probably more likely that it is body fat levels per se that are being regulated. Today you’ll see why and from here on out I’ll only talk about bodyfat regulation.With early research (I’m talking the 1950 s) having established the existence of some type of′ setpoint (again, primarily in animal models), early researchers had to sort of guess what might be going on in terms of regulating body fat levels.Essentially they postulated that the brain of the animal must be responding in some form or fashion to a hormone that scaled with body fat levels. They could only postulate what it was and it would take another 40 years before a major candidate would make itself known.In 1994, the gene for a hormone that would eventually be called leptin (from the Greek “leptos” for thin) was discovered in the OB (OB stands for obesity) mouse. The OB mouse had been studied for decades and was spontaneously overweight with a low resting metabolic rate, low levels of activity, etc. It ate a lot, put on fat easily, etc. Here’s what it looks like compared to a normal lean mouse.
Superficially, the OB mouse appeared to be similar to obese humans (except furrier).It turns out that the OB/OB mouse doesn’t produce leptin at all, it has a gene defect and makes zero leptin.Inject it with synthetic leptin and it loses weight rapidly.After the discovery of leptin, the news was abuzz with thoughts that the cure for obesity was finally here. Companies spent a lot of money getting the rights to leptin, thinking it would fix the global obesity problem and they’d make zillions of dollars.So researchers went about measuring blood levels of leptin in humans of varying weight expecting obese humans to produce no leptin.To their dismay, it turned out that obese individuals invariably had very high levels of leptin and it was suggested that, in a similar vein to insulin resistance (where the body no longer responds appropriately to the hormone insulin), the body or brain had become leptin

resistant. There was plenty of leptin floating around but it wasn’t sending the right signal to the brain to turn off appetite and reduce body fat.I’d note in this regards that two other rat strains, the DB (for diabetic) and DIO (dietary induced obesity) rat show varying degrees of leptin resistance (the existence of resistance to the supposed regulating hormone was also postulated back in the 50 s). In the case of the′ DB rat, it’s complete and genetic; in the DIO rat it develops with increasing obesity.A variety of things induce leptin resistance including high blood triglyceride levels and even leptin itself; when elevated chronically, leptin induces resistance to itself.I’d note that it is currently being debated if leptin resistance is truly the cause for what’s going on and other models, such as the leptin insufficiency theory are being discussed as well; in this concept, a lack of leptin in the brain (but not in the body) is the problem. In either case, the signal from leptin isn’t being sent properly. I’ll talk about what that signal is in the next post.And while a handful of individuals have been found who produce no leptin (and who respond to injectable leptin with massive weight loss and a normalization of metabolic rate), studies which injected leptin levels in the obese showeddisappointing or no weight loss.Which doesn’t make leptin useless, mind you; it was simply being used incorrectly because researchers didn’t quite understand what it was actually doing or supposed to be doing. Many people still don’t.Before wrapping this up, I want to note that leptin isn’t the only candidate hormone for body weight regulation; as it turns out insulin is also a key player here (insulin also scales with bodyfat). Direct injection of insulin into the brains of animals reliably reduces food intake and bodyweight.There is also evidence, which I’ll discuss later, that there is a gender difference in how the brain responds to either leptin or insulin. Given that leptin scales mostly with subcutaneous fat (generally higher in women) and insulin scales mostly with visceral fat (generally higher in men), this will turn out to make some logical sense.Of course, there are other factors here as well. Hormones such as cholecystokinin, peptide YY, ghrelin as well as blood glucose, blood fatty acids, amino acids, and others being discovered damn near daily are all sending an integrated signal to the brain about what’s going on in the body.As well, varying hormones work on relatively longer or shorter time frames. For example, insulin can change in a matter of minutes, leptin may take hours, ghrelin operates on a meal to meal basis, etc. This makes for a very complicated system. But I’m getting ahead of myself.Oh yeah, it goes without saying that most of this information is discussed to one degree or another in almost all of my books. There are links to individual ones on the side rail or you can go to the store.
Source: http://www.bodyrecomposition.com/fat-loss/the-hormones-of-bodyweight-regulation-leptin-part-1.html
Set points, Settling points, and Bodyweight Regulation Part 1
Having explained why the separation of psychology and physiology is a false separation in Dieting Psychology vs. Dieting Physiology, I want to discuss quickly some of the physiology behind diet failures. This is a topic that I discuss in detail in nearly all of my recent books and
I’m not going to spend endless time on it here (trying to eventually get back to the psychological factors behind diet failures).A long standing debate in the world of obesity research revolves around the idea that bodyweight (or perhaps body fat) is regulated. What does that mean exactly?Think about your thermostat (yes, this is the example I always use): you set it to keep the house at 80 degrees and it continually senses the temperature (via a thermometer). If the temperature goes above 80 degrees, the air conditioning comes on; if it drops below 80, the heat comes on. This is a regulated system. Your cruise control in the car works the same way: you set the speed you want to maintain and it either gives more or less gas to the engine in an attempt to maintain that level.For some 50 odd years, it’s been thought that bodyweight/body fat are regulated similarly; that is the body is attempting to maintain some set level (called the set point) and is adjusting things like appetite, behavior, movement, etc. to do so.A great deal of animal research supports this model: starve a rat and its metabolic rate slows, it moves around less (conserving energy), it’s appetite goes up such that when you give it free access to food again it will eat until it reaches its starting weight at which point things go back to normal. The same occurs when you fatten it up, metabolic rate goes up, activity goes up, appetite/hunger go down and it rapidly returns to its starting weight when you stop force feeding it. The rat is, somehow, trying to maintain weight at a set level.Quick note: and this ties into that research review I did on homeostatic vs. hedonic pathways a few weeks back: exposed to certain types of diets (in rat lingo, this is called a cafeteria diet and consists of calorically dense tasty foods), most rats will readily maintain a weight that is above their set point (when exposed to a more typical rat diet). That is, the tastiness of the food can overcome any homeostatic attempts to prevent weight gain. This is important and something I’ll come back to later in this series.Some research has found a similar effect in humans although the studies tend to be very mixed on this (I’ll address why in a later blog post): when you diet down a human being, often you see metabolic rate decreasing far more than you’d expect based on the loss of body weight alone. That is, based on the weight loss, say you expected metabolic rate to drop by 200 calories; but when you measure it it really drops by 300. That extra 100 calories is more than predicted and suggests that the body is ‘adapting’ to the weight loss in an attempt to not only slow further fat loss but also to get bodyweight/body fat back up when food becomes available again.There are other adaptations, folks often decrease their activity levels (conserving energy), fat burning goes down and fat storage goes up, appetite often goes up so that people eat more when food is made available. In common parlance, this is often referred to as the ‘starvation response’ and, yes, there is something to it. Unfortunately, it’s basically the price that has to be paid for losing body fat to any significant level. People talk constantly about avoiding the starvation response and things of that nature but the only way to avoid it completely is to never lose fat.In any case, perhaps the classic study in this regards is the Minnesota semi-starvation study, a 6 month study undertaken during the mid 20th century where a number of lean male war objectors were placed on 50% of their maintenance calories for the entire time while forced to engage in quite a bit of daily activity (5-6 miles walking per day).In that study, after reaching the lower limits of human body fat levels (about 5%) and showing a host of adaptations (including an obsession with food), the men showed
uncontrolled hunger when food was made available and rapidly ate themselves back up beyond their initial body fat level.This has been termed post-starvation hyperphagia (a technical word that means overeating). Of course, it’s crucial to realize just how lean these men got; the response to less severe diets or fat loss is exactly that: less severe. A lot of this also depends on the nature of the intervention (e.g. type of diet) and the population studied. Initial body fat percentage plays a huge role here for reasons you’ll learn about in future blog posts.Unlike in rats however, in humans, overfeeding doesn’t have nearly as reliable an impact in terms of increasing metabolic rate and it looks increasingly like any bodyweight regulation system present in humans is assymetrical: that is it protects against weight loss far more so than it protects against weight gain.Put a bit differently and most realize this on some level: for most it’s far harder to lose weight than it is to gain it.The reasons for this are a bit obscure but it’s thought that since humans never had any real evolutionary pressure to not get fat (e.g. we had no real predators and, during evolution, few could have gotten or stayed fat for extended periods), the body never had to develop defenses against weight gain. In contrast, starving to death was a very real reality in our evolutionary past and the body developed a number of ways of ‘defending’ against weight loss.Moved into modern times (where food is readily available and activity levels continue to drop), this is a bad bad thing.For completeness, I should note that there are exceptions, some people appear to show a pronounced response to overfeeding which is now being called NEAT (non-exercise activity thermogenesis) or SPA (spontaneous physical activity); some folks ramp these up to high levels when subjected to increased caloric intakes, burning off the excess calories instead of storing them as fat.These are the people for whom gaining weight is often difficult: invariably when they try to increase food intake, not only do they sub-conciously start moving around more (burning off the excess calories), their hunger shuts off. You probably had one of these guys in your high school, the one who was always fidgeting and bouncing his leg and all of that; it turns out that the caloric expenditure from that type of activity adds up significantly over a day.Hunger also seems to shut off more rapidly in these folks as well. They are often the folks who also claim “I eat a ton and can’t gain weight” but when you look at their food intake, they either aren’t eating much at all or they eat a single big meal and get so full that they don’t eat much else for the rest of the day (or next day).Unfortunately, NEAT seems to be quite genetic and researchers still haven’t really figured out the exact causes or if this can be applied to help in any practical way. It probably has to do with not only the various hormones involved in all of this (which I’ll discuss in a later blog post) but how the brain responds to them.In any case, all of the above supports the basic idea of a set point in humans: human metabolic rate, etc. clearly adapts (and does so more than weight loss alone would predict) to caloric restriction and weight/fat loss.Unfortunately, it doesn’t appear to adapt nearly as well to overfeeding and weight gain.Even more unfortunately, this isn’t the end of the story and determining exactly what sets the setpoint or whether or not it can change in the long-term is an area of continuing debate. Most of what I’ve seen suggests that, if setpoint can change, it only goes up. I’ve

seen nothing to suggest that it ever comes back down, even over years of maintaining a lowered body weight.Additionally, not everyone agrees with the idea of a biological setpoint anyhow, some researchers feel that a settling point is a better description of what’s going on.Stay tuned for Part 2.
Source: Lyle McDonald http://www.bodyrecomposition.com/fat-loss/set-points-settling-points-and-bodyweight-regulation-part-1.html
INTERMITTENT FASTING AND STUBBORN BODY FAT
1:28 PM | Posted by Martin BerkhanI have previously hinted that intermittent fasting sidesteps the issues associated with stubborn body fat. Indeed I rarely find any need for advanced strategies to rid my clients of stubborn body fat. I will soon tell you why, but first let me give you some background information to what I'm talking about here.
What is stubborn body fat?
Stubborn body fat refers to areas of the body that hold on to fat the longest. Generally speaking, these areas include the lower abs and lower back in men, and the lower body in women. These areas are damn hard to get lean.
How come these areas are stubborn in the first place? To understand this, let's look at how fat is mobilized (the very short version).
After you eat, insulin and fatty acids are elevated. You are in the fed state and there's zero fat burning going on. Your body is relying completely on glucose oxidation during the hours following the meal.
One way of measuring this is via the respiratory quotient (RQ). An RQ of 1.0 denotes pure carbohydrate metabolism ("storage mode"), while 0.7 denotes pure fat metabolism. To put this into perspective, consider that RQ is 0.95-1.0 for about 1.5-2 hours after a meal, 0.82-0.85 after overnight fasting and 0.72-0.8 after 16 hours of fasting.
As the hours go by and the nutrients from the meal are done being absorbed, RQ drops in conjunction with insulin. There's a shift towards fat burning and mobilization of stored fat. This process is mediated by insulin and blood-borne fatty acids; when levels drop, an energy deficit is "sensed" and catecholamines (adrenaline and nordrenaline) increase.
The catecholamines travel through the blood and bind to receptors on fat cells. A receptor can be thought of as a "lock." Hormones and neurotransmitters are keys that fit into that lock and make something happen. In this case catecholamines trigger fat mobilization by activating hormone sensitive lipase (HSL), which then shuttles the fat out of the cell to be burned off.
Now here's the critical difference between regular fat and stubborn fat: regular fat have a lot of beta-2 receptors in proportion to alpha-2 receptors.
In The Stubborn Fat Solution Lyle McDonald used the analogy of b2-receptors being "accelerators" for fat loss and a2-receptors acting as "breaks" for fat loss. That's the easiest way to think of them without getting too deep into the physiology.
The ratio between b2-receptors and a2-receptors determines how easy it is to facilitate fat loss from one region of the body. "Easy" fat has a high ratio of b2-receptors to a2-receptors, while stubborn fat has a high ratio of a2-receptors to b2-receptors.
One notorious example that Lyle brings up in his book is that women have up to nine times (!) as many a2-receptors as b2-receptors in their hip and thigh fat. Though I can't recall if similar numbers are available for lower ab and lower back fat for men, you can be sure that the a2-receptors outnumber the b2-receptors in these areas as well.
I rarely use fancy strategies for ridding my clients of stubborn body fat. They never need it. It's more or less a linear process all the way down to the shredded state.
Intermittent fasting and stubborn fat loss
How can intermittent fasting then selectively target stubborn body fat more effectively than other diets? Well, to target stubborn body fat we need to activate b2-receptors while deactivating a2-receptors. Intermittent fasting achieves this by the following mechanisms.
1. Fasting increases catecholamine levels.
2. Fasting increases abdominal subcutaneous blood flow, which means that catecholamines will have an easier time reaching those hard-to-get areas.
3. The low insulin level reached during the fast inhibits a2-receptors. A greater time spent in the low insulin state equals a greater time spent in a state where fat can be mobilized from stubborn areas. Now you're probably thinking "why not just go on a low carb diet" to keep insulin low, but keep in mind that triglycerides inhibit HSL in a similar manner as insulin.
4. My research has indicated that the ideal state of fat burning is reached after 12-18 hours of fasting. Coupled with high levels of catecholamines, increased blood flow to stubborn regions, and low insulin for a2-receptor inhibition, this time interval is the "golden age" of stubborn fat mobilization.
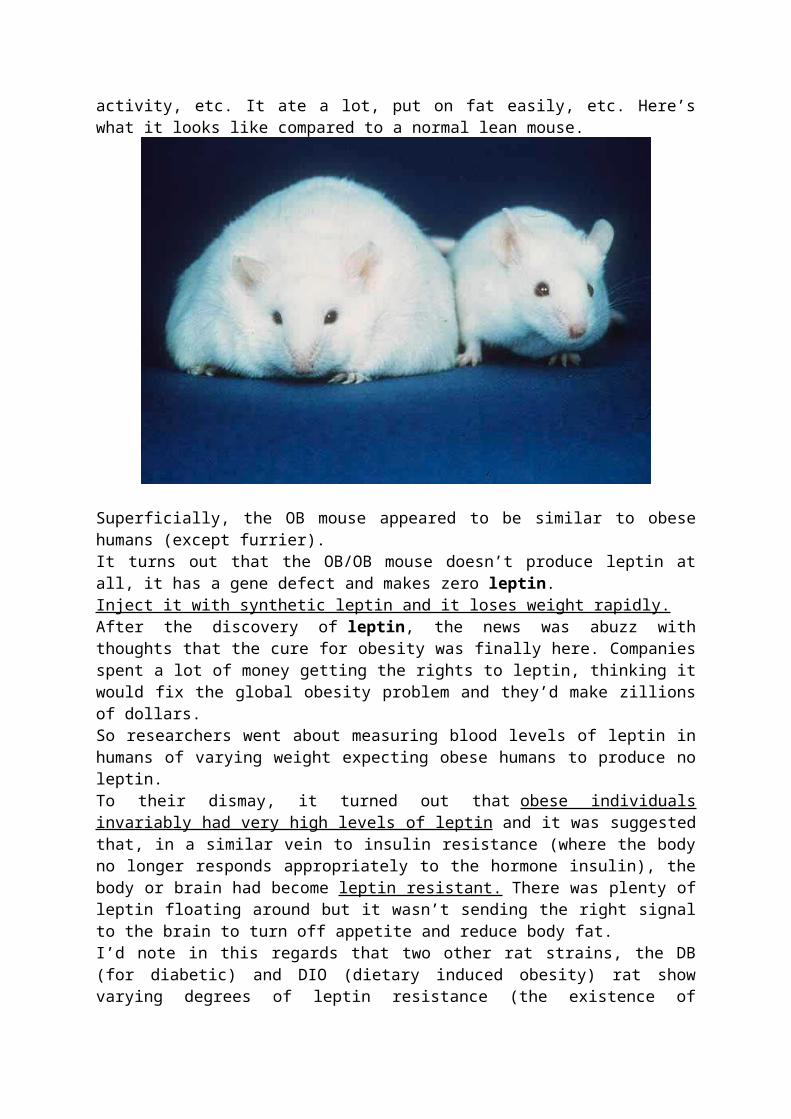
Let me just explain real quick what I mean by the ideal state of fat burning. Studies have examined free fatty acid (FFA) oxidation from anywhere between the overnight fasted state to three days of fasting. While FFA oxidation increases the longer time you spend in the fasted state, the contribution of fatty acids to whole body fat oxidation changes.
In short-term fasting there's a significant increase in subcutaneous FFA oxidation. That's just a fancy way of saying that you're mainly burning body fat and nothing else. For up to 14-20 hours* after a 600-calorie meal in normal-weight subjects, fat is only mobilized from body fat stores in resting individuals.
* 14-20 hours in a completely sedentary state should easily equal 12-18 hours in real life.
Past this time point, fat burning increases further. That goes without saying. But it's not necessarily the type of fat you're after that you'll be burning. Somewhere in between the 10- and 30-hour time point, the oxidation of intramuscular fat increases greatly, but no increase is seen in subcutaneous fat. Subcutaneous fat simply can't keep up with demand, so you're playing a game of diminishing returns if you push the fast too long. Coupled with the escalating rate of de novo gluconeogenesis, and subsequent risk of muscle catabolism, fasting for too long may not be very conducive for a lean individual seeking optimal lean mass retention while targeting stubborn body fat.
Men usually need to hit single-digit body fat percentage to have good abs, while women have good abdominal definition at around 15% body fat. Above is a picture of natural body fitness champ and intermittent fasting afficionadoKristine Weber.
Science vs real life
One obvious question critically inclined readers should ask themselves is whether special
strategies to mobilize stubborn fat is even needed in the first place. After all, people have gotten ripped without intermittent fasting or the strategies laid out in The Stubborn Fat Solution by Lyle McDonald. Is it not just a question of dropping low enough in body fat percentage?
If we compare a traditional calorie deficit of 3500 kcal per week on a conservative diet vs 3500 kcal on an intermittent fasting setup (or with The Stubborn Fat Solution), would there be any difference in regional fat loss assuming all other factors were kept constant? I don't think we'll ever know, so this boils down to relying on theory and practical experience.
My personal experience is that intermittent fasting helps with stubborn fat loss compared to a conservative diet. This little anecdote is obviously riddled with confounders, and maybe even wishful thinking, but if you take a look at some pictures from my younger days (and here), you'll see that I was quite lean during the modelling days. However, I still had some fat covering the lower ab region and never really seemed to lean out well no matter how hard I tried. Sure, I would lose weight when I cut calories, but not from the right areas. I always ended up getting extremely lean legs, arms and shoulders. I also lost a lot of muscle in my desperate attempts to get good abs, but that might just boil down to me dieting like a retard. As you can see in some more recent pics, I don't have those types of problems any more.
Adding to this anecdotal evidence of mine, I have heard similar feedback from clients and blog readers. Intermittent fasting seems very conducive for targeting stubborn body fat. Got a similar experience to report? Let me know.
Content update, June 20th
When is stubborn body fat a problem?
There were a few things that I forgot to cover when I first finished this article. First of all, at what level does stubborn body fat become an issue? Generally speaking, people don't have a good sense of what is "just too fat" and what is a legit body fat percentage for stubborn fat to even start becoming an issue. I've had tons of clients approach me with their "issues with stubborn body fat" when they we're 15% body fat or more.
Stubborn fat is the fat you need to lose for a good four-and-a-half-pack to turn into a six-pack. If I had to put a number on it, I'd say 10% is the maximum body fat percentage you need to have reached before this is something you can start concerning yourself with.
Below are a few examples of the level of leanness required to even start thinking about stubborn body fat.
Both of these clients were approximately 10% and the marked areas denote those typically stubborn fat deposits. Note that both of them were quite lean and had good abdominal definition from the navel up. The stubborn fat is located at around the navel and below.
With females the whole lower body is "stubborn." Above is a good example of the different fat pattern seen in men and women. Note the lean midsection and lower back. At the same time the lower body appears quite smooth. If she would have dropped a few more percentage points of body fat, she would have had very visible abs - but her lower body would likely not have gotten much leaner. Even female body fitness competitors rarely come in to stage with "ripped" legs.
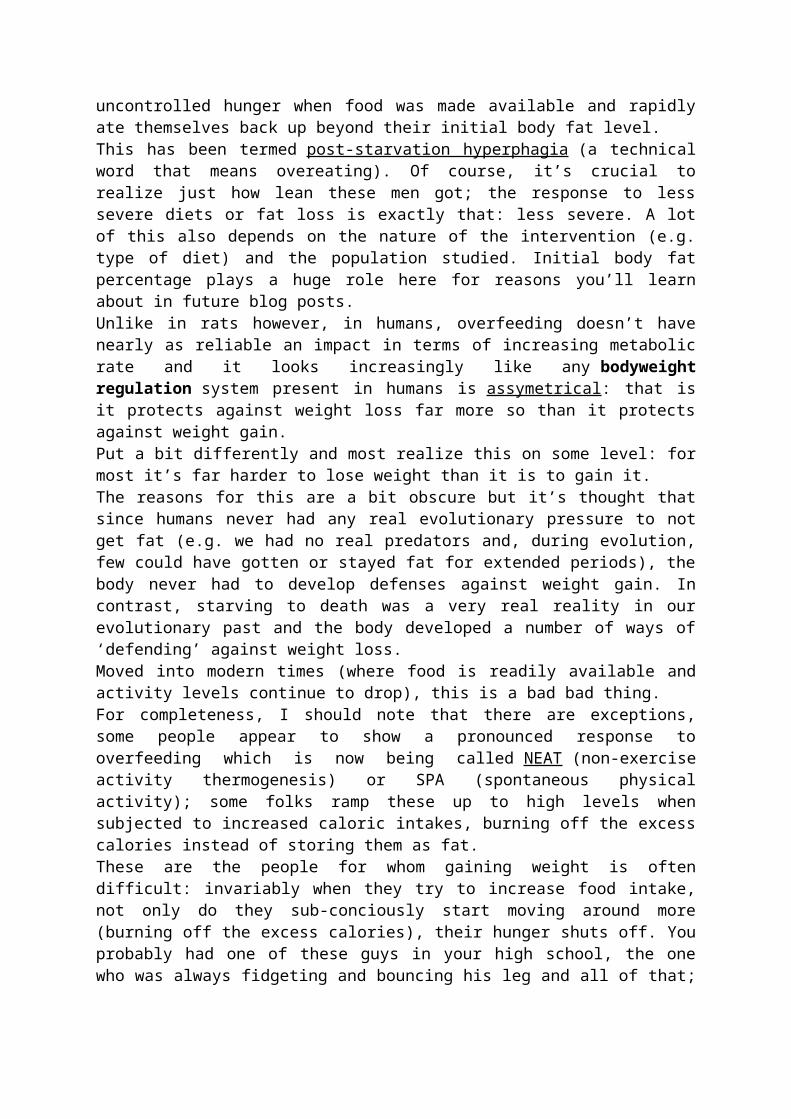
Stubborn Fat Strategies
Here are a few strategies that you should consider implementing to target stubborn fat. Keep in mind that your diet needs to be in order first and foremost. You can't throw this into the mix and expect results if your diet is sub par.
1. Intermittent fasting. For the reasons I mentioned earlier.
2. Increase your activity level in the fasted state. Add cardio or whatever else to get your energy expenditure up. A personal favorite of mine is lower intensity and longer duration activities like walking in the 12-16 hour time interval of the fast. Not only is this the "golden age" of subcutaneous fat oxidation, but lower intensity activities selectively use fatty acids to fuel the activity. There are other reasons I favor low intensity over high intensity activities (such as HIIT). They interfere minimally with your performance in the gym and can be done on a daily basis, which is not the case with HIIT.
3. Supplementation. While I have gotten lean without thermogenics and alpha-2 receptor antagonists, such as yohimbine, they can speed up the process.
For starters: Caffeine is a dirt cheap thermogenic that will ramp up catecholamine levels. During the fast add caffeine pills and dose depending on tolerance. If you're not a regular coffee-drinker, you can get pretty wired off 200 mg. If you're a habitual coffee-drinker (like me), it might take up to 600 mg to even get an effect. L-Tyrosine may work synergistically with caffeine so you may consider experimenting with that as well. Personally though, I have never gotten much out of it - though many people swear by it.
For more ambitious supplementation, add the alpha-2 antagonist yohimbine or a supplement containing yohimbine in addition to caffeine pills. Take the equivalent of 0.2 mg/kg body weight shortly before fasted cardio or during the fast. This works out to 16 mg yohimbine for an 80 kg/175 lbs male if you have pure yohimbine hcl.Other commercial thermogenics, such as Meltdown, contain 3 mg yohimbine per capsule; so you'd have to take up to 5 capsules to reach similar levels. But proceed with caution:the product says, "Never exceed more than three total capsules daily or in a single dose." Personally, I haven't noticed anything out of the ordinary with such dosing (>3 capsules), but I need to throw in a disclaimer here lest someone screws himself over. It would be best to start low to assess tolerance. Meltdown contains quite a few other ingredients that might make the effects stronger and more unpredictable versus straight yohimbine hcl (i.e., 5 capsules of Meltdown might be more potent than 15 mg of Y-HCL in terms of stimulatory effect and perhaps side effects).
Important: Keep in mind that insulin negates the effects of yohimbine on alpha 2-receptor inhibition. Always take it in the fasted state and never between meals. Considering the half-life of yohimbine is very short (30 min), you can also experiment with more frequent dosing during the fast. For example, three dosages taken every second hour until your first meal. In that case I would probably not recommend starting with 0.2 mg/kg, since there will be a gradual buildup of the active compound. 0.15 mg/kg is a better starting point for multiple
dosages in a relatively short time frame (every second hour).
An 80 kg male could use the following schedule.
7 AM: 12 mg yohimbine.
9 AM: 12 mg yohimbine.
9 AM-10 AM: 45 to 60 min walk.
11 AM: 12 mg yohimbine.
1 PM: Meal one.
Another option: AlphaBurn. Pure yohimbine may lead to feelings of anxiety and even panic attacks in predisposed individuals. A better alternative can be found in Alpha Burn, and other supplements containing rauwolscine, which is a stereoisomer of yohimbine. Reg from Predator Nutrition recently sent me a box of these and I can vouch for it's psychoactive effects not being as rough as pure yohimbine. While it won't make you as jumpy and jittery as yohimbine, it seems to have a pretty potent appetite suppressive effect. If you consider buying this, see mysupplement guide to obtain a code, exclusive to Leangains readers, that gets you 5% off any order from Predator Nutrition.
4. Fasted Weight Training. Heavy weight training jacks up catecholamines very high and heavy training in the fasted state creates the most powerful response. Heavy training and fasting are both stressors to which the body responds with increased catecholamine output; in combination it seems the effect is synergistic. How can we combine everything mentioned up to this point and heavy weight training to facilitate stubborn fat loss? Like I've said in the past, I'm not a fan of using weight training as a means to create a calorie deficit. I also do not recommend training completely fasted, since that would be highly counterproductive to the anabolic response. But I've found a way around all this.
Protocol needed: Fasted Training (see the Leangains Guide for details).
We're going to assume that you're at the gym at 10 AM and break your fast at 12-1 PM.
10 AM: Training is initiated on an empty stomach and after ingestion of 10 g BCAA or similar amino acid mixture. This "pre-workout" meal is not counted towards the feeding phase.
10-11 AM: Weight Training: I suggest using a setup similar to reverse pyramid training, which is my favored approach. This is a high intensity, low volume setup. Keeping intensity high is key in order to reap the catecholamine-related benefits. Do 2-3 sets of 4-8 reps for compound movements and 1-2 sets of 8-10 reps for assistance movements (curls, triceps work, etc). Do no more than 5 movements per session.
11-12 AM: When you're done, which should be in no more than an hour, insulin (which was temporarily elevated by the pre-workout BCAAs) will be back to fasted baseline again.
Immediately take 0.2 mg yohimbine and do 30-45 min of steady state cardio; cycling, treadmill walking at 3-3.5 mph (slight incline optional), brisk walking outside, etc. The yohimbine will rapidly take effect.
12-1 PM: Eat.
5. Carb refeeds. Refeeding on high carb meals, with a low fat content, will boost leptin and kick up hormonal output and metabolic rate a notch. It may sound counter intuitive for those not familiar with this concept, but it may in fact be just what you need to get past a fat loss plateau, or to see fat loss in stubborn areas. Much can be written about this, but Mark Sisson recently wrote an easy layman's guide to carb refeeds that you might want to check out if you need a quick summary of the benefits.
For a more thorough explanation of refeeds and leptin, I urge you to check out Lyle McDonald's excellent series onbody weight regulation. There's plenty more on this topic on Lyle's site; just do a search for "refeeds", or "refeeding", and you'll be busy for hours.
If you follow my approach, as I've laid out in the Leangains Guide, you will refeed after every weight training-session.
Keep it simple
As a final note, keep in mind that none of the above mentioned strategies are essential in order to get to your desired level of leanness, assuming that entails a ripped six-pack. I've gotten myself and several clients very lean without supplementation, cardio, and with fed state training.
In the end, getting rid of stubborn fat comes down to patience. There's no "quick fix" solution. Only various strategies that may present some hard-to-define benefits in theory.
When determining what strategies you can use (and this goes for any diet), first look at what you can implement into your daily routine with a minimum of added effort. Don't go out of your way to find advanced strategies that increase the perceived challenge of your diet. That's always a recipe for failure in the long term.
Source: http://www.leangains.com/2010/06/intermittent-fasting-and-stubborn-body.html
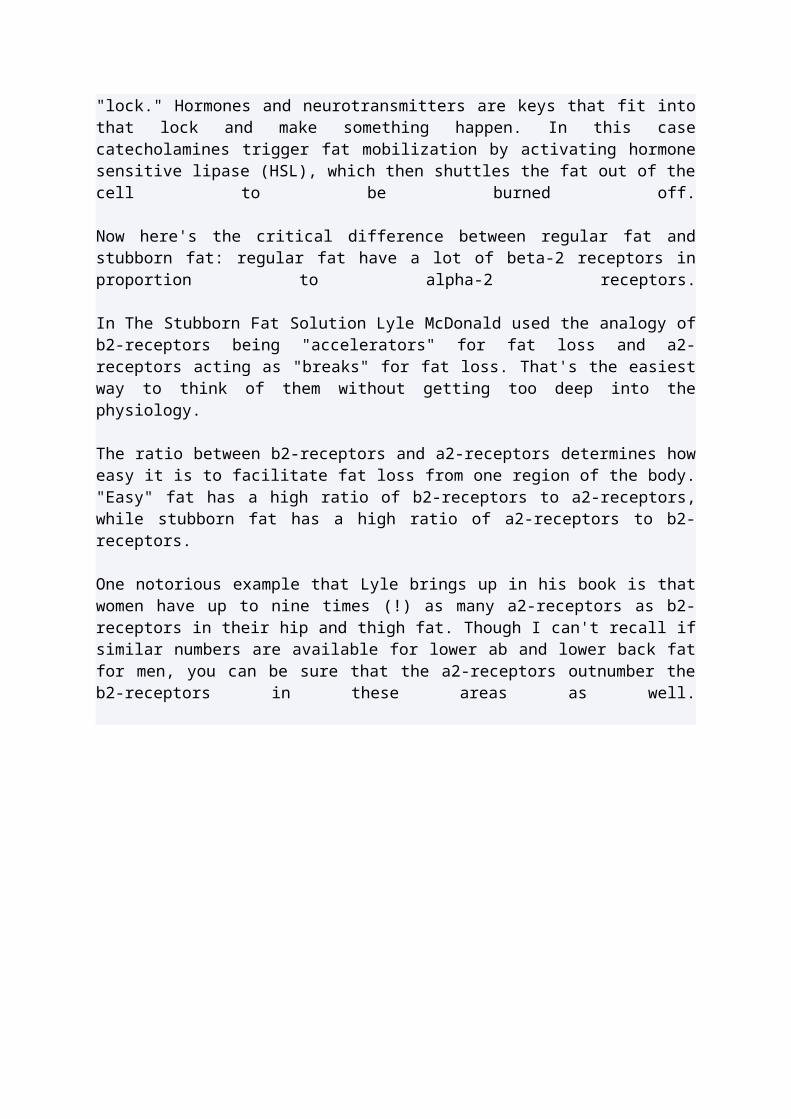
What’s the Deal with Intermittent Fasting (IF) vs Leptin Resistance?
Published June 11, 2011 | By Steve
I posted this first on Jimmy Moore’s forum -
I noticed something very interesting in the “Why is Oprah still obese? Leptin part 3…” article, quoted and linked below.
I’m wondering if this could help us settle the IF debate a little bit. I have been critical of IF proponents because I think they think it’s the perfect fix for everyone, and none of them (pretty much) ever heard of reverse T3, which to me is a warning sign that they are a bunch of amateurs. Plus the ones that are the most passionate about it always seem to be running photos of their chests and not their faces, you know, “look at my muscles” types.
…Oprah can become equal to them if she has somebody explain this to her. Dr Oz certainly has not for over decade! Her goal is to focus on becoming leptin sensitive by being required by eating 50 grams of protein at breakfast everyday within 30 minutes of rising, eliminating all snacking especially past 730 PM, eating three meals a day, and limiting her carb intake below fifty grams per day for about 6-8 weeks. In my practice, over the last 5 years that is about the bell curve I have seen for most patients to require their regain their signaling back. I check leptin sensitivity by asking a few questions or by ordering a reverse T3 level… Source-
Above is Dr Kruse’s recommendation to Oprah to get past leptin resistance. Note that it has protein first thing in the morning, and 3 meals a day. [and at last, someone that knows something about reverse T3]
This is not IF obviously. IF proponents seem to think that IF fixes everything, all the time, for everyone, and if you disagree, something is wrong with you.
If I am reading Dr Kruse’s blog right, what I see is steps to overcome leptin resistance that one should do before one begins to IF.
Despite what a lot of people think, I’m really not an anti-IF campaigner. I’m just not happy with how sloppy the proponents are and would like to pinpoint WHEN it is advisable, as well as what interval and frequency.
…………
I got a copy of Mastering Leptin, by Byron J. Richards and Mary Guignon Richards, and it pretty much agrees. The book talks a lot about how leptin is the way your fat cells communicate with your brain, and how when this goes wrong, it’s like your brain gets a “famine” signal by mistake. Sounds like the reverse T3 (rT3) issue from the previous blog post on IF, but not exactly.
Causing a Problem vs Not Solving a Problem-
Since hardly anyone talks about rT3 or tests for it, the fact the Dr Kruse uses the rT3 test to check for leptin resistance got my attention. The Mastering Leptin book talks about this too. Starving yourself repeatedly will cause rT3 to go up and shut down your metabolism, and similarly, leptin resistance, which is when your brain “thinks” you are in famine mode, does
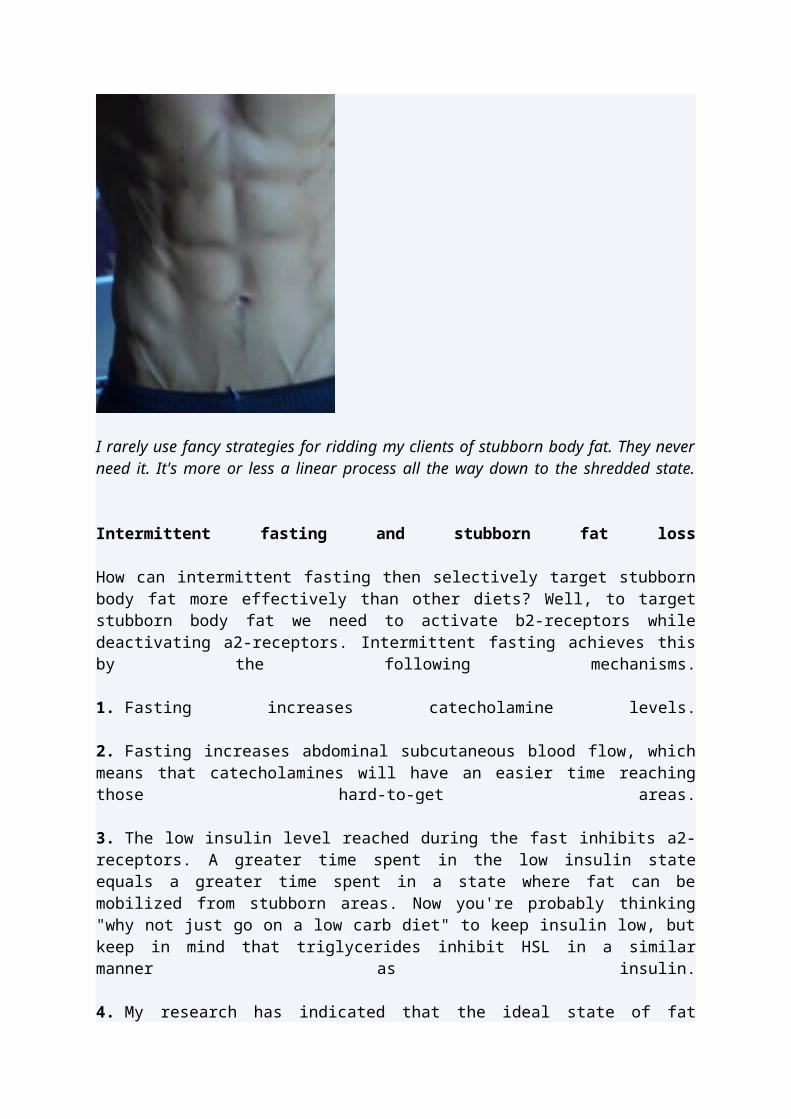
it too. The latter is an example of rT3 going up not because you starved yourself, your brain just thinks it did.
Note that the recommended dietary approach for this is NOT IF. Before I was concerned that overuse of IF might cause the rT3, but both Kruse and Richards and Richards are writing about rT3 already being high, and IF is not the fix. Instead, they say eat your breakfast, eat 3 meals, and don’t snack. This is aka “The Leptin Diet.” You do this to help get your leptin situation back in line.
“IF is a terrible idea if youre leptin resistant.”
In the above discussion on Moore’s forum, Dr Kruse writes-
IF is a terrible idea if youre leptin resistant. When youre sensitive it is perfectly fine. If you IF too early you can increase cell death via autophagy. Not good.
How do you know if this applies to you? Simple answer, if you have been trying to lose weight and its not working, you are sick of hearing people tell you “do this/do that” when you have learned from experience that it doesn’t work for you, if exercise just makes you tired and even gain, you probably are leptin resistant. The last thing you need at this point is more bad advice, like some nimrod telling you to skip meals because “it works for me, so….”
What is Leptin anyway?
This could get long. It’s a topic that deserves a lot more attention, which I will save for later.
Short version – Leptin is a hormone that was only discovered in 1994. Leptin is how your fat cells communicate with your brain, to tell your brain how well energy is stored. Your brain doesn’t get to literally look in a mirror or read a scale. This is what leptin is for.
Some of the popular blogs and forums just say that leptin signals your brain when you are ready to stop eating during a meal, but this is only part of the answer. Leptin is part of a continual feedback between your fat tissue and brain all the time, and it ties into the rest of your endocrine system too, all the time.
Leptin resistance is a term to describe when this signaling goes wrong, and your body wants to store more than it needs. Dr Kruse’s answer to when you have it is simple, he says “Just look in the mirror.”
Since the discovery is relatively new, it hasn’t worked it’s way into practice, books and the public eye. Some of what people say about it is incomplete, and off the subject (it’s more than just a signal to stop eating at mealtime).
SOURCE: http://dietforhumans.com/2011/06/11/whats-the-deal-with-intermittent-fasting-if-vs-leptin-resistance/
How to Adopt an Intermittent Fasting DietIntermittent fasting (also known as, "IF") is the practice of periodically going without food for a period of time, typically on the order of 20-30 hours. By choosing one of the many regimes out there, or planning your own, you may experience mental, physical, and lifespan benefits.Ads by Google5 Foods you must not eat: Cut down a bit of stomach fat every day by never eating these 5 foods.Trimdownclub.com
Steps
Tips and Warnings
1. 1Set your goal. Determine whether fasting is the right tool to help you achieve it. This will give you added mental strength to continue fasting, should you need it. Some goals for which IF is well suited include:
o Reducing time spent eating, as you will eat a reduced number of larger meals.o Extending lifetime, though the mechanism is poorly understood and may not apply
to humans.o Losing body fat.o Increasing (nor)epinephrine levels, enhancing focus and alertness.o Increasing growth hormone levels, raising bone, organ, and muscle mass.o Increasing autophagy and associated immune functions, helping you fight off
infections and the like.
2. 2Decide when you will have your last meal of this eating period. Some people like to choose whether to eat or not on a day-to-day basis, but those who like more order in their lives may set up a schedule, such as "I will fast every other day" or "I'm not eating on Monday or Thursday".
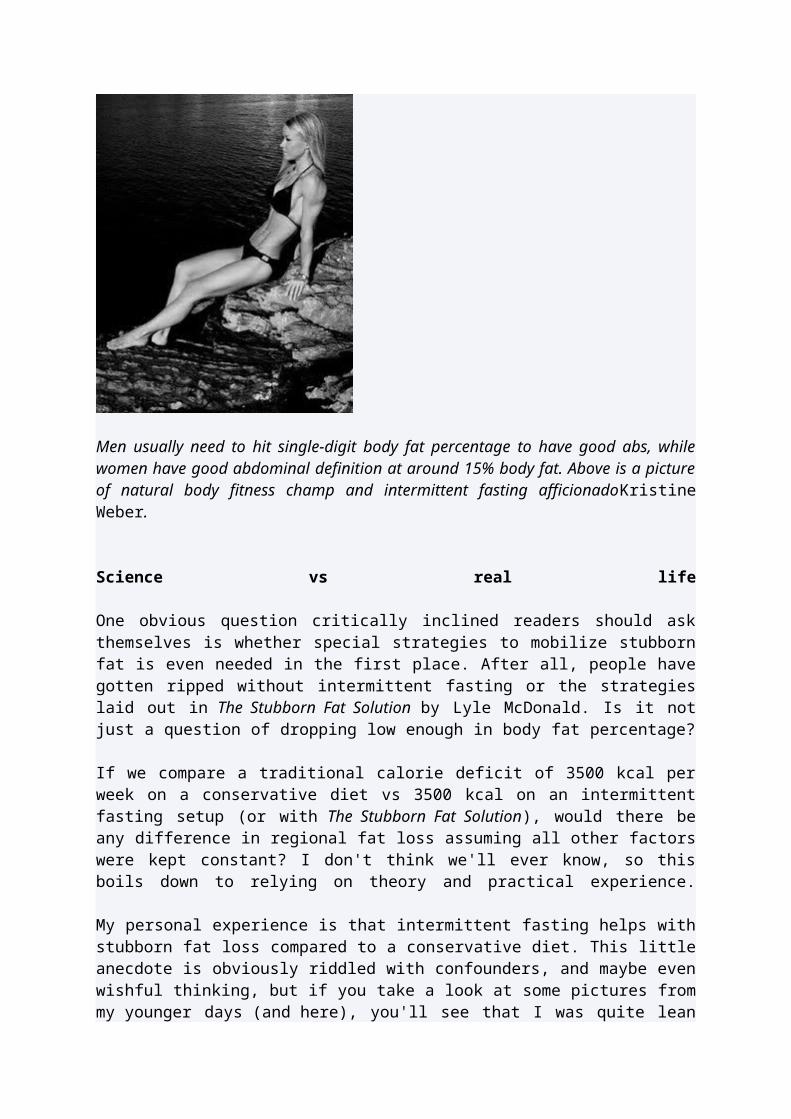
3. 3Eat your last meal. Some people binge a little bit, though this means that you will spend more time digesting your food and less time in the "fasting adapted" phase of your food-abstinent period.
4. 4Wait. The benefit of the fast comes primarily from caloric and carbohydrate restriction. Water is absolutely fine, so you may consume as much as you want, and a snack of a couple hundred calories of protein or fat will not massively impact the effectiveness of the exercise.
5. 5Resume eating. Again, no special preparation is required.
6. 6Repeat 2-6 for as long as you want.
Tips
Some popular fasting time-lines:o "Warrior diet": One meal per day; essentially a 1 hour eating window, 23 hour fast.
Some practitioners use a schedule which more closely resembles a 4 hour eating window and a 20 hour fast instead.
o "Eat-stop-eat": One 24 hour fast every two days or so, timed so as to be minimally intrusive to your social eating habits.
o "Every other day": Abstaining from food during the entirety of a calendar day, plus any time that elapses between dinner of the previous eating day and the breakfast of the next. For most people, this is roughly a 33 hour fast with a 15 hour eating window.
o
SOURCE: http://m.wikihow.com/Adopt-an-Intermittent-Fasting-Diet

Intermittent Fasting
Alternate day fasting, the latest diet by James Johnson, has hit the weight loss world, but can intermittent fasting really help you to shift those pounds – and keep them off? Dietitian Juliette Kellow BSc RD investigates
Alternate Day Fasting Diet
By Dietitian, Juliette Kellow BSc RD
When it comes to losing weight, the idea of dieting only every other day may seem like an attractive one. After all, knowing we can indulge in our favourites ‘tomorrow’ may make dieting seem more bearable.
But as is always the case with anything that sounds too good to be true, there’s a downside – and in this case, it’s eating very little on the days in between. Nevertheless, some scientists believe that alternate day fasting doesn’t just help us lose weight. It may also make us healthier, reducing our risk of health problems such as heart disease and cancer, and easing the symptoms of conditions such as asthma. Supporters of this fasting diet even say it can help us live longer.
One of the most popular diet books based on the idea of intermittent feasting and fasting is The Alternate-Day Diet, written by plastic surgeon Dr James Johnson. Here’s the lowdown…
What is The Alternate-Day Diet?
In a nutshell, this diet involves alternate day fasting, eating very little on one day followed by eating what you’d normally have the next day.
Isn’t that just another way to reduce calories overall?
It certainly is. But some experts believe that eating like this will make you healthier and help you live longer – as well as shifting those pounds.WLR can help you to choose a healthy diet which doesn’t involve fasting or deprivation. Use your WLR Food Diary to see how many calories are in foods and make sensible choices to help your weight loss. Try it free for 24 hours.

What’s the theory of intermittent fasting?
The idea that restricting our calories makes us healthier and increases our life expectancy has been around for decades and forms the basis for a book called The Longevity Diet by Brian Delaney and Lisa Walford. As far back as the 1930’s, an American scientist found that drastically reducing the calories fed to mice helped them to live longer and be healthier. In more recent times, the same thing has been shown in a variety of life forms including fruit flies, roundworms and monkeys.
The idea of severely restricting calories every other day – rather than every day – to improve health and life expectancy came in 2003 following laboratory research carried out at the National Institute on Ageing in America.After 20 weeks, mice who were allowed to eat as much as they wanted on one day but not fed the next day, lived longer and had lower levels of glucose and insulin and improved insulin sensitivity compared to mice that were allowed to eat freely all of the time. But more importantly, these levels matched or were even better than those of mice who ate 40 percent fewer calories than normal every day. The scientists involved in the study concluded that alternate day fasting was just as likely to improve health and life expectancy as a daily calorie restriction.
Is there any evidence that the same thing happens in humans?
To date, most research has been carried out in laboratories with animals. There aren’t many human studies that have looked at the link between restricting calories and life expectancy – and even fewer that specifically look at the impact of alternate day fasting on health and longevity. Those human studies that have been carried out have generally had several limitations – namely that they include only a few participants and have only been carried out over a short period of time. It’s an area that needs a lot more research before any definite conclusions can be drawn.
So what’s the link with weight loss?Unsurprisingly, restricting calories – whether it’s all of the time or fasting every other day – usually results in weight loss. The concept of an eating pattern that alternates between periods of fasting followed by periods of eating is sometimes known as Intermittent Fasting. When this pattern follows a 24-hour fast followed by a 24-hour feast, it’s sometimes called Alternate Day Fasting.
One small human study published in the American Journal of Clinical Nutritionhas shown how alternate day fasting can aid weight loss. In this study, 16 normal weight adults followed an alternate day fasting regime for three weeks. On fasting days they had nothing but calorie-free drinks whilst on feasting days they were allowed to eat whatever they wanted. At the end of the study, the adults had:
Lost an average of 2.5 percent of their initial body weight
Lost four percent of their fat mass
This indicates that they didn’t consume two days worth of calories on feasting days to make up for the lack of calories on the day of fasting.
However, most participants felt extremely hungry throughout the study and said they couldn’t sustain this type of eating pattern for long. The scientists behind the study suggested that allowing one small meal on a fasting day might make the diet more acceptable. And that’s exactly what the Alternate-Day Diet is based on. Rather than totally fasting on alternate days, the idea is to severely restrict calories to 20 percent – or just one fifth – of your normal calorie intake.
So how do I follow the Alternate Day Fasting diet?
On the first day of the diet, you have just one fifth of you normal calorie intake that keeps your weight steady. As a guideline, women need around 2,000 calories a day, and men 2,500 calories a day for weight maintenance. This means on a ‘fasting’ day – when you are allowed just one fifth of this – women should have 400 calories and men, 500 calories. However, the heavier you are, the more calories you need just to keep your weight steady.You can get a more accurate picture of how many calories you need for weight maintenance by entering your weight, height and sex into the personal information on Weight Loss Resources database. Then divide this figure by five to calculate the amount of calories you should have on a ‘fasting’ day.To make it easier to stick to such a low calorie intake on fasting days, the Alternate-Day Diet recommends sipping ready-made meal replacementshakes that add up to your ‘fasting’ daily calorie allowance. These have the advantage of being fortified with nutrients and help to remove the temptation to overeat. On the second day of the diet, you simply eat what you would normally eat. Then on day three, you do the same as on day one – and so on.After two weeks on this regime, you should start eating food rather than meal replacement products on ‘fasting’ days. Ideally, you should stick to 20 percent of your usual calorie intake. However, if you find this too restrictive it’s acceptable to increase to 25-35 percent of your usual intake. For women that’s around 500-700 calories a day (based on a usual intake of 2,000 calories); for men it’s 625-875 calories a day (based on a usual intake of 2,500 calories).
How much weight loss can I expect?
The author of the Alternate-Day Diet lost 35lb in 11 weeks – an average of around 3lb a week. However, on average, you can expect to lose around 1-2lb a week, with perhaps a few extra pounds in the first week as your body adapts. This is highlighted by a small study of 12 obese women and four obese men, who, after following a similar intermittent fasting diet, showed:
An average weight loss of 12lb after eight weeks, equating to 1.5lb a week
A drop in body fat from 45 to 42 percent in participants
A reduction in blood pressure, total cholesterol and LDL (or ‘bad’) cholesterol.
How often should I weigh myself?
Only weigh yourself at 6 or 8-day intervals, preferably in the morning after a fast day. This is because you can see a variation of as much as 3-4lb between a feast and fast day.
So is weight loss purely down to an overall calorie reduction?
According to the author of the Alternate-Day Diet this isn’t the case. Certainly, a total calorie reduction through fasting aids weight loss. However, this approach is based on the idea that fasting every other day also activates a ‘skinny’ gene called SIRT1 that helps to boost weight loss further and adds to the health benefits of such a diet.
What else can you tell me about this skinny gene?
The way SIRT1 works is complicated. The theory goes that when cells are restricted of energy – as is the case when we have a very low calorie intake – they become ‘stressed’ and start to die. This is thought to trigger a chain of events that activates SIRT1, which in turn sets off a process that stops cells from dying.
This skinny gene is thought to help make our metabolism more efficient so that we burn fat more effectively and also helps to inhibit fat storage. Plus, SIRT1 has been shown to inhibit substances in our bodies that can cause inflammation. This is important because inflammation is thought to be at the root of many health problems including:
heart diseases
cancer
premature ageing
asthma
arthritis
Alzheimer’s disease
It’s thought this may be the reason why animal research shows that restricting calories improves health.
Can anyone follow this diet?
It’s always worth checking with your doctor before starting a new diet. However, very low calorie intakes on alternate days may not be suitable for some people, for example, people with diabetes. Eating very little on certain days may also not be suitable if you take certain medications. To be sure, it’s best to see your doctor and discuss the diet.
What are the pros of Alternate Day Fasting?
Ultimately, this intermittent fasting plan can reduce your overall calorie content to help you lose weight. You may also feel less deprived on a plan like this as you’re dealing with ‘dieting chunks’ that last for just 24 hours at a time. It also enables you to eat normally at social occasions, taking away the worry about trying to choose low calorie options.
This type of eating pattern may also help to prevent metabolism from slowing down, which inevitably occurs when calories are restricted. Your body doesn’t perceive it’s starving – which is what happens with a constant low calorie intake – so the mechanism that kicks in
to slow down your metabolism in order to save calories doesn’t get switched on. This type of eating pattern is simply a far more extreme version of what nutritionists and dietitians often recommend – compensating for a day of overindulging with a day of being strict.
And the cons of Alternate Day Fasting?
There’s always the possibility you may end up bingeing on the ‘feast’ days, as you’re so hungry after a fasting day. Research with mice found that alternate day fasting didn’t result in weight loss as the rodents simply gorged themselves on the days when they were able to eat, easily compensating for all the calories they had saved by fasting ever other day.
This is easier to do than you might think, too. For example, with this diet, a woman who normally needs 2,000 calories a day to maintain her weight would alternate between having 400 calories on one day and 2,000 calories the next – giving a total of 2,400 calories over the two days instead of the normal 4,000 calories.
However, having a chicken korma with pilau rice, a naan bread, a couple of poppadoms with chutney and two large glasses of wine alone contains around2,300 calories. Add this to a normal 400-calorie breakfast, a normal 600-calorie lunch, 300 calories worth of snacks plus 400 calories on a ‘fasting’ day and your calorie intake over the two days is 4,000 calories – the same as you’d normally eat, therefore totally undoing the calorie savings of a fasting day.You’re also likely to come unstuck if your ‘normal’ diet isn’t that healthy and you continue with this type of eating on non-fasting days. And there’s the potential for us to end up with an unhealthy diet that’s lacking in nutrients, particularly if you don’t follow the principles of healthy eating on the days when we can eat. Finally, there’s the very real problem of dealing with extreme hunger on fasting days.
Juliette’s verdictThe idea of eating what you want every other day certainly sounds attractive – but of course it comes with payback – and that’s practically starving yourself on the alternate days! Nevertheless, this type of eating pattern may work for some. Effectively, it’s simply a new way to help you take in potentially fewer calories than you burn up so that you use up your fat stores and lose weight as a result.
However, for the plan to really work, it’s crucial that on the days when you do eat, you don’t go mad and gorge yourself. Spend these days eating biscuits, cakes, fried food, sugary drinks, crisps and chocolate and you won’t get the benefits of the fasting days. It’s also important to make sure that the foods you do eat are packed with nutrients to help top up intakes of protein,vitamins , minerals and fibre – the downside of eating roughly half as much as normal means you’re likely to miss out on half the nutrients you’d normally get.This means ‘feasting’ days should consist of plenty of fruit, veg, wholegrains, pulses, lower-fat dairy products and lower-fat protein-rich foods such as lean red meat, poultry, fish and eggs. Knowing you need to be less rigid in what you eat the next day may help to avoid feelings of deprivation, which tend to be more common when following a restricted diet for weeks on end. This can help to keep you motivated.Whether or not alternate day fasting really does offer major health benefits and increase life expectancy remains a matter of debate. There’s simply not been enough well-designed,
long-term studies in humans to reach the conclusion that restricting calories helps us to live longer. Indeed, it’s a big jump to suggest that what we see in mice will also be seen in men!
What we do know though, without a shadow of doubt, is that losing weight is one of the most important things we can do to improve our health and life expectancy. A recent analysis of 57 long-term studies found that obesity seriously reduces our life span – people who are very obese can expect to knock 10 years of their life. That’s similar to someone who has spent a lifetime smoking. Huge amounts of research have proven that being overweight increases our risk of many health problems including heart disease, stroke, high blood pressure, certain cancers, type 2 diabetes and, in turn, many of these conditions are known to reduce the number of years we are expected to live.Bottom line: if you want to live longer and stay healthy, losing weight, if necessary, will help. The key is to find an eating plan that suits you and your lifestyle – and if you like the sound of the Alternate-Day Diet then it might be worth giving it a go to kick start a longer-term healthy eating plan.
SOURCE: http://www.weightlossresources.co.uk/diet/reviews/alternate-day-fasting.htm

Johnson UpDayDownDay Diet™
Imagine a diet without restrictions…every other day. The Johnson UpDayDownDay Diet™ is divided into Up Days, when you are free to eat what you would like, and Down Days, when
you monitor your caloric intake. As you limit your intake on Down Days, you will always have an Up Day to look forward to – the very next day. The Johnson UpDayDownDay Diet™ helps
make weight loss and maintenance as easy and as practical as possible.
Enjoy the Foods that You Would Like… Without Guilt
According to the evidence from several studies on alternate-day calorie restriction, many of the advantages of this lifestyle can be realized regardless of the type of food that you eat. As
calories are restricted on the Down Days, a stress response is activated in the body that turns on the SIRT1, or "rescue," gene. The benefits of this stress response, including weight
loss, are more closely linked to the amount of calories being consumed rather than the specific foods themselves. The evidence shows that you can eat the foods that you would
like on Up Days and still lose weight, increase your energy, and reduce the cell inflammation that causes premature aging and aging-related diseases.
Eating Healthy on Up Days
Although you will have the freedom to eat the foods that you would like on Up Days and still reap the benefits of the diet, it is important to remember that, for optimal health, there are
foods that you should eat more often, such as fruits and vegetables, and there are foods that you should try to limit, such as those that contain trans fats. Also, the goal of Up Days is to feel satiated without intentionally overeating. Individuals on the Johnson UpDayDownDay Diet™ have found that, despite restricting their calories on Down Days, they are no hungrier on Up Days than they would be if they were not on the diet, and in some cases they are less
hungry. If you're not as hungry on Up Days, it's okay to eat less than your regular daily allowance.
The Alternate-Day Diet goes into detail about the most nutritious foods that can be chosen on both Down Days and Up Days.
It's important to enjoy eating on the Up Days so that you won't feel deprived and will be able to continue restricting your calories on Down Days. Learn more about how alternate-day calorie restriction with the Johnson UpDayDownDay Diet™ can promote weight loss, disease prevention, and other health benefits. Purchase The Alternate-Day Diet, in stores
now.
Getting started on the Johnson UpDayDownDay Diet™ plan is easy... and unlike many other diets, long-term adherence is easy, too! The diet is ideal for individuals who are trying to lose weight, but it is appropriate for anyone who is looking to improve their health and prevent premature aging. Dr. James Johnson developed the diet based on studies showing that alternate-day calorie restriction decreases the risk of disease and prolongs life in virtually all organisms tested. Resveratrol is also believed to promote similar effects.
There are a few things you can do before you begin the Johnson UpDayDownDay Diet™ to help keep track of your progress and goals:
Begin keeping a journal so that you will be better able to measure your success. Include how much you weigh before you start the diet.
You may also want to have your fasting cholesterol, insulin, and glucose levels checked prior to starting the diet so that you can monitor your improvement in these areas.
The Johnson UpDayDownDay Diet™ has helped individuals greatly reduce the severity of asthma, allergies, arthritis, and other conditions. By listing any symptoms that you have prior to starting the diet and then tracking their improvement, you will receive extra motivation and encouragement to stay on track.
Up Days and Down Days
The Johnson UpDayDownDay Diet™ is more than just a diet. It is a lifestyle…a way to eat for the rest of your life…a way to promote optimal health and nutrition. The plan is straightforward and simple to follow: every other day you will limit your calories (Down Days), and on alternate days you will be free to eat what you would like (Up Days). After a two-week induction phase, the amount of restriction necessary on Down Days will depend upon your goals.

Induction Phase
The two-week induction phase is the most restrictive part of the Johnson UpDayDownDay Diet™ but is necessary to activate the body's genetic response to alternate-day calorie restriction. To begin experiencing the many benefits from "turning on" your SIRT1 gene, it is important to limit yourself to no more than 500 calories on Down Days during this period. Prepackaged diet shakes and bars from Slim Fast®, Atkins®, and other companies can help make sure that you don't go above 500 calories on Down Days during these two weeks.
On Up Days you will be free to eat as much as you would like (without intentionally overeating) as well as the kind of food that you would like. It's important to enjoy Up Days in order to avoid the diet fatigue that often sets in when following other weight loss plans.
Although Down Days in the induction phase may sound challenging, remember that a Down Day is immediately followed by an Up Day. You will never have to restrict your calories for more than one day at a time. You will be able to eat whatever and however much you would like the very next day.
Long-term Maintenance
Because the SIRT1 gene is turned on so rapidly and its effects manifest themselves so quickly, the induction phase of the Johnson UpDayDownDay Diet™ lasts for only two weeks. After that, you are free to eat regular food on Down Days. Also, depending on your weight loss goals, you will be able to eat larger amounts. While it is still perfectly acceptable for you to continue eating 500 calories, or 20 percent of your regular calorie intake, on Down Days after the induction phase, many individuals find that eating up to 35 percent is easier to maintain over the long term.
When you have lost the amount of weight that you desire, you can maintain your weight by eating up to 50 to 60 percent of your normal calorie allowance on Down Days. In The Alternate-Day Diet, Dr. Johnson provides over 50 healthy recipes that will help you stay on track during the Down Days. Use the calorie calculator below to help you figure out what your regular and Down Day calorie intake should be, depending on your goals and activity level.
Calorie Calculator FOR Angela Gibson
Normal Calories* = 1706 kcal/d
Down Day Calories = 341 kcal/d
On Up Days during the long-term maintenance phase, you will still be allowed to eat the foods that you would like to. Because the Johnson UpDayDownDay Diet™ removes so much of the worry and stress that can often accompany dieting, many people are able to continue following this method of alternate-day calorie restriction indefinitely. As a result, they continue to enjoy the many benefits of the diet, including weight loss and maintenance, improved metabolism, and a decreased risk of inflammatory disease.
To Help Ensure Your Success…
Remember to stay hydrated and drink plenty of water.1. Exercise regularly, particularly on Up Days.2. To avoid frustration from weight fluctuations, weigh yourself only once a week, on
the morning after a Down Day.
SIRT1 to the Rescue – Why the Johnson UpDayDownDay Diet™ Works
If you have tried other diets and experienced frustration and disappointment with the results, you may be wondering how the Johnson UpDayDownDay Diet™ is different. Why is the plan so effective in helping people lose weight and, more importantly, keeping that weight off? How does the diet help slow the aging process, reduce the risk of inflammatory disease, and offer other such remarkable benefits? The answers lie in the activation of SIRT1, the "skinny gene" that can be turned on by both an alternate-day calorie restriction diet and resveratrol.
What is SIRT1?
Benefits of SIRT1

How is the gene activated?
What is SIRT1?
SIRT1 is a gene found in humans and other mammals that helps to promote survival by protecting cells during times when food (and therefore energy) is scarce. Scientists have discovered similar genes in almost all species, including Sir2 in yeast, worms, and fruit flies.
SIRT1 acts as a "rescue gene," repairing the damage done by free radicals and preventing cells from dying prematurely. The gene also causes mitochondria, the power plants of cells, to produce energy at higher levels that are typically associated with younger cells. As a result, SIRT1 is believed to be a principal regulator of lifespan.
The Benefits of SIRT1
The SIRT1 gene, or "skinny gene," assists with weight loss by inhibiting fat storage and increasing fat metabolism. By causing the body to store fewer fat cells, SIRT1 can also slow the aging process by reducing the risk of age-related diseases and health threats, including heart attack and stroke, diabetes, arthritis, and osteoporosis. These conditions have all been linked to an excess amount of fat cells in the body.
In addition, SIRT1 can reduce markers of inflammation and oxidative stress, two other primary causes of aging. Studies show that individuals who live to be 100 years old have lower levels of oxidative stress, meaning fewer free radical cells, than those who live to be 70. Oxidative stress is also thought to be a more reliable indicator of heart disease than cholesterol levels or other factors. In his study on asthma patients, Dr. Johnson showed how restricting calories on alternate days can raise SIRT1 levels and reduce symptoms associated with inflammation.
Dr. Johnson continues to study the effects of SIRT1 and exactly how its benefits are conveyed.
How is the gene activated?

SIRT1 is activated by calorie restriction or by the compound in red wine known as resveratrol. Dr. James Johnson developed the UpDayDownDay Diet™, a method of alternate-day calorie restriction, so that individuals can receive the benefits from "turning on" the SIRT1 gene while losing weight at the same time.
The body's response to calorie restriction is an example of "hormesis," in which a normally dangerous stressor can actually be beneficial in small amounts. Although an animal will die if it starves, moderate calorie restriction can actually increase its chances of survival by raising levels of SIRT1.
Source: http://www.johnsonupdaydowndaydiet.com
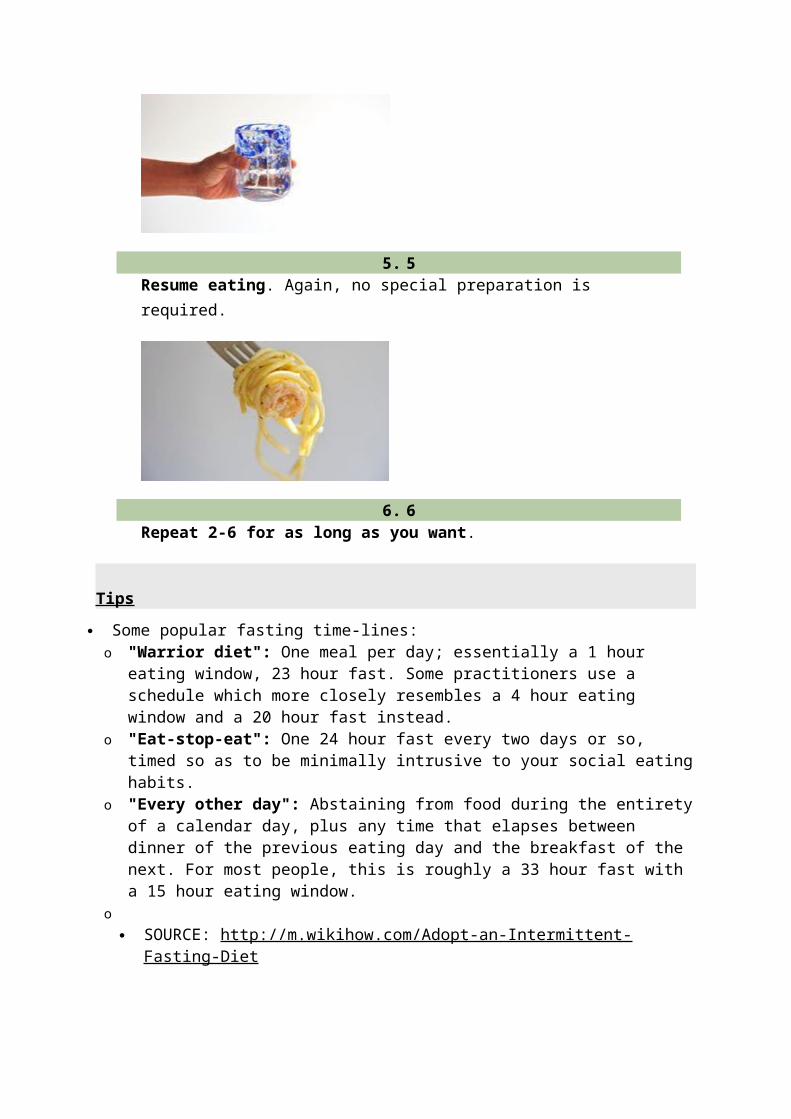
Eat Stop Eat InsiderLearn The Truth About The Eat Stop Eat Program & Intermittent Fasting
2 Easy Intermittent Fasting Diet Plan Examplesby ADMIN on JULY 30, 2012
More and more people are coming to try Intermittent Fasting as a diet
for the simple reason that it’s getting results.
But the devil is in the detail. IF is a very different way of eating for most
people, and doing it wrong can not only prevent you from the muscle
gain/fat loss results you want, but actually damage your health as well.
Because IF is so new, there are a number of IF diet plans that CAN work.
Most of them are solely based on the experience of one person and his
results with the program, but others have been applied more widely and
have demonstrated results with a larger sample. It’s important to stick to
the latter if you want to get the best gains from the IF lifestyle.
It’s mostly about finding which works best for you, your lifestyle, and
your goals. What I’ve tried to provide below is a sample of some of the
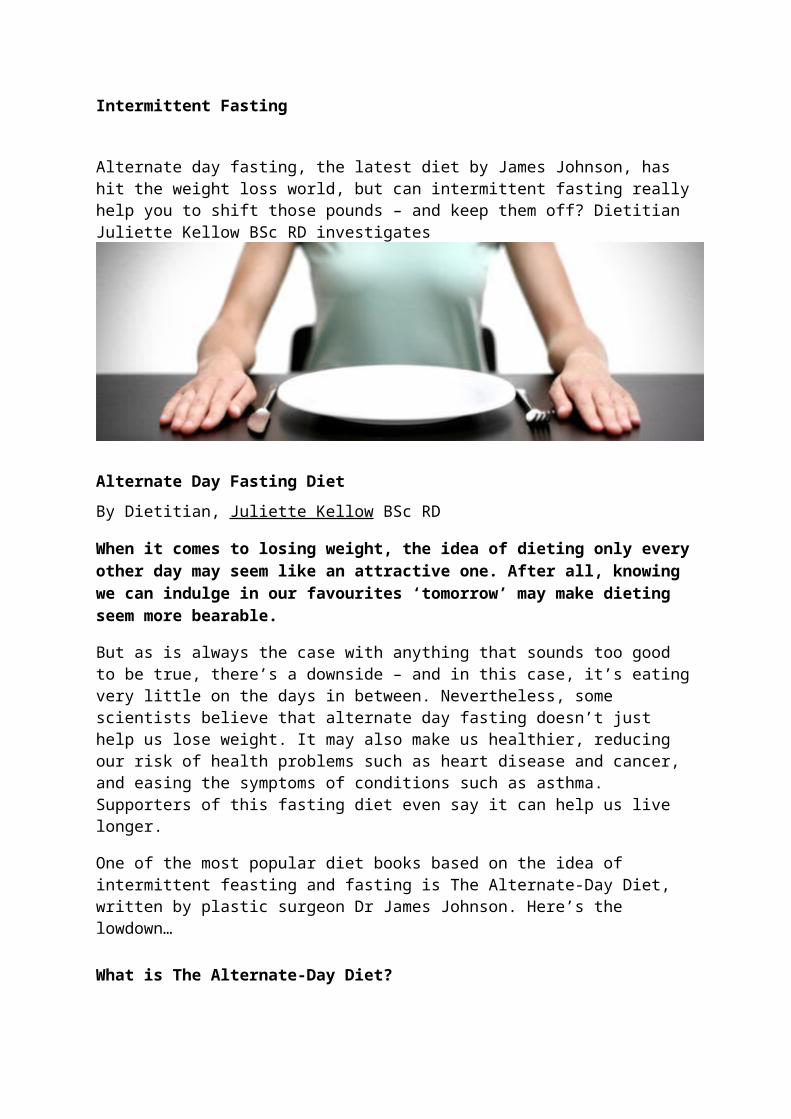
diet plans so that you can try and make that decision for yourself. Here
goes…
Note First…
Diet plans for IF vary in two ways…
- How long you fast for, and on what cycle (what days, how regularly etc)
- And what foods you eat when you’re… eating
Below we’ll look at two different examples.
A Fat Loss IF Diet Plan
Fasting intermittently will
increase the rate at which your body burns excess fat due to the fact that
it MUST in order to give you the energy you need. So instead of using the
energy stored in the calories in the food that you eat, you will instead be
using up your stores of excess body fat.
One type of intermittent fasting that’s popular for fat loss is called
Alternate Day fasting in which you will eat a balanced diet of around
1800 cal every other day (that’s your non fasting day, and that number is
subject to change depending on your body weight. More on that below).
On the days that you will be fasting you will be drastically reducing that
calorific intake to around 500 cal (around 1 fifth of your regular intake),
however you can eat meals at any time that you wish.
The Fast: 24 hours a day on your fasting days.
NOTE: This plan isn’t a total fast. This one doesn’t mean you eat
NOTHING on your fasting days. What you actually do is cut your calories
to 1 fifth of their normal level.
The first part of the fast involves the dreaded “calorie counting” just for
ONE day, so you know what is your current daily total, then working out
1/5 of it, and sticking to that on each of your fasting days. More about
this below.
The Eating: Normally on your off days (keeping it clean on those days
helps of course)
When you fast: Every second day is a fasting day.
Examples: Monday, Wednesday, Friday, you follow your normal diet
(keeping it clean as possible). You may eat at any intervals you wish
through the day.
Tuesday, Thursday, Saturday, you restrict calories to 1 fifth. There are a
couple of ways you can do this. If you eat 5 meals a day, you can skip one
of them – say breakfast. Some people prefer this because it’s easy and
requires less thinking.
Alternatively, you can reduce the size of each of your meals each day, so
you’re still eating regularly, but you’re eating 1/5 of your normal portion
size, on every meal through that day.
If you go for the latter option, don’t get bogged down in making sure it’s
EXACTLY 1/5, because that will just piss you off before long. Spend the
first day settling on an amount of food at each meal that’s your best
approximation of 1/5 of it’s normal size and stick with that through each
of your fasting days. You can’t get it too wrong and the small difference
is worth it for your sanity and your ability to stick to the diet.
Comment: This is a good plan to start on because you only have to think
about fasting every second day so it’s easier to get used to. You’ll feel
hungry on your fasting days for the first week, but it will have settled a
lot after that. Grit it out for that period because the big fat loss results
are coming.
Results: Even this small tweak to your diet will result in fat loss, usually
within your first week. Different reports have stated different things, but
some people have claimed to lose up to 5lbs in their first 10 days on this
plan, depending on how much fat they had to lose, and how well they
followed it (and a few other factors).
You’ll be in the rythym of it after a week so you’ll find it easy, and you’ll
enjoy the benefits of not having to “think” about eating so much. Many
people have reported they are more productive and some a little happier
through the day doing this.
———————————————
A Muscle Gain IF Diet Plan
When it comes to muscle
gain with IF, it’s all about the HGH response. Really you “gain” muscle in
two ways. You lose fat so you look more ripped and your muscles look
more pumped (as all bodybuilders know) AND, you physically increase
your muscle mass, like you do by lifting heavy.
IF is cool because it helps with both of those things. Fat loss we talked
about above. For muscle gain, below is one to try.
The following fast is… bordering on hard core. It’s going to represent a
big change to your lifestyle and is harder to adapt to at first but… you’re
in this to gain muscle damn it. Harden up and go for it, because the gains
are worth it, as many bodybuilders have proved.
The Fast: 18 hours each day
The Eating: All meals (3 or 4) in the remaining 6 hour period.
When you fast: From the end of your last meal in the evening, through
your sleep (of course) and for about half of the hours into the next day,
depending on how long you sleep for.
This is a fast that you would employ every day for best results.
Example: You finish your dinner on Monday at 9pm. You go to bed at
11pm. You sleep 8 hours. You wake up at 7am. You don’t eat your first
meal until 3pm. You’re then eating from 3pm til 9pm.
Why: Your growth hormone levels start to spike as the fast gets to
around the 10-12 hour mark. That means you’ve got 6 hours from then,
when they’re just on overdrive (about 2000% of their regular levels),
helping you recover more quickly from your workouts, synthesizing your
protein, and maximizing the growth of new muscle.
Easy enough? Yes and no.
It’ll be tough for the first few days, but with a little motivation it’s not so
hard to push through that and get to the point where you’re comfortable
on this plan, at least for a month to 6 weeks. You’ll see the results
yourself after that time and you’ll be able to decide what place fasting
has in your life from there on out (whether that’s permanent or periodic).
Results: This is the type of plan that bodybuilders have used and
endorsed even as a “pre competition” diet. Numerous examiners
conclude this plan to have increased lean muscle mass over a 2 month
period and decrease body fat significantly. Results are visible in the first
10 days, and accelerate gradually from there.
NOTE: The challenge on this plan also is an unseen one. Fasting for the
18 hours is tricky, but so is stuffing 3 big meals into a 6 hour period. It
means you eat 2 hours apart, and you need to get enough calories in that
there is something there for muscle growth. A number of people report
finding this part challenging BUT it’s tempered by the fact that you enjoy
the meals so much because… you’ve been fasting for 18 hours before
them!
Caloric restriction and intermittent fasting: Two potential diets for successful brain aging
Bronwen Martin,a,* Mark P. Mattson,a,b and Stuart Maudsleya,c
Author information ► Copyright and License information ►
The publisher's final edited version of this article is available at Ageing Res Rev
See other articles in PMC that cite the published article.
Go to:
Abstract
The vulnerability of the nervous system to advancing age is all too often manifest in neurodegenerative disorders such as Alzheimer's and Parkinson's diseases. In this review article we describe evidence suggesting that two dietary interventions, caloric restriction (CR) and intermittent fasting (IF), can prolong the health-span of the nervous system by impinging upon fundamental metabolic and cellular signaling pathways that regulate life-span. CR and IF affect energy and oxygen radical metabolism, and cellular stress response systems, in ways that protect neurons against genetic and environmental factors to which they would otherwise succumb during aging. There are multiple interactive pathways and molecular mechanisms by which CR and IF benefit neurons including those involving insulin-like signaling, FoxO transcription factors, sirtuins and peroxisome proliferator-activated receptors. These pathways stimulate the production of protein chaperones, neurotrophic factors and antioxidant enzymes, all of which help cells cope with stress and resist disease. A better understanding of the impact of CR and IF on the aging nervous system will likely lead to novel approaches for preventing and treating neurodegenerative disorders.
Keywords: Caloric restriction, Intermittent fasting, Aging
Go to:
1. IntroductionBrain disorders of aging have recently become leading causes of disability and death, due to numerous advances in the prevention and treatment of cardiovascular disease and cancers. Several prominent risk factors for major age-related diseases, such as cardiovascular disease, type 2 diabetes and cancers, are also risk factors for many neurodegenerative diseases. These risk factors include a high calorie diet, vitamin insufficiencies (e.g. folic acid and antioxidants) and a sedentary life-style. Research efforts on neurodegenerative disorders have rapidly expanded in the past decade and
those efforts have led to many promising therapeutic interventions to increase both health-span and lifespan. Many people live for eight or more decades and enjoy a well-functioning brain throughout their life-span. We therefore know that the human brain is capable of aging successfully. We are now at a stage where our knowledge of both the genetic and environmental factors which have been linked to unsuccessful brain aging, and their cellular and molecular consequences, can be utilized to provide the general population with advice on aging successfully. In this review, we will discuss two dietary strategies, caloric restriction and intermittent fasting, which could potentially be used to mediate successful aging and forestall the onset of certain neurodegenerative disorders (Fig. 1).
Fig. 1
Dietary restriction and the healthy aging of man. Taking Da Vinci's Man as a paragon of humanity we have described how he may live beyond the years normally ascribed to renaissance homo sapiens through alterations in caloric intake. Both gross and cellular ...
Go to:
2. Molecular actions involved in aging and degenerationAn increasing number of genetic and environmental factors are being identified that can render neurons vulnerable to the aging process. An understanding of how such causal or predisposing risk factors promote neuronal dysfunction and/or death is critical for developing approaches to preserve functional neuronal circuits. Similarly to other organ systems, cells in the brain encounter a cumulative burden of oxidative and metabolic stress that may be a universal feature of the aging process. Increased oxidative stress during brain aging can be found in each of the major classes of cellular molecules, including proteins, lipids and nucleic acids. Some oxidative modifications of proteins that have been observed in neurons during aging include carbonyl formation (Butterfield et al., 1997; Cakatay et al., 2001; Dubey et al., 1996), covalent modifications of cysteine, lysine and histidine residues by the lipid peroxidation product 4-hydroxynonenal (Papaioannou et al., 2001), nitration of proteins on tyrosine residues (Sloane et al., 1999), and glycation (Munch et al., 2000). A common oxidative modification of DNA, observed during brain aging is the formation of 8-hydroxydeoxyguanosine (Sohal et al., 1994). Each of these modifications of proteins, lipids and nucleic acids are also exacerbated in numerous degenerative disorders such as Alzheimer's disease (AD) and Parkinson's disease (PD). AD can be caused by mutations in the genes encoding the
amyloid precursor protein (APP) and/or presenilin-1 (PS-1) or -2 (PS-2). Each of these mutations results in an increased production of amyloid-β peptide which itself can increase the oxidative burden on neurons. AD leads to a progressive deterioration of cognitive function with a loss of memory. Neuronal injury is thus present in regions of the brain that involve the hippocampus and the cortex. AD is characterized by two main pathological hallmarks that consist of extracellular plaques of amyloid-β peptide aggregates, and intracellular neurofibrillary tangles composed of the hyperphosphorylated microtubule-associated protein tau. The β-amyloid deposition that constitutes the plaques is composed of a 39–42 amino acid peptide (Aβ), which is the proteolytic product of the APP protein. Interestingly, the APP and presenilin mutations have also been shown to decrease levels of a secreted form of APP that has been shown to promote synaptic plasticity (learning and memory) and survival of neurons (Furukawa et al., 1996; Ishida et al., 1997). PD is also a relatively common progressive neurodegenerative disorder affecting approximately 1% of the population older than the age of 65 years and approximately 4–5% of the population older than the age of 85. It is caused by a selective degeneration of the dopamine neurons in the substantia nigra. PD is characterized by tremor, rigidity and slowness of movements. Non-motor features, such as dementia and dysautonomia, occur frequently, especially in the advanced stages of the disease.
Go to:
3. Life-span and health-span extension by caloric restriction and intermittent fastingThroughout history, numerous societies have recognized the beneficial effects on health and general wellbeing of limiting food intake for certain periods of time, either for religious reasons or when food was scarce. The first widely recognized scientific study of restricted diets and their ability to extend life-span was published by McCay et al. (1935). McCay showed that feeding rats with a diet containing indigestible cellulose dramatically extended both mean and maximum life-span in these animals (McCay et al., 1935). Many studies have confirmed this result and extended it to mice (Weindruch and Walford, 1988; Sprott, 1997) and other species including fruitflies (Chapman and Partridge, 1996), nematodes (Houthoofd et al., 2002), water fleas, spiders and fish (Weindruch and Walford, 1988).In this review we will attempt to indicate how, with dietary alteration, not only can life-span be extended but also potentially, health-span, i.e. the time of our lives in which we have a disease/pathology free disposition. We shall also investigate through which molecular mechanisms the benefits, on the whole organism, of dietary intake modification are derived. Variations of this basic dietary regime, now known as caloric restriction (CR), are the most effective way of extending the life-span of mammals without genetically
altering them. More recently, another variation of CR, intermittent fasting (IF) or every other day feeding (EODF), has also been shown to extend life-span and have beneficial health effects. (Sohal and Weindruch, 1996; Goodrick et al., 1982; Ingram and Reynolds, 1987). Rodents maintained on calorie-restricted diets are generally smaller and leaner and have less body fat and smaller major organs than ad libitum fed animals (Weindruch and Sohal, 1997). They are generally more active, which may relate to the need to search for food (Hart and Turturro, 1998; Martin et al., unpublished data), and the normal age-related decrease in physical activity is markedly reduced in calorie-restricted animals (Means et al., 1993). However, these animals are more vulnerable to cold temperatures (Johnson et al., 1982), which is a major source of mortality for small mammals (Berry and Bronson, 1992). The amount by which life-span is extended has been shown to increase progressively as caloric intake is reduced, until the point of starvation. The time of onset of the dietary restriction (e.g. pre- or post-pubertal) and the duration of the CR regime also determine the amount by which life-span is extended. Crucially both CR and IF can diminish the severity of risk factors for diseases such as diabetes and cardiovascular disease in rodents (Anson et al., 2003; Wan et al., 2003). In many studies, implementation of the IF dietary regime results in an approximately 20–30% reduction in caloric intake over time. Maintenance of rats on this alternate day CR feeding regimen for 2–4 months results in resistance of hippocampal neurons to chemically induced degeneration (Bruce-Keller et al., 1999a,b). This reduced damage to hippocampal neurons is also correlated with a striking preservation of learning and memory in a water maze spatial learning task. Thus these dietary regimes could have a significant benefit for debilitating and prevalent neurodegenerative disorders such as Alzheimer's, Huntington's and Parkinson's diseases.
Go to:
4. Molecular mechanisms of neuroprotection by CR and IF
Data from the animal studies described in this review show that neurons in the brains of rats and mice maintained on CR or IF regimens exhibit increased resistance to oxidative, metabolic and excitotoxic insults. The critical question to ask with respect to these studies is, what are the underlying molecular mechanisms that account for the protection against this myriad of potent cellular insults? Investigators have addressed this important question by measuring numerous proteins and lipids that are known to play a role in protecting neurons against many different insults. We shall discuss and demonstrate what a complex physiological response to CR/IF occurs in the organism and how this may eventually translate to healthy aging.
4.1. Stress responses
From nature we know that the acquisition of available food forms one of the most profound behavior sets and thus removal of adequate food sources acts as a great driving force for engrained behavior and causes a certain degree of psychological and physiological stress in the organism. This paradigm, as with so many aspects of biology, extends even to the fundamental physiological and cellular processes within the organism. To exemplify this, several different stress proteins have been measured in the brains from rats maintained on either ad libitum or CR diets for 3 months. Examples of such stress proteins include heat-shock proteins and glucose-regulated proteins. These molecular chaperone proteins interact with many different proteins in cells and function to ensure their proper folding, on the one hand, and degradation of damaged proteins, on the other hand (Frydman, 2001; Gething, 1999). They may also interact with, and modify the function of, apoptotic proteins including caspases (Beere et al., 2000;Ravagnan et al., 2001). Levels of some of these chaperone proteins may be increased during the aging process as a protective response (Lee et al., 1999, 2000a,b). Cell culture and in vivo studies have shown that heat-shock protein-70 (HSP-70) and glucose-regulated protein 78 (GRP-78) can protect neurons against injury and death in experimental models of neurodegenerative disorders (Lowenstein et al., 1991; Yu and Mattson, 1999). Levels of HSP-70 and GRP-78 were found to be increased in the cortical, hippocampal and striatal neurons of the CR rats compared to the age-matched ad libitum fed animals (Lee et al., 1999; Mattson, 1998). Previous studies in this and other laboratories have provided evidence that HSP-70 and GRP-78 can protect neurons against excitotoxic and oxidative injury (Warrick et al., 1999; Yu et al., 1999), which suggests that they contribute to the neuroprotective effect of CR. These data may demonstrate that CR can induce a mild stress response in neurons, presumably due to a reduced energy, primarily glucose, availability. In addition to these subcellular stress responses it has been reported that IF results in increased levels of circulating corticosterone (Wan et al., 2003), which is usually associated positively with the stress-state of the organism. In contrast to detrimental stressors, such as chronic uncontrollable stress, which endanger neurons through glucocorticoid receptor activation, IF downregulates glucocorticoid receptors with maintenance of mineralocorticoid receptors in neurons which can act to prevent neuronal damage and death (Lee et al., 2000a,b). It may be that alternating periods of anabolism and catabolism, occurring during IF, may play a mechanistic role in triggering increases in cellular stress resistance and the repair of damaged proteins and cells.Excessive neurological stress often takes the form of elevated levels of glutamatergic neurotransmission,e.g. in post ischemic events or epileptic seizures there can be an overload of cells with calcium, induced by the overt
glutamate release that results in eventual cell death. This form of excitoxic cell death can be mimicked by the injection of kainic acid (KA) into the cerebral ventricles/brain regions of experimental animals. When the excitotoxic KA is injected into the dorsal hippocampus of mice it induces seizures and damage to pyramidal neurons in regions CA3 and CA1 (Duan et al., 2001). A significant increase in the survival of CA3 and CA1 neurons in the IF mice compared with mice fed ad libitum, after the kainic insult has been demonstrated (Anson et al., 2003).
4.2. Neurotrophic factors
As both IF and CR induce a mild stress response in brain cells this can result in the activation of compensating mechanisms, e.g. the upregulation of neurotrophic factors such as BDNF and glial cell line-derived neurotrophic factor (GDNF) as well as the aforementioned heat shock proteins (Bruce-Keller et al., 1999a,b; Duan and Mattson, 1999; Duan et al., 2003; Maswood et al., 2004). IF regimens have been demonstrated to ameliorate and attenuate neuronal damage and improve the functional outcome in animal models of neurological trauma such as stroke (Yu and Mattson, 1999) and also neurodegenerative disorders such as Parkinson's disease (Duan and Mattson, 1999), and Huntington's disease (Duan et al., 2003). The neuroprotective mechanism of IF is not known, but it has been reported that IF induces the production of brain-derived neurotrophic factor (BDNF) which was associated with increased hippocampal neurogenesis in rats and mice (Lee et al., 2002). One of the primary neuroprotective mechanisms attributed to BDNF appears to be the ability of BDNF-mediated activation of its cognate TrkB receptor which then entrains stimulation of multiple signaling pathways. Prominent amongst these TrkB signaling pathways is the phosphatidyl inositol 3-kinase (PI3K)/protein kinase B (Akt) pathway that has been implicated in several of the CR/IF protective mechanisms that will be discussed at greater length in this review.
4.3. Ketone bodies
Dietary fasting is known to result in an increased production of ketone bodies, e.g. β-hydroxybutyrate, which can be used by the organism as an energy source in the face of limited glucose availability (Mitchell et al., 1995; Vazquez et al., 1985). With respect to ketogenesis it appears that IF regimens seem to be more amenable to this energy production pathway than more strict CR protocols. Mice on IF regimens have been shown to weigh on average more than mice on CR regimens. They also have larger adipose reserves and a greater ketogenic response than CR mice. IF dietary regimes can develop a two-fold increase in the fasting serum concentration of β-hydroxybutyrate compared with mice fed ad libitum (Anson et al., 2003). This shift to ketogenesis may play a direct role in the cytoprotective effects of IF,
because it has been reported that rats fed a ketogenic diet exhibit increased resistance to seizures (Bough et al., 1999), and that β-hydroxybutyrate itself can protect neurons in rodent models of Alzheimer's and Parkinson's diseases (Kashiwaya et al., 2000). Ketogenic diets, which promote a metabolic shift from glucose utilization to ketogenesis, are also prescribed for some patients with epilepsy (Gilbert et al., 2000) as this is prophylactic against the progressive excitotoxic neuronal damage and degradation that can occur if the condition is untreated.
4.4. Glucose/insulin signaling
During fasting or dietary restriction the primary alteration to the organism is the availability of glucose for oxidative respiration. The mechanisms by which energy is derived from alternate sources or how the remaining glucose is handled are germane to the extrapolation of the health benefits of CR/IF regimens. The importance of glucose handling efficiency for healthy aging can be demonstrated by the fact that glucose levels in the blood, integrated over time, have been postulated to lead to high levels of non-enzymatic glycation, a form of protein damage. CR has been shown to specifically attenuate oxyradical production and damage (Weindruch and Sohal, 1997) and non-enzymatic glycation (Cefalu et al., 1995).Both IF and CR regimens have similar effects on insulin and glucose levels, i.e. reduction, yet interestingly they have different effects on serum IGF-1 levels and serum β-hydroxybutyrate levels, i.e.both these parameters are increased with IF compared to CR (Dunn et al., 1997; Anson et al., 2003). A longitudinal study on male rats (Masoro et al., 1992) demonstrated that CR decreased the mean 24-h plasma glucose concentration by about 15 mg/dl and the insulin concentration by about 50%. CR regime animals utilized glucose at the same rate as did the rats fed ad libitum, despite the lower plasma glucose and markedly lower plasma insulin levels. Therefore, it is proposed that CR either increases glucose effectiveness or insulin responsiveness or both, and that the maintenance of low levels of glucose and insulin control the beneficial and life-extending actions of CR. CR has also been found to reduce plasma glucose and insulin concentrations in fasting rhesus monkeys (Kemnitz et al., 1994). In addition, CR can increase insulin sensitivity in rhesus and cynomolgus monkeys (Lane et al., 1995 and Cefalu et al., 1997). A major reason for this emphasis being placed on the insulin–glucose control system in aging is the finding that loss-of-function mutations of the insulin signaling system result in life extension in three species: C. elegans (Kenyon et al., 1993; Wolkow et al., 2000), D. melanogaster (Clancy et al., 2001), and mice (Bluher et al., 2003). Overall, from many experimental studies, CR and IF seem to chronically reduce the circulating levels of insulin resulting in an eventual enhanced glucose mobilization and an enhanced insulin sensitivity, both of which serve to maintain a supply of glucose for the

vital organs, central nervous system and gonads to support these critical organs in time of limited energy intake. The actual reduction of insulin receptor signaling mediated by reduced plasma insulin levels has an impact also on several other factors that profoundly impact upon the cellular response to CR/IF; this will be discussed in later sections.
4.5. Cytokines
There is mounting evidence to suggest that inflammatory processes could be critically involved in the development of age-related pathologies such as those observed in Alzheimer's disease. The activation of microglia in response to injury or during aging causes the induction of an inflammatory-like response. This response is typified and initiated by an enhanced expression of interleukin-1 in the stimulated microglia (for review see, Griffin, 2006). With this in mind it is therefore unsurprising that inflammatory cytokines may also be implicated in the CR/IF-mediated processes that ameliorate this neurodegeneration. Recent findings suggest that IFN-γ is an important mediator of neuronal plasticity,e.g. IFN-γ may enhance synaptogenesis, regulate synaptic plasticity and control neurogenesis (Brask et al., 2004; Vikman et al., 2001; Improta et al., 1988; Wong et al., 2004). It was recently reported that levels of IFN-γ are increased in circulating leukocytes of monkeys that had been maintained on a CR diet (Mascarucci et al., 2002). It has also been demonstrated that CR elevates the expression of IFN-γ in the hippocampus where it exerts an excitoprotective action of IFN-γ (Lee et al., 2006). Cytokines can also be produced by visceral organs outside the immune system and the central nervous system. Adipose tissue, which accumulates during aging and is specifically reduced upon CR or IF regimens, can act as an endocrine organ, which produces trophic hormones that are active throughout the body (Bordone and Guarente, 2005), e.g. tumour necrosis factor-α (TNFα). TNFα has also been shown to trigger insulin resistance in animals (Feinstein et al., 1993). In vitro cell-culture studies have shown that TNFα renders cells insulin resistant through a downregulation of glucose transporter synthesis as well as through interference with insulin receptor signaling pathways (Stephens et al., 1997) which we have seen are critically involved in healthy aging. In vivo, the absence of the TNFα receptor significantly improves insulin sensitivity which mimics the insulin-related effects seen in CR/IF animals. Interestingly, it has been shown that CR attenuates the age-related upregulation of nuclear factor (NF)-κB (Kim et al., 2000), which is a transcription factor that induces the expression of TNFα (Bordone and Guarente, 2005) in adipose tissue and the production of inflammatory cytokines in immune cells. Thus attenuation of TNF-α-induced insulin resistance may enhance the glucose utilization capacity of the organism, thus fending off the detrimental effects of excessive blood glucose that may occur in times of poor health and with advancing age.
4.6. Satiety and adipose-generated hormones
Leptin and adiponectin are two hormones that are typically associated with the feedback control of appetite and satiety. Both of these factors are produced by adipose tissue (Meier and Gressner, 2004) which is of course profoundly affected by CR/IF regimes. In addition to its role in satiety, leptin, released into the circulation, reduces the level of stress hormones (Barzilai and Gupta, 1999) and increases thyroid activity and thyroid-hormone levels which both result in increased energy expenditure (Legradi et al., 1997). As we have seen, CR regimens tend to upregulate stress hormones in a tolerable manner and in addition they can downregulate thyroid hormones, potentially through this attenuation of circulating leptin levels (Barzilai and Gupta, 1999). However leptin's role in mediating the beneficial effects of CR may be secondary to its satiety role as it has been demonstrated that mice that lack leptin unfortunately demonstrate a reduced life-span, compared to ad libitum animals, and are obese (Allison et al., 2001). Adiponectin has been shown to trigger increased insulin sensitivity (Meier and Gressner, 2004; Pajvani and Scherer, 2003) via upregulation of AMP-activated protein kinase (AMPK: Wu et al., 2003). This kinase regulates glucose and fat metabolism in muscle in response to energy limitation (Musi et al., 2001), and has been shown to protect neurons against metabolic stress (Culmsee et al., 2001). Importantly, adiponectin levels rise during CR, which suggests that this adipose-derived hormone might also have an important contributory role in the physiological shift to an enhanced insulin sensitivity in these animals (Combs et al., 2003). Recent findings show that mice that have been genetically engineered to be lean live longer. Indeed, tissue-specific knockout of the insulin receptor in adipose cells prevents the tissue from storing fat, which gives rise to lean animals that live significantly longer than wild-type mice (Bluher et al., 2003). These data suggest that visceral adipose might be especially important in driving insulin resistance and pathogenesis (Bjorntorp, 1991).
4.7. Sirtuins
As lower organisms, e.g. yeast and nematode worms, possess a considerably shorter life-span than mammals they have proved useful for the discovery of the molecular determinants of healthy longevity. It has become apparent that amongst the multiple factors that have been identified that control life-span in these lower organisms, many of these also link the alteration of caloric intake to the increase in health-span so desired by dietary interventions of disease processes.One of the primary genetic determinants of replicative life-span to emerge from genetic studies in yeast is the silent information regulator 2 (SIR2). The SIR2 gene was denoted because it mediates a specific gene silencing action (Rine and Herskowitz, 1987). Inhibitory mutations of SIR2 can shorten life-
span, and increased gene dosage of SIR2 extended life-span (Kaeberlein et al., 1999). The SIR2 ortholog in C. elegans was similarly shown to be a key determinant of the life-span in that organism (Tissenbaum and Guarente, 2001). As yeast and C. elegans diverged from a common ancestor about one billion years ago this may suggest that descendants of that ancestor, including mammals, will possess SIR2-related genes involved in regulating their life-span. As dietary regulation has also shown to be a powerful modulator of life-span it is reasonable to speculate that CR/IF and SIR2 genes may converge to play an important role in these multiple and complex physiological pathways. Mammalian homologues of the yeast SIR2 gene have subsequently been found and interestingly the SIR2 ortholog, SIRT1, may in part mediate a broad array of physiological effects that occur in animals on a modified diet, beit CR or IF. The family of proteins discovered that are encoded for by the mammalian SIR2 homologues are collectively termed sirtuins. Several recent reports have shown increases in SIRT1 protein levels in response to food deprivation (Nemoto et al., 2004; Cohen et al., 2004). In addition SIR upregulation has been shown in response to cell stressors, such as high osmolarity (Lin et al., 2002), thus the sirtuin family of proteins could be actively regulated by the mild, controllable stress induced by CR/IF. Sirtuins possess a relatively rare enzymatic capacity as they are NAD-dependent histone deacetylases (Imai et al., 2000; Landry et al., 2000). The mammalian SIRT1 gene product enzyme can, in addition to histones, deacetylate many other substrates. In this regard, SIRT1 was recently shown to deacetylate and downregulate NF-κB (Yeung et al., 2004). It is intriguing to speculate that the upregulation of SIRT1 by CR contributes to the observed increase in insulin sensitivity and reduction in inflammation, potentially through the control of the NF-κ/TNFα pathways.Lin et al. (2002, 2004) have proposed a molecular pathway for SIR2 activation that potentially connects alterations in caloric intake to life-span extension. Upon CR/IF there is an initial increase in oxygen consumption and respiration, at the expense of fermentative processes. Fermentation is a typical mechanism by which cells can generate ATP and also store excess energy in the form of ethanol when glucose is abundant. This metabolic shift triggers a concomitant reduction in NADH levels. NADH acts as a competitive inhibitor of SIR2, so its reduction during CR/IF periods would be expected to upregulate the enzyme and thereby extend the organism's life-span in line with yeast and C. elegansstudies. Consistent with this, ablation of mitochondrial electron transport blocked the effect of CR on life-span, and overexpressing NADH dehydrogenase, the enzyme that shunts electrons from NADH to the electron transport chain, increased the animal's life-span. Thus it appears then that CR/IF induces a more efficient use of glucose via an increase in respiration. In addition to this there is a transition in muscle cells from using glucose, which is to some extent, metabolized in ad libitum animals fermentatively (producing lactate), toward the use of fatty
acids, which are oxidatively metabolized. This shift spares glucose for the brain, preventing neurodegeneration, and correlates with the characteristic enhancement of insulin sensitivity in muscle and liver seen in CR. Although the actions of sirtuins in the nervous system are only beginning to be explored, it has been reported that SIR2 (SIRT1 in mammals) activation through increased gene dosage or treatment with the sirtuin activator resveratrol can protect neurons against the pathogenic effects of polyglutamine-expanded huntingtin proteins in worm and mouse models of Huntington's disease (Parker et al., 2005).Sirtuins also seem to play a role in mediating the effective role of adipose tissue in the physiological transference of the benefits of CR/IF regimes to the organism. One of the most important regulators of adipose tissue function is the peroxisome proliferator-activated transcription factor receptor gamma (PPARγ: Tontonoz et al., 1994). This receptor acts as a nuclear transcription factor that controls multiple genes connected to cell survival and responses to metabolic alterations. One PPARγ gene target, the aP2 gene, encodes a protein that assists fat storage. SIRT1 can act as a repressor of PPARγ, thereby downregulating genes such as the mouse aP2 gene (Picard et al., 2004). During fasting SIRT1 activation is followed by an enhanced binding to the aP2 promoter in adipose tissue. This causes a repression of aP2 gene expression causing an eventual promotion of fat mobilization into the blood to aid the organism's energy balance. Therefore, according to Bordone and Guarente (2005), upon manipulation of caloric intake there is a reactionary activation of SIRT1 in adipose tissue, which acts to reduce fat stores and probably resets hormonal levels to change the pace of aging. This strategy also makes evolutionary sense when it is considered that successful reproduction is also regulated by body fat and is shut off during CR, only to resume when available energy supplies become more abundant.
4.8. Peroxisome proliferator-activated receptor (PPAR) and co-factors
PPARs, as we have seen, are members of the nuclear hormone receptor subfamily of transcription factors. PPARs form functional heterodimers with retinoid X receptors (RXRs) and these heterodimers regulate transcription of various genes. There are three known subtypes of PPARs, α, δ and γ. These nuclear receptor transcription factors regulate genes involved in nutrient transport and metabolism as well as resistance to stress. PPARs themselves also recruit other proteins in addition to the RXR to mediate their complete function. One such protein is the peroxisome proliferator-activated receptor γ (PPARγ) coactivator 1 (PGC-1). This coactivator has been shown to be closely regulated by dietary alteration in lower organisms and higher mammals. PGC-1 exists in two isoforms, α and β, and these isoforms have emerged as prominent regulators of the adaptive responses to caloric deprivation. PGC-1 regulates the ligand-dependent and -independent activation of a large

number of nuclear receptors including the PPARs. There has been reported an age-dependent reduction in PGC-1α (Ling et al., 2004) which may exacerbate the aging process. However in mice and primates CR has been shown to reverse this age-dependent decrease in PGC-1α, PPAR and regulated genes (Weindruch et al., 2002; Kayo et al., 2001).PGC-1α, the first PGC family member identified was characterized as a protein that interacts with the PPARγ to regulate brown fat differentiation during adaptation to cold stress (Puigserver et al., 1998). This cold stress may be regarded as analogous to the physiological and psychological stress induced by caloric restriction. During CR/IF periods, when insulin levels are low, PGC-1α and PGC-1β gene expression is enhanced in rodents (Puigserver and Spiegelman, 2003; Herzig et al., 2001). PGC-1α was also induced in the livers of mice (Corton et al., 2004) and rats (Zhu et al., 2004) after longer term CR. PGC-1α and β can coordinately regulate genes involved in gluconeogenesis and fatty acid β-oxidation in a number of organs during fasting (Lin et al., 2002a, 2004a; Kamei et al., 2003; Kressler et al., 2002). Both these processes are beneficial to the maintenance of a healthy energy balance in times of limited food. Hence through PPAR activation extra supplies of glucose can be mobilized and alternate energy sources can be exploited. As well as PGC regulation during fasting, PPARα is also upregulated by fasting in liver, small and large intestine, thymus (Escher et al., 2001), and pancreas (Gremlich et al., 2005). A large number of genes involved in fatty acid β-oxidation, known to be regulated by PPARα are also increased in expression in response to fasting. During periods of fasting PPARα knock-out mice exhibit an inability to regulate genes involved in fatty acid β- and ω-oxidation and ketogenesis in the liver, kidney and heart along with lack of control of blood levels of glucose or ketone bodies bodies (Kroetz et al., 1998; Sugden et al., 2001; Leone et al., 1999).Not only is the liver the energy-regulating core of mammals but it also represents one of the most significant stores of glycogen, nutrients and vitamins. One would therefore expect that there would be a critical link between alterations of caloric intake and resultant hepatic function. Thus it has been shown that CR protects the liver from a wide range of environmental stressors, many of which induce damage through circulating inflammatory mediators (Kim et al., 2002; Bokov et al., 2004). PPARα has been shown to regulate hepatic responses to diverse forms of stress. Mice pre-exposed to PPARα agonists exhibit decreased cellular damage, increased tissue repair, and decreased mortality after exposure to a number of physical and chemical hepatic stressors (Anderson et al., 2002; Wheeler et al., 2003). It appears that functional PPARαs are crucial for the CR-mediated protection of the liver from damage induced by hepatotoxicants like thioacetamide. Specifically, it was demonstrated by Corton et al. (2004)that PPARα knock-out mice, in contrast to wild-type mice, were not protected from thioacetamide by CR regimes. Lipid peroxide levels, associated with oxidative cell stress in
the periphery and the central nervous system, are also significantly increased in aging. PPARα knock-out mice show a marked elevation in lipid peroxidation products compared to wild-type mice (Poynter and Daynes, 1998). Thus PPARα may influence aging through the regulation of multiple damage and repair processes after exposure to a plethora of endogenous or environmental stressors.
PGC-1 isoforms are transcriptionally or posttranslationally regulated in mammals by several signaling pathways implicated in the connection between CR/IF and life-span extension. These include forkhead box “other” (FoxO) transcription factors (through an insulin/insulin-like growth factor-I -dependent pathway), glucagon-stimulated cellular AMP (cAMP) response element binding protein (CREB), stress-activated protein kinases (p38 and c-jun N-terminal kinase) and unsurprisingly SIRT1. We shall discuss next how these factors interact to control the molecular mechanisms of CR/IF that impact upon translation to healthy aging.
4.9. FoxO transcription factors
In mammals, insulin and IGF-I bind to either insulin or IGF-1 receptors activating multiple signaling pathways. With respect to the aging process and the amelioration of degenerative disorders it seems that the most important pathway entrained by insulin/IGF-1 is the canonical phosphatidylinositol 3-kinase (PI3K) and serine–threonine protein kinases (Akt-1/Akt-2/protein kinase B [PKB]) signaling cascade. In C. elegans, this pathway determines responses to longevity and environmental stress (Guarente and Kenyon, 2000). Mutations in C. elegans which inactivate the insulin/IGF-I pathway, including Daf-2, the receptor for insulin/IGF-I or the PI3K ortholog Age-1, increase life-span as well as temperature and oxidative stresses. These effects require reversal of negative regulation of the stress resistance factor, Daf-16 (Libina et al., 2003). Daf-16 encodes a transcription factor containing a “forkhead” DNA binding domain. Overexpression of Daf-16 in worms (Henderson and Johnson, 2001) or an ortholog in flies (Giannakou et al., 2004) significantly extends their life-span. Daf-16 regulates the expression of an array of genes involved in xenobiotic metabolism and stress resistance (Murphy et al., 2003). Mammalian homologs of Daf-16 fall into the family of FoxO factors. There are four main groups of mammalian FoxOs, FoxO1, FoxO3, FoxO4 and FoxO6. FoxO transcription factors belong to the larger Forkhead family of proteins, a family of transcriptional regulators characterized by the conserved ‘forkhead box’ DNA-binding domain (Kaestner et al., 2000). These FoxO proteins control a wide array of genes that all are linked by a common mechanism in that they serve to control energy metabolim in the organism in response to environmental changes, e.g. restriction of available food. For example FoxOs control genes involved in glucose metabolism (glucose 6-phosphatase and
phosphoenolpyruvate carboxylase: Nakae et al., 2001; Yeagley et al., 2001); cell death (Fas-ligand), reactive oxygen species detoxification (catalse and manganese superoxide dismutase, Kops et al., 2002) and DNA repair (growth arrest and DNA damage-inducible protein 45 and damage-specific DNA-binding protein 1, Tran et al., 2002).Insulin receptor stimulation, during caloric intake, leads to activation of the PI3K/Akt pathway and resultant phosphorylation of FoxOs in mammals. Phosphorylated FoxO factors are recognized by 14-3-3 proteins which facilitate their transport out of the nucleus, reducing their transcriptional activity. Thus upon CR/IF there is a complex interplay between activation and inactivation of these FoxO factors. There are potentially beneficial effects of FoxO activation and inactivation depending upon the prevailing cellular conditions. Mammalian FoxO family members carry out functions that determine cell survival during times of stress including regulation of apoptosis, cell-cycle checkpoint control, and oxidative stress resistance (Coffer, 2003; Furukawa-Hibi et al., 2002). Activation of FoxO3 or FoxO4 leads to increases in cell-cycle G1 arrest (van der Horst et al., 2004) and increases in apoptosis (Motta et al., 2004) presumably as a way to eliminate cells damaged by oxidative stress. Thus alterations in the capacity to activate the PI3K/Akt pathways can have dramatic effects upon cell survivability and this process may be critical in transferring the positive effects of CR/IF to the organism. CR uncouples insulin/IGF-I signaling to FoxO factors by markedly reducing plasma IGF-I and insulin levels in rats (Sonntag et al., 1999). These decreases in circulating insulin/IGF-I levels result in decreased Akt phosphorylation in liver (Al-Regaiey et al., 2005) and decreased PI3K expression in muscle (Argentino et al., 2005). In addition there is a compensatory increase in the expression of FoxO family members by fasting (Imae et al., 2003; Furuyama et al., 2003) or CR (Al-Regaiey et al., 2005; Tsuchiya et al., 2004). Therefore, when insulin signaling is decreased, e.g. during CR/IF there are not only increases in nuclear/cytoplasmic FoxO ratios but FoxO factor expression as well (Imae et al., 2003; Furuyama et al., 2003; Al-Regaiey et al., 2005; Tsuchiya et al., 2004). Overall, multiple studies have revealed that downregulation of insulin/IGF-I signaling results in increases in the activity of FoxO factors, that critically regulate cell survival mechanisms, and that these alterations are found consistently in many diverse models of longevity among different species.Many of the genes regulated by FoxOs are similarly regulated by the tumor suppressor p53, which has led to the speculation that these two genes may work in concert to prevent both deleterious aging and tumor growth. Consistent with this possibility, p53 and FoxO are both phosphorylated and acetylated in response to oxidative stress stimuli and UV radiations (Vousden and Lu, 2002; Brunet et al., 2004). In addition, both p53 and FoxOs bind to SIRT1 deacetylase (Luo et al., 2001; Vaziri et al., 2001). FoxO and p53 seem
to be functionally linked as p53 can inhibit FoxO function by inducing serum and glucocorticoid induced kinase (SGK) -mediated phosphorylation of FoxO3 resulting in its relocation from the nucleus to the cytoplasm (You et al., 2004). FoxO3 has been found to prevent p53 from repressing SIRT1 gene expression. FoxO-induced repression of p53 appears to be mediated by the direct interaction between FoxO3 and p53 (Nemoto et al., 2004). That FoxO factors induce SIRT1 expression is consistent with the observation that SIRT1 expression is increased in rodent tissues when insulin and IGF-1 are lowered by CR (Cohen et al., 2004). In turn, SIRT1 itself can bind to and deacetylate p53 and FoxO transcription factors, controlling their activity. Mice harboring a mutation, which results in the activation of p53, display a significant reduction of life-span and exhibit signs of premature aging (Tyner et al., 2002). Interestingly, while activation of p53 in these mouse models reduces life-span, p53 activation still allows an increased resistance to cancer (Tyner et al., 2002), demonstrating that p53 causes tumor suppression at the expense of longevity.One of the most important recent fields of caloric restriction study is the demonstration that CR may be able to prevent the generation of multiple forms of cancer itself. For example, in mice with genetically attenuated p53 levels CR increased the latency of spontaneous tumor development (mostly lymphomas) by approximately 75% (Hursting et al., 2001). It is therefore clear that there is a subtle and complicated relationship between these related factors that are linked together by changes in dietary energy intake.In addition to negative regulation by insulin/IGF-1 signaling and p53, FoxO factors are regulated by the CREB binding protein (CBP) and a related protein, p300. Interestingly, cellular overexpression of CBP (Daitoku et al., 2004) or p300 (Fukuoka et al., 2003) enhances the ability of FoxO factors to activate functional gene expression. SIRT1 again seems to play a central role in adaptive changes to energy regulation as it can reverse the negative regulation of FoxO family members by CBP. Like PGC-1, SIRT1 levels are increased during CR in rat liver and are negatively regulated by insulin and IGF-I (Cohen et al., 2004). Additionally, the related family member SIRT3, a mitochondrial protein, exhibits increased expression in white and brown fat upon CR (Shi et al., 2005).FoxOs seem to exist at a nexus between mechanisms that connect cellular stress responses to eventual survival mechanisms. For instance the stress-related protein kinase cJun N-terminal kinase 1 (JNK-1), which serves as a molecular sensor for various stressors actively can control FoxO transcriptional action. In C. elegans, JNK-1 directly interacts with and phosphorylates the FoxO homologue Daf-16, and in response to heat stress, JNK-1 promotes the translocation of Daf-16 into the nucleus. Overexpression of JNK-1 in C. elegans leads to increases in life-span and increased survival after heat stress (Oh et al., 2005). In D. melanogaster as well, mild activation

of JNK leads to increased stress tolerance and longevity (Wang et al., 2003) dependent on an intact FoxO (Wang et al., 2005).
In conclusion it seems that FoxO transcription factors are promising candidates to serve as molecular links between dietary modifications and longevity. In conditions such as CR/IF where the circulating levels of insulin/IGF-1 are attenuated to improve euglycemia, FoxO nuclear translocation results in the upregulation of a series of target genes that promote cell cycle arrest, stress resistance, and apoptosis. External stressful stimuli also trigger the relocalization of FoxO factors into the nucleus, thus allowing an adaptive response to stress stimuli. Consistent with the notion that stress resistance is highly coupled with life-span extension, activation of FoxO transcription factors in worms and flies increases longevity. FoxO proteins translate environmental stimuli, including the stress induced by caloric restriction into changes in gene expression programs that may coordinate organismal healthy aging and eventual longevity.
Go to:
5. Caloric restriction in humans?We are approaching a comprehensive understanding of the various molecular mechanisms by which changes in caloric intake can be transferred to an enhanced survival of cells during the aging process. However the question remains whether CR and IF will have beneficial effects on humans. To date, there have been no well-controlled scientific studies to determine the effects of long-term CR on humans. Currently there are studies ongoing involving 30% CR in non-human primates (rhesus monkeys) and data so far from these studies look promising, in that they have supported the life- and health-extending properties of this dietary regime (Lane et al., 1995, 1996).
However, the excessive loss of body fat and the concomitant decline in sex steroids can lead to menstrual irregularities, amenorrhea, bone thinning and the development of osteoporosis in females. Perhaps a variation of the CR/IF protocols in which there is a milder caloric restriction combined with a change in feeding frequency may have a greater likelihood of compliance amongst human subjects. Hopefully this more gentle alteration of dietary food intake will still retain the benefits of the experimental regimes employed so far. It is worth noting that to date most studies using CR have compared the beneficial effects of CR to overweight (or even obese) age-matched control animals. It is unclear whether animals with a healthy bodyweight, that are able to partake in regular exercise and have some form of mental stimulation (as they would do in the wild), would benefit from a CR regime. Recent studies carried out with human subjects, subject to 25% CR, are however attempting to address this as they are employing control subjects with normal body-mass indices.

The development of a chemical CR mimetic may be a promising therapeutic avenue for the treatment of neurodegenerative diseases and to delay the aging process, as it would provide similar health benefits to CR (such as extending health- and life-span), while circumventing the long-term need to reduce food intake. However, it remains to be seen whether a CR mimetic would be a feasible drug to produce, especially since the appreciation of the processes whereby CR exerts its protective effects are still somewhat incomplete and the underlying mechanisms are proving to be very complex. One must also not discount the psychological effects of food intake in higher, more introspective, organisms such as humans. We possess an almost unique emotional connection with a huge variety of foodstuffs. Therefore removal of this psychological succour, during a CR/IF-like regime may partially counteract the physiological benefits of these paradigms.
The main factor that may negate the widespread implementation of CR/IF as an effective geronto-therapeutic is potentially the modern Western lifestyle of near constant work and persistently high stress levels. Hence, to build the society and technological advances that we are used to, we have left behind the feeding patterns of our ancient ancestors in favor of constant mental activity and limited physical exercise. Due to increases in our day to day activity we have an increased energy (mainly glucose) requirement while our physiology is largely still geared to a feast and famine pattern of energy intake characteristic of our hunter-gatherer homo sapiens ancestors. This dilemma between our modern society/behavior and our ancient physiology will represent a recurring problem for gerontology for years to come. Hopefully, with our rapidly advancing appreciation of our aging process we will not need to wait for our physiological evolution to catch up with our lifestyle.
Go to:
Acknowledgement
This work was supported by the National Institute on Aging Intramural Research Program.
Go to:
References1. Allison DB, Miller RA, Austad SN, Bouchard C, Leibel R, Klebanov S,
Johnson T, Harrison DE. Genetic variability in responses to caloric restriction in animals and in regulation of metabolism and obesity in humans. J. Gerontol. A Biol. Sci. Med. Sci. 2001;56:55–65. [PubMed]
2. Al-Regaiey KA, Masternak MM, Bonkowski M, Sun L, Bartke A. Long-lived growth hormone receptor knockout mice: interaction of reduced

IGF-1/insulin signaling and caloric restriction.Endocrinology. 2005;146:851–860. [PubMed]
3. Anderson SP, Yoon L, Richard EB, Dunn CS, Cattley RC, Corton JC. Delayed liver regeneration in peroxisome proliferator-activated receptor-alpha-null mice. Hepatology. 2002;36:544–554.[PubMed]
4. Anson RM, Guo Z, de Cabo R, Iyun T, Rios M, Hagepanos A, et al. Intermittent fasting dissociates beneficial effects of dietary restriction on glucose metabolism and neuronal resistance to injury from calorie intake. Proc. Natl. Acad. Sci. U.S.A. 2003;100:6216–6220.[PMC free article] [PubMed]
5. Argentino DP, Dominici FP, Munoz MC, Al-Regaiey K, Bartke A, Turyn D. Effects of long-term caloric restriction on glucose homeostasis and on the first steps of the insulin signaling system in skeletal muscle of normal and Ames dwarf (Prop1(df)/Prop1(df)) mice. Exp. Gerontol.2005;40:27–35. [PubMed]
6. Barzilai N, Gupta G. Revisiting the role of fat mass in the life extension induced by caloric restriction. J. Gerontol. A Biol. Sci. Med. Sci. 1999;54:B89–B96. [PubMed]
7. Beere HM, Wolf BB, Cain K, Mosser DD, Mahboubi A, Kuwana T, Tailor P, Morimoto RI, Cohen GM, Green DR. Heat-shock protein 70 inhibits apoptosis by preventing recruitment of procaspase-9 to the Apaf-1 apoptosome. Nat. Cell. Biol. 2000;2:469–475. [PubMed]
8. Berry RJ, Bronson FH. Life-history and bioeconomy of the house mouse. Biol. Rev. Cambridge Philos. Soc. 1992;67:519–550. [PubMed]
9. Bjorntorp P. Metabolic implications of body fat distribution. Diab. Care. 1991;14:1132–1143.
10. Bough KJ, Valiyil R, Han FT, Eagles DA. Seizure resistance is dependent upon age and calorie restriction in rats fed a ketogenic diet. Epilepsy Res. 1999;35:21–28. [PubMed]
11. Brask J, Kristensson K, Hill RH. Exposure to interferon-gamma during synaptogenesis increases inhibitory activity after a latent period in cultured rat hippocampal neurons. Eur. J. Neurosci.2004;19:3193–3201. [PubMed]
12. Bruce-Keller AJ, Umberger G, McFall R, Mattson MP. Food restriction reduces brain damage and improves behavioral outcome following excitotoxic and metabolic insults. Ann. Neurol.1999a;45:8–15. [PubMed]
13. Brunet A, Sweeney LB, Sturgill JF, Chua KF, Greer PL, Lin Y, Tran H, Ross SE, Mostoslavsky R, Cohen HY, Hu LS, Cheng HL, Jedrychowski MP, Gygi SP, Sinclair DA, Alt FW, Greenberg ME. Stress-dependent regulation of FOXO transcription factors by the SIRT1 deacetylase. Science.2004;303:2011–2015. [PubMed]
14. Bluher M, Kahn BB, Kahn CR. Extended longevity in mice lacking the insulin receptor in adipose tissue. Science. 2003;299:572–574. [PubMed]
15. Bokov A, Chaudhuri A, Richardson A. The role of oxidative damage and stress in aging. Mech. Ageing Dev. 2004;125:811–826. [PubMed]
16. Bordone L, Guarente L. Calorie restriction, SIRT1 and metabolism: understanding longevity. Nat. Rev. Mol. Cell Biol. 2005;6:298–305. [PubMed]
17. Bruce-Keller AJ, Umberger G, McFall R, Mattson MP. Food restriction reduces brain damage and improves behavioral outcome following excitotoxic and metabolic insults. Ann. Neurol.1999b;45:8–15. [PubMed]
18. Butterfield DA, Howard BJ, Yatin S, Allen KL, Carney JM. Free radical oxidation of brain proteins in accelerated senescence and its modulation by N-tert-butyl-alpha-phenylnitrone. Proc. Natl. Acad. Sci. U.S.A. 1997;94:674–678. [PMC free article] [PubMed]
19. Cakatay U, Telci A, Kayali R, Tekeli F, Akcay T, Sivas A. Relation of oxidative protein damage and nitrotyrosine levels in the aging rat brain. Exp. Gerontol. 2001;36:221–229. [PubMed]
20. Cefalu WT, Bell-Farrow AD, Wang ZQ, Sonntag WE, Fu MX, Baynes JW, Thorpe SR. Caloric restriction decreases age-dependent accumulation of the glycoxidation products, N epsilon-(carboxymethyl)-lysine and pentosidine, in rat skin collagen. J. Gerontol. A Biol. Sci. Med. Sci.1995;50:B337–B341. [PubMed]
21. Cefalu WT, Wagner JD, Wang ZQ, Bell-Farrow AD, Collins J, Haskell D, Bechtold R, Morgan T. A study of caloric restriction and cardiovascular aging in cynomolgus monkeys (Macaca fascicularis): a potential model for aging research. J. Gerontol. Biol. Sci. 1997;52A:B10–B19.
22. Chapman T, Partridge L. Female fitness in Drosophila melanogaster and interaction between the effect of nutrition and of encounter rate with males. Proc. R. Soc. Lond. Ser. B Biol. Sci.1996;263:755–759.
23. Clancy DJ, Gems D, Harshman LG, Oldham S, Stacker H, Hafen E, Leevers SJ, Partridge L. Extension of life span by loss of CHICO, a Drosophila insulin receptor substrate protein. Science.2001;292:104–106. [PubMed]
24. Coffer P. OutFOXing the grim reaper: novel mechanisms regulating longevity by forkhead transcription factors. Sci. 2003 STKE PE39.
25. Cohen HY, Miller C, Bitterman KJ, Wall NR, Hekking B, Kessler B, Howitz KT, Gorospe M, de Cabo R, Sinclair DA. Calorie restriction promotes mammalian cell survival by inducing the SIRT1 deacetylase. Science. 2004;305:390–392. [PubMed]
26. Combs TP, Berg AH, Rajala MW, Klebanov S, Iyengar P, Jimenez-Chillaron JC, Patti ME, Klein SL, Weinstein RS, Scherer PE. Sexual
differentiation, pregnancy, calorie restriction, and aging affect the adipocyte-specific secretory protein adiponectin. Diabetes. 2003;52:268–276. [PubMed]
27. Corton JC, Apte U, Anderson SP, Limaye P, Yoon L, Latendresse J, Dunn C, Everitt JI, Voss KA, Swanson C, Kimbrough C, Wong JS, Gill SS, Chandraratna RAS, Kwak M-K, Kensler TW, Stulnig TM, Steffensen KR, Gustafsson J-A, Mehendale HA. Mimetics of caloric restriction include agonists of lipid-activated nuclear receptors. J. Biol. Chem. 2004;279:46204–46212. [PubMed]
28. Culmsee C, Monnig J, Kemp BE, Mattson MP. AMP-activated protein kinase is highly expressed in neurons in the developing rat brain and promotes neuronal survival following glucose deprivation. J. Mol. Neurosci. 2001;17:45–58. [PubMed]
29. Daitoku H, Hatta M, Matsuzaki H, Aratani S, Ohshima T, Miyagishi M, Nakajima T, Fukamizu A. Silent information regulator 2 potentiates Foxo1-mediated transcription through its deacetylase activity. Proc. Natl. Acad. Sci. U.S.A. 2004;101:10042–10047. [PMC free article][PubMed]
30. Duan W, Lee J, Guo Z, Mattson MP. Dietary restriction stimulates BDNF production in the brain and thereby protects neurons against excitotoxic injury. J. Mol. Neurosci. 2001;16:1–12.[PubMed]
31. Duan W, Mattson MP. Dietary restriction and 2-deoxyglucose administration improve behavioral outcome and reduce degeneration of dopaminergic neurons in models of Parkinson's disease. J. Neurosci. Res. 1999;57:195–206. [PubMed]
32. Duan W, Guo Z, Jiang H, Ware M, Li XJ, Mattson MP. Dietary restriction normalizes glucose metabolism and BDNF levels, slows disease progression, and increases survival in huntingtin mutant mice. Proc. Natl. Acad. Sci. U.S.A. 2003;100:2911–2916. [PMC free article] [PubMed]
33. Dubey A, Forster MJ, Lal H, Sohal RS. Effect of age and caloric intake on protein oxidation in different brain regions and on behavioral functions of the mouse. Arch. Biochem. Biophys.1996;333:189–397. [PubMed]
34. Dunn SE, Kari FW, French J, Leininger JR, Travlos G, Wilson R, Barrett JC. Dietary restriction reduces insulin-like growth factor I levels, which modulates apoptosis, cell proliferation, and tumor progression in p53-deficient mice. Cancer Res. 1997;57:4667–4672. [PubMed]
35. Escher P, Braissant O, Basu-Modak S, Michalik L, Wahli W, Desvergne B. Rat PPARs: quantitative analysis in adult rat tissues and regulation in fasting and refeeding. Endocrinology.2001;142:4195–4202. [PubMed]
36. Feinstein R, Kanety H, Papa MZ, Lunenfeld B, Karasik A. Tumor necrosis factor-alpha suppresses insulin-induced tyrosine
phosphorylation of insulin receptor and its substrates. J. Biol. Chem.1993;268:26055–26058. [PubMed]
37. Frydman J. Folding of newly translated proteins in vivo: the role of molecular chaperones. Ann. Rev. Biochem. 2001;70:603–647. [PubMed]
38. Fukuoka M, Daitoku H, Hatta M, Matsuzaki H, Umemura S, Fukamizu A. Negative regulation of forkhead transcription factor AFX (Foxo4) by CBP-induced acetylation. Int. J. Mol. Med.2003;12:503–508. [PubMed]
39. Furukawa K, Barger SW, Blalock EM, Mattson MP. Activation of K+ channels and suppression of neuronal activity by secreted beta-amyloid precursor protein. Nature. 1996;379:74–78. [PubMed]
40. Furukawa-Hibi Y, Yoshida-Araki K, Ohta T, Ikeda K, Motoyama N. FOXO forkhead transcription factors induce G(2)-M checkpoint in response to oxidative stress. J. Biol. Chem.2002;277:26729–26732. [PubMed]
41. Furuyama T, Kitayama K, Yamashita H, Mori N. Forkhead transcription factor FOXO1 (FKHR)-dependent induction of PDK4 gene expression in skeletal muscle during energy deprivation.Biochem. J. 2003;375:365–371. [PMC free article] [PubMed]
42. Gething MJ. Role and regulation of the ER chaperone BiP. Semin. Cell. Dev. Biol. 1999;10:465–472. [PubMed]
43. Giannakou ME, Goss M, Junger MA, Hafen E, Leevers SJ, Partridge L. Long-lived Drosophilawith overexpressed dFOXO in adult fat body. Science. 2004;305:361. [PubMed]
44. Gilbert DL, Pyzik PL, Freeman JM. The ketogenic diet: seizure control correlates better with serum beta-hydroxybutyrate than with urine ketones. J. Child Neurol. 2000;15:787–790.[PubMed]
45. Goodrick CL, Ingram DK, Reynolds MA, Freeman JR, Cider NL. Effects of intermittent feeding upon growth and life span in rats. Gerontology. 1982;28:233–241. [PubMed]
46. Gremlich S, Nolan C, Roduit R, Burcelin R, Peyot M-L, Delghingaro-Augusto V, Desvergne B, Michalik L, Prentki M, Wahli W. Pancreatic islet adaptation to fasting is dependent on peroxisome proliferator-activated receptor atranscriptional up-regulation of fatty acid oxidation.Endocrinology. 2005;146:375–382. [PubMed]
47. Griffin WS. Inflammation and neurodegenerative diseases. Am. J. Clin. Nutr. 2006;83:470–474.
48. Guarente L, Kenyon C. Genetic pathways that regulate ageing in model organisms. Nature.2000;408:255–262. [PubMed]
49. Hart RW, Turturro A. Evolution and dietary restriction. Exp. Gerontol. 1998;33:53–60.[PubMed]
50. Henderson ST, Johnson TE. Daf-16 integrates developmental and environmental inputs to mediate aging in the nematode Caenorhabditis elegans. Curr. Biol. 2001;11:1975–1980.[PubMed]
51. Herzig S, Long F, Jhala US, Hedrick S, Quinn R, Bauer A, Rudolph D, Schutz G, Yoon C, Puigserver P, Spiegelman B, Montminy M. CREB regulates hepatic gluconeogenesis through the coactivator PGC-1. Nature. 2001;413:179–183. [PubMed]
52. Houthoofd K, Braeckman BP, Lenaerts I, Brys K, De Vreese A, V an Eygen S, Vanfleteren JR. Axonic growth up-regulates mass-specific metabolic rate, stress resistance, and extends life-span in Caenorhabditis elegans. Exp. Gerontol. 2002;37:1371–1378. [PubMed]
53. Hursting SD, Perkins SN, Donehower LA, Davis BJ. Cancer prevention studies in p53-deficient mice. Toxicol. Pathol. 2001;29:137–141. [PubMed]
54. Imae M, Fu Z, Yoshida A, Noguchi T, Kato H. Nutritional and hormonal factors control the gene expression of FoxOs, the mammalian homologues of DAF-16. J. Mol. Endocrinol. 2003;30:253–262. [PubMed]
55. Imai S, Armstrong CM, Kaeberlein M, Guarente L. Transcriptional silencing and longevity protein Sir2 is an NAD-dependent histone deacetylase. Nature. 2000;403:795–800. [PubMed]
56. Improta T, Salvatore AM, Di Luzio A, Romeo G, Coccia EM, Calissano P. IFN-gamma facilitates NGF-induced neuronal differentiation in PC12 cells. Exp. Cell. Res. 1988;179:1–9. [PubMed]
57. Ingram DK, Reynolds MA. The relationship of bodyweight to longevity within laboratory rodent species. Basic Life Sci. 1987;42:247–282. [PubMed]
58. Ishida A, Furukawa K, Keller JN, Mattson MP. Secreted form of beta-amyloid precursor protein shifts the frequency dependency for induction of LTD, and enhances LTP in hippocampal slices.Neuroreport. 1997;8:2133–2137. [PubMed]
59. Johnson TS, Murray S, Young JB, Landsberg L. Restricted food intake limits brown adipose tissue hypertrophy in cold exposure. Life Sci. 1982;30:1423–1426. [PubMed]
60. Kaeberlein M, McVey M, Guarente L. The SIR2/3/4 complex and SIR2 alone promote longevity in Saccharomyces cerevisiae by two different mechanisms. Genes Dev. 1999;13:2570–2580.[PMC free article] [PubMed]
61. Kamei Y, Ohizumi H, Fujitani Y, Nemoto T, Tanaka T, Takahashi N, Kawada T, Miyoshi M, Ezaki O, Kakizuka A. PPARgamma coactivator 1beta/ERR ligand 1 is an ERR protein ligand, whose expression induces a high-energy expenditure and antagonizes obesity. Proc. Natl. Acad. Sci. U.S.A. 2003;100:12378–12383. [PMC free article] [PubMed]
62. Kaestner KH, Knochel W, Martinez DE. Unified nomenclature for the winged helix/forkhead transcription factors. Genes Dev. 2000;14:142–146. [PubMed]

63. Kashiwaya Y, Takeshima T, Mori N, Nakashima K, Clarke K, Veech RL. D-beta-hydroxybutyrate protects neurons in models of Alzheimer's and Parkinson's disease. Proc. Natl. Acad. Sci. U.S.A.2000;97:5440–5444. [PMC free article] [PubMed]
64. Kayo T, Allison DB, Weindruch R, Prolla TA. Influences of aging and caloric restriction on the transcriptional profile of skeletal muscle from rhesus monkeys. Proc. Natl. Acad. Sci. U.S.A.2001;98:5093–5098. [PMC free article] [PubMed]
65. Kemnitz W, Roecker EB, Weindruch R, Elson DF, Baum ST, Bergmann RN. Dietary restriction increases insulin sensitivity and lowers blood glucose in rhesus monkeys. Am. J. Physiol.1994;266:E540–E547. [PubMed]
66. Kenyon C, Chang J, Gensch A, Rudner A, Tabtiang R. A C. elegans mutant that lives twice as long as wild type. Nature. 1993;366:461–464. [PubMed]
67. Kim HJ, Kim KW, Yu BP, Chung HY. The effect of age on cyclooxygenase-2 gene expression: NF-κB activation and IκBα degradation. Free Radic. Biol. Med. 2000;28:683–692. [PubMed]
68. Kim HJ, Jung KJ, Yu BP, Cho CG, Choi JS, Chung HY. Modulation of redox-sensitive transcription factors by calorie restriction during aging. Mech. Ageing Dev. 2002;123:1589–1595.[PubMed]
69. Kops GJ, Dansen TB, Polderman PE, Saarloos I, Wirtz KW, Coffer PJ, Huang TT, Bos JL, Medema RH, Burgering BM. Forkhead transcription factor FOXO3a protects quiescent cells from oxidative stress. Nature. 2002;419:316–321. [PubMed]
70. Kressler D, Schreiber SN, Knutti D, Kralli A. The PGC-1-related protein PERC is a selective coactivator of estrogen receptor alpha. J. Biol. Chem. 2002;277:13918–13925. [PubMed]
71. Kroetz DL, Yook P, Costet P, Bianchi P, Pineau T. Peroxisome proliferator-activated receptor alpha controls the hepatic CYP4A induction adaptive response to starvation and diabetes. J. Biol. Chem. 1998;273:31581–31589. [PubMed]
72. Landry J, Sutton A, Tafrov ST, Heller RC, Stebbins J, Pillus L, Sternglanz R. The silencing protein SIR2 and its homologs are NAD-dependent protein deacetylases. Proc. Natl. Acad. Sci. U.S.A.2000;97:5807–5811. [PMC free article] [PubMed]
73. Lane MA, Baer DJ, Rumpler WV, Weindruch R, Ingram DK, Tilmont EM, Cutler RG, Roth GS. Calorie restriction lowers body temperature in rhesus monkeys, consistent with a postulated anti-aging mechanism in rodents. Proc. Natl. Acad. Sci. U.S.A. 1996;93:4159–4164. [PMC free article][PubMed]
74. Lane MA, Ball SS, Ingram DK, Cutler RG, Engel J, Read V, Roth GS. Diet restriction in rhesus monkeys lowers fasting glucose-stimulated
glucoregulatory end points. Am. J. Physiol.1995;268:E941–E948. [PubMed]
75. Lee CK, Weindruch R, Prolla TA. Gene-expression profile of the ageing brain in mice. Nat. Genet.2000a;25:294–297. [PubMed]
76. Lee J, Bruce-Keller AJ, Kruman Y, Chan SL, Mattson MP. 2-deoxy-D-glucose protects hippocampal neurons against excitotoxic and oxidative injury: evidence for the involvement of stress proteins. J. Neurosci. Res. 1999;57:48–61. [PubMed]
77. Lee J, Herman JP, Mattson MP. Dietary restriction selectively decreases glucocorticoid receptor expression in the hippocampus and cerebral cortex of rats. Exp. Neurol. 2000b;166:435–441.[PubMed]
78. Lee J, Duan W, Mattson MP. Evidence that brain-derived neurotrophic factor is required for basal neurogenesis and mediates, in part, the enhancement of neurogenesis by dietary restriction in the hippocampus of adult mice. J. Neurochem. 2002;82:1367–1375. [PubMed]
79. Lee J, Kim SJ, Son TG, Chan SL, Mattson MP. Interferon-gamma is up-regulated in the hippocampus in response to intermittent fasting and protects hippocampal neurons against excitotoxicity. J. Neurosci. Res. 2006 E-publication.
80. Legradi G, Emerson CH, Ahima RS, Flier JS, Lechan RM. Leptin prevents fasting-induced suppression of prothyrotropin-releasing hormone messenger ribonucleic acid in neurons of the hypothalamic paraventricular nucleus. Endocrinology. 1997;138:2569–2576. [PubMed]
81. Leone TC, Weinheimer CJ, Kelly DP. A critical role for the peroxisome proliferator-activated receptor alpha (PPARalpha) in the cellular fasting response: the PPARalpha-null mouse as a model of fatty acid oxidation disorders. Proc. Natl. Acad. Sci. U.S.A. 1999;96:7473–7478.[PMC free article] [PubMed]
82. Libina N, Berman JR, Kenyon C. Tissue-specific activities of C. elegans DAF-16 in the regulation of lifespan. Cell. 2003;115:489–502. [PubMed]
83. Lin J, Puigserver P, Donovan J, Tarr P, Spiegelman BM. Peroxisome proliferator-activated receptor gamma coactivator 1beta (PGC-1beta), a novel PGC-1-related transcription coactivator associated with host cell factor. J. Biol. Chem. 2002a;277:1645–1648. [PubMed]
84. Lin J, Wu PH, Tarr PT, Lindenberg KS, St-Pierre J, Zhang CY, Mootha VK, Jager S, Vianna CR, Reznick RM, Cui L, Manieri M, Donovan MX, Wu Z, Cooper MP, Fan MC, Rohas LM, Zavacki AM, Cinti S, Shulman GI, Lowell BB, Krainc D, Spiegelman BM. Defects in adaptive energy metabolism with CNS-linked hyperactivity in PGC-1alpha null mice. Cell. 2004a;119:121–135.[PubMed]
85. Lin SJ, Ford E, Haigis M, Liszt G, Guarente L. Calorie restriction extends yeast life span by lowering the level of NADH. Genes. Dev. 2004;18:12–16. [PMC free article] [PubMed]
86. Lin SJ, Kaeberlein M, Andalis AA, Sturtz LA, Defossez PA, Culotta VC, Fink GR, Guarente L. Calorie restriction extends Saccharomyces cerevisiae lifespan by increasing respiration. Nature.2002;418:344–348. [PubMed]
87. Ling C, Poulsen P, Carlsson E, Ridderstrale M, Almgren P, Wojtaszewski J, Beck-Nielsen H, Groop L, Vaag A. Multiple environmental and genetic factors influence skeletal muscle PGC-1alpha and PGC-1beta gene expression in twins. J. Clin. Invest. 2004;114:1518–1526.[PMC free article] [PubMed]
88. Lowenstein DH, Chan PH, Miles MF. The stress protein response in cultured neurons: characterization and evidence for a protective role in excitotoxicity. Neuron. 1991;7:1053–1060.[PubMed]
89. Luo J, Nikolaev AY, Imai S, Chen D, Su F, Shiloh A, Guarente L, Gu W. Negative control of p53 by Sir2alpha promotes cell survival under stress. Cell. 2001;107:137–148. [PubMed]
90. Mascarucci P, Taub D, Saccani S, Paloma MA, Dawson H, Roth GS, Lane MA, Ingram DK. Cytokine responses in young and old rhesus monkeys: effect of caloric restriction. J. Interferon. Cytokine Res. 2002;22:565–571. [PubMed]
91. Masoro EJ, McCarter RJM, Katz MS, McMahan CA. Dietary restriction alters the characteristics of glucose fuel use. J. Gerontol. Biol. Sci. 1992;47:B202–B208.
92. Maswood N, Young J, Tilmont E, Zhang Z, Gash DM, Gerhardt GA, Grondin R, Roth GS, Mattison J, Lane MA, Carson RE, Cohen RM, Mouton PR, Quigley C, Mattson MP, Ingram DK. Caloric restriction increases neurotrophic factor levels and attenuates neurochemical and behavioral deficits in a primate model of Parkinson's disease. Proc. Natl. Acad. Sci. U.S.A.2004;101:18171–18176. [PMC free article] [PubMed]
93. Mattson MP. Experimental models of Alzheimer's disease. Sci. Med. 1998 March/April;:16–25.
94. McCay CM, Crowell MF, Maynard LA. The effect of retarded growth upon the length of life-span and upon the ultimate body size. J. Nutr. 1935;10:63–79.
95. Means LW, Higgins JL, Fernandez TJ. Midlife onset of dietary restriction extends life and prolongs cognitive-functioning. Physiol. Behav. 1993;54:503–508. [PubMed]
96. Meier U, Gressner AM. Endocrine regulation of energy metabolism: review of pathobiochemical and clinical chemical aspects of leptin, ghrelin, adiponectin, and resistin. Clin. Chem.2004;50:1511–1525. [PubMed]
97. Mitchell GA, Kassovska-Bratinova S, Boukaftane Y, Robert MF, Wang SP, Ashmarina L, Lambert M, Lapierre P, Potier E. Medical aspects of ketone body metabolism. Clin. Invest. Med.1995;18:193–216. [PubMed]
98. Motta MC, Divecha N, Lemieux M, Kamel C, Chen D, Gu W, Bultsma Y, McBurney M, Guarente L. Mammalian SIRT1 represses forkhead transcription factors. Cell. 2004;116:551–563.[PubMed]
99. Munch G, Thome J, Foley P, Schinzel R, Riederer P. Advanced glycation end products in ageing and Alzheimer's disease. Brain Res. Rev. 2000;23:134–143. [PubMed]
100. Murphy CT, McCarroll SA, Bargmann CI, Fraser A, Kamath RS, Ahringer J, Li H, Kenyon C. Genes that act downstream of DAF-16 to influence the lifespan of Caenorhabditis elegans.Nature. 2003;424:277–283. [PubMed]
101. Musi N, Hayashi T, Fujii N, Hirshman MF, Witters LA, Goodyear LJ. AMP-activated protein kinase activity and glucose uptake in rat skeletal muscle. Am. J. Physiol. Endocrinol. Metab.2001;280:677–684.
102. Nakae J, Kitamura T, Silver DL, Accili D. The forkhead transcription factor Foxo1 (Fkhr) confers insulin sensitivity onto glucose-6-phosphatase expression. J. Clin. Invest. 2001;108:1359–1367.[PMC free article] [PubMed]
103. Nemoto S, Fergusson MM, Finkel T. Nutrient availability regulates SIRT1 through a forkhead-dependent pathway. Science. 2004;306:2105–2108. [PubMed]
104. Oh SW, Mukhopadhyay A, Svrzikapa N, Jiang F, Davis RJ, Tissenbaum HA. JNK regulates lifespan in Caenorhabditis elegans by modulating nuclear translocation of forkhead transcription factor/DAF-16. Proc. Natl. Acad. Sci. U.S.A. 2005;102:4494–4499. [PMC free article] [PubMed]
105. Pajvani UB, Scherer PE. Adiponectin: systemic contributor to insulin sensitivity. Curr. Diab. Rep.2003;3:207–213. [PubMed]
106. Papaioannou N, Tooten PC, van Ederen AM, Bohl JR, Rofina J, Tsangaris T, Gruys E. Immunohistochemical investigation of the brain of aged dogs. I. Detection of neurofibrillary tangles and of 4-hydroxynonenal protein, an oxidative damage product, in senile plaques.Amyloid. 2001;8:11–21. [PubMed]
107. Parker JA, Arango M, Abderrahmane S, Lambert E, Tourette C, Catoire H, Neri C. Resveratrol rescues mutant polyglutamine cytotoxicity in nematode and mammalian neurons. Nat. Genet.2005;37:349–350. [PubMed]
108. Picard F, Kurtev M, Chung N, Topark-Ngarm A, Senawong T, Machado De Oliveira R, Leid M, McBurney MW, Guarente L. Sirt1 promotes fat mobilization in white adipocytes by repressing PPAR-gamma. Nature. 2004;429:771–776. [PMC free article] [PubMed]
109. Poynter ME, Daynes RA. Peroxisome proliferator-activated receptor alpha activation modulates cellular redox status, represses nuclear factor-kappaB signaling, and reduces inflammatory cytokine production in aging. J. Biol. Chem. 1998;273:32833–32841. [PubMed]
110. Puigserver P, Spiegelman BM. Peroxisome proliferator-activated receptor-gamma coactivator 1 alpha (PGC-1 alpha): transcriptional coactivator and metabolic regulator. Endocr. Rev.2003;24:78–90. [PubMed]
111. Puigserver P, Wu Z, Park CW, Graves R, Wright M, Spiegelman BM. A cold-inducible coactivator of nuclear receptors linked to adaptive thermogenesis. Cell. 1998;92:829–839. [PubMed]
112. Ravagnan L, Gurbuxani S, Susin SA, Maisse C, Dauga E, Zamzami N, Mak T, Jaattela M, Penninger JM, Garrido C, Kroemer G. Heat-shock protein 70 antagonizes apoptosis-inducing factor. Nat. Cell. Biol. 2001;3:839–843. [PubMed]
113. Rine J, Herskowitz I. Four genes responsible for a position effect on expression from HML ANS HMR in Saccharomyces cerevisiae. Genetics. 1987;116:9–22. [PMC free article] [PubMed]
114. Shi T, Wang F, Stieren E, Tong Q. SIRT3, a mitochondrial Sirtuin deacetylase, regulates mitochondrial function and thermogenesis in Brown adipocytes. J. Biol. Chem. 2005;280:13560–13567. [PubMed]
115. Sloane JA, Hollander W, Moss MB, Rosene DL, Abraham CR. Increased microglial activation and protein nitration in white matter of the aging monkey. Neurobiol. Aging. 1999;20:395–405.[PubMed]
116. Sohal RS, Agarwal S, Candas M, Forster MJ, Lal H. Effect of age and caloric restriction on DNA oxidative damage in different tissues of C57BL/6 mice. Mech. Ageing. Dev. 1994;76:215–224.[PubMed]
117. Sohal RS, Weindruch R. Oxidative stress, caloric restriction, and aging. Science. 1996;273:59–63.[PMC free article] [PubMed]
118. Sonntag WE, Lynch CD, Cefalu WT, Ingram RL, Bennett SA, Thornton PL, Khan AS. Pleiotropic effects of growth hormone and insulin-like growth factor (IGF)-1 on biological aging: inferences from moderate caloric-restricted animals. J. Gerontol. Biol. Sci. 1999;54:521–538.
119. Sprott RL. Diet and calorie restriction. Exp. Gerontol. 1997;32:205–214. [PubMed]
120. Stephens JM, Lee J, Pilch PF. Tumor necrosis factor-α-induced insulin resistance in 3T3-L1 adipocytes is accompanied by a loss of insulin receptor substrate-1 and GLUT4 expression without a loss of insulin receptor-mediated signal transduction. J. Biol. Chem. 1997;272:971–976.[PubMed]
121. Sugden MC, Bulmer K, Gibbons GF, Holness MJ. Role of peroxisome proliferator-activated receptor-alpha in the mechanism underlying changes in renal pyruvate dehydrogenase kinase isoform 4 protein
expression in starvation and after refeeding. Arch. Biochem. Biophys.2001;395:246–252. [PubMed]
122. Tissenbaum HA, Guarente L. Increased dosage of a sir-2 gene extends lifespan in Caenorhabditis elegans. Nature. 2001;410:227–230. [PubMed]
123. Tontonoz P, Hu E, Graves RA, Budavari AI, Spiegelman BM. mPPARγ 2: tissue-specific regulator of an adipocyte enhancer. Genes. Dev. 1994;8:1224–1234. [PubMed]
124. Tran H, Brunet A, Grenier JM, Datta SR, Fornace AJ, Jr., DiStefano PS, Chiang LW, Greenberg ME. DNA repair pathway stimulated by the forkhead transcription factor FOXO3a through the Gadd45 protein. Science. 2002;296:530–534. [PubMed]
125. Tsuchiya T, Dhahbi JM, Cui X, Mote PL, Bartke A, Spindler SR. Additive regulation of hepatic gene expression by dwarfism and caloric restriction. Physiol. Genom. 2004;17:307–315.
126. Tyner SD, Venkatachalam S, Choi J, Jones S, Ghebranious N, Igelmann H, Lu X, Soron G, Cooper B, Brayton C, Hee Park S, Thompson T, Karsenty G, Bradley A, Donehower LA. p53 mutant mice that display early ageing-associated phenotypes. Nature. 2002;415:45–53.[PubMed]
127. van der Horst A, Tertoolen LG, de Vries-Smits LM, Frye RA, Medema RH, Burgering BM. FOXO4 is acetylated upon peroxide stress and deacetylated by the longevity protein hSir2(SIRT1)J. Biol. Chem. 2004;279:28873–28879. [PubMed]
128. Vaziri H, Dessain SK, Ng Eaton E, Imai SI, Frye RA, Pandita TK, Guarente L, Weinberg RA. hSIR2(SIRT1) functions as an NAD-dependent p53 deacetylase. Cell. 2001;107:149–159.[PubMed]
129. Vazquez JA, Morse EL, Adibi SA. Effect of dietary fat, carbohydrate, and protein on branched-chain amino acid catabolism during caloric restriction. J. Clin. Invest. 1985;76:737–743.[PMC free article] [PubMed]
130. Vikman KS, Owe-Larsson B, Brask J, Kristensson KS, Hill RH. Interferon-gamma-induced changes in synaptic activity and AMPA receptor clustering in hippocampal cultures. Brain Res.2001;896:18–29. [PubMed]
131. Vousden KH, Lu X. Live or let die: the cell's response to p53. Nat. Rev. Cancer. 2002;2:594–604.[PubMed]
132. Wan R, Camandola S, Mattson MP. Intermittent food deprivation improves cardiovascular and neuroendocrine responses to stress in rats. J. Nutr. 2003;133:1921–1929. [PubMed]
133. Wang MC, Bohmann D, Jasper H. JNK signaling confers tolerance to oxidative stress and extends lifespan in Drosophila. Dev. Cell. 2003;5:811–816. [PubMed]
134. Wang MC, Bohmann D, Jasper H. JNK extends life span and limits growth by antagonizing cellular and organism-wide responses to insulin signaling. Cell. 2005;121:115–125. [PubMed]
135. Warrick JM, Chan HY, Gray-Board GL, Chai Y, Paulson HL, Bonini NM. Suppression of polyglutamine-mediated neurodegeneration in Drosophila by the molecular chaperone HSP70.Nat. Genet. 1999:425–428. [PubMed]
136. Weindruch R, Kayo T, Lee CK, Prolla TA. Gene expression profiling of aging using DNA microarrays. Mech. Ageing Dev. 2002;123:177–193. [PubMed]
137. Weindruch R, Sohal RS. Seminars in medicine of the Beth Israel Deaconess Medical Center: caloric intake and aging. N. Engl. J. Med. 1997;337:986–994. [PMC free article] [PubMed]
138. Weindruch R, Walford RL. In: The Retardation of Aging and Disease by Dietary Restriction.Thomas, Charles C, editors. Springfield, IL: 1988.
139. Wheeler MD, Smutney OM, Check JF, Rusyn I, Schulte-Hermann R, Thurman RG. Impaired Ras membrane association and activation in PPARalpha knockout mice after partial hepatectomy. Am. J. Physiol. Gastrointest. Liver Physiol. 2003;284:G302–G312. [PubMed]
140. Wolkow CA, Kimura KD, Lee M-S, Ruvkun G. Regulation of C. elegans life span by insulin-like signaling in the nervous system. Science. 2000;290:147–150. [PubMed]
141. Wong G, Goldshmit Y, Turnley AM. Interferon-gamma but not TNF alpha promotes neuronal differentiation and neurite outgrowth of murine adult neural stem cells. Exp. Neurol.2004;187:171–177. [PubMed]
142. Wu X, Motoshima H, Mahadev K, Stalker TJ, Scalia R, Goldstein BJ. Involvement of AMP-activated protein kinase in glucose uptake stimulated by the globular domain of adiponectin in primary rat adipocytes. Diabetes. 2003;52:207–213.
143. Yeagley D, Guo S, Unterman T, Quinn PG. Gene- and activation-specific mechanisms for insulin inhibition of basal and glucocorticoid-induced insulin-like growth factor binding protein-1 and phosphoenolpyruvate carboxykinase transcription. Roles of forkhead and insulin response sequences. J. Biol. Chem. 2001;276:33705–33710. [PubMed]
144. Yeung F, Hoberg JE, Ramsey CS, Keller MD, Jones DR, Frye RA, Mayo MW. Modulation of NF-kappaB-dependent transcription and cell survival by the SIRT1 deacetylase. EMBO J.2004;23:2369–2380. [PMC free article] [PubMed]
145. You H, Jang Y, You-Ten AI, Okada H, Liepa J, Wakeham A, Zaugg K, Mak TW. p53-dependent inhibition of FKHRL1 in response to DNA damage through protein kinase SGK1. Proc. Natl. Acad. Sci. U.S.A. 2004;101:14057–14062. [PMC free article] [PubMed]
146. Yu Z, Luo W, Fu W, Mattson MP. The endoplasmic reticulum stress-responsive protein GRP78 protects neurons against excitotoxicity and
apoptosis: suppression of oxidative stress and stabilization of calcium homeostasis. Exp. Neurol. 1999;155:302–314. [PubMed]
147. Yu ZF, Mattson MP. Dietary restriction and 2-deoxyglucose administration reduce focal ischemic brain damage and improve behavioral outcome: evidence for a preconditioning mechanism. J. Neurosci. Res. 1999;57:830–839. [PubMed]
148. Zhu M, de Cabo R, Lane MA, Ingram DK. Caloric restriction modulates early events in insulin signaling in liver and skeletal muscle of rat. Ann. N. Y. Acad. Sci. 2004;19:448–452. [PubMed]
Source: http://www.ncbi.nlm.nih.gov/pmc/articles/PMC2622429/
Modified alternate-day fasting regimens reduce cell proliferation rates to a similar extent as daily calorie restriction in mice
1. K. A. Varady * ,1, 2. D. J. Roohk * , 3. B. K. McEvoy-Hein * , 4. B. D. Gaylinn † ,5. M. O. Thorner † and 6. M. K. Hellerstein * ,1
+Author Affiliations1. *Department of Nutritional Sciences and Toxicology, University of California
at Berkeley, Berkeley, California, USA; and2.3. †Division of Endocrinology and Metabolism, Department of Internal
Medicine, University of Virginia, Charlottesville, Virginia, USA1. ↵ Correspondence: 1Correspondence: Nutritional Sciences and Toxicology, University of California
at Berkeley, Morgan Hall, Rm. 308, Berkeley, California, 94720-3104 USA. E-mail: K.A.V., [email protected]; M.K.H.,[email protected]
Next Section
Abstract
Calorie restriction (CR) and alternate-day fasting (ADF) reduce cancer risk and reduce cell proliferation rates. Whether modified ADF regimens (i.e., allowing a portion of energy needs to be consumed on the fast day) work, as well as true ADF or CR to reduce global cell proliferation rates, remains unresolved. Here, we measured the effects of true ADF, modified ADF, and daily CR on cell proliferation rates in mice. Thirty female C57BL/6J mice were randomized to one of five interventions for 4 wk: 1) CR-25% (25% reduction in daily energy intake), 2) ADF-75% (75% reduction on fast day), 3) ADF-85% (85% reduction on fast day), 4) ADF-100% (100% reduction on fast day), and 5) control (ad libitum intake). Body weights of the ADF groups did not differ from controls, whereas the CR-25% group weighed less than all other groups posttreatment. Epidermal cell proliferation decreased (P<0.01) by 29, 20, and 31% in the CR-25%, ADF-85% and ADF-100% groups, respectively, relative to controls. Proliferation rates of splenic T cells were reduced (P<0.01) by 37, 32, and 31% in the CR-25%, ADF-85%, and ADF-100% groups, respectively, and mammary epithelial cell proliferation was 70, 65, and 62% lower (P<0.01), compared with controls. Insulin-like growth factor-1 levels were reduced (P<0.05) in the CR-25% and ADF-100% groups only. In summary, modified ADF, allowing the consumption of 15% of energy needs on the restricted intake day, decreases global cell proliferation similarly as true ADF and daily CR without reducing body weight.—Varady, K. A., Roohk, D. J., McEvoy-Hein, B. K., Gaylinn, B. D., Thorner, M. O., Hellersteinm M. K. Modified alternate-day fasting regimens reduce cell proliferation rates to a similar extent as daily calorie restriction in mice.
cancer
insulin-like growth factor-1
insulin-like growth factor binding protein-3
CALORIE RESTRICTION (CR), typically involving a 15–40% reduction in daily energy intake, has been shown to extend life span and prevent cancer (1)⇓ . CR reduces experimentally induced tumors of skin (2)⇓ and mammary tissue (2)⇓ and also decreases tumor burden, while prolonging tumor latency in genetically altered mice (3)⇓ . Epidemiological trials in humans demonstrate an association between limited calorie intake and reduced incidence of breast and colon cancer (1⇓ , 4)⇓ . The antiproliferative effects of CR may account for a considerable portion of the life span extension in mice (1)⇓ . However, the antiproliferative mechanisms of CR are not known with certainty. Reduced oxidative damage to DNA or other effects on the initiation phase of carcinogenesis (mutagenesis) may be involved. Perhaps the most well-established mechanism is on the promotional phase of carcinogenesis (mitogenesis; ref. 5⇓ ). CR reduces proliferation rates of several tissues, including breast, colon, prostate, lymphocytes, and liver (1)⇓ , while reducing levels of various growth factors (3)⇓ . Since mitogenesis promotes cancer in a several ways (5)⇓ , global reduction in cell proliferation may represent a central element in the anticarcinogenic actions of CR.Alternate-day fasting (ADF) is another form of dietary restriction. ADF has also been shown to reduce cell proliferation rates (6⇓ , 7)⇓ , inhibit hepatic preneoplastic lesion development (8)⇓ , and increase survival rates after tumor inoculation in rodents (9)⇓ . ADF regimens generally comprise 24 h periods of fasting (fast day) alternating with 24 h periods of ad libitum feeding (feed day). In a recent study, we (6)⇓ reported that mice undergoing 4 wk of ADF experienced significant decreases in prostate and splenic T-cell proliferation. Similarly, Hsiehet al. (7)⇓ showed that intermittent feeding in mice, with only a 5% reduction in total calorie intake, reduced proliferation rates of several cell types, including mammary epithelial cells, epidermal cells, and T cells.An important unresolved question in the ADF field is whether 100% reduction in food intake is required on the fast day (i.e., true ADF) or whether modified fasts that allow a portion of energy needs to be consumed on the fast day can maintain benefits. We showed recently that a 25% reduction in energy intake on the fast day had no effect on cell proliferation (6)⇓ , whereas a 50% reduction had only a minimal effect on proliferation rates (6)⇓ , although the latter regimen altered adipose lipid metabolism (10)⇓ . We concluded that >50% caloric reduction was required on the fast day to reduce cell proliferation. The precise dose was not established, however, and a fundamental question was not answered, namely, whether net negative energy balance (e.g., weight loss and altered body composition) was required for the benefits of dietary restriction regimens to occur.A related issue is the effect of dietary restriction regimens on circulating growth factors. Insulin-like growth factor-1 (IGF-1) plays a role in tumor growth by stimulating cell proliferation and inhibiting apoptosis (5)⇓ . Circulating concentrations of IGF-1 are mainly determined by hepatic synthesis, which is regulated by growth hormone (GH) and nutritional status (5)⇓ . Insulin-like growth factor binding protein-3 (IGFBP-3) regulates IGF-1 availability in the circulation (5)⇓ . Ghrelin, a peptide produced in the stomach, is the endogenous ligand for the GH secretagogue receptor (GHSR) and is a potent stimulator of GH secretion (11)⇓ . CR regimens reduce IGF-1 levels and stimulate ghrelin release (12⇓ , 13)⇓ , but the effects of ADF regimens have not been established.Accordingly, the objective of the present study was to compare the effects of true ADF, modified ADF, and daily CR regimens on cell proliferation rates and on the relation between proliferation rates and plasma IGF-1, IGFBP-3, and ghrelin concentrations. Because our previous data (6)⇓ showed no effect on cell proliferation with 25% and a hint of an effect with 50% restriction during the modified fast day, we tested modified ADF regimes that restricted intake by >50% on the fast day.Previous Section Next Section
MATERIALS AND METHODS
Mice and diets
Seven-week-old C57BL/6J female mice were obtained from Charles River Breeding Laboratories (Wilmington, MA, USA), housed individually, and maintained under temperature and light controlled conditions (12 h light/dark cycle: lights on at 7 AM and off at 7 PM) for 1 wk. During this acclimation period, mice were given free access to water and a semipurified AIN-93M diet (Bio-Serv, Frenchtown, NJ, USA), and the daily amount of food consumed by each mouse was recorded.
At 8 wk of age, mice were randomly assigned to one of five intervention groups (n=6 per group) for 4 wk. Mice in the first intervention group (CR-25%) were food restricted daily by 25% of their baseline dietary needs. Mice in the second group (ADF-75%) were fed the semipurified AIN-93M diet ad libitum on the feed day and a 75% calorie-restricted diet on alternate days. Mice in the third group (ADF-85%) were fed the AIN-93M diet ad libitum on the feed day and an 85% calorie-restricted diet on the fast day. Mice in the fourth group (ADF-100%) were fed the AIN-93M diet ad libitum on the feed day and underwent a complete fast on alternate days. Mice in the fifth group served as controls and were fed the AIN-93M diet ad libitum each day. The degree of caloric reduction was calculated based on mean daily food consumption during the acclimation period for each mouse. Food was provided or taken away at 13 h each day and was weighed daily. Body weight was assessed weekly on the same day and time. Mice were sacrificed at 12 wk of age by cardiac puncture under isoflurane anesthesia, followed by cervical dislocation. All procedures and protocols received approval from the University of California Berkeley Animal Use Committee.Blood collection and 2H2O labeling protocol
Eight-hour fasting blood samples were collected on the last day of the trial (day 28), the morning after a feed day. Mice were given heavy water (2H2O) as described elsewhere (7⇓ , 14)⇓ , starting at the beginning of wk 3 (day 14) and continuing through the last 2 wk of the study (days 14–28). An intraperitoneal injection of isotonic 100% 2H2O (0.18 ml/10 g body weight) was administered on day 14 of the study to bring the 2H2O content of body water up to ∼5%. Animals then received drinking water containing 8% 2H2O ad libitum from days 14–28.Epidermal cell isolation
Immediately after sacrifice, dorsal hair was removed by application of a hair removal lotion (Nair; Carter Products, New York, NY, USA). The lotion was then cleaned off using an alcohol swab, and a piece of the dorsal skin without hair was dissected (3 cm2). The skin was rinsed with phosphate buffer solution (PBS; Gibco, Grand Island, NY, USA), cut into three small pieces, immersed in dispase II (Roche, Indianapolis, IN, USA), and incubated for 3.5 h at 37°C on a shaker. The epidermis was then separated from the dermis, as described previously (15)⇓ .Splenic T-cell isolation
After sacrifice, the spleen was removed, minced, and filtered through a 30 μm nylon mesh. T cells were then isolated from the spleen using anti-CD90 microbeads via a magnetic column method (Miltenyi Biotec, Auburn, CA, USA).Mammary epithelial cell isolation
Mammary fat pads were dissected, minced, and treated with collagenase (Worthington Biochemical, Lakewood, NJ, USA), as described previously (16)⇓ . Mammary epithelial cells were then isolated by a magnetic column method, using goat anti-mouse IgG microbeads (Miltenyi Biotec, Auburn, CA, USA), as described elsewhere (5)⇓ .
Bone marrow cell isolation
Bone marrow cells were collected from the femur. As described previously (17)⇓ , marrow cells were flushed out using a needle and syringe containing PBS (Gibco).Measurement of deuterium label enrichment in DNA
DNA was isolated from T cell and epidermal, mammary epithelial, and bone marrow cells using Qiagen kits (Qiagen, Valencia, CA, USA) and then was hydrolyzed to deoxyribonucleosides, as described elsewhere (18)⇓ . Briefly, DNA was incubated overnight at 37°C with DNase, nuclease P1, snake venom phosphodiesterase, and alkaline phosphatase (Sigma, St. Louis, MO, USA). The deoxyribose (dR) moiety of the released free deoxyribonucleosides was then derivatized to pentane tetra-acetate (18)⇓ . Positive chemical ionization gas chromatography-mass spectrometry was used to analyze the pentane tetra-acetate with a model 5973 mass spectrometer and a model 6890 gas chromatograph (Agilent, Palo Alto, CA, USA). Selected ion monitoring was performed on mass-to-charge ratios (m/z) of 245 and 246, representing the M+0and M+1 ions, respectively. Excess fractional M+1 enrichment (EM1) of dR was calculated as:
where sample and standard represent the analyzed sample and unenriched standards, respectively. Unlabeled standards of natural abundance pentane tetra-acetate were analyzed concurrently with samples. Matching the abundance of samples to standards and other corrections have been described in detail elsewhere (18)⇓ . Fractional replacement (f) of cells was calculated as described previously (14⇓ , 19)⇓ by comparison to cells from the same animal that were nearly fully turned over after 2 wk of labeling with 2H2O, i.e., bone
marrow cells:Circulating hormone level determinations
Plasma IGF-1 and IGFBP-3 concentrations were determined using an enzyme-linked immunosorbent assay (ELISA) kit (Linco Research, St. Charles, MO, USA, and R&D Systems, Minneapolis, MN, USA, respectively). Ghrelin levels were measured by sandwich ELISA, as described previously (20)⇓ .Estrus cycle status
The presence or absence of estrus cycle was determined for all animals viavaginal smear and analysis of cell morphology. Vaginal smears were taken during the last 8 consecutive days of the study, and samples were fixed and stained on slides with Giemsa blood stain (Medical Chemical Corp., Los Angeles, CA, USA), as described previously (21)⇓ .Statistical analysis
Differences between groups during the acclimation period and at each week during the study were analyzed by a one-way ANOVA. When significant differences were noted between groups, a Tukey’s post hoc test was performed to determine significant differences between group means. Changes within an intervention group throughout the study were measured using repeated-measures ANOVA. Correlation analyses were also performed to evaluate the relationship between cell proliferation rates and hormone levels. A value of P < 0.05 was used as the criterion for statistical significance in all analyses. Data were analyzed by SPSS software (version 11 for Mac OS X, SPSS Inc., Chicago, IL, USA).Previous Section Next Section
RESULTS
Body weight
Mean body weight in each intervention group throughout the 4 wk study is displayed in Fig. 1⇓ . There were no differences in body weight between groups during the first week of the study. However, by wk 2, the CR-25% group weighed less (P<0.05) than the ADF and control groups, and this lower body weight persisted through the end of the study. Body weights of the ADF groups did not differ significantly from that of controls. The ADF-75%, ADF-85%, ADF-100%, and control groups all gained (P<0.05) weight from the beginning to the end of the study, whereas the CR-25% lost (P<0.05) weight.
View larger version:
In this page
In a new window Figure 1.
Mean body weight throughout the 4 wk study. Values are means ± SE. Mean body weight in each group was similar during wk 1 of the study. By wk 2, the CR-25% group weighed less than all other groups, and this lower body weight persisted until the last day of the study. There were no differences in body weight between the ADF and control groups throughout the 4 wk study. One-way ANOVA with Tukey’s post hoc test was used for all between-group analyses; *P < 0.05.Food intake
The daily amount of food consumed by each mouse was similar during the acclimation phase (Fig. 2⇓ ). During wk 1 and 2, mean daily food intake of the CR-25%, ADF-75%, ADF-85%, and ADF-100% groups was less (P<0.0001) than that of controls. However, by wk 3, only the CR-25% group was eating less (P<0.01) than the control group. During the last week of the study (wk 4), all the intervention groups consumed less (P<0.0001) food than controls.
View larger version:
In this page
In a new window Figure 2.
Mean daily food intake throughout the 4 wk study. Values are means ±SE. Each intervention group ate less than control during wk 1, 2, and 4. During wk 3, the CR-25% group ate less than all the other groups. One-way ANOVA with Tukey’s post hoc test was used for all between-group analyses; *P < 0.0001, **P < 0.01.Hyperphagic response to food restriction
A hyperphagic response on the feed day to food restriction on the fast day (P<0.05) shows significant differences between controls vs. ADF-75%, ADF-85%, and ADF-100% groups, during wk 1–4 (Fig. 3⇓ ). In general, the ADF-75% and ADF-85% groups consumed ∼60 and ∼70% more (P<0.05) food on feed days, respectively, than controls, whereas the ADF-100% group ate ∼85% more (P<0.05) food on feed days than controls.
View larger version:
In this page
In a new window Figure 3.
Hyperphagic response on the feed day to food restriction on the restricted (fast) day. Values are means ± SE. Means not sharing a common superscript letter are significantly different (P<0.05). One-way ANOVA with Tukey’s post hoc test was used for all between-group analyses.In vivo proliferation of epidermal cells, splenic T cells, and
mammary epithelial cells
Cell proliferation rates of various tissues after 4 wk of CR or ADF are shown inFig. 4⇓ . At the end of the study, epidermal cell (keratinocyte) proliferation rates decreased (P<0.01) by 29, 20, and 31% in the CR-25%, ADF-85% and ADF-100% groups, respectively, relative to controls. Splenic T-cell proliferation was also reduced (P<0.01) by 37, 32, and 31% in the CR-25%, ADF-85%, and ADF-100% groups, respectively, when compared with controls. Mammary epithelial cell proliferation rates were 70, 65, and 62% lower (P<0.01) in the CR-25%, ADF-85%, and ADF-100% groups, respectively, relative to controls. In contrast, no significant effects of ADF-75% on cell proliferation rates were observed for any cell type. Thus, restricting food by 85% on the calorie-restricted day (modified ADF), but not 75% on the calorie-restricted day, resulted in comparable reductions in proliferation rates as restricting food completely on the fast day (true ADF). Moreover, the effects of modified as well as true ADF on cell proliferation rates were comparable to that of daily CR for all tissue types.
View larger version:
In this page
In a new window
Figure 4.
Effect of 4 wk of CR or ADF on epidermal cell, splenic T-cell, and mammary epithelial cell proliferation. Values are means ± SE. ADF-85% and ADF-100% produced similar reductions (P<0.01) in epidermal cell, T cell, and mammary epithelial cell proliferation as CR-25%. One-way ANOVA with Tukey’s post hoc test was used for all between-group analyses; means not sharing a common letter are significantly different (P<0.05).Plasma IGF-1 and IGFBP-3 concentrations
The effects of 4 wk of treatment on circulating hormonal mediators of cell proliferation are displayed in Table 1⇓ . Circulating IGF-1 levels were lower (P<0.05) in the CR-25% (197±18 ng/ml, 45% lower than controls) and ADF-100% (190±19 ng/ml, 47% lower than controls) groups, relative to the control group (359±52 ng/ml), but were not significantly altered by any of the modified ADF regimens. Circulating IGF-1 concentrations were positively correlated with in vivoproliferation rates of epidermal cells (r=0.39; P=0.03) and mammary epithelial cells (r=0.63; P=0.001). Circulating IGFBP-3 levels were not affected by any intervention. No associations between posttreatment IGF-1 and IGFBP-3 concentrations were observed.
View this table:
In this window
In a new window Table 1.
Effect of 4 wk of CR or ADF on circulating hormones and growth factors
Plasma ghrelin concentrations
Ghrelin is an endogenous ligand of the GHSR and thus acts to stimulate GH secretion. Ghrelin exists in two major forms: n-octanoyl-modified ghrelin (octghrelin), which possesses an n-octanoyl modification on serine-3; and des-acyl ghrelin (des ghrelin). The form of ghrelin active at the GHSR (oct ghrelin) was significantly increased (P<0.05) in the ADF-100% group (292±64 pg/ml) relative to controls (155±27 pg/ml), although there were no significant differences among any other groups (Table 1)⇓ . Des and total ghrelin were not affected by any treatment.Estrus cycle
On the basis of morphological analysis of vaginal cytology, CR mice were anestrus (not cycling), whereas the ADF-75%, ADF-85%, ADF-100%, and control mice were actively cycling (i.e., there was no effect on the 4 day cycling period). The decrease in mammary epithelial cell proliferation in the CR group but not the ADF groups might, therefore, be influenced by a reduction in reproductive hormone levels (22)⇓ .Previous Section Next Section
DISCUSSION
The question addressed in this study was whether modified ADF regimens, which allow some caloric intake on the restricted day, can reproduce global reductions in cell proliferation rates observed with true ADF and classic CR regimens. Our results document, for the first time, that a modified ADF regimen, which allowed for the consumption of 15% of energy needs on the fast day, produced essentially identical reductions in cell proliferation rates as true ADF. Moreover, both true ADF and modified ADF regimens produced similar reductions as classic 25% CR for all cell types monitored (epidermal cells, splenic T cells, and mammary epithelial cells). Interestingly, the modified ADF regimen, which allowed for consumption of 25% of energy needs on the calorie-restricted day, did not result in such beneficial modulations. These results
suggest that a dose-response relationship of a nonlinear type exists between the extent of calorie intake on the restricted day of an ADF regimen and the signals responsible for reducing global cell proliferation and that this dose-response relationship may have a threshhold character.
We investigated some of the circulating factors that might act as signals to reduce cell proliferation. ADF-100% and CR-25%, but not modified ADF regimens, reduced circulating IGF-1 levels, consistent with the proposed role of IGF-1 in the hypoproliferative response induced by CR (23)⇓ . The observation that equivalent reductions in cell proliferation were observed in the ADF-85% regimen without any reduction in IGF-1 levels, however, calls into question the uniqueness of IGF-1 in this regard. It is important to note that these antiproliferative effects in both the true (ADF-100%) and modified ADF (ADF-85%) groups occurred here in the absence of weight loss, suggesting that these outcomes occurred as a result of an energy intake pattern rather than a net negative energy balance. We have previously reported (6)⇓ that ADF-100% regimens result in weight loss, due to an inability of the hyperphagic response to compensate fully for the complete absence of caloric intake on the fast day. It has not previously been shown, however, that any regimen that allows energy intake on the restricted day and no change in body weight could reproduce the effects of CR or true ADF.Cell proliferation plays a central role in the promotional phase of carcinogenesis (5)⇓ . We demonstrate here that modified ADF regimens work just as well as daily CR to reduce cell proliferation rates in a variety of tissue types of both epithelial (mammary and skin) and mesenchymal (lymphocyte) origin. Although the ability of classic CR to reduce cell turnover is well documented (24⇓ 25⇓ 26⇓ 27⇓ 28)⇓, very few studies (6⇓ , 7)⇓ have examined the effect of true and modified ADF regimens on this indicator of cancer risk. In our previous study (6)⇓ , we showed that modified ADF regimens that allow consumption of 50 and 75% of baseline energy needs on the restricted day, alternating with ad libitum feeding on the feed day, had very little effect on proliferation rates of prostate epithelial or splenic T cells, whereas the group undergoing a complete 24-h fast (ADF-100%) exhibited markedly reduced proliferation rates (6)⇓ . This led us to test the hypothesis that a reduction in caloric intake on the fast day by >50 but <100% could produce beneficial effects. The results here indicate that 15% of energy needs, but not 25%, can be consumed on the restricted day and achieve similar reductions in cell proliferation rates as daily CR and true ADF. It will be important to confirm in longer term carcinogenesis studies that the reductions in global cell proliferation rates shown here result in reduced cancer rates. If this is confirmed, and data can be extrapolated to ADF in humans, it is possible that subjects need not undergo a complete 24 h fast but may instead consume a portion of energy needs on the restricted day and still achieve benefits such as a reduction in cancer risk. If the results with modified ADF regimens shown here in rodents can be confirmed by studies in man, the feasibility of ADF strategies would be considerably enhanced, as true ADF regimens are generally not well tolerated in human subjects (29⇓ , 30)⇓ .These antiproliferative effects occurred in the absence of weight loss in the ADF groups. Based on the hyperphagic response observed on the ad libitum feeding day, the ADF groups were able to maintain and gain body weight by compensating on the feed day for the degree of energy restriction experienced on the fast day. More specifically, the mice in the ADF-75%, ADF-85%, and ADF-100% groups ate 60, 70, and 85% more food on the feed days, respectively, than control mice. Reduced activity levels or resting energy expenditure may also contribute but was not evaluated here. The lack of a requirement for weight loss or changes in body fat mass with ADF regimens makes this approach to dietary restriction potentially attractive for normal weight and mildly overweight subjects. Individuals in higher weight classes might be more appropriate for daily CR, as this diet regimen generally results in weight loss.Evidence has linked circulating IGF-1 concentrations to risk for cancer. Prospective studies (31⇓ 32⇓ 33)⇓ in humans indicate that individuals with higher plasma IGF-1 concentrations have an increased risk of colon, lung, breast, and prostate cancer. These findings are supported by animal data, which indicate that IGF-1 functions as a mitogen and an antiapoptotic survival factor (34)⇓ . In the present study, we show that ADF-100% decreases circulating IGF-1 concentrations to an equal extent as daily 25% CR. These
reductions in IGF-1 concentrations showed significant, although modest, correlations with epidermal and mammary epithelial cell proliferation rates. Similar associations between ADF-induced decreases in IGF-1 levels and reduced cell turnover rates were observed previously (6)⇓ . Classic CR has also been shown to reduce plasma IGF-1 levels while decreasing tumorigenesis (12⇓ , 13)⇓ . Interestingly, the decreases in cell proliferation rates observed in the ADF-85% group were not accompanied by significant reductions in IGF-1 levels. Accordingly, the relation between circulating IGF-1 concentrations and the antiproliferative effects of modified ADF regimens remains uncertain.Plasma levels of ghrelin have been shown to increase in response to fasting (35)⇓and prolonged CR (36)⇓ . During periods of starvation, ghrelin is thought to promote the resumption of feeding by activating hypothalamic neurons (37⇓ , 38)⇓ . Ghrelin has also been shown to be a potent stimulator of GH release (39)⇓ . These actions are dependent on the octanoyl modification of the third serine residue of ghrelin, which is the form of ghrelin active at the GHSR (39)⇓ . Accordingly, we quantified the circulating levels of oct ghrelin (active ghrelin) as well as des ghrelin after an 8 h fast in all animals. We found that ADF-100%, but not modified ADF, increased plasma levels of oct ghrelin, relative to controls. Interestingly, this effect on oct ghrelin did not occur in the CR group. These preliminary findings suggest that true ADF is a more potent stimulator of ghrelin release than CR during periods of fasting. It may be speculated that the cyclic intake of food in the ADF-100% animals induced patterned release of ghrelin by the stomach in this group. It will be of interest in future studies to measure diurnal changes in ghrelin levels after 24 h of feasting alternated with 24 h fasting.In summary, our data demonstrate that a modified ADF regimen, consisting of ad libitum feeding on the feed day alternated with the consumption of 15% of energy needs on the calorie-restricted day, decreases global cell proliferation rates to a similar extent as true ADF and daily CR. Over the course of the study, body weight within the ADF groups remained stable, indicating that these antipromotional effects were mediated by signals other than weight reduction or body fat stores. These effects may be mediated in part by decreases in circulating levels of IGF-1, although IGF-1 levels were not reduced in the modified ADF group. Since allowing some food intake on the calorie-restricted day could increase subject compliance and tolerability of ADF regimens, these findings may have practical implications. Direct confirmation of these observations in human subjects will be necessary before the implications for human health or dietary practices can be judged.Previous Section Next Section
Acknowledgments
We thank S. Florcruz, A. Dang, D. Son, and J. Chang for help with the feeding phase of the study. This work was funded by the Natural Science and Engineering Research Council of Canada and the State of California Discovery (BioStar) Program.
Received September 10, 2007. Accepted December 6, 2007.Previous Section
References
1. ↵ Fontana, L., Klein, S. (2007) Aging, adiposity, and calorie restriction.JAMA 297,986-994
CrossRef Medline
2. ↵ Stewart, J. W., Koehler, K., Jackson, W., Hawley, J., Wang, W., Au, A., Myers, R., Birt, D. F. (2005) Prevention of mouse skin tumor promotion by dietary energy restriction requires an intact adrenal gland and glucocorticoid supplementation restores inhibition. Carcinogenesis 26,1077-1084
3. ↵ Patel, A. C., Nunez, N. P., Perkins, S. N., Barrett, J. C., Hursting, S. D. (2004) Effects of energy balance on cancer in genetically altered mice. J. Nutr. 134,3394S-3398S
4. ↵ Jolly, C. A. (2005) Diet manipulation and prevention of aging, cancer and autoimmune disease. Curr. Opin. Clin. Nutr. Metab. Care 8,382-387
Medline
5. ↵ Yakar, S., Leroith, D., Brodt, P. (2005) The role of the growth hormone/insulin-like growth factor axis in tumor growth and progression: lessons from animal models. Cytokine Growth Factor Rev. 16,407-420
CrossRef Medline
6. ↵ Varady, K. A., Roohk, D., Hellerstein, M. K. (2007) Dose effects of modified alternate-day fasting regimens on in vivo cell proliferation and plasma insulin-like growth factor-1 in mice. J. Appl. Physiol. 103,547-551
7. ↵ Hsieh, E. A., Chai, C. M., Hellerstein, M. K. (2005) Effects of caloric restriction on cell proliferation in several tissues in mice: role of intermittent feeding. Am. J. Physiol. Endocrinol. Metab. 288,E965-E972
8. ↵ Rocha, N. S., Barbisan, L. F., de Oliveira, M. L., de Camargo, J. L. (2002) Effects of fasting and intermittent fasting on rat hepatocarcinogenesis induced by diethylnitrosamine. Teratog. Carcinog. Mutagen. 22,129-138
CrossRef Medline
9. ↵ Siegel, I., Liu, T. L., Nepomuceno, N., Gleicher, N. (1988) Effects of short-term dietary restriction on survival of mammary ascites tumor-bearing rats.Cancer Invest. 6,677-680
Medline
10. ↵ Varady, K. A., Roohk, D., Loe, Y. C., McEvoy-Hein, B. K., Hellerstein, M. K. (2007) Effects of modified alternate-day fasting regimens on adipocyte size, triglyceride metabolism and plasma adiponectin levels in mice. J. Lipid Res.48,2212-2219
11. ↵ Higgins, S. C., Gueorguiev, M., Korbonits, M. (2007) Ghrelin, the peripheral hunger hormone. Ann. Med. 39,116-136
CrossRef Medline
12. ↵ Mai, V., Colbert, L. H., Berrigan, D., Perkins, S. N., Pfeiffer, R., Lavigne, J. A., Lanza, E., Haines, D. C., Schatzkin, A., Hursting, S. D. (2003) Calorie restriction and diet composition modulate spontaneous intestinal tumorigenesis in Apc(Min) mice through different mechanisms. Cancer Res.63,1752-1755
13. ↵ Berrigan, D., Perkins, S. N., Haines, D. C., Hursting, S. D. (2002) Adult-onset calorie restriction and fasting delay spontaneous tumorigenesis in p53-deficient mice. Carcinogenesis 23,817-822
14. ↵ Neese, R. A., Misell, L. M., Turner, S., Chu, A., Kim, J., Cesar, D., Hoh, R., Antelo, F., Strawford, A., McCune, J. M., Christiansen, M., Hellerstein, M. K. (2002) Measurement in vivo of proliferation rates of slow turnover cells by 2H2O labeling of the deoxyribose moiety of DNA. Proc. Natl. Acad. Sci. U. S. A. 99,15345-15350
15. ↵ Hsieh, E. A., Chai, C. M., de Lumen, B. O., Neese, R. A., Hellerstein, M. K. (2004) Dynamics of keratinocytes in vivo using HO labeling: a sensitive marker of epidermal proliferation state. J. Invest. Dermatol. 123,530-536
CrossRef Medline
16. ↵ Nandi, S., Guzman, R. C., Yang, J. (1995) Hormones and mammary carcinogenesis in mice, rats, and humans: a unifying hypothesis. Proc. Natl. Acad. Sci. U. S. A. 92,3650-3657
17. ↵ Macallan, D. C., Fullerton, C. A., Neese, R. A., Haddock, K., Park, S. S., Hellerstein, M. K. (1998) Measurement of cell proliferation by labeling of DNA with stable isotope-labeled glucose: studies in vitro, in animals, and in humans. Proc. Natl. Acad. Sci. U. S. A. 95,708-713
18. ↵ Neese, R. A., Siler, S. Q., Cesar, D., Antelo, F., Lee, D., Misell, L., Patel, K., Tehrani, S., Shah, P., Hellerstein, M. K. (2001) Advances in the stable isotope-mass spectrometric measurement of DNA synthesis and cell proliferation. Anal. Biochem. 298,189-195
CrossRef Medline
19. ↵ Collins, M. L., Eng, S., Hoh, R., Hellerstein, M. K. (2003) Measurement of mitochondrial DNA synthesis in vivo using a stable isotope-mass spectrometric technique. J. Appl. Physiol. 94,2203-2211
20. ↵ Liu, J., Gaylinn, B. D., Calore, J. D., Weiner, R. S., Gordon, D. A., Thorner, M. O. (2004) A new enzyme-linked immunoassay for acylated and des-acylated ghrelin in plasma. Growth. Horm. IGF Res. 14,131
21. ↵ Nelson, J. F., Felicio, L. S., Randall, P. K., Sims, C., Finch, C. E. (1982) A longitudinal study of estrous cyclicity in aging C57BL/6J mice: I. Cycle frequency, length and vaginal cytology. Biol. Reprod. 27,327-339
22. ↵ Merry, B., Holehan, A. (1994) Effects of Diet on Aging CRC Press Boca Raton, Florida, USA.
23. ↵ Hursting, S. D., Lavigne, J. A., Berrigan, D., Perkins, S. N., Barrett, J. C. (2003) Calorie restriction, aging, and cancer prevention: mechanisms of action and applicability to humans. Annu. Rev. Med. 54,131-152
CrossRef Medline
24. ↵ Lok, E., Nera, E. A., Iverson, F., Scott, F., So, Y., Clayson, D. B. (1988) Dietary restriction, cell proliferation and carcinogenesis: a preliminary study.Cancer Lett. 38,249-255
CrossRef Medline
25. ↵ Hursting, S. D., Perkins, S. N., Phang, J. M. (1994) Calorie restriction delays spontaneous tumorigenesis in p53-knockout transgenic mice. Proc. Natl. Acad. Sci. U. S. A. 91,7036-7040
26. ↵ Lev-Ran, A. (1998) Mitogenic factors accelerate later-age diseases: insulin as a paradigm. Mech. Ageing Dev. 102,95-113
CrossRef Medline
27. ↵
Ikeyama, S., Kokkonen, G., Martindale, J. L., Wang, X. T., Gorospe, M., Holbrook, N. J. (2003) Effects of aging and calorie restriction of Fischer 344 rats on hepatocellular response to proliferative signals. Exp. Gerontol.38,431-439
CrossRef Medline
28. ↵ Zhu, Z., Jiang, W., Thompson, H. J. (1999) Effect of energy restriction on tissue size regulation during chemically induced mammary carcinogenesis.Carcinogenesis 20,1721-1726
29. ↵ Heilbronn, L. K., Civitarese, A. E., Bogacka, I., Smith, S. R., Hulver, M., Ravussin, E. (2005) Glucose tolerance and skeletal muscle gene expression in response to alternate day fasting. Obes. Res. 13,574-581
Medline
30. ↵ Heilbronn, L. K., Smith, S. R., Martin, C. K., Anton, S. D., Ravussin, E. (2005) Alternate-day fasting in nonobese subjects: effects on body weight, body composition, and energy metabolism. Am. J. Clin. Nutr. 81,69-73
31. ↵ Ma, J., Pollak, M. N., Giovannucci, E., Chan, J. M., Tao, Y., Hennekens, C. H., Stampfer, M. J. (1999) Prospective study of colorectal cancer risk in men and plasma levels of insulin-like growth factor (IGF)-I and IGF-binding protein-3. J. Natl. Cancer Inst. 91,620-625
32. ↵ Giovannucci, E. (1999) Insulin-like growth factor-I and binding protein-3 and risk of Cancer. Horm. Res. 51(Suppl. 3),34-41
CrossRef Medline
33. ↵ Hankinson, S. E., Willett, W. C., Colditz, G. A., Hunter, D. J., Michaud, D. S., Deroo, B., Rosner, B., Speizer, F. E., Pollak, M. (1998) Circulating concentrations of insulin-like growth factor-I and risk of breast cancer.Lancet 351,1393-1396
CrossRef Medline
34. ↵ Jenkins, P. J., Bustin, S. A. (2004) Evidence for a link between IGF-I and cancer. Eur. J. Endocrinol. 151(Suppl. 1),S17-S22
35. ↵ Tschop, M., Smiley, D. L., Heiman, M. L. (2000) Ghrelin induces adiposity in rodents. Nature 407,908-913
CrossRef Medline
36. ↵ Gualillo, O., Caminos, J. E., Nogueiras, R., Seoane, L. M., Arvat, E., Ghigo, E., Casanueva, F. F., Dieguez, C. (2002) Effect of food restriction on ghrelin in normal-cycling female rats and in pregnancy. Obes. Res. 10,682-687
Medline
37. ↵ Nakazato, M., Murakami, N., Date, Y., Kojima, M., Matsuo, H., Kangawa, K., Matsukura, S. (2001) A role for ghrelin in the central regulation of feeding.Nature 409,194-198
CrossRef Medline
38. ↵ Lawrence, C. B., Snape, A. C., Baudoin, F. M., Luckman, S. M. (2002) Acute central ghrelin and GH secretagogues induce feeding and activate brain appetite centers. Endocrinology 143,155-162
39. ↵ Kojima, M., Hosoda, H., Date, Y., Nakazato, M., Matsuo, H., Kangawa, K. (1999) Ghrelin is a growth-hormone-releasing acylated peptide from stomach. Nature 402,656-660
CrossRef Medline
Source: http://www.fasebj.org/content/22/6/2090.full
What is Leptin and why is hormone management important?Leptin is a peptide hormone neurotransmitter (brain transmitter) produced by Adipocytes (fat
cells) and involved in the regulation of ones metabolism. Hormonal management is essential
as it influences our moods, behavior, ability to handle stress and even the way we consume
calories.
What is the role of Leptin in our body?There are three primary hormones which we need to focus on: Leptin, Insulin and Adrenaline.
For the purposes of this article we will focus primarily on Leptin and touch on Insulin.
Leptin is key to weight management, as its primary role in life is to restore fat reserves after
consuming energy stores. Insufficient Leptin also compromises Growth Hormone and
Testosterone production.
How does Leptin help restore energy stores?When Leptin levels drop in the bloodstream, the brain receives a signal that it’s time to eat. When
you consume food Leptin levels increase signaling the brain that enough calories have been
consumed and its time to stop eating.
This is where Insulin, one of the other primary hormones comes into play. Insulin levels also rise
with food intake. Insulin’s job is to ensure as much nutritional content is going to the muscles and
liver as possible. If both are already at capacity this is where calorie spillover occurs and the
excess calories are stored as fat.
Efficient Leptin sensitivity tells Insulin to stop feeding your liver and muscles, thus preventing fat
storage due to non-existent spillover.
Low Leptin Levels = Increases your appetite and decreases metabolic rate
High Leptin Levels = Decreases your appetite and increases metabolic rate
There are two types of people in this world. The few naturally lean and the rest of us. If you are
one of the lucky few that are naturally lean, maintain a low body fat percentage even with low
Leptin levels, its most likely due to optimal Leptin sensitivity. Essentially you can thank genetics,
for the rest of us it’s not so easy.
Ironically overweight people tend to have higher Leptin levels. Unfortunately due to extended
periods of elevation we become resistant to Leptin Sensitivity. Meaning our body doesn’t
effectively communicate with Insulin therefore we continue consuming calories.

How can we restore Leptin sensitivity and hormonal harmony by eliminating resistance?A balanced hormonal state is key to optimal muscle growth and fat loss. Essentially it all comes
down to not eating excessive calories. This can be done by consuming clean raw unprocessed
foods such as fruit, veg, meat, fish and whole grains.
Keep it simple, these foods offer high nutrient content with a low calorie price tag. I know it’s
tempting but don’t venture into those middle isles, stay on the outskirts and you generally can’t
go wrong.
Leveraging Intermittent fasting to help restore sensitivityBy introducing a 16-18 hour fast into your daily nutritional schedule you enable the body to draw
on fat cells for energy. “But Nick! Won’t my body go into starvation mode and completely
shutdown my metabolism” NO! Not in the short term, I will cover this in another article but this
only happens after extended periods of fasting. i.e. after 48-72 hours.
In today’s society going without a snack between your office and the water dispenser is
considered stepping into dangerous starvation territory. Get real!! Consider our ancestors who
went without food for days because they couldn’t pop into 7-Eleven on the way home.
Lets try and wrap this up neatlyRecovering from Leptin resistance is not a quick process that will happen over night. However by
correcting your diet and introducing intermittent fasting you can start to restore Leptin and Insulin
sensitivity. By doing this your body will become more receptive to the quality calories by which
you fuel it. Resulting in less calories being required to replenish liver and muscle stores, less
calorie spillage, therefore less calories being stored as fat. All because your cells better respond
to Insulin and increased Leptin sensitivity.
OK that was a long post but I appreciate you getting all the way through it. At this point I must
make reference to a couple of key sites & authority figures for their fantastic reference material
and knowledge on the topics. Martin Berkhan Leangains & Mike Mahler. You guys both provide
much needed inspiration on my fitness journey.
Source: http://www.primalsixpack.com/day-17-of-45-the-magical-hormone-leptin-and-fat-loss-how-to-get-a-six-pack-in-six-weeks/

How NOT to Speed Up Your MetabolismPosted In Intermittent Fasting | 4 comments
As most of you know by now the Primal Six Pack program consists of 3 core components –
Training, Diet & Nutrition and Intermittent Fasting. I’ll focus on the Intermittent Fasting
component for the remainder of this article.
One of the most common questions related to Intermittent Fasting I receive is in regards
to meal frequency.
Most people have been ‘fed’ the idea that you need to eat 6 small meals a day, or every 3
hours or graze like cattle in order to boost your metabolism and increase fat burning.
You’re not to blame, unfortunately some of the less informed personal trainers & nutritionists are
parrots and just repeat unverified information they’ve heard somewhere along the line. Even
doctors who receive very little if any nutritional teaching push the 6 meals a day concept, never
questioning the science behind the theory.
Next time your personal trainer or anyone else tells you to eat 6 small meals a day or every 3
hours, ask him or her for scientific evidence supporting their theory that it boosts your
metabolism and increases fat loss. After all, you’re paying good money to these professionals,
they shouldn’t have a problem backing up their nutritional programs.
Health and fitness is a billion dollar industry, while I would love to believe that the supplement
and nutritional corporations have my best interests at heart, I’m apprehensive. These industry
giants answer to boardroom committee’s and shareholders with the sole objective of increasing
revenue. These meal frequency ideas are pushed to prey on people’s fears, in the hope of
convincing you to empty your wallet by purchasing proteins bars, powders and intra-meal snacks
to stoke the metabolic furnace, what a load of rubbish!!
What Do The Industry Experts Say…My favorite industry expert is Brad Pilon who graduated with honors as a nutritionist, Brad has
written the market leading intermittent fasting book called Eat Stop Eat.
Brad has proven the success of intermittent fasting with a bunch of real life testimonials from
his clients all around the globe, each with before and after pictures demonstrating extreme fat
loss by adopting the simple principals in his book.
I definitely recommend checking it out, I’ve personally recommended it to all my friends, clients
and even intermittent fasting skeptics who have adopted Brad’s advice and seen breathtaking
results first hand. Click “HERE” to download your copy.
Below are some of the key points in Brad’s book.
Lose Weight and Body Fat – Fasting 2x/week for 24 hours actually boosts your fat burning
capacity by reducing insulin and leptin resistance.
Debunks two Industry Myths, proving that:
Fasting doesn’t slow down your metabolism.
Fasting causes NO muscle breakdown.
Break Food Addiction – Fasting subconsciously teaches you disciple and self-control.
Increased levels of Growth Hormone.
Increased Productivity – Save time by eliminating food preparation and constantly eating.
Increased Energy Levels – Stronger lifts and increased sex drive.
Increased mental clarity – heightening of senses.
The Truth About Your Metabolism1. Less frequent meals have actually been shown to boost your metabolism during the first
36-hour period.
2. Consuming food triggers a process called Thermogenesis where the body generates heat
digesting food thus utilizing energy. However the same amount of energy is required to
digest 2000 calories whether those calories are consumed in 6 meals a day, 2 meals a day
or 10 meals a day. It really doesn’t matter.
I’ve included a study which supports this statement Thermogenesis in humans after vary meal
frequency, see below.
Check out my results after just 45 days leveraging the fat stripping benefits of intermittent fasting
Don’t get me wrong eating 6 meals a day can help you lose weight but not for the reasons often publicized

Calorie deficit is still required if you plan to lose weight.
Most people who adopt a 6 meal per day nutritional plan also adopt a healthy eating
lifestyle at the same time, trading in processed sugar and grains for broccoli and chicken.
Eating smaller meals in the right macronutrient (protein, carbs, fats) quantities can help
keep blood sugar & insulin at a stable level.
So where’s the evidence?Where is the evidence that eating 6 meals a day speeds up your metabolic rate? Or the evidence
that eating more meals will accelerate fat loss? Keep in mind these are the two primary reasons
people are encouraged to eat more frequent meals.
As discussed before eating 6 meals a day can work but it comes with a strict set of guidelines I
believe to be unsustainable as an ongoing healthy lifestyle.
Each meal will be small, meaning you’ll be reaching for a bowl of vegetables and tuna at
social occasions.
Eating 6 meals a day will be a constant source of interruption, for me finding the time to
constantly eat just isn’t feasible and would inevitably affect my productivity.
Meal preparation time will increase so you’ll find yourself eating fish out of a can. I’ve been
down that road and promised myself never to intrude on my cats food supply again.
You may also have to invest in a bigger bag to lug around all the Tupperware containers.
Lets take a closer look at the results of meal frequency studiesMeal frequency and energy balance
Effects of meal frequency on energy utilization in ratsWhile I’m not the biggest fan of animal studies because we are human the findings are very
interesting none the less.
Thermogenesis in humans after varying meal time frequency
In Summary The studies demonstrate that the meal frequency does not influence energy balance or
weight loss, if you want to lose weight you need to reduce your calorie intake. Whether you
do that by consuming 6, 10 or 2 meals a day it really doesn’t matter and comes down to
personal preference.
If you take your nutrition seriously and are determined to see extreme fat loss results
then grab a copy of Eat Stop Eat.
Introducing a fasting window into your nutritional program has been shown to increase your
metabolic rate, reduce insulin and leptin resistance thus accelerating fat loss.
Intermittent Fasting will also free you from the kitchen leaving you time to enjoy the things in
life that really matter.
Eating 6 small meals a day can work so long as you are in a calorie deficit, eating clean
calories and have the time to eat 6 times a day.
About the author
I'm Nick Amiradaki, the creator of PrimalSixPack.com - my vision is to unlock and share
the simple truths I've discovered to achieve physical excellence and optimal health. I aim to be a trusted
source with a personal presence in an extremely saturated market filled with deception and bias misleading
information. Connect with me on Google+, Twitter and join the Facebook community. Follow The Primal Six
Pack program and I guarantee you will see extreme fat loss results, have a better understanding of nutrition
and lead a much happier leaner life. Be sure to download my recipe book - 15 recipes used to build six
pack abs, it can be found at the top right of this page. Enjoy!
SOURCE: http://www.primalsixpack.com/how-not-to-speed-up-your-metabolism/
Day 28 of 45 – TDEE, Basal Metabolic Rate (BMR) and Three Popular Formulas
Posted In Diet & Nutrition, My Fitness Journey | No comments
Hi PrimalSixPacker’s, as part of the Primal Six Pack program you will be required to calculate
yourTDEE, below you can find an explanation of both TDEE and BMR and how they relate to
your personal fat loss goal.
We’ve developed the Primal Six Pack Intermittent Fasting & Calorie Calculator using the most
popular Mifflin-St Jeor Formula, specifically tailored for use on The Primal Six Pack Program
for optimal results.
Why do I need to calculate my Total Daily Energy Expenditure (TDEE)
Your TDEE is combination of your “Resting Energy Expenditure” (REE), “Activity Energy
Expenditure” (AEE) and your “Thermic Effect of Feeding” (TEF).
When all three of these variables are combined based on your lifestyle you can fairly accurately
calculate the total number of daily calories required to maintain your current weight. Once you’ve
calculated your maintenance calories you’re able to tailor a nutritional & fitness program specific
to your goals. Should you wish to increase in weight, simply consume more calories than your
TDEE. Should you wish to lose weight consume less calories than your TDEE.
The Primal Six Pack program takes the idea of calorie intake one step further.
On workout days you will consume more calories than you will on rest days.
The macro-nutrient breakdown will also vary depending on workout and rest days. I’ve
explained this in greater detail on The Primal Six Pack Program page under the “Diet and
Nutrition” section.
What factors contribute to your Total Daily Energy Expenditure (TDEE)
Lets first define the three energy expenditure groups:
Resting Energy Expenditure (REE) – This is the total number of calories used to maintain
vital bodily functions such as breathing, heart rate, sleeping and recovering.
Activity Energy Expenditure (AEE) – This is the total number of calories used to perform
physical activity such as any type of movement like walking from your desk to the water
cooler, right up to sporting exercise including gym and other types of fitness training.
Thermic Effect of Feeding (TEF) – This is the total number of calories used to digest food.
Your TDEE will be effected by your Activity Energy Expenditure (AEE). Meaning the more
active you are the more calories you will require to maintain your current body weight.
The Primal Six Pack Program calculates your workout & rest day caloric requirements based on
a Moderately Active TDEE. (3 x compound weight training sessions + 2 x hill sprints per week)
These activity variables have been factored into our very own online calculator, making it
extremely easy to calculate your rest and workout day calories.
For example:
Note: I selected the “Extreme Fat Loss” option on the online calculator.
Based on my height, weight and age my TDEE is 2544 calories
I subtract 40% calories from my TDEE for rest days – 1565 calories
I add 0% calories to my TDEE for workout days – 2544 calories
Based on The Primal Six Pack Program I consume 2544 calories on workout days and 1565
calories on rest days.
This is automatically calculated for you using the online calculator mentioned above.
This is all you need to know to calculate your calorie requirements, everything below this point is
purely additional information regarding BMR.
What is Basal Metabolic Rate (BMR)
Basal Metabolic Rate (BMR) measures the total amount of calories that are required to sustain
vital bodily functions. It’s essentially the same as the Resting Energy Expenditure
(REE)component mentioned above. These functions include sleeping, recovering, breathing, etc.
You get the point basically things your body does just by existing. Generally, BMR varies with
respect to demographics, such as gender, age, height, or weight. However, it should normally be
the same for people within the same age/weight group bracket.
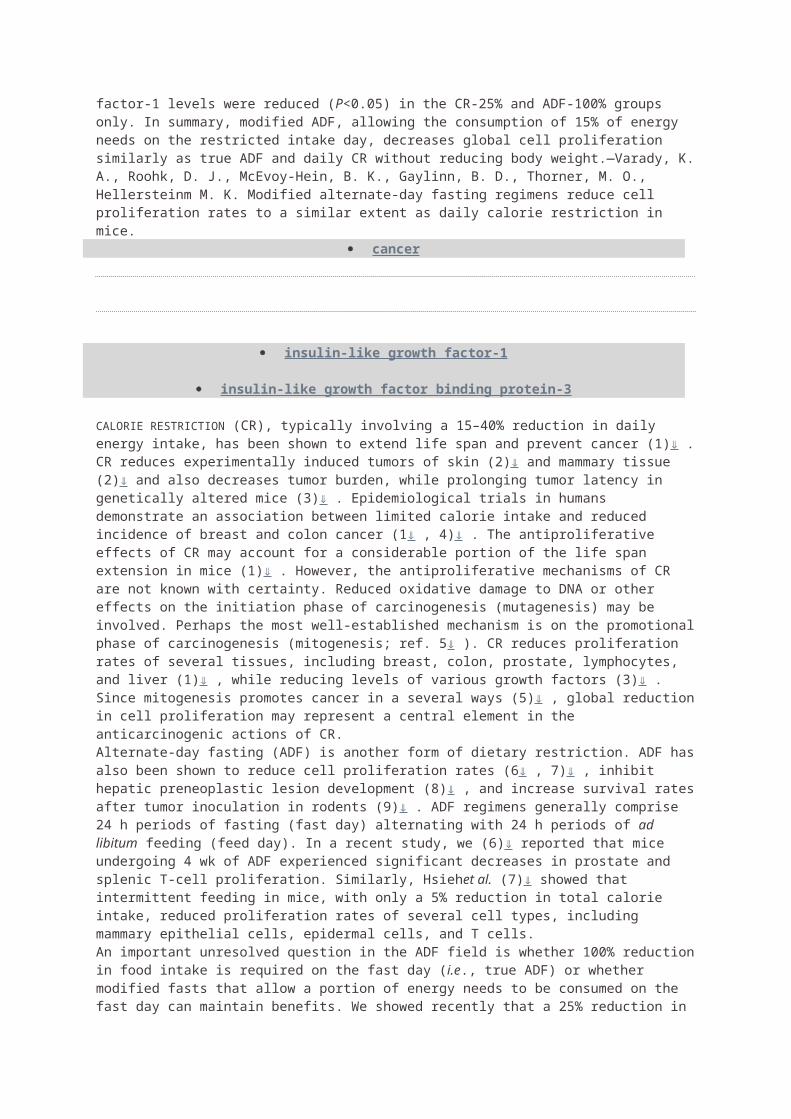
A number of factors can influence a your BMR, these factors include:
Gender – The BMR level of men is naturally higher than that of women.
Height/Weight – Taller/heavier people can have higher BMR’s compared to lighter people.
Body temp – People whose temperatures are elevated due to sicknesses such as colds or
fevers have higher BMR’s.
Age – BMR naturally decreases with an increase in age.
Nutritional status – People who consume less food have lower BMR’s.
Tobacco and caffeine usage – Not that I recommend you take up smoking but both these
products are stimulants that increase peoples BMR’s, go crazy on the coffee though.
How to calculate your BMR
You can calculate your BMR using a number of formulas. Depending on the level of complexity,
the formula can factor in your weight, gender, height, and even level of body fat. You can use
three popular formulas. These include the Mifflin-St Jeor formula, Katch-McArdle formula
andHarris-Benedict formula.
1) Mifflin-St Jeor Formula
Formula:
Males: BMR = (10 × Weight) + (6.25 × Height) – (5 × Age) + 5
Females: BMR = (10 × Weight) + (6.25 × Height) – (5 × Age) – 161
The Mifflin-St Jeor equation represents weight in kilograms, age in years and height in
centimeters.
2. Katch-McArdle Formula
The only difference between this and other formulas is that that it factors in a your body fat %
Formula:
BMR = 370 + (9.79759519 X Lean Body Mass (pounds))
3. Harris-Benedict Formula
This formula combines your weight, age, height, and gender when determining your BMR.
However, it does not factor in your lean body mass. As a result, this formula underestimates the
daily caloric requirements for hyperactive athletes while overestimating the needs of sedentary
lifestyles.
Formula:
Men: BMR = 66 + (6.23 X weight in pounds) + (12.7 X height in inches) – (6.8 X age)
Women: BMR = 655 + (4.35 X weight in pounds) + (4.7 X height in inches) – (4.7 X age)
SOURCE: http://www.primalsixpack.com/basil-metabolic-rate-bmr-and-three-popular-formulas/
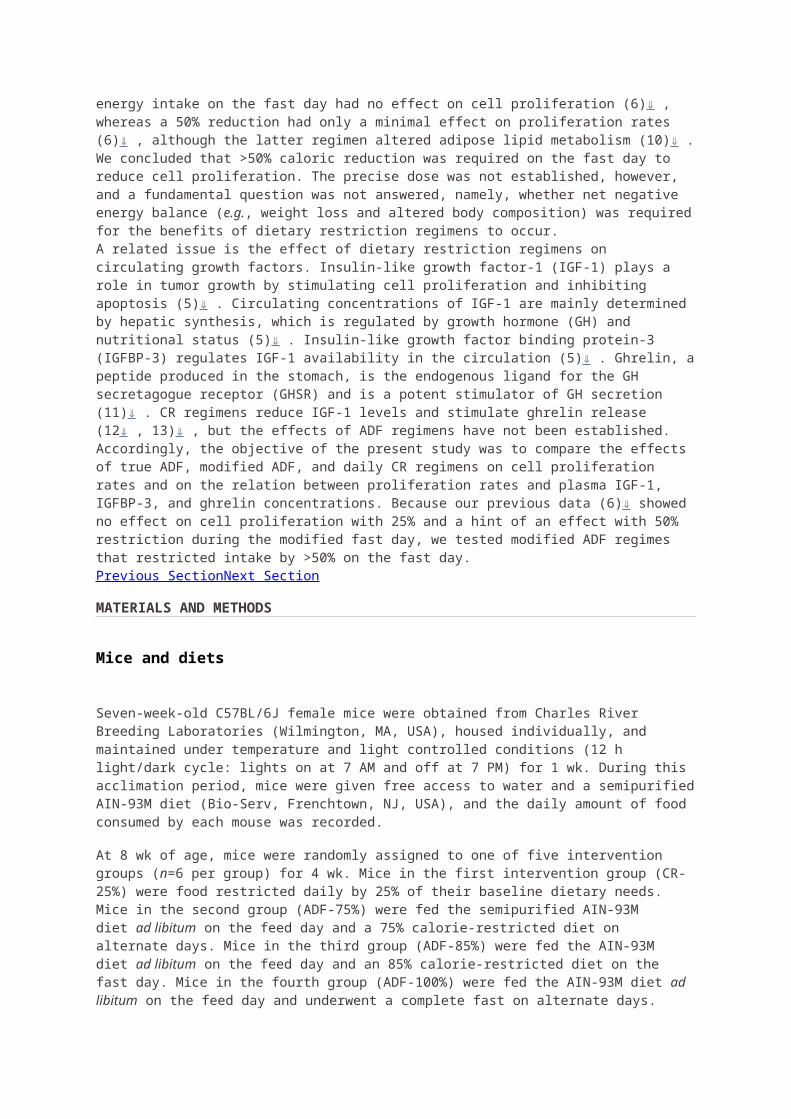

Short-term modified alternate-day fasting: a novel dietary strategy for weight loss and cardioprotection in obese adults1,2,3
1. Krista A Varady, 2. Surabhi Bhutani, 3. Emily C Church, and4. Monica C Klempel
+Author Affiliations1. 1From the Department of Kinesiology and Nutrition, University of Illinois at
Chicago, Chicago, IL.+Author Notes
↵2 Supported by departmental funding from the University of Illinois at Chicago.
↵3 Address correspondence and reprint requests to KA Varady, Kinesiology and Nutrition, University of Illinois at Chicago, 1919 West Taylor Street, Room 506F, Chicago, IL 60612. E-mail: [email protected].
Next Section
Abstract
Background: The ability of modified alternate-day fasting (ADF; ie, consuming 25% of energy needs on the fast day and ad libitum food intake on the following day) to facilitate weight loss and lower vascular disease risk in obese individuals remains unknown.Objective: This study examined the effects of ADF that is administered under controlled compared with self-implemented conditions on body weight and coronary artery disease (CAD) risk indicators in obese adults.Design: Sixteen obese subjects (12 women, 4 men) completed a 10-wk trial, which consisted of 3 phases: 1) a 2-wk control phase, 2) a 4-wk weight loss/ADF controlled food intake phase, and 3) a 4-wk weight loss/ADF self-selected food intake phase.Results: Dietary adherence remained high throughout the controlled food intake phase (days adherent: 86%) and the self-selected food intake phase (days adherent: 89%). The rate of weight loss remained constant during controlled food intake (0.67 ± 0.1 kg/wk) and self-selected food intake phases (0.68 ± 0.1 kg/wk). Body weight decreased (P < 0.001) by 5.6 ± 1.0 kg (5.8 ± 1.1%) after 8 wk of diet. Percentage body fat decreased (P < 0.01) from 45 ± 2% to 42 ± 2%. Total cholesterol, LDL cholesterol, and triacylglycerol concentrations decreased (P < 0.01) by 21 ± 4%, 25 ± 10%, and 32 ± 6%, respectively, after 8 wk of ADF, whereas HDL cholesterol remained unchanged. Systolic blood pressure decreased (P < 0.05) from 124 ± 5 to 116 ± 3 mm Hg.Conclusion: These findings suggest that ADF is a viable diet option to help obese individuals lose weight and decrease CAD risk. This trial was registered at clinicaltrials.gov as UIC-004-2009.Previous Section Next Section
INTRODUCTION
Obese individuals are at greater risk of developing coronary artery disease (CAD) (1). A decrease in energy intake by means of dietary restriction has been shown to lower the risk of CAD in obese populations (2). The most common form of dietary restriction implemented is daily calorie restriction (CR), which requires individuals to decrease their energy intake by 15–40% of baseline needs each day (3). Another form of dietary restriction used, although far less commonly, is alternate-day fasting (ADF) (4). ADF regimens were created to increase adherence to dietary restriction protocols because these regimens only require energy restriction every other day rather than every day, as with CR. ADF regimens consist of a “feed day” (ad libitum food intake for 24 h) alternated with a “fast day” (complete fast for 24 h). Modified ADF regimens that allow for the consumption of 20–25% of energy needs on the fast day have also been implemented.To date, 3 ADF studies in humans have been performed (5–7). Results from the 2 trials performed in normal-weight men and women indicate that 2–3 wk of ADF (complete fast on the fast day) significantly lowered body weight by 2.5% from baseline (5, 6). Decreases in triacylglycerol concentrations and increases in HDL-cholesterol concentrations were also observed (5, 6). Findings from the third trial conducted in overweight adults showed that 8 wk of modified ADF (20% restriction on the fast day) significantly lowered body weight by ≈8% from baseline (7). This trial also showed LDL-cholesterol and triacylglycerol reductions of 10% and 40%, respectively, when posttreatment values were compared with baseline (7). Whether or not these weight loss and cardioprotective effects can be reproduced in obese individuals by using ADF remains unknown.Nutrition intervention studies often provide participants with food to ensure that the trial is carefully controlled for energy intake and macronutrient distribution (8). At the conclusion of the study, when food is no longer provided, the individual generally returns to their baseline food intake/meal pattern. In some trials, dietary counseling is provided to the participant at the end of the study to aid the subject in maintaining his or her newly acquired healthy eating regimen (9). The ability of an obese individual to maintain an ADF regimen by providing the subject with dietary counseling, after a period of controlled food intake, is of great interest but has yet to be tested.
Accordingly, this study examined the ability of ADF to facilitate weight loss and beneficially modulate key indicators of CAD risk in obese men and women. Additionally, this study compared the degree of weight loss that could be achieved by ADF during a period of controlled food intake compared with a period of self-selected food intake combined with dietary counseling.
Previous Section Next Section
SUBJECTS AND METHODS
SubjectsSubjects were recruited from the greater Chicago area by means of advertisements placed in community centers and libraries. A total of 52 individuals expressed interest in the study, but only 20 were deemed eligible to participate after the preliminary questionnaire and body mass index (BMI; in kg/m2) assessment (Figure 1). Key inclusion criteria were as follows: age 35–65 y, BMI between 30 and 39.9, weight stable for 3 mo before the beginning of the study (ie, <5 kg weight loss or weight gain), nondiabetic, no history of cardiovascular disease, lightly active [ie, <3 h/wk of light-intensity exercise at 2.5–4.0 metabolic equivalent tasks for 3 mo before the study (10)], nonsmoker, and not taking weight loss or lipid- or glucose-lowering medications. Perimenopausal women were excluded from the study, and postmenopausal women (absence of menses for >2 y) were required to maintain their current hormone replacement therapy regimen for the duration of the study. The experimental protocol was approved by the Office for the Protection of Research Subjects at the University of Illinois, Chicago, and all volunteers gave their written informed consent to participate in the trial.
View larger version:
In this page
In a new window Download as PowerPoint Slide
FIGURE 1
Study flowchart. ADF, alternate-day fasting.
Study designA 10-wk trial, which consisted of 3 consecutive intervention phases, was implemented to test the study objectives. The 3 consecutive phases were as follows: 1) 2-wk preloss control phase, 2) 4-wk weight loss/ADF controlled food intake phase, and 3) 4-wk weight loss/ADF self-selected food intake phase.Phase 1: preloss control protocol
During the first phase, subjects were required to keep their body weight stable by maintaining their usual eating and exercise habits. As such, each subject served as his or her own control.
Phase 2: weight loss/ADF controlled food intake protocolThe second phase consisted of a 4-wk controlled food intake ADF period. The baseline energy requirement for each subject was determined by the Mifflin equation (11). All subjects consumed 25% of their baseline energy needs on the “fast” day (24 h) and then consumed food ad libitum on each alternate “feed” day (24 h). During this controlled food intake phase, subjects were provided with a calorie-restricted meal on each fast day, and consumed food ad libitum at home on the alternate day. All meals were prepared in the metabolic kitchen of the Human Nutrition Research Center at the University of Illinois, Chicago, and were provided as a 3-d rotating menu. The nutrient composition of the provided fast day meal is shown in Table 1. On the ad libitum food intake day, subjects were instructed to limit fat intake to <30% of energy needs by choosing low-fat meat and dairy options. The feed/fast days began at midnight each day, and all fast day meals were consumed between 1200 and 1400 to ensure that each subject was undergoing the same duration of fasting. On each fast day, the subjects were allowed to consume energy-free beverages, tea, coffee, and sugar-free gum and were encouraged to drink plenty of water.
View this table:
In this window
In a new windowTABLE 1
Nutrient composition of fast day meals during the controlled food intake phase1
Phase 3: weight loss/ADF self-selected food intake protocol
The third phase consisted of a 4-wk ADF self-selected food intake period in conjunction with weekly dietary counseling. During this phase, subjects still consumed 25% of their
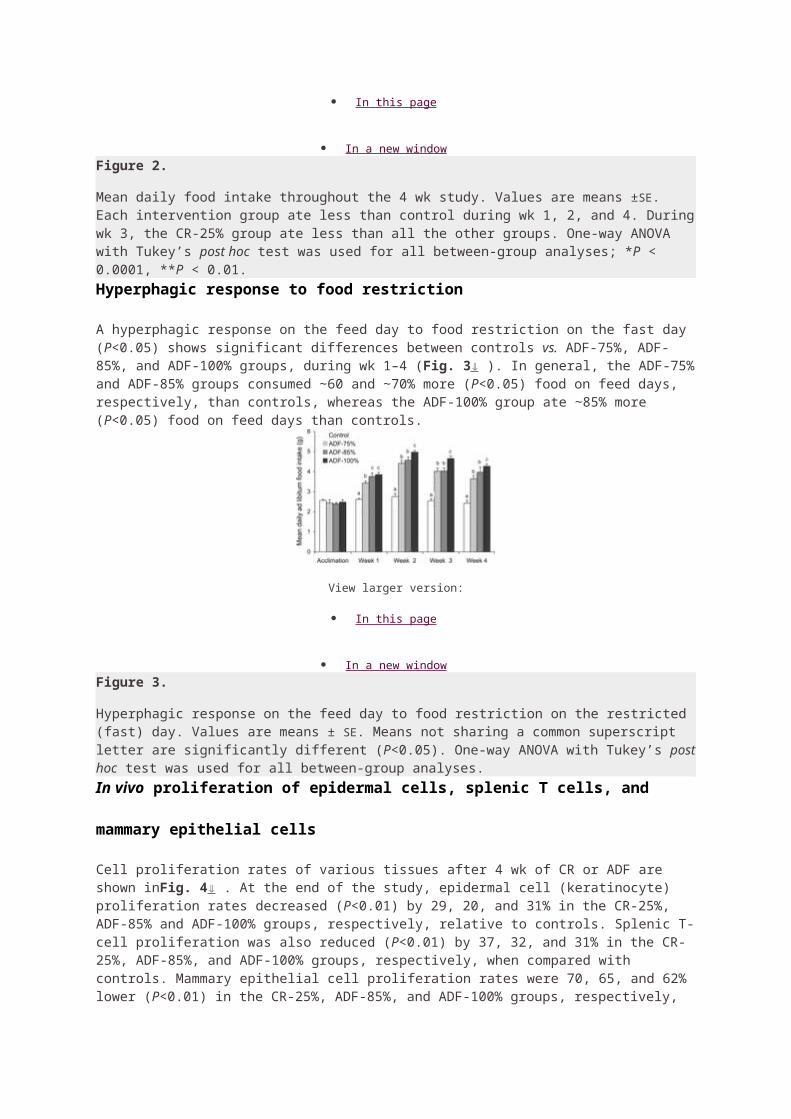
baseline energy needs on the fast day and consumed food ad libitum on the feed day. However, during this period, no food was provided to the subjects. Instead, subjects met with a registered dietitian at the beginning of each week to learn how to maintain the ADF regimen on their own at home. During each counseling session, the dietitian worked with the subject to develop individualized fast day meal plans. These plans included menus, portion sizes, and food lists that were consistent with their food preferences and prescribed calorie levels for the fast day. During these sessions, subjects were also instructed how to make healthy food choices on the ad libitum food intake days by choosing low-fat meat and dairy options. Subjects were asked to consume fast day meals between 1200 and 1400.
Blood collection protocolTwelve-hour fasting blood samples were collected between 0700 and 0900 at baseline (day 1), at the end of phase 1 (day 14), at the end of phase 2 (day 41: feed day; day 42: fast day), and at the end of phase 3 (day 69: feed day; day 70: fast day). The subjects were instructed to avoid exercise, alcohol, and coffee for 24 h before each visit. Blood was centrifuged for 15 min at 520 × g at 4°C to separate plasma from red blood cells and was stored at −80°C until analyzed.AnalysesAdherence to ADF dietsDuring phase 2 (controlled food intake phase), subjects were instructed to eat only the fast day food provided and to report any extra food item consumed by using an “extra food log.” During phase 3, subjects were provided with individualized meal plans that were consistent with their food preferences and prescribed calorie levels for the fast day. Subject was asked to report any extra food item consumed on the fast day that did not comply with their prescribed plan by using the extra food log. The log was collected and reviewed by study personnel each week. If the log indicated that the subject ate an extra food item on a fast day, that day was labeled as “not adherent.” If the log revealed that the subject did not eat any extra food item, that day was labeled as “adherent.” Adherence data were assessed each week as 1) absolute adherence (number of days adherent with diet) and 2) percentage adherence calculated by applying the following
formula:Weight loss and percentage body fat assessmentBody weight measurements were taken to the nearest 0.5 kg at the beginning of every week with subjects wearing light clothing and without shoes by using a balance beam scale at the research center (HealthOMeter; Sunbeam Products, Boca Raton, FL). BMI was assessed as kilograms divided by meters squared. Percentage body fat was assessed in triplicate after the weigh-in by using a tetra-polar bioelectrical impedance analyzer (Omron HBF-500; Omron Health Care, Bannockburn, IL) (12). The within-group CV for percentage body fat was 2.7%.Plasma lipid profile, blood pressure, and heart rate determinationPlasma total cholesterol, HDL-cholesterol, and triacylglycerol concentrations were measured in duplicate by using enzymatic kits, standardized reagents, and standards (Biovision Inc, Mountainview, CA) and analyzed by using a microplate reader (iMark Microplate Reader; Bio-Rad Laboratories Inc, Richmond, CA). The concentration of LDL cholesterol was calculated by using the Friedewald, Levy, and Fredrickson equation (13). The within-group CVs for total cholesterol, HDL-cholesterol, and triacylglycerol concentrations were 3.1%, 2.6%, and 2.5%, respectively. Blood pressure and heart rate were measured in triplicate with the subject in a seated position after a 10-min rest.StatisticsResults are presented as means ± SEMs. Tests for normality were included in the model. Sample size was calculated by assuming a 10% change in LDL-cholesterol concentrations, with a power of 80% and an α risk of 5%. One-factor analysis of variance was performed to determine an overall P value for each variable.
Bonferroni correction was used to assess significance. Relations between continuous variables were assessed by using simple regression analyses as appropriate. Data were analyzed by using SPSS software (version 17.0 for Mac OS X; SPSS Inc, Chicago, IL).
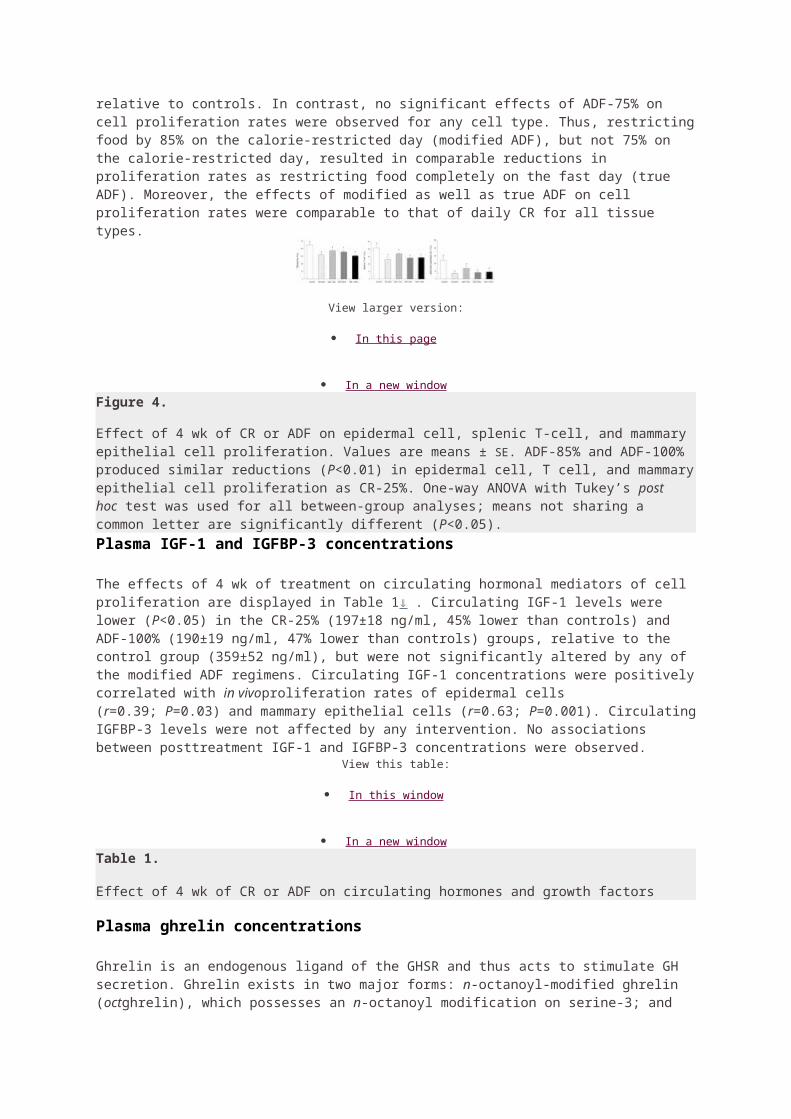
Previous Section Next Section
RESULTS
Subject dropout and baseline characteristicsTwenty subjects commenced the study, with 16 completing the entire 10-wk trial. Two subjects dropped out due to time constraints, whereas 2 others dropped out due to inability to comply with the ADF protocol. Baseline characteristics of the subjects who completed the entire 10-wk trial are shown in Table 2.
View this table:
In this window
In a new windowTABLE 2
Characteristics at baseline in subjects who completed the 10-wk trial (n = 16)Adherence to ADF dietsDuring the ADF controlled food intake phase, subjects were adherent with the provided fast day meals (ie, no extra food items consumed) for 3.8 ± 0.1 of 4 d during week 3, 2.6 ± 0.1 of 3 d during week 4, 3.6 ± 0.1 of 4 d during week 5, and 2.1 ± 0.2 of 3 d during week 6. During the ADF self-selected food intake phase, subjects were adherent with prescribed kcal goal for 3.5 ± 0.2 of 4 d during week 7, 2.5 ± 0.2 of 3 d during week 8, 3.8 ± 0.1 of 4 d during week 9, and 2.8 ± 0.1 of 3 d during week 10. When expressed as percentage adherence (Figure 2), there was no drop in adherence over the course of the controlled food intake phase or the self-selected food intake phase. Moreover, no changes in physical activity habits were reported over the course of the trial; thus, changes in body weight and clinical parameters may be attributed primarily to change in diet.
View larger version:
In this page
In a new window Download as PowerPoint Slide
FIGURE 2
Mean (±SEM) body weight and percentage adherence during the 10-wk trial. A: Body weight of subjects (n = 16) at each week. B: Percentage adherence values of subjects (n = 16) on the fast day at each week. Percentage adherence was calculated as shown inEquation 1 . There was no difference in percentage adherence between weeks during the 10-wk trial. ADF, alternate-day fasting. Overall Pvalue (P = 0.0001 for body weight) was calculated with the use of one-factor ANOVA. Values with different superscript letters are significantly different, P < 0.05 (Bonferroni analysis).
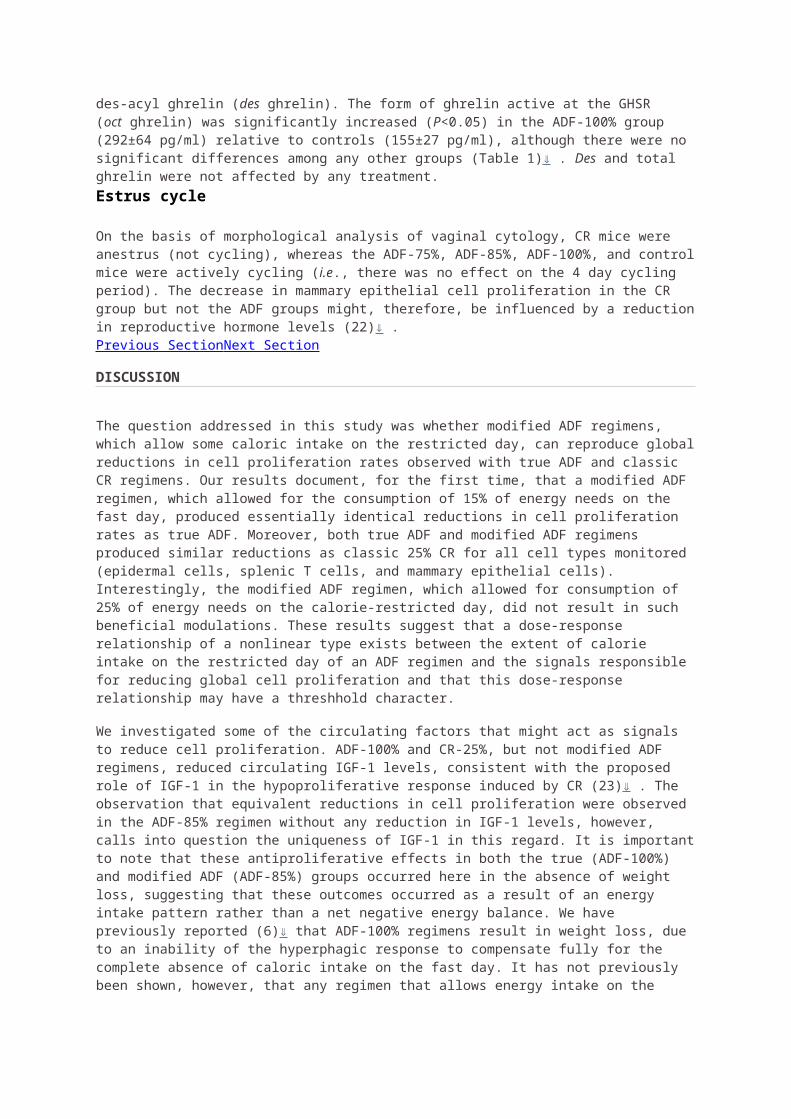
Weight loss and change in percentage body fat by ADFDuring the preloss control phase, body weight of the subjects remained stable (Figure 2). Throughout the ADF controlled food intake phase, there was a mean body weight loss of 0.67 ± 0.1 kg/wk. This rate of weight loss remained consistent during the ADF self-selected food intake phase (0.68 ± 0.1 kg/wk). Total weight loss (P < 0.001) over the course of the trial was 5.8 ± 1.1% from baseline (5.6 ± 1.0 kg). Mean BMI of the subjects at baseline was 33.7 ± 1.0. At the end of the controlled food intake phase, BMI decreased (P < 0.001) to 32.8 ± 1.0, and by the end of the self-selected food intake phase, BMI further decreased (P < 0.01) to 29.9 ± 2.1. At baseline, mean percentage body fat was 45.0 ± 1.6%. Percentage body fat was not changed after 4 wk (43.3 ± 2.1%) but was reduced (P< 0.01) after 8 wk of ADF (42.1 ± 2.0%). Fat mass decreased (P < 0.01) by 5.4 ± 0.8 kg after 8 wk of diet, whereas changes in fat-free mass were not significant (−0.1 ± 0.1 kg). Rate of weight loss was related to percentage of days adherent to diet per week (r = 0.43, P < 0.05).Changes in plasma lipids by ADFMean plasma lipid concentrations over the 10-wk trial are presented in Table 3(values presented in the text are an average of the food intake and fast days). Total cholesterol concentrations were lowered (P < 0.001) by 18.0 ± 4.3% after completion of the controlled food intake phase and by 21.2 ± 4.3% after completion of the self-selected food intake phase. Lowered LDL cholesterol (P < 0.01) was noted after 4 and 8 wk of ADF (26.0 ± 8.2% and 24.8 ± 9.6%, respectively). HDL-cholesterol concentrations were not affected by the ADF diet. Circulating triacylglycerol concentrations were lowered (P < 0.01) by 25.3 ± 7.0% after the controlled food intake phase and further lowered (P < 0.01) by 32.2 ± 6.4% after the self-selected food intake phase. No differences between food intake and fast day values were observed for any lipid parameter. Decreases in LDL cholesterol were associated with decreased body weight (r = 0.48, P < 0.05) posttreatment. Decreased triacylglycerol concentrations were related to reductions in body weight (r = 0.45, P < 0.05) and percentage body fat (r = 0.38, P< 0.05) at the end of the study.
View this table:
In this window
In a new windowTABLE 3
Plasma lipid concentrations at baseline and at the end of each phase of the trial1
Changes in blood pressure and heart rate by ADFThe effects of 8 wk of ADF on blood pressure and heart rate were also assessed. Systolic blood pressure was lowered (P < 0.05) by 4.4 ± 1.8% after completion of the controlled food intake phase and by 5.1 ± 1.6% after completion of the self-selected food intake phase (Figure 3). No differences between food intake and fast day values were observed for systolic blood pressure. Diastolic blood pressure values at baseline (80.3 ± 2.7 mm Hg) did not differ from those at week 6 (79.2 ± 2.1 mm Hg) or from those at week 10 (78.8 ± 2.5 mm Hg). Heart rate was significantly lowered (P < 0.05) from baseline after 8 wk of diet (Figure 3). Changes in body weight, BMI, and percentage body fat were not related to blood pressure or heart rate values.
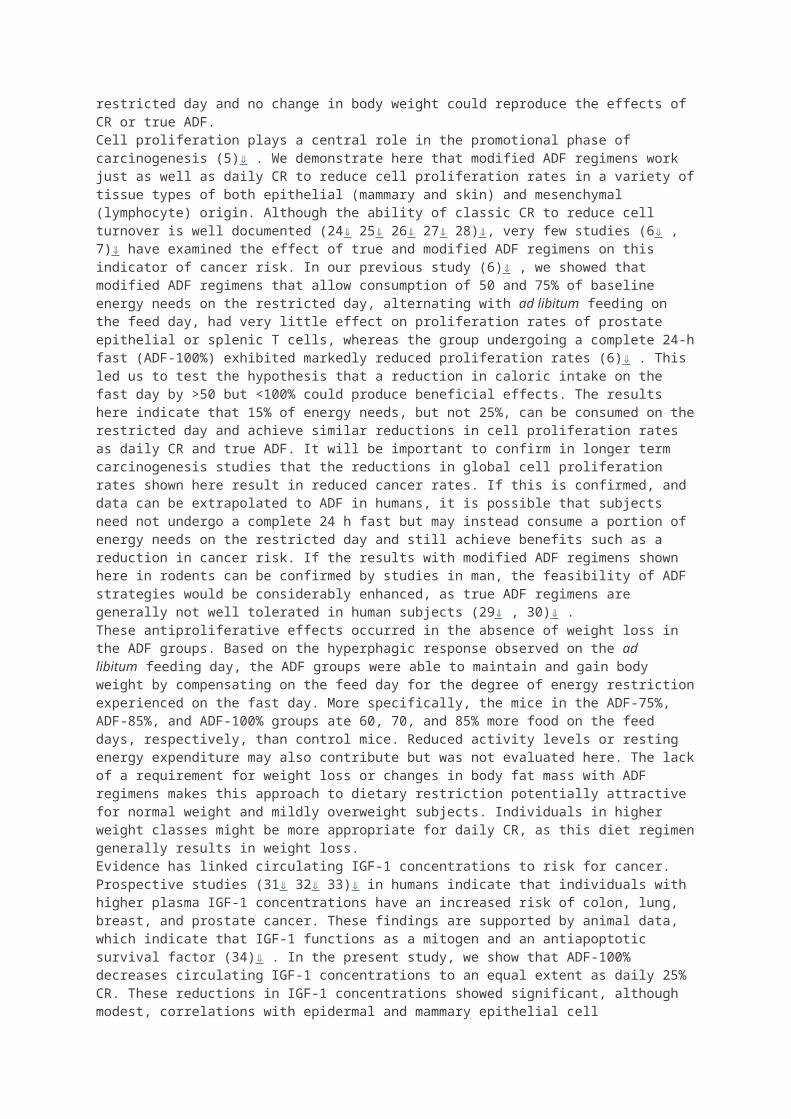
View larger version:
In this page
In a new window Download as PowerPoint Slide
FIGURE 3
Mean (±SEM) systolic blood pressure and heart rate during each phase of the 10-wk trial. A: Systolic blood pressure values of subjects (n = 16) at each week. B: Heart rate values of subjects (n = 16) at each week. ADF, alternate-day fasting. Overall P values (P =0.009 for blood pressure; P =0.012 for heart rate) were calculated with the use of one-factor ANOVA. Values with different superscript letters are significantly different, P < 0.05 (Bonferroni analysis).Previous Section Next Section
DISCUSSION
This study is the first to show that ADF is an effective dietary intervention to help obese individuals lose weight and lower CAD risk. Specifically, we show here that an ADF regimen, which allowed participants to consume 25% of their energy needs on the fast day, resulted in a mean weight loss of 5.8% from baseline after only 8 wk of treatment. Decreases in several key biomarkers for CAD risk, such as total cholesterol, LDL cholesterol, triacylglycerols, systolic blood pressure, and heart rate, were also observed. Additionally, we show here that a similar rate of weight loss was achieved during the ADF controlled food intake period when compared with the ADF self-selected food intake period. These data suggest that subjects were able to maintain the ADF meal pattern when preparing their own meals at home (ie, when removed from a clinically controlled environment).
Although CR is more frequently implemented than ADF to facilitate weight loss (4,14), many obese patients find it difficult to adhere to CR because food intake must be limited every day by 15–40% of baseline needs (15–17). ADF regimens were created to increase adherence to dietary restriction protocols because these regimens require energy restriction only every other day (4). In the present study, we measured the ability of obese subjects to adhere to their fast day energy goal. Our data show that adherence to ADF was high (days per week adherent: ≈85%) and that this level of adherence remained constant throughout the 8-wk trial. We also show here that adherence to the ADF protocol was similar between the controlled food intake phase and the self-selected food intake phase. These findings suggest that obese individuals are capable of self-selecting foods to meet their individual fast day energy goals. It should be noted, however, that the subjects met weekly with a registered dietitian. In view of this, future studies should examine the ability of obese subjects to adhere to ADF regimens without the help of a dietitian. Such data would be more indicative of the efficacy of the ADF regimen for weight loss in the general population. It should also be noted that of the 20
subjects initially recruited to partake in the study, 2 individuals dropped out due to inability to comply with the fast day diet protocol. Thus, on the basis of these findings, it is possible that this dietary restriction protocol may not be well tolerated by 10% (or possibly more) of the obese population. Nevertheless, dropout rate data from ADF trials with larger sample sizes (eg, n = 68 subjects, calculated with a power of 80% and an α risk of 5%) are still required before solid conclusions can be reached. It should also be noted that this trial was not controlled. The need for a randomized controlled trial to test similar hypotheses is clearly warranted.Decreases in body weight are directly related to degree of dietary adherence (17–20). In the present ADF study, obese subjects lost an average of 0.68 kg/wk, which corresponded to a total weight loss of 5.6 kg over 8 wk (95% CI: −7.4, −3.8). Because rate of weight loss was correlated to percentage weekly adherence, it can be assumed that the high adherence rate to ADF diets played a significant role in the total weight loss achieved. We also show here that rate of weight loss remained constant after the subjects switched from the ADF controlled food intake phase to the ADF self-selected food intake phase. Thus, the ADF diet may be an effective dietary strategy to help obese individuals achieve a stable, healthy rate of weight loss, even during periods of self-implementation. We predicted that subjects would lose a total of 4.5 kg fat mass after 8 wk (on the basis of a 75% decrease in energy intake on the fast day, with no change in energy intake on the feed day). The actual fat mass lost (5.4 kg) exceeded our predictions. This indicates that these subjects were also limiting their energy intake on the feed day, which may have occurred because the subjects knew they were enrolled in a weight loss trial. Our weight loss findings are similar to those of Johnson et al (7) (8% weight loss after 8 wk of ADF in overweight individuals). However, the trial by Johnson et al (7) takes precedence both in time and study design because it was a randomized controlled trial study. The degree of weight loss achieved by the present ADF regimen is also comparable to that of short-term CR trials (14, 21,22). In view of these similar effects on body weight, ADF may be considered a suitable alternative to CR to help obese individuals lose weight. A study that directly compares the effects of ADF to that of CR on body weight and body composition is undoubtedly an important next step in the ADF field. It must also be noted, however, that the degree of weight loss achieved by ADF may not be sustainable long term. Whether or not obese individuals are able to adhere to ADF over the long term and experience sustained weight loss will be an important focus of future research.Beneficial modulations in several key CAD risk indicators were also noted in response to ADF. Total and LDL-cholesterol concentrations decreased by 21% and 25%, respectively, after 8 wk of diet. Triacylglycerol concentrations were also lowered by 32% when baseline values were compared with posttreatment values. These modulations in LDL-cholesterol and triacylglycerol concentrations are similar to those observed by Johnson et al (7). We also show that improvements in plasma LDL-cholesterol and triacylglycerol concentrations were correlated to changes in body weight and percentage body fat posttreatment. Thus, the degree of weight loss achieved by this ADF regimen most likely played a major role in the degree to which these plasma lipids were altered (23). No changes in HDL-cholesterol concentrations were observed throughout the trial. This lack of effect of ADF on HDL cholesterol is not surprising because this cardioprotective lipid parameter is generally augmented only in response to exercise training (24). An important next step in the ADF field will be to incorporate an exercise program into this lifestyle regimen. Perhaps with the addition of physical activity, HDL-cholesterol concentrations will increase, thus beneficially modulating the entire lipid profile. Findings from the majority of CR trials also report no change in HDL cholesterol after short durations of treatment (21, 22, 25). Lipid variable measurements were assessed on consecutive food intake and fast days at the end of each diet phase (after a 12-h fasting blood draw). Results reveal that consumption of food or fasting the day before the lipid assessment has no effect on lipid concentrations. Findings from the present study also show that 8 wk of ADF in obese individuals may reduce systolic blood pressure and heart rate. In view of the powerful association of high blood pressure with risk of CAD (26, 27), this finding further supports the cardioprotective actions of ADF.
In summary, our findings indicate that ADF may be implemented as an effective diet strategy to help obese individuals lose weight and to confer protection against CAD. ADF should therefore be considered a viable option for obese patients who wish to lose weight through dietary restriction but who are unable to adhere to daily CR.
Previous Section Next Section
Acknowledgments
The authors’ responsibilities were as follows—KAV: designed the experiment, analyzed the data, and wrote the manuscript; SB and ECC: conducted the clinical trial, performed the laboratory analyses, and assisted with the preparation of the manuscript; and MCK: coordinated food preparation and distribution, provided technical assistance during the analysis phase of the experiment, and assisted with the preparation of the manuscript. The authors had no conflicts of interest to report.
Received July 12, 2009. Accepted September 1, 2009.Previous Section
REFERENCES
1. 1.↵
1. Poirier P, 2. Giles TD, 3. Bray GA, 4. et al
. Obesity and cardiovascular disease: pathophysiology, evaluation, and effect of weight loss: an update of the 1997 American Heart Association Scientific Statement on Obesity and Heart Disease from the Obesity Committee of the Council on Nutrition, Physical Activity, and Metabolism. Circulation 2006;113:898–918.
Abstract / FREE Full Text
2. 2.↵
1. Turk MW, 2. Yang K, 3. Hravnak M, 4. Sereika SM, 5. Ewing LJ, 6. Burke LE
. Randomized clinical trials of weight loss maintenance: a review. J Cardiovasc Nurs2009;24:58–80.
Medline
3. 3.↵
1. Fontana L

. Calorie restriction and cardiometabolic health. Eur J Cardiovasc Prev Rehabil 2008;15:3–9.
Abstract / FREE Full Text
4. 4.↵
1. Varady KA, 2. Hellerstein MK
. Alternate-day fasting and chronic disease prevention: a review of human and animal trials. Am J Clin Nutr 2007;86:7–13.
Abstract / FREE Full Text
5. 5.↵
1. Halberg N, 2. Henriksen M, 3. Soderhamn N, 4. et al
. Effect of intermittent fasting and refeeding on insulin action in healthy men. J Appl Physiol 2005;99:2128–36.
Abstract / FREE Full Text
6. 6.↵
1. Heilbronn LK, 2. Smith SR, 3. Martin CK, 4. Anton SD, 5. Ravussin E
. Alternate-day fasting in nonobese subjects: effects on body weight, body composition, and energy metabolism. Am J Clin Nutr 2005;81:69–73.
Abstract / FREE Full Text
7. 7.↵
1. Johnson JB, 2. Summer W, 3. Cutler RG, 4. et al
. Alternate day calorie restriction improves clinical findings and reduces markers of oxidative stress and inflammation in overweight adults with moderate asthma. Free Radic Biol Med2007;42:665–74.
CrossRef Medline
8. 8.↵
1. Hall DM, 2. Most MM
. Dietary adherence in well-controlled feeding studies. J Am Diet Assoc 2005;105:1285–8.
CrossRef Medline
9. 9.↵
1. Fappa E, 2. Yannakoulia M, 3. Pitsavos C, 4. Skoumas I, 5. Valourdou S, 6. Stefanadis C
.Lifestyle intervention in the management of metabolic syndrome: could we improve adherence issues? Nutrition 2008;24:286–91.
CrossRef Medline
10. 10.↵
1. Montoye HJ, 2. Kemper HC, 3. Saris WH, 4. Washburn RA
. Measuring physical activity and energy expenditure. Champaign, IL: Braun-Brumfield, 1996.
Search Google Scholar
11. 11.↵
1. Mifflin MD, 2. St Jeor ST, 3. Hill LA, 4. Scott BJ, 5. Daugherty SA, 6. Koh YO
. A new predictive equation for resting energy expenditure in healthy individuals. Am J Clin Nutr 1990;51:241–7.
Abstract / FREE Full Text
12. 12.↵
1. Bosy-Westphala A, 2. Later W,
3. Hitze B, 4. et al
. Accuracy of bioelectrical impedance consumer devices for measurement of body composition in comparison to whole body magnetic resonance imaging and dual X-ray absorptiometry. Eur J Obes (Silver Spring) 2008;1:319–24.
Search Google Scholar
13. 13.↵
1. Friedewald WT, 2. Levy RI, 3. Fredrickson DS
. Estimation of the concentration of low-density lipoprotein cholesterol in plasma, without use of the preparative ultracentrifuge. Clin Chem 1972;18:499–502.
Abstract / FREE Full Text
14. 14.↵
1. Chaston TB, 2. Dixon JB
. Factors associated with percent change in visceral versus subcutaneous abdominal fat during weight loss: findings from a systematic review. Int J Obes (Lond) 2008;32:619–28.
CrossRef Medline
15. 15.↵
1. Malik VS, 2. Hu FB
. Popular weight-loss diets: from evidence to practice. Nat Clin Pract Cardiovasc Med 2007;4:34–41.
CrossRef Medline
16. 16.
1. Varma JL, 2. Das S, 3. Sankar R, 4. Mannar MG, 5. Levinson FJ, 6. Hamer DH
. Community-level micronutrient fortification of a food supplement in India: a controlled trial in preschool children aged 36–66 mo. Am J Clin Nutr 2007;85:1127–33.
Abstract / FREE Full Text
17. 17.↵
1. Das SK, 2. Gilhooly CH, 3. Golden JK, 4. et al
. Long-term effects of 2 energy-restricted diets differing in glycemic load on dietary adherence, body composition, and metabolism in CALERIE: a 1-y randomized controlled trial. Am J Clin Nutr 2007;85:1023–30.
Abstract / FREE Full Text
18. 18.
1. Dansinger ML, 2. Gleason JA, 3. Griffith JL, 4. Selker HP, 5. Schaefer EJ
. Comparison of the Atkins, Ornish, Weight Watchers, and Zone diets for weight loss and heart disease risk reduction: a randomized trial. JAMA 2005;293:43–53.
Abstract / FREE Full Text
19. 19.
1. Warziski MT, 2. Sereika SM, 3. Styn MA, 4. Music E, 5. Burke LE
. Changes in self-efficacy and dietary adherence: the impact on weight loss in the PREFER study. J Behav Med 2008;31:81–92.
CrossRef Medline
20. 20.↵
1. Sacks FM, 2. Bray GA, 3. Carey VJ, 4. et al
. Comparison of weight-loss diets with different compositions of fat, protein, and carbohydrates. N Engl J Med2009;360:859–73.
CrossRef Medline
21. 21.↵

1. Cameron JD, 2. Goldfield GS, 3. Cyr MJ, 4. Doucet E
. The effects of prolonged caloric restriction leading to weight-loss on food hedonics and reinforcement.Physiol Behav 2008;94:474–80.
CrossRef Medline
22. 22.↵
1. Harp JB, 2. Henry SA, 3. DiGirolamo M
. Dietary weight loss decreases serum angiotensin-converting enzyme activity in obese adults. Obes Res2002;10:985–90.
Medline
23. 23.↵
1. Dattilo AM, 2. Kris-Etherton PM
. Effects of weight reduction on blood lipids and lipoproteins: a meta-analysis. Am J Clin Nutr 1992;56:320–8.
Abstract / FREE Full Text
24. 24.↵
1. Ellison RC, 2. Zhang Y, 3. Qureshi MM, 4. Knox S, 5. Arnett DK, 6. Province MA
. Lifestyle determinants of high-density lipoprotein cholesterol: the National Heart, Lung, and Blood Institute Family Heart Study. Am Heart J 2004;147:529–35.
CrossRef Medline
25. 25.↵
1. Tapsell L, 2. Batterham M, 3. Huang XF, 4. et al
. Short term effects of energy restriction and dietary fat sub-type on weight loss and disease risk factors. Nutr Metab Cardiovasc Dis (Epub ahead of print 29 June 2009).
Search Google Scholar
26. 26.↵
1. Kannel WB. Hypertension: reflections on risks and prognostication. Med Clin North Am 2009;93:541–58 (table of contents).
CrossRef Medline
27. 27.↵
1. Brindle P, 2. Beswick A, 3. Fahey T, 4. Ebrahim S
. Accuracy and impact of risk assessment in the primary prevention of cardiovascular disease: a systematic review. Heart 2006;92:1752–9.
SOURCE: http://ajcn.nutrition.org/content/90/5/1138.full
Effect of intermittent fasting and refeeding on insulin action in healthy men
1. Nils Halberg 1 , 2. Morten Henriksen 1 , 3. Nathalie Söderhamn 1 ,4. Bente Stallknecht 1 , 5. Thorkil Ploug 1 , 6. Peter Schjerling 2 , and7. Flemming Dela 1
+Author Affiliations1. 1Copenhagen Muscle Research Centre, Department of Medical Physiology,
The Panum Institute, University of Copenhagen, Denmark; and 2Copenhagen Muscle Research Center, Department of Molecular Muscle Biology, Rigshospitalet, Denmark
1. Address for reprint requests and other correspondence: N. Halberg, Dept. of Medical Physiology, The Panum Institute, Blegdamsvej 3, DK-2200 Copenhagen N, Denmark (e-mail: [email protected])
Submitted 9 June 2005. Accepted22 July 2005.
Next Section
Abstract
Insulin resistance is currently a major health problem. This may be because of a marked decrease in daily physical activity during recent decades combined with constant food abundance. This lifestyle collides with our genome, which was most likely selected in the late Paleolithic era (50,000–10,000 BC) by criteria that favored survival in an environment characterized by fluctuations between periods of feast and famine. The theory of thrifty genes states that these fluctuations are required for optimal metabolic function. We mimicked the fluctuations in eight healthy young men [25.0 ± 0.1 yr (mean ± SE); body mass index: 25.7 ± 0.4 kg/m2] by subjecting them to intermittent fasting
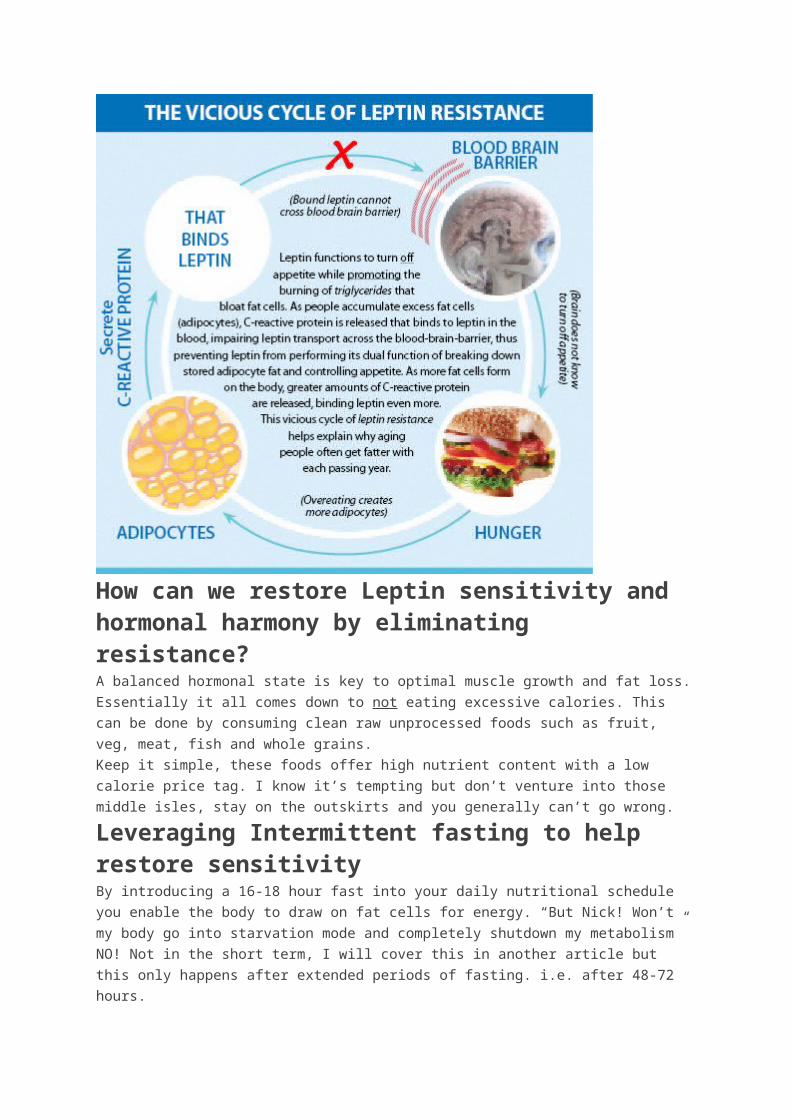
every second day for 20 h for 15 days. Euglycemic hyperinsulinemic (40 mU·min−1·m−2) clamps were performed before and after the intervention period. Subjects maintained body weight (86.4 ± 2.3 kg; coefficient of variation: 0.8 ± 0.1%). Plasma free fatty acid and β-hydroxybutyrate concentrations were 347 ± 18 and 0.06 ± 0.02 mM, respectively, after overnight fast but increased (P < 0.05) to 423 ± 86 and 0.10 ± 0.04 mM after 20-h fasting, confirming that the subjects were fasting. Insulin-mediated whole body glucose uptake rates increased from 6.3 ± 0.6 to 7.3 ± 0.3 mg·kg−1·min−1 (P = 0.03), and insulin-induced inhibition of adipose tissue lipolysis was more prominent after than before the intervention (P = 0.05). After the 20-h fasting periods, plasma adiponectin was increased compared with the basal levels before and after the intervention (5,922 ± 991 vs. 3,860 ± 784 ng/ml,P = 0.02). This experiment is the first in humans to show that intermittent fasting increases insulin-mediated glucose uptake rates, and the findings are compatible with the thrifty gene concept.
euglycemic clamp
adiponectin
OUR GENOME WAS PROBABLY SELECTED during the Late-Paleolithic era (50,000–10,000 BC), during a time humans existed as hunter-gatherers (6). At that time there were no guarantees in finding food, resulting in intermixed periods of feast and famine. In addition, physical activity had to be a part of our ancestors’ daily living as forage and the hunt for food must have been done through physical activity (15). Cycling between feast and famine, and thus oscillations in energy stores, as well as between exercise and rest, was characteristic in the Late-Paleolithic era and might have driven the selection of genes involved in the regulation of metabolism (30).
Thus our genotype selected centuries ago to favor an environment with oscillations in energy stores still exists with few if any changes. The modern sedentary lifestyle common in the westernized countries is characterized by constant high food availability and low physical activity, and it has led to an imbalance between our genotype and the environment in which we live today. This may predispose our potential “thrifty” genes to misexpress metabolic proteins, manifesting in chronic diseases (e.g., Type 2 diabetes) in the industrialized part of the world.
It is well known that physical training increases insulin action (10). The molecular events leading to an exercise- mediated increase in insulin action are not fully characterized. In addition, energy usage during each exercise bout in the training regimen with subsequent eating creates oscillations in energy stores. These oscillations are probably not as massive as the oscillations seen between periods of feast and famine for the Late-Paleolithic people, but some similarities might exist, and we speculated whether exercise-induced oscillations in energy stores could be mimicked by intermittent fasting. This study was undertaken to test the hypothesis that 14 days of intermittent fasting and refeeding improves insulin-stimulated glucose disposal.Previous Section Next Section
MATERIALS AND METHODS
Subjects
Eight healthy young Caucasian men (age 25.0 ± 0.1 yr, body mass index 25.7 ± 0.4 kg/m2) gave their written consent according the declaration of Helsinki to participate in the study. The study was approved by the local Danish ethical committee (KF 01-109/04).Two days before both clamp experiments (see Experimental Procedure), the subjects were instructed to eat at least 250 g of carbohydrate each day and to avoid strenuous exercise.

Throughout the intervention, the subjects were instructed to uphold their normal exercise habits, to maintain their usual macronutrient mixing of their meals, and to eat sufficient quantities of food on the nonfasting days to ensure that their body weight was stable. The subject characteristics are given in Table 1.
View this table:
In this window
In a new window Table 1.
Subject characteristicsExperimental Procedure
The subjects were examined on two occasions: before and after 14 days of fasting every second day for 20 h, giving seven fasting periods. Each fasting period started at 2200 and ended at 1800 the following day (for protocol see Fig. 1). During the fasting periods the subjects were allowed to drink water and were instructed to maintain habitual activities.
View larger version:
In this page
In a new window Download as PowerPoint Slide
Fig. 1.
Experimental protocol. Eight men were subjected to fasting (marked with bars) every second day for a total of 7 fasting periods. Before and after this intervention euglycemic clamps and microdialysis were performed. Blood samples and expiratory gas measurements were performed after the fasting on the days marked with black bars (days 6, 10, and 14). Additionally, after the fasting on day 10 a muscle biopsy was taken for measurement of glycogen and IMTG.
On the day of clamp experiments, the subjects arrived at the laboratory at 0800, after an overnight fast. The subjects were weighed and had their height measured and were placed in a bed position.
A microdialysis catheter was inserted in the subcutaneous fat on the abdomen (see below), and a small subcutaneous depot of 133Xe was placed in close proximity (∼5 cm) to the microdialysis catheter. One catheter (18-gauge, Becton Dickinson, Helsingborg, Sweden) was inserted in the medial cubital vein for infusion of glucose and insulin, and one catheter (18-gauge, Becton Dickinson) was inserted in a superficial hand vein in the retrograde direction. The hand was then placed in a heating pad for sampling of arterialized blood. After basal blood samples were obtained, concentrations of CO2 and O2 were measured in expiratory air by a ventilated hood and a muscle biopsy was taken from the thigh (vastus lateralis). Then the clamp was started. During the last 15 min of the 120-min clamp, CO2 and O2 in expiratory air were determined. At time t = 120 min during the clamp, a second muscle biopsy was taken from the thigh.
During the intervention period the subjects recorded their heart rate (Ultima, Cardiosport, Denmark) 24 h a day and measured their body weight in the morning before breakfast (on nonfasting days).
During the intervention period the subjects came to the laboratory at 1700 three times (days 6, 10, and 14) for weight measurement, venous blood sampling, and measurement of expiratory gases. In addition, on day 10 a muscle biopsy (see below) was taken.
Finally, the subject’s body composition was measured by dual-energy X-ray absorption scanning before and after the intervention period.
Microdialysis.
Microdialysis was performed as described previously (44). At 08.30 a single microdialysis catheter (CMA 60, CMA, Microdialysis AB) was placed in the abdominal subcutaneous adipose tissue. At sites of perforation the skin was anesthetized. The catheter was connected to a high-precision syringe pump (CMA 100 syringe pump, CMA/Microdialysis AB). For determination of interstitial glycerol concentrations, the catheter was perfused with a fluid containing an isotonic ringer acetate buffer with 2 mM glucose, 14C-glycerol (5 kBq/ml, PerkinElmer) at a speed of 1 μl/min. The relative recovery was determined by the internal reference calibration technique (37). The relative recovery was calculated as (dpmp − dpmd)/dpmp, where dpmp and dpmd are the 14C activity in the perfusate and dialysate, respectively.Euglycemic hyperinsulinemic clamp.
For each subject, a 50-ml insulin infusate had been prepared from insulin (100 IU/ml Atrapid, Novo Nordisk, Copenhagen, Denmark), 2.5 ml of the subject’s own plasma, and saline. Each clamp started with a 2-ml insulin infusate bolus followed by a constant infusion (40 mU·min−1·m−2) for 120 min. Plasma glucose concentrations were maintained at a preexperimental level by frequent analysis of arterialized blood samples (ABL-system 700, Radiometer) with subsequent adjustments of the glucose infusion rate.Blood flow.
Subcutaneous blood flow was determined by the standard local 133Xe washout method (5, 26) in the abdominal subcutaneous adipose tissue in close proximity to the microdialysis catheter. The tissue-blood partition coefficient was set to 10 (5).Muscle biopsies.
Muscle biopsies were obtained from the middle portion of the vastus lateralis before and in the end of each clamp experiment. After administration of local anesthesia, an incision of 10 mm was made and the biopsy was taken (Bergström needle method modified to apply suction). In addition, smaller biopsies were obtained from the mid portion of vastus lateralis after the fourth fasting period (i.e., day 10). The biopsy was then obtained with a Tru-core I biopsy needle and instrument (Medical Device Technology, Gainesville, FL).
Muscle biopsies were quickly cleaned from visible blood and frozen in liquid nitrogen (within 15 s) and stored at −80°C until further analysis.
Before analysis, the biopsies were freeze dried and carefully dissected free from connective tissue, blood, and fat. A sample of the muscle powder was used to determine glycogen content by the hexokinase method (25). Another part of the muscle powder was used to determine intramuscular triglyceride (IMTG) content by the chemical extraction method (18, 33). Briefly, the samples were homogenized in methanol and chloroform and the supernatant containing the lipids was removed and mixed with water. The lipids contained in the chloroform phase were then removed and hydrolysis was accomplished by adding tetraethylammoniumhydroxide (20%) and ethanol (1:28). After 30 min at 60°C, the reaction was stopped with HCl. The released acyl-glycerol was finally determined on a CMA 600 analyzer (CMA/microdialysis) and the triacylglycerol content was calculated.GLUT4 expression.
Expression of GLUT4 protein was measured by Western blot in a muscle biopsy obtained during the fasting condition before each clamp. Muscle biopsies were quickly cleaned from visible blood and/or fat, frozen in liquid nitrogen, and stored at −80°C. The muscle
tissue was subsequently homogenized with a Polytron PT 3100 (Kinematica, Littau-Luzern, Switzerland) at maximum speed for ∼10 s in 10 vol of ∼55°C buffer (4% SDS, 10 mM pyrophosphate, 2 mM sodium orthovanadate, 10 mM EDTA, 25 mM Tris·HCl, pH 6.8). Samples were sonicated for ∼5 s to break DNA strands, and total protein concentrations were determined by the bicinchoninic acid method using BSA as standard. For Western blot, 10 μg of protein were separated by SDS-PAGE on 10% gels (Criterion system, Bio-Rad, Hercules, CA) and electrophoretically transferred to polyvinylidene difluoride membranes for 45 min at 100 V by using a tank buffer system (Bio-Rad). Transfer buffer contained 25 mM Tris, 192 mM glycine, and 20% methanol. Membranes were blocked in 1% defatted milk powder plus 5% BSA in TS buffer [10 mM Tris (pH 7.4), 150 mM NaCl], incubated for 90 and 60 min with primary and horseradish peroxidase-labeled secondary antibodies, respectively, and diluted in blocking solution. Antigen-antibody complexes were visualized and quantitated by a LAS 3000 imaging system (Fuji Film). Monoclonal antibody F-27 was used for detection of GLUT4 (35). Signals were normalized against amount of desmin by reprobing the polyvinylidene difluoride membrane with a monoclonal antibody against desmin (DakoCytomation, Glostrup, Denmark).Real-time RT-PCR.
Total RNA was isolated from muscle biopsies by phenol extraction (TriReagent, Molecular Research Center) as previously described (7). Intact RNA was confirmed by denaturing agarose gel electrophoresis. Five hundred nanograms total RNA were converted into cDNA in 20 μl by using the OmniScript reverse transcriptase (Qiagen) according to the manufacturer’s protocol. For each target mRNA, 0.25 μl cDNA was amplified in a 25-μl SYBR Green PCR reaction containing 1× Quantitect SYBR Green Master Mix (Qiagen) and 100 nM of each primer (Table 2). The amplification was monitored in real time using the MX3000P real-time PCR machine (Stratagene). The threshold cycle values were related to a standard curve made with the cloned PCR products. The quantities were normalized to mRNA for the large ribosomal protein P0 (RPLP0). RPLP0 was chosen as internal control, assuming RPLP0 mRNA to be constitutively expressed (14). To validate this assumption, another unrelated “constitutive” RNA, GAPDH mRNA, was measured and normalized for RPLP0. No changes in the ratio were observed.
View this table:
In this window
In a new window Table 2.
Primers for real-time RT-PCRBlood sampling and analysis.
Arterialized blood for measurement of hormones, metabolites, and cytokines was sampled from the catheter in the hand vein at basal and at termination of the clamp. Blood was collected in iced tubes and immediately centrifuged at 4°C. Blood for determination of free fatty acids (FFA), glycerol, and β-hydroxybutyrate was stabilized with 10 IU heparin/ml blood. Blood for determination of insulin, interleukin 6 (IL-6), tumor necrosis factor-α (TNF-α), leptin, and adiponectin was stabilized with 500 kalikrein inhibitory units aprotinin (Trasylol) and 10% EDTA. All plasma samples were stored at −20°C, except those for FFA, IL-6, TNF-α, leptin, and adiponectin, which were stored at −80°C.
Plasma concentrations of insulin, IL-6, TNF-α, leptin, and adiponectin were measured by sandwich ELISA and performed according to the manufacturer’s instructions (insulin: DakoCytomatics; adipokines: R&D Systems, Minneapolis, MN).
Plasma FFA analysis was performed by an enzyme color assay (ACS-ACOD, WAKO) and performed according to manufacturer’s instructions. β-Hydroxybutyrate was determined by a modification of the method of Olsen (31). The concentration of glycerol in plasma
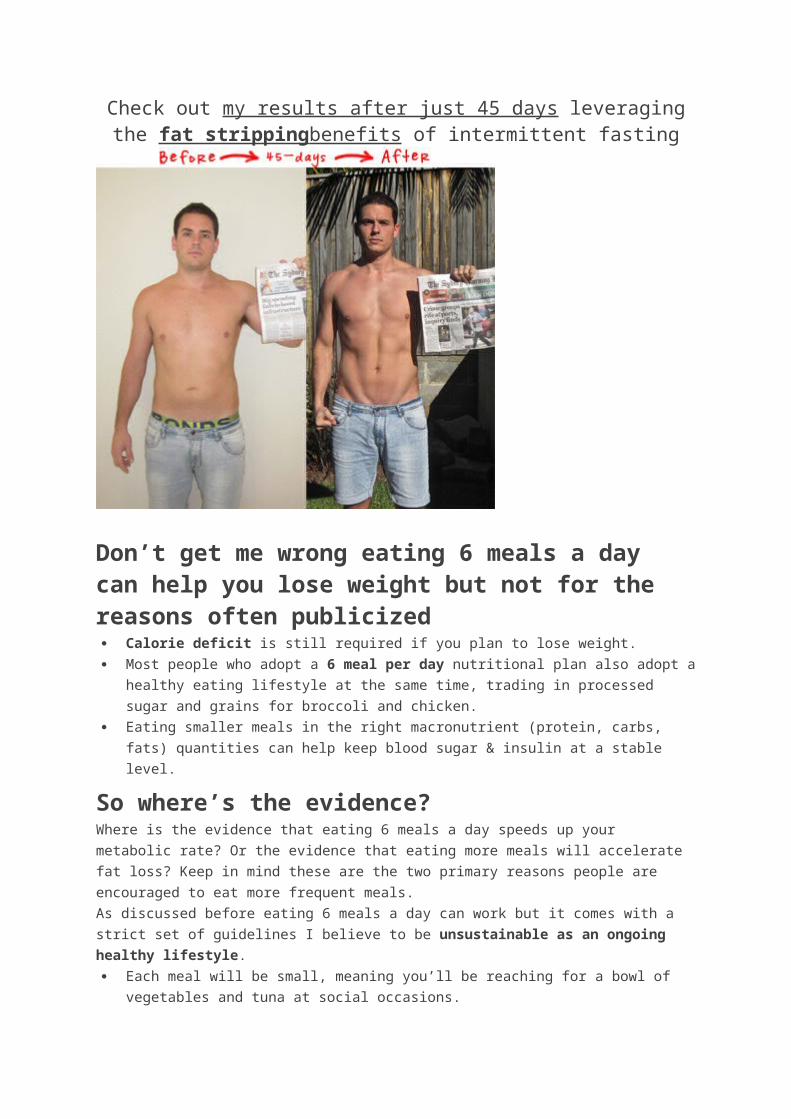
was determined by a spectrophotometric method (automatic analyzer Hitachi 912, Roche, Glostrup, Denmark).Indirect calorimetry.
Expiratory gases were measured on the Oxycon Pro Online Ventilated hood system (Jaeger). The measured values were averaged over 10 min of steady state.
Statistics.
All data are presented as means ± SE, except muscle mRNA and protein as well as plasma hormones (excluding insulin), which were log transformed before statistical analysis and are presented as geometric means ± back-transformed SE.
Two-way ANOVA for repeated measurements was used for detection of differences between the glucose infusion rates before and after the intermittent fasting. When a significant main effect was observed, the Student-Newman-Keuls test was used post hoc. In comparison of a single parameter before, during, and after the experiment, a one-way ANOVA for repeated measures was used. Comparison of a single parameter before and after the fasting intervention was performed with Student’s paired t-test. The SigmaStat version 2.03 software package was used for all statistical analysis. P < 0.05 was considered statistically significant in two-tailed testing.Previous Section Next Section
RESULTS
Weight, Body Composition, and Indexes of Physical Activity
The body weight was maintained stable throughout the experiment (86.4 ± 2.3 kg, 0.8 ± 0.1% coefficient of variation) and percent body fat was also unchanged before compared with after the fasting intervention (Table 1).The level of habitual daily physical activity did not decrease during fasting days. Thus the average heart rate during daytime was not different during fasting (79 ± 3 min−1) compared with nonfasting days (80 ± 3 min−1).Whole Body Glucose Metabolism
Plasma glucose concentration during both clamps was kept constant (Fig. 2), with a coefficient of variance of 4.4% ± 1.3% mmol/l during the last hour of the clamps.
View larger version:
In this page
In a new window Download as PowerPoint Slide
Fig. 2.
Glucose infusion rate and glucose concentrations during the clamps before and after intermittent fasting for 15 days. Left axis (bars) shows the glucose infusion rate (GIR)

necessary to maintain euglycemia during the both clamps. Right axis (dots) shows the arterialized plasma glucose concentrations during both experiments. Black bars and dots represents data from the clamp before the fasting intervention; gray bars and dots are data from after the fasting intervention. *P = 0.03 in GIR (taken as an average over the last 30 min of the clamps) before and after the fasting intervention. Data are means ± SE.The glucose infusion rate was significantly increased during the last 30 min (from 6.3 ± 0.6 to 7.3 ± 0.3 mg·min−1·kg−1) after the fasting intervention compared with before, respectively (P = 0.03) (Fig. 2).Glycerol Metabolism in Adipose Tissue
There was no effect of intermittent fasting in either the adipose tissue blood flow (2.4 ± 0.5 vs. 2.9 ± 0.7 ml·100 g−1·min−1 at basal and 2.6 ± 0.5 vs. 3.1 ± 0.5 ml·100 g−1·min−1 at the insulin-stimulated state) or the absolute interstitial glycerol concentrations (Fig. 3 A ) during the clamps. However, the interstitial glycerol concentrations decreased exponentially with the insulin infusion (R2 = 0.96 before and R2 = 0.99 after the fasting intervention), and the negative slopes of the curves were larger after the fasting intervention compared with before (P = 0.05) (Fig. 3 B ). This indicates that insulin had an enhanced inhibitory effect on lipolysis after intermittent fasting compared with before.
View larger version:
In this page
In a new window Download as PowerPoint Slide
Fig. 3.
A: insulin-mediated decrease in interstitial glycerol concentrations in subcutaneous abdominal adipose tissue before and after a period of intermittent fasting as measured by microdialysis. Basal values denote microdialysis fluid collected the last 30 min before the clamp started. During the clamp, microdialysis fluid was collected in 30-min periods. With insulin stimulation the interstitial glycerol concentrations followed an exponential drop. B: slope of this exponential drop. *P = 0.05 between before and after the intervention. Data are means ± SE.Substrates and Metabolites
Fasting (8 h) plasma glucose concentrations were similar before (5.0 ± 0.1 mM) and after (5.1 ± 0.1 mM) the intermittent fasting period. After 20-h fasting, i.e.,days 4, 6, and 10, plasma glucose concentrations were lower (4.6 ± 0.1, 4.6 ± 0.1, and 4.7 ± 0.1 mM, respectively) compared with the shorter fasting periods (8 h) (P < 0.05).Fasting (8 h) plasma β-hydroxybutyrate, FFA, and glycerol concentrations were similar before and after the intermittent fasting period, and all decreased (P < 0.05) with insulin infusion (Fig. 4). After 20-h fasting, i.e., days 4, 6, and 10, plasma FFA and glycerol concentrations were increased compared with the shorter fasting periods (P < 0.05)
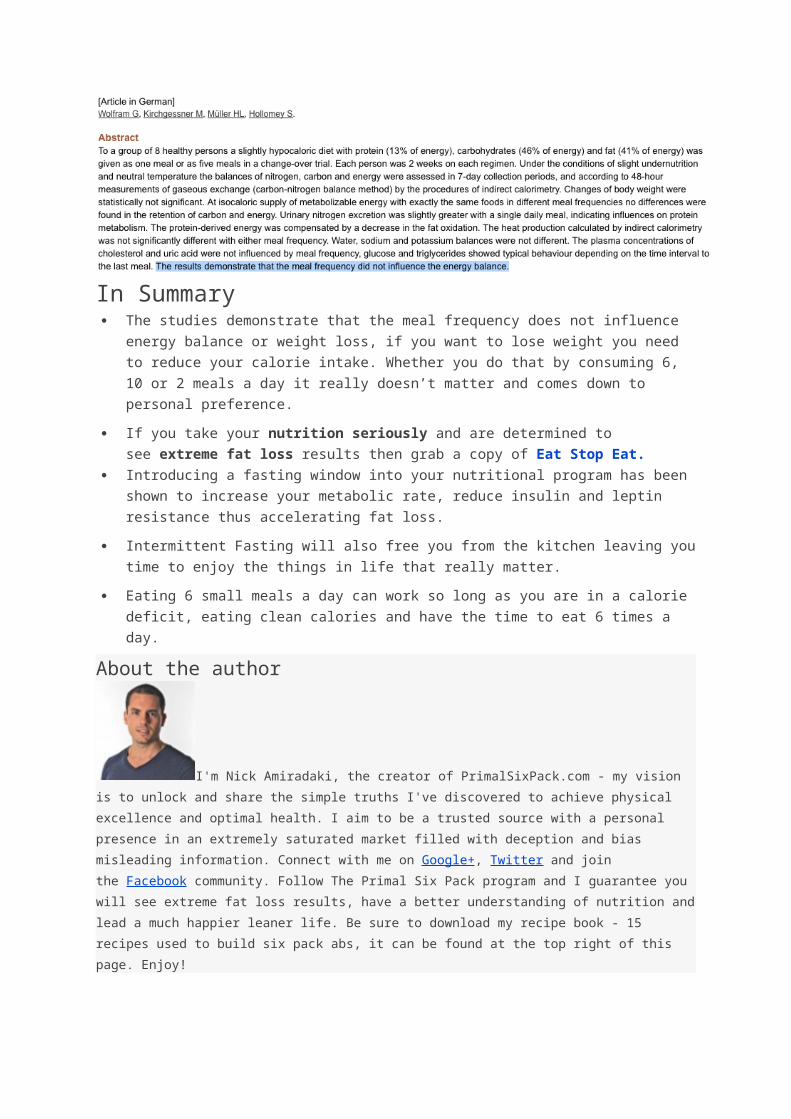
whereas the increase in β-hydroxybutyrate did not attain statistical significance (P = 0.07) (Fig. 4).
View larger version:
In this page
In a new window Download as PowerPoint Slide
Fig. 4.
Plasma concentrations of β-hydroxybutyrate (A), insulin (B), free fatty acids (FFA) (C), and glycerol (D), before and after clamps performed before and after 15 days of intermittent fasting, and after 20 h of fasting on days 6, 10, and 14of the intermittent fasting intervention. *P < 0.05 decrease during the clamp; †P< 0.05 increase during the clamp; ‡P <0.05 between the sample taken after 20 h of fasting compared with basal samples taken after an overnight fast (8 h). Data are means ± SE.Hormones
Fasting (8 h) plasma insulin concentrations were similar before (33 ± 5 pM) and after (38 ± 7 pM) the intermittent fasting period, and concentrations increased (P< 0.05) with insulin infusion (to 439 ± 63 and 404 ± 18 pM, respectively). After 20-h fasting, i.e., days 4, 6, and 10, plasma insulin concentrations were unchanged (24 ± 4, 24 ± 5, and 16 ± 4 pmol/l) compared with the shorter fasting period (Fig. 4).Plasma adiponectin concentrations did not change with insulin infusion and were similar on the 2 clamp days (Fig. 5). However, after 20-h fasting (days 6, 10, and14) a 37% increase was seen compared with the shorter fasting days (P = 0.02).
View larger version:
In this page
In a new window Download as PowerPoint Slide
Fig. 5.
Plasma concentrations of adiponectin (A), leptin (B), IL-6 (C), and TNF-α (D) before and after clamps performed before and after 15 days of intermittent fasting, and after 20 h of fasting on days 6, 10, and 14 of the intermittent fasting intervention. ‡P < 0.05 between the sample taken after 20 h of fasting compared with basal samples taken after an overnight fast (8 h). Data are geometric means (GeoMean) ± back-transformed SE.Plasma leptin concentrations were similar on the 2 clamp days and did not change with insulin infusion (Fig. 5). However, after the 20-h fasting days (days 6, 10, and 14) plasma leptin concentrations decreased compared with the shorter fasting days (P = 0.02) (Fig. 5).No significant differences were observed in either TNF-α or IL-6 concentrations during this study (Fig. 5).Muscle Triglyceride, Glycogen, GLUT4, and PGC-1α mRNA
No overall changes were observed in concentrations of IMTG (P = 0.11), glycogen (P = 0.26), or mRNA content of PGC-1α (P = 0.18) when measured before and after each clamp and after fasting on day 10 (Figs. 6 and 7). However, with insulin stimulation (data from both clamps are included), we observed a significant decrease (P = 0.04) in the IMTG concentration. Furthermore, total muscle GLUT4 protein content did not change with the fasting intervention (P = 0.66) (Fig. 7).
View larger version:
In this page
In a new window Download as PowerPoint Slide
Fig. 6.
Muscle content of triacylglycerol (IMTG) (A) and glycogen (B) at both basal and insulin-stimulated state before and after intermittent fasting for 15 days, as well as after 20-h fasting on day 10. Average concentrations of IMTG decreased (P = 0.04) with insulin stimulation when data from both clamps are included. Data are means ± SE.
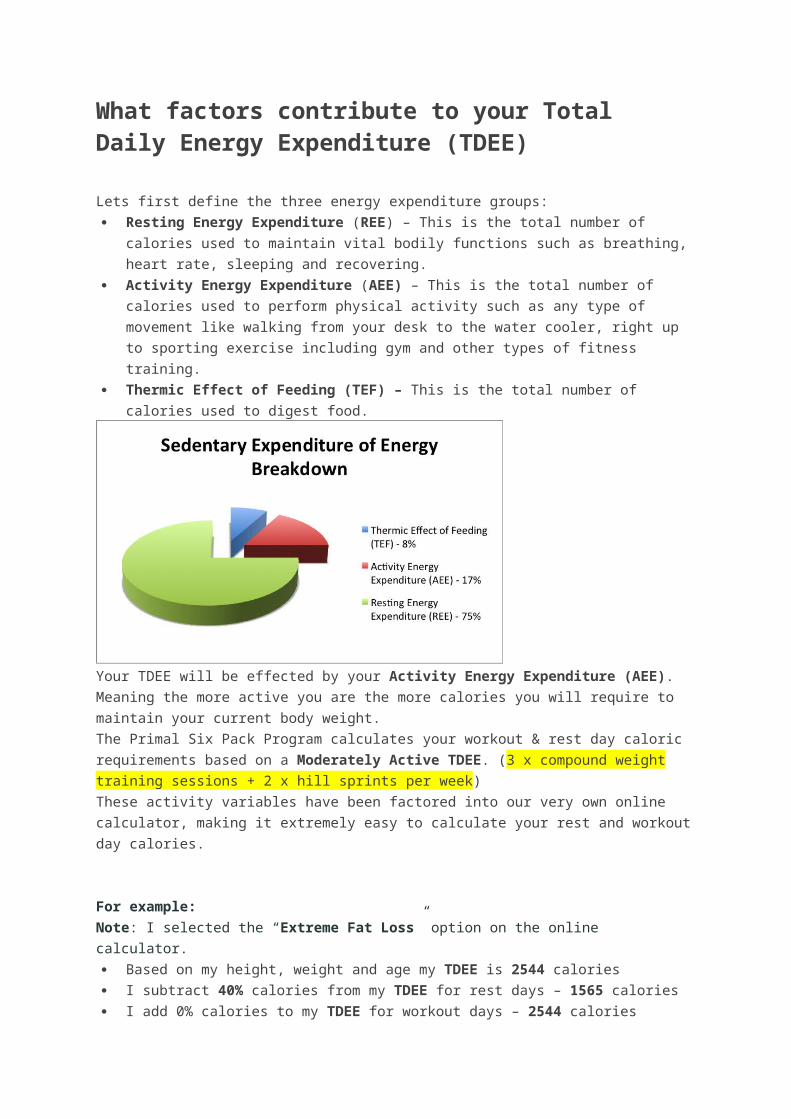
View larger version:
In this page
In a new window Download as PowerPoint Slide
Fig. 7.
Muscle content of PGC-1α mRNA normalized to large ribosomal protein P0 (RPLP0; A) at both basal and insulin-stimulated state before and after intermittent fasting for 15 days, as well as after 20-h fasting on day 10. Muscle content of GLUT4 protein normalized to desmin (B) in the basal state before and after the intermittent fasting intervention. AU, arbitrary units. Data are geometric means ± back-transformed SE.Respiratory Exchange Ratios
Respiratory exchange ratios (RER) were similar at basal (after 8-h fasting) on the 2 clamp days. With insulin stimulation RER increased at both occasions (Fig. 8). No differences were observed in RER values between the overnight and the 20-h fasted state (Fig. 8).
View larger version:
In this page
In a new window Download as PowerPoint Slide
Fig. 8.
Respiratory exchange rate (RER) at the basal and insulin-stimulated state before and after a period of intermittent fasting, and after 20 h of fasting on days 6, 10, and 14. *P < 0.05 increase with insulin stimulation. Data are means ± SE.Previous Section Next Section
DISCUSSION
In the present study we have used a very simple intervention protocol with the aim of mimicking the perturbations in energy stores that are inherent in a physical active lifestyle with regular exercise sessions. In a wider perspective we have tried to unravel the significance of genes that may be responsible for an evolutionary selection process, i.e., the thrifty genes. In this context the used intervention seems inevitably small. Nevertheless, by subjecting healthy men to cycles of feast and famine we did change the metabolic status to the better, implying that the mismatch between our ancient genotype and the lifestyle of the westernized individual of today became smaller. To our knowledge this is the first study in humans in which an increased insulin action on whole body glucose uptake and adipose tissue lipolysis has been obtained by means of intermittent fasting. This result is in accordance with previously reported in rodents (2, 32). In these studies, fasting every second day increased the insulin sensitivity approximately sevenfold according to the homeostatic model assessment (2) and decreased the incidence of diabetes (32).
Prolonged fasting for 72 h with minimal physical activity has previously been shown to increase IMTG levels in humans (46). With the present fasting protocol and maintenance of habitual daily physical activity in the fasting periods, we had expected to detect a decrease in IMTG content in the skeletal muscle. The fact that this was not seen and that muscle glycogen content was unchanged could suggest that skeletal muscle is not immediately involved in recognition of acute energy oscillations. There is no doubt, however, that fasting for 20 h while maintaining normal daily physical activity must cause a temporary negative energy balance larger than normally experienced in a daily basis. This is also indicated by our finding of decreased plasma glucose concentrations after 20-h fasting. We did not have the possibility to estimate the hepatic glycogen stores, but from animal studies (17) we must infer that liver glycogen probably also decreased considerably during the 20-h fasting periods. It has previously been suggested that usage of muscle energy depots during fasting would be an evolutionary disadvantage, because it would lessen the capacity for physical performance and hence the ability to provide food (i.e., to hunt and gather) during periods of fasting (6, 45). The present findings support this view.
In contrast to the findings in skeletal muscle, the adipose tissue responded to the changes in energy balance as intermittent fasting changed the plasma concentrations of the adipocyte-specific hormones leptin and adiponectin. However, because we did not measure the energy stores in the adipose tissue during the intervention (e.g., by fat cell size), we cannot determine whether the change in adipokine release is merely a secondary response to intermittent fasting or whether the adipose tissue is an active recognizer of energy oscillations.
Blood sampling for measurement of adipokines at basal levels before and after the fasting intervention was performed at 1000 whereas the three samples ondays 6, 10, and 14 were taken at 1700. The amount of circulating adiponectin is constant or slightly decreased during daytime (20). Hence, the boosts of 37% we observed after each fasting period are not due to nocturnal variation. Because the plasma adiponectin concentration is positively correlated to insulin sensitivity in humans (8, 23, 29) and adiponectin administration in rodents increases insulin action (9, 38, 48), it seems likely that our finding of increases in circulating adiponectin after each fasting period would be able to exert an insulin-sensitizing effect.
Skeletal muscle content of GLUT4 protein after the overnight fast did not differ before and after the fasting intervention. Future studies will have to determine whether the insulin signaling, e.g., phosphorylation of the insulin receptor substrate, is influenced by fluctuations in energy stores and thereby accounts for the increase insulin action as measured by the clamp method reported herein.
Because 36 h passed between the last fasting period and the last clamp, it seems most likely that the potential insulin-sensitizing effects of adiponectin were due to adiponectin-induced changes in gene expression. This could in turn be mediated through an AMPK activation that further activates several transcription factors including myocyte enhancing factor that increases GLUT4 expression (24,27). Another possibility is that the adiponectin boosts peroxisome proliferated-activated receptor-γ (PPAR-γ) expression as seen in 3T3-L1 adipocytes (1). In addition, because PPAR-γ induces adiponectin expression (16), it can be speculated that fasting starts a positive feedback loop that results in increased levels of both circulating adiponectin and PPAR-γ. Both are known to increase the insulin sensitivity.A considerable increase in plasma FFA concentrations (5-fold) may raise the amount of circulating adiponectin slightly (43), and glucocorticoids positively regulate adiponectin gene expression (21). FFA and glucocorticoid increase during fasting, but in previous studies no effect of fasting on circulating adiponectin was seen (19, 49). Apart from differences in increases of FFA and glucocorticoids, different analysis methods used [RIA vs. ELISA (present study)] may recognize different isoforms of adiponectin and thereby account for the discrepancy.Leptin exhibits nocturnal differences with a peak during the night (2400–0800), whereas there is no difference between 1000 and 1700; if anything, plasma leptin concentrations
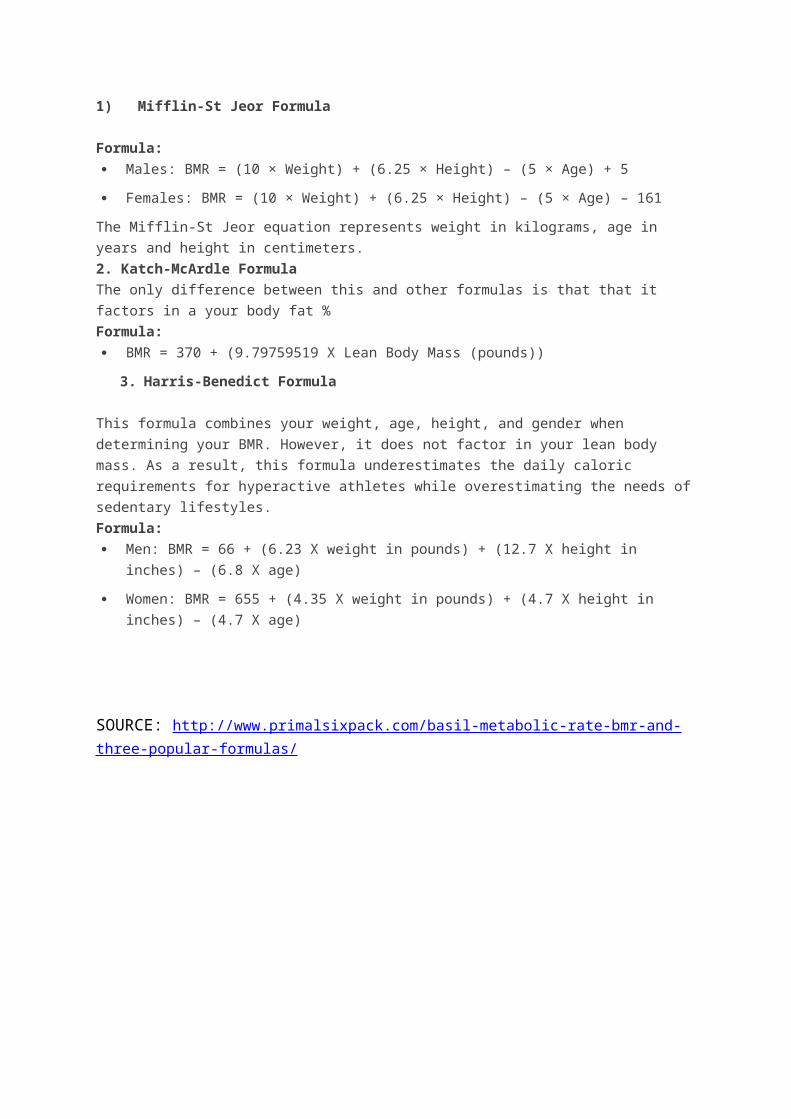
are slightly higher at 1000 (40). In accordance with previous findings (19, 41, 49), we found a decrease in circulating leptin after 8–20 h of fasting. This decrease most likely reflects a state of energy deficiency and is probably not involved in the increased insulin action we have found in the present study.The mechanism by which physical training increases whole body insulin sensitivity is not known in detail. It has previously been shown that in muscle the effect is mediated via local contraction dependent mechanisms (11–13), and this could include exercise-induced oscillations in local energy stores. However, the insulin-sensitizing effects of exercise and intermittent fasting may not exert their effects via the same pathway. Although the local effect of exercise is well proven (there is no transfer of training-induced increase in insulin sensitivity to nontrained muscle), it is less likely that the effect of intermittent fasting is a local, muscle phenomenon. Thus even though we were not able to detect changes in muscle glycogen and triglyceride content after 20-h fasting, the intervention may still have exerted the effects via oscillations in other energy stores (e.g., in adipose tissue or liver). The finding of decreased leptin concentrations corresponding to the intermittent fasting verifies that adipocyte metabolism was influenced by the intervention.We did not find an effect of intermittent fasting on muscle PGC-1α mRNA levels. In contrast, PGC-1α mRNA increases with acute exercise (34, 47) and is suggested to be involved in the enhancement of insulin-mediated glucose uptake after exercise training (28, 39). Thus PGC-1α may represent a step at which the insulin enhancement actions of exercise training and intermittent fasting diverge.Whole body insulin-mediated glucose uptake was estimated by the euglycemic hyperinsulinemic clamp technique. Even though this method is a standard for measuring insulin action, day-to-day coefficient of variation has been reported to vary between 2.4 and 15% (4, 36, 42). Part of the observed effect of the intervention may therefore be due to biological and instrumental variation.It is important to note that, in the present study, the subjects maintained their body weight throughout the intervention period, and percent body fat did not change with intermittent fasting. Thus, in contrast to previous studies using alternate-day fasting (22), the subjects in the present study kept their body weight by following the dietary instructions of eating abundantly every other day. It is well known that insulin sensitivity can be influenced by long-term profound changes of macronutrients in the diet. However, because the subjects were instructed to maintain their usual diet habits (although increasing the amount of food), it is unlikely that eventual minor changes in the macronutrient mix during 8 nonconsecutive days (i.e., the nonfasting days) would influence insulin sensitivity.
Furthermore, the increased insulin action after the intervention was not the result of the last fasting period because from the last fasting period until the beginning of the overnight fast the subjects were allowed to eat for 30 h during which they consumed at least 250 g of carbohydrates. Muscle glycogen was not different between the pre- and postintervention clamps, testifying that carbohydrate loading was sufficient before each clamp experiment.
In keeping with previous findings (3), we observed a decrease in IMTG with insulin stimulation. At first glance this seems counterintuitive. However, during insulin stimulation the FFA supply to the skeletal muscle decreases dramatically, and because some skeletal muscle FFA oxidation is still present (RER values of 0.90 ± 0.04 before and 0.86 ± 0.02 after the fasting intervention), it seems arguable that FFA is provided by the IMTG pool, which accordingly will decrease.In conclusion, the findings that intermittent fasting increases insulin sensitivity on the whole body level as well as in adipose tissue support the view that cycles of feast and famine are important as an initiator of thrifty genes leading to improvements in metabolic function (6). We suggest that a fasting-induced increase in circulating adiponectin is at least partly responsible for this finding. The change in adiponectin, together with changes in plasma leptin with fasting, underlines the important role of the adipose tissue in recognizing the oscillation in energy stores. Finally, the data indicate that intermittent fasting and physical training may increase insulin action via different

mechanisms because muscle energy stores did not change with the present fasting intervention.Previous Section Next Section
GRANTS
This study was funded by Fabrikant Vilhelm Pedersen og hustrus mindelegat, Danish Diabetes Association, Fonden af 1870, Direktør Jacob Madsen og hustru Olga Madsens Fond, Rigshospitalet, Hovedstadens Sygehusfællesskab (H:S), University of Copenhagen, and The Novo Nordisk Foundation.
Previous Section Next Section
Acknowledgments
We thank Regitze Krausø, Jeppe Bach, Thomas Beck, Christina Bøg Sørensen, and Gerda Hau for expert technical assistance.
Previous Section Next Section
Footnotes
The costs of publication of this article were defrayed in part by the payment of page charges. The article must therefore be hereby marked “advertisement” in accordance with 18 U.S.C. Section 1734 solely to indicate this fact.
Copyright © 2005 the American Physiological SocietyPrevious Section
REFERENCES
1. ↵ Ajuwon KM and Spurlock ME. Adiponectin inhibits LPS-induced NF-κB activation and IL-6 production, and increases PPARγ2 expression in adipocytes. Am J Physiol Regul Integr Comp Physiol 288: R1220–R1225,2005.
Abstract / FREE Full Text
2. ↵ Anson RM, Guo Z, De CR, Iyun T, Rios M, Hagepanos A, Ingram DK, Lane MA, and Mattson MP. Intermittent fasting dissociates beneficial effects of dietary restriction on glucose metabolism and neuronal resistance to injury from calorie intake. Proc Natl Acad Sci USA 100: 6216–6220,2003.
Abstract / FREE Full Text
3. ↵ Boden G, Lebed B, Schatz M, Homko C, and Lemieux S. Effects of acute changes of plasma free fatty acids on intramyocellular fat content and insulin resistance in healthy subjects. Diabetes 50: 1612–1617, 2001.
Abstract / FREE Full Text
4. ↵
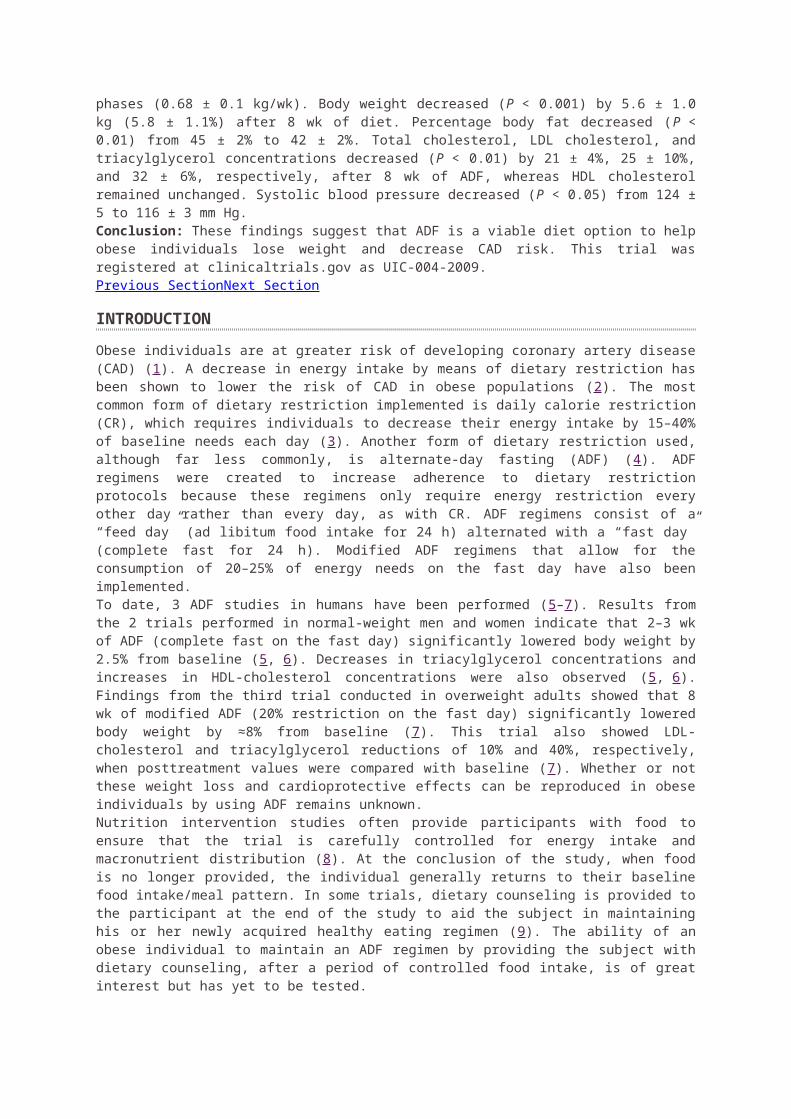
Bokemark L, Froden A, Attvall S, Wikstrand J, and Fagerberg B.The euglycemic hyperinsulinemic clamp examination: variability and reproducibility. Scand J Clin Lab Invest 60: 27–36, 2000.
CrossRef Medline
5. ↵ Bulow J, Jelnes R, Astrup A, Madsen J, and Vilmann P.Tissue/blood partition coefficients for xenon in various adipose tissue depots in man. Scand J Clin Lab Invest 47: 1–3, 1987.
Medline
6. ↵ Chakravarthy MV and Booth FW. Eating, exercise, and “thrifty” genotypes: connecting the dots toward an evolutionary understanding of modern chronic diseases. J Appl Physiol 96: 3–10, 2004.
Abstract / FREE Full Text
7. ↵ Chomczynski P and Sacchi N. Single-step method of RNA isolation by acid guanidinium thiocyanate-phenol-chloroform extraction. Anal Biochem162: 156–159, 1987.
Medline
8. ↵ Cnop M, Havel PJ, Utzschneider KM, Carr DB, Sinha MK, Boyko EJ, Retzlaff BM, Knopp RH, Brunzell JD, and Kahn SE. Relationship of adiponectin to body fat distribution, insulin sensitivity and plasma lipoproteins: evidence for independent roles of age and sex. Diabetologia46: 459–469, 2003.
Medline
9. ↵ Combs TP, Pajvani UB, Berg AH, Lin Y, Jelicks LA, Laplante M, Nawrocki AR, Rajala MW, Parlow AF, Cheeseboro L, Ding YY, Russell RG, Lindemann D, Hartley A, Baker GR, Obici S, Deshaies Y, Ludgate M, Rossetti L, and Scherer PE. A transgenic mouse with a deletion in the collagenous domain of adiponectin displays elevated circulating adiponectin and improved insulin sensitivity. Endocrinology 145:367–383, 2004.
Abstract / FREE Full Text
10. ↵ Dela F. On the influence of physical training on glucose homeostasis.Acta Physiol Scand Suppl 635: 1–41, 1996.
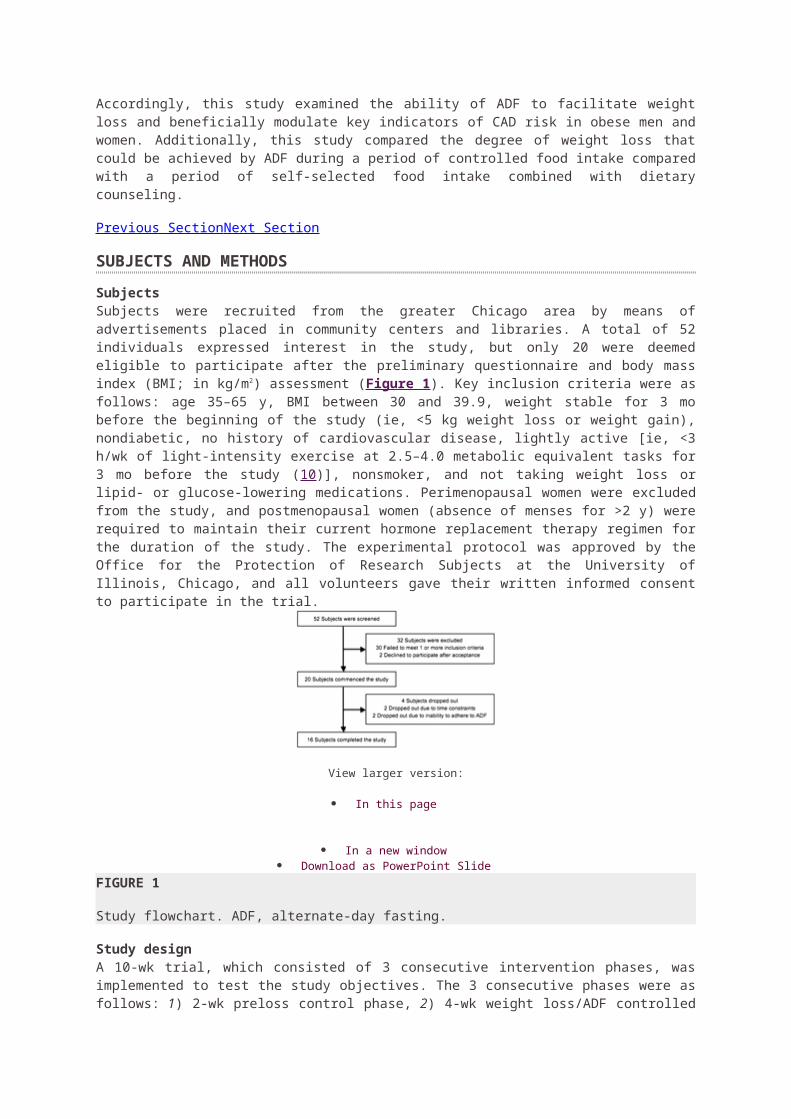
Medline
11. ↵ Dela F, Larsen JJ, Mikines KJ, Ploug T, Petersen LN, and Galbo H.Insulin-stimulated muscle glucose clearance in patients with NIDDM. Effects of one-legged physical training. Diabetes 44: 1010–1020, 1995.
Medline
12. Dela F, Mikines KJ, Von LM, Secher NH, and Galbo H. Effect of training on insulin-mediated glucose uptake in human muscle. Am J Physiol Endocrinol Metab 263: E1134–E1143, 1992.
13. ↵ Dela F, Ploug T, Handberg A, Petersen LN, Larsen JJ, Mikines KJ, and Galbo H. Physical training increases muscle GLUT4 protein and mRNA in patients with NIDDM. Diabetes 43: 862–865, 1994.
Medline
14. ↵ Dheda K, Huggett JF, Bustin SA, Johnson MA, Rook G, and Zumla A. Validation of housekeeping genes for normalizing RNA expression in real-time PCR. Biotechniques 37: 112–119, 2004.
Medline
15. ↵ Eaton SB, Strassman BI, Nesse RM, Neel JV, Ewald PW, Williams GC, Weder AB, Eaton SB III, Lindeberg S, Konner MJ, Mysterud I, and Cordain L. Evolutionary health promotion. Prev Med 34: 109–118, 2002.
CrossRef Medline
16. ↵ Evans RM, Barish GD, and Wang YX. PPARs and the complex journey to obesity. Nat Med 10: 355–361, 2004.
CrossRef Medline
17. ↵ Exton JH, Corbin JG, and Harper SC. Control of gluconeogenesis in liver. V. Effects of fasting, diabetes, and glucagon in lactate and endogenous metabolism in the perfused rat liver. J Biol Chem 247: 4996–5003, 1972.
Abstract / FREE Full Text
18. ↵ Frayn KN and Maycock PF. Skeletal muscle triacylglycerol in the rat: methods for sampling and measurement, and studies of biological variability. J Lipid Res 21: 139–144, 1980.
Abstract
19. ↵ Gavrila A, Chan JL, Yiannakouris N, Kontogianni M, Miller LC, Orlova C, and Mantzoros CS. Serum adiponectin levels are inversely associated with overall and central fat distribution but are not directly regulated by acute fasting or leptin administration in humans: cross-sectional and interventional studies. J Clin Endocrinol Metab 88: 4823–4831,2003.
Abstract / FREE Full Text
20. ↵ Gavrila A, Peng CK, Chan JL, Mietus JE, Goldberger AL, and Mantzoros CS. Diurnal and ultradian dynamics of serum adiponectin in healthy men: comparison with leptin, circulating soluble leptin receptor, and cortisol patterns. J Clin Endocrinol Metab 88: 2838–2843, 2003.
Abstract / FREE Full Text
21. ↵ Halleux CM, Takahashi M, Delporte ML, Detry R, Funahashi T, Matsuzawa Y, and Brichard SM. Secretion of adiponectin and regulation of apM1 gene expression in human visceral adipose tissue. Biochem Biophys Res Commun 288: 1102–1107, 2001.
CrossRef Medline
22. ↵ Heilbronn LK, Smith SR, Martin CK, Anton SD, and Ravussin E.Alternate-day fasting in nonobese subjects: effects on body weight, body composition, and energy metabolism. Am J Clin Nutr 81: 69–73, 2005.
Abstract / FREE Full Text
23. ↵ Higashiura K, Ura N, Ohata J, Togashi N, Takagi S, Saitoh S, Murakami H, Takagawa Y, and Shimamoto K. Correlations of adiponectin level with insulin resistance and atherosclerosis in Japanese male populations. Clin Endocrinol (Oxf) 61: 753–759, 2004.
CrossRef Medline
24. ↵ Holmes B and Dohm GL. Regulation of GLUT4 gene expression during exercise. Med Sci Sports Exerc 36: 1202–1206, 2004.
CrossRef Medline
25. ↵ Karlsson J, Diamant B, and Saltin B. Muscle metabolites during submaximal and maximal exercise in man. Scand J Clin Lab Invest 26: 385–394, 1970.

Medline
26. ↵ Larsen OA, Lassen NA, and Quaade F. Blood flow through human adipose tissue determined with radioactive xenon. Acta Physiol Scand 66:337–345, 1966.
Medline
27. ↵ Leff T. AMP-activated protein kinase regulates gene expression by direct phosphorylation of nuclear proteins. Biochem Soc Trans 31: 224–227,2003.
Medline
28. ↵ McCarty MF. Up-regulation of PPARgamma coactivator-1alpha as a strategy for preventing and reversing insulin resistance and obesity. Med Hypotheses 64: 399–407, 2005.
CrossRef Medline
29. ↵ Murakami H, Ura N, Furuhashi M, Higashiura K, Miura T, and Shimamoto K. Role of adiponectin in insulin-resistant hypertension and atherosclerosis. Hypertens Res 26: 705–710, 2003.
CrossRef Medline
30. ↵ Neel JV. Diabetes mellitus: a “thrifty” genotype rendered detrimental by “progress”? Am J Hum Genet 14: 353–362, 1962.
Medline
31. ↵ Olsen C. An enzymatic fluorimetric micromethod for the determination of acetoacetate, -hydroxybutyrate, pyruvate and lactate. Clin Chim Acta 33:293–300, 1971.
CrossRef Medline
32. ↵ Pedersen CR, Hagemann I, Bock T, and Buschard K. Intermittent feeding and fasting reduces diabetes incidence in BB rats. Autoimmunity 30:243–250, 1999.
Medline
33. ↵ Peters SJ, Dyck DJ, Bonen A, and Spriet LL. Effects of epinephrine on lipid metabolism in resting skeletal muscle. Am J Physiol Endocrinol Metab275: E300–E309, 1998.
Abstract / FREE Full Text
34. ↵ Pilegaard H, Saltin B, and Neufer PD. Exercise induces transient transcriptional activation of the PGC-1alpha gene in human skeletal muscle.J Physiol 546: 851–858, 2003.
Abstract / FREE Full Text
35. ↵ Ploug T, Stallknecht BM, Pedersen O, Kahn BB, Ohkuwa T, Vinten J, and Galbo H. Effect of endurance training on glucose transport capacity and glucose transporter expression in rat skeletal muscle. Am J Physiol Endocrinol Metab 259: E778–E786, 1990.
Abstract / FREE Full Text
36. ↵ Scheen AJ, Paquot N, Castillo MJ, and Lefebvre PJ. How to measure insulin action in vivo. Diabetes Metab Rev 10: 151–188, 1994.
Medline
37. ↵ Scheller D and Kolb J. The internal reference technique in microdialysis: a practical approach to monitoring dialysis efficiency and to calculating tissue concentration from dialysate samples. J Neurosci Methods40: 31–38, 1991.
CrossRef Medline
38. ↵ Shklyaev S, Aslanidi G, Tennant M, Prima V, Kohlbrenner E, Kroutov V, Campbell-Thompson M, Crawford J, Shek EW, Scarpace PJ, and Zolotukhin S. Sustained peripheral expression of transgene adiponectin offsets the development of diet-induced obesity in rats. Proc Natl Acad Sci USA 100: 14217–14222, 2003.
Abstract / FREE Full Text
39. ↵ Short KR, Vittone JL, Bigelow ML, Proctor DN, Rizza RA, Coenen-Schimke JM, and Nair KS. Impact of aerobic exercise training on age-related changes in insulin sensitivity and muscle oxidative capacity.Diabetes 52: 1888–1896, 2003.
Abstract / FREE Full Text
40. ↵ Sinha MK, Ohannesian JP, Heiman ML, Kriauciunas A, Stephens TW, Magosin S, Marco C, and Caro JF. Nocturnal rise of leptin in lean, obese, and noninsulin-dependent diabetes mellitus subjects. J Clin Invest97: 1344–1347, 1996.
Medline
41. ↵ Sinha MK, Opentanova I, Ohannesian JP, Kolaczynski JW, Heiman ML, Hale J, Becker GW, Bowsher RR, Stephens TW, and Caro JF.Evidence of free and bound leptin in human circulation. Studies in lean and obese subjects and during short-term fasting. J Clin Invest 98: 1277–1282,1996.
Medline
42. ↵ Soop M, Nygren J, Brismar K, Thorell A, and Ljungqvist O. The hyperinsulinaemic-euglycaemic glucose clamp: reproducibility and metabolic effects of prolonged insulin infusion in healthy subjects. Clin Sci (Lond) 98: 367–374, 2000.
Medline
43. ↵ Staiger H, Tschritter O, Kausch C, Lammers R, Stumvoll M, and Haring HU. Human serum adiponectin levels are not under short-term negative control by free fatty acids in vivo. Horm Metab Res 34: 601–603,2002.
CrossRef Medline
44. ↵ Stallknecht B, Simonsen L, Bulow J, Vinten J, and Galbo H. Effect of training on epinephrine-stimulated lipolysis determined by microdialysis in human adipose tissue. Am J Physiol Endocrinol Metab 269: E1059–E1066,1995.
Abstract / FREE Full Text
45. ↵ Stannard SR and Johnson NA. Insulin resistance and elevated triglyceride in muscle: more important for survival than “thrifty” genes? J Physiol 554: 595–607, 2004.
Abstract / FREE Full Text
46. ↵
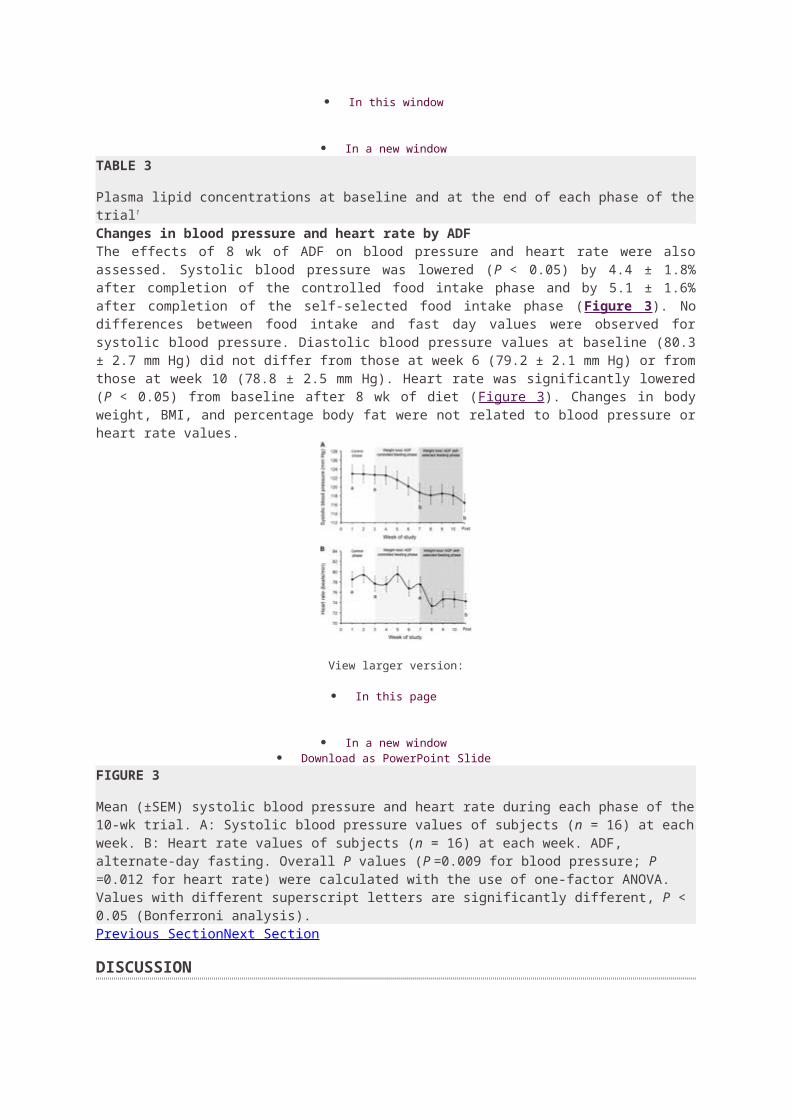
Stannard SR, Thompson MW, Fairbairn K, Huard B, Sachinwalla T, and Thompson CH. Fasting for 72 h increases intramyocellular lipid content in nondiabetic, physically fit men. Am J Physiol Endocrinol Metab283: E1185–E1191, 2002.
Abstract / FREE Full Text
47. ↵ Vissing K, Andersen JL, and Schjerling P. Are exercise-induced genes induced by exercise? FASEB J 19: 94–96, 2005.
Abstract / FREE Full Text
48. ↵ Yamauchi T, Kamon J, Waki H, Terauchi Y, Kubota N, Hara K, Mori Y, Ide T, Murakami K, Tsuboyama-Kasaoka N, Ezaki O, Akanuma Y, Gavrilova O, Vinson C, Reitman ML, Kagechika H, Shudo K, Yoda M, Nakano Y, Tobe K, Nagai R, Kimura S, Tomita M, Froguel P, and Kadowaki T. The fat-derived hormone adiponectin reverses insulin resistance associated with both lipoatrophy and obesity. Nat Med 7: 941–946, 2001.
CrossRef Medline
49. ↵ Zhang Y, Matheny M, Zolotukhin S, Tumer N, and Scarpace PJ.Regulation of adiponectin and leptin gene expression in white and brown adipose tissues: influence of beta3-adrenergic agonists, retinoic acid, leptin and fasting. Biochim Biophys Acta 1584: 115–122, 2002.
Medline
Articles citing this article
Linking the Metabolic State and Mitochondrial DNA in Chronic Disease, Health, and AgingDiabetes March 1, 2013 62:(3) 672-678
o Full Text o Full Text (PDF)
Recommendations for Management of Diabetes During Ramadan: Update 2010Diabetes Care August 1, 2010 33:(8) 1895-1902
o Full Text o Full Text (PDF)
Dietary Interventions to Extend Life Span and Health Span Based on Calorie RestrictionJ Gerontol A Biol Sci Med Sci July 1, 2010 65A:(7) 695-703
o Abstract o Full Text o Full Text (PDF)
Short-term modified alternate-day fasting: a novel dietary strategy for weight loss and cardioprotection in obese adults Am J Clin Nutr November 1, 2009 90:(5) 1138-1143
o Abstract o Full Text o Full Text (PDF)
Intermittent fasting does not affect whole-body glucose, lipid, or protein metabolismAm J Clin Nutr November 1, 2009 90:(5) 1244-1251
o Abstract o Full Text o Full Text (PDF)
Niacin stimulates adiponectin secretion through the GPR109A receptorAm. J. Physiol. Endocrinol. Metab. March 1, 2009 296:(3) E549-E558
o Abstract o Full Text o Full Text (PDF)
Alternate-day fasting and chronic disease prevention: a review of human and animal trialsAm J Clin Nutr July 1, 2007 86:(1) 7-13
o Abstract o Full Text o Full Text (PDF)
SOURCE: http://www.jappl.org/content/99/6/2128.full
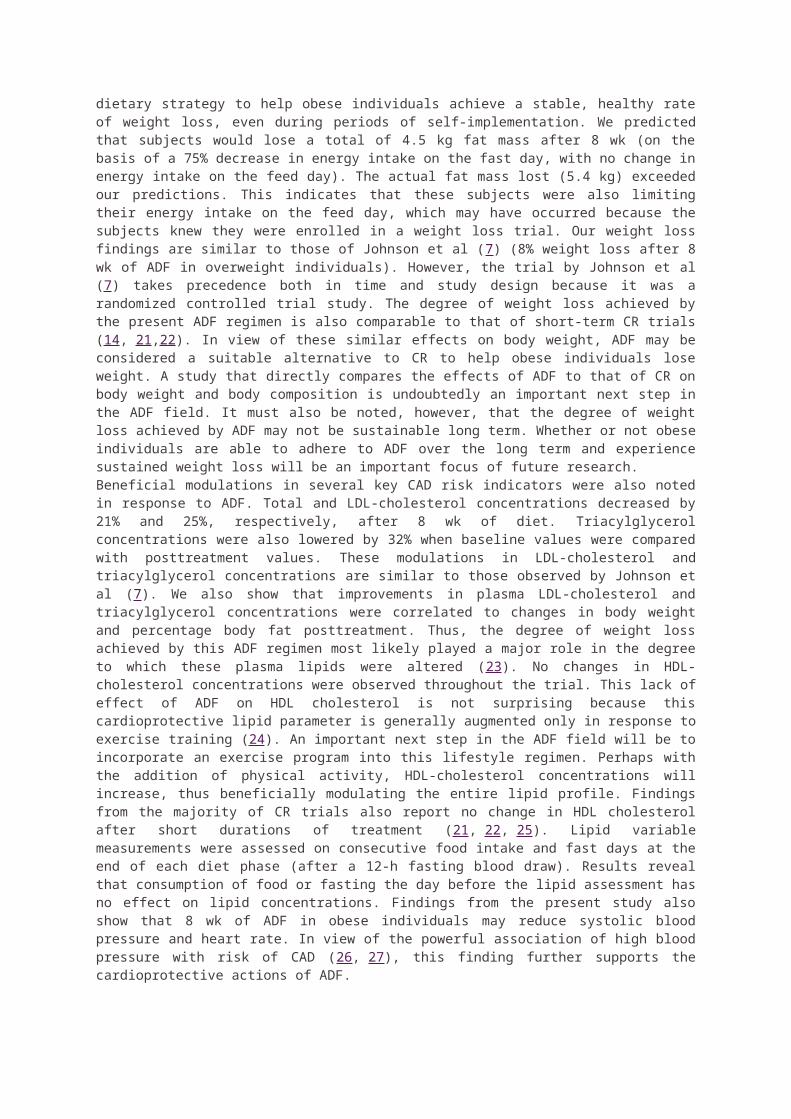
The 5:2 diet is an increasingly popular diet plan with a flurry of newspaper articles and books being
published on it in the run up to Christmas 2012 and in January 2013.
The diet first reached the mainstream via a BBC Horizon documentary called Eat, Fast and Live
Longer, broadcast in August 2012.
The 5:2 diet is based on a principle known as intermittent fasting (IF) – where you eat normally at
certain times and then fast during other times.
The 5:2 diet is relatively straightforward – you eat normally five days a week, and fast on the other two
days.
What does a daily 600-calorie diet look like?
A 600 calorie diet could consist of a slice of ham and two scrambled eggs for breakfast and then some grilled fish
and vegetable for your evening meal. And of course nothing but water, black coffee and /or green tea to drink.
Champions of the 5:2 diet claim that other than helping people lose weight, 5:2 diet can bring other
significant health benefits, including:
increased life-span
improved cognitive function and protection against conditions such as dementia and
Alzheimer’s disease
protection from disease
However we could not find (admittedly using a non-systematic approach – see below for more
details) any peer-reviewed evidence that the 5:2 diet can bring these benefits, and only a very limited
evidence base for IF in general.
What we don’t know about intermittent fasting
Despite its increasing popularity, there is a great deal of uncertainty about IF with significant gaps in
the evidence.
For example, it is unclear:
what pattern of IF is the most effective in improving health outcomes – 5:2, alternative day
fasting, or something else entirely different
what is the optimal calorie consumption during the fasting days – the 5:2 diet recommends
500 calories for women and 600 for men, but these recommendations seem arbitrary without
clear evidence to support them
how IF compares to conventional calorie-controlled diets in terms of leading to weight-loss
and improving health
how sustainable is IF in the long-term – would most people be willing to stick with the plan for
the rest of their lives?
Are there any side-effects from intermittent fasting?
Little is known about possible side-effects as no systematic attempt has been made to study this
issue. Anecdotal reports of effects include:
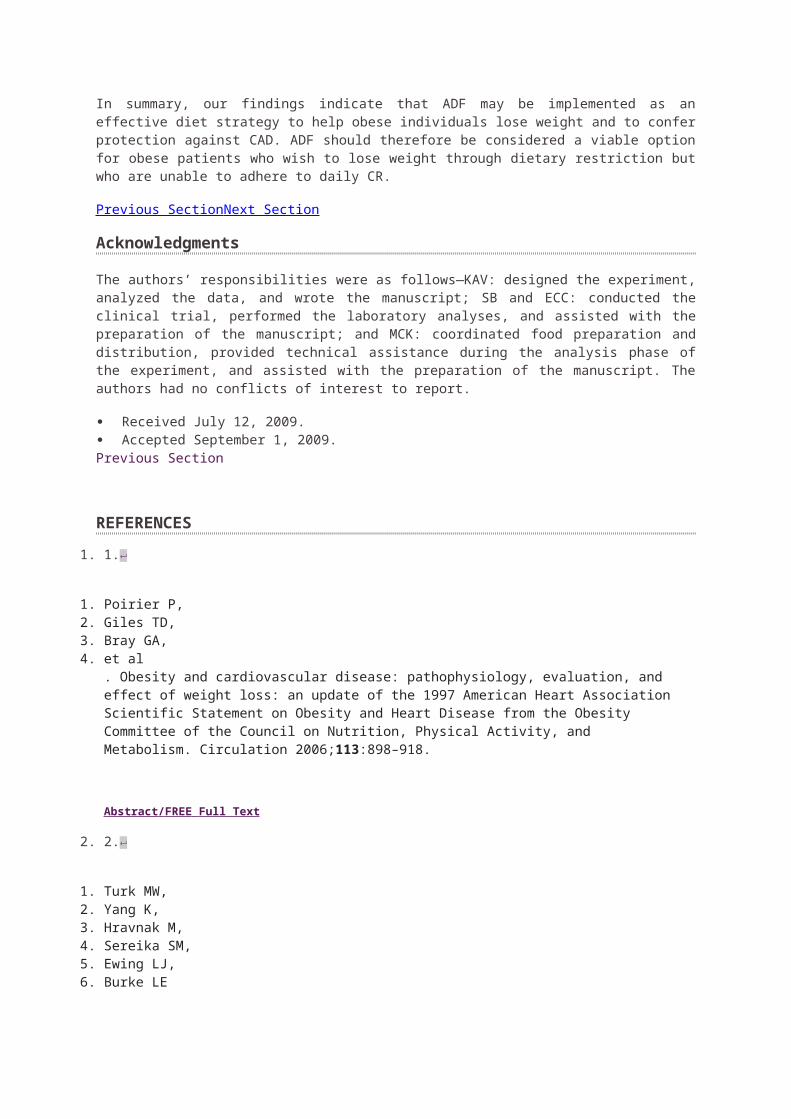
difficulties sleeping
bad breath (a known problem with low carbohydrate diets)
irritability
anxiety
dehydration
daytime sleepiness
However, more research would be needed to confirm these side-effects and their severity.
If you are fasting, you may want to think about how fasting will impact on your life during your fasting
days. You are likely to be very hungry and have less energy and this could affect your ability to
function (such as at work), in particular it may affect your ability to exercise which is an important part
of maintaining a healthy weight.
Also, IF may not be suitable for pregnant women and people with specific health conditions, such as
diabetes, or a history of eating disorders.
Because it is a fairly radical approach to weight loss, if you are considering trying IF for yourself, it is
wise to speak to your GP first to see if it is safe to do so.
What do we know?
There does not appear to be any research evidence that looks directly at the 5:2 diet.
There is some degree of evidence about the potential benefits of other forms of IF – albeit with some
significant limitations.
It should be stressed that our assessment of the evidence was confined to entering a number of
keywords into Google Scholar and then looking at a small number of studies which we felt would be
useful to explore further.
We did not carry out a systematic review (though arguably, it would be useful for researchers to do
so). So the information provided below should be taken in the spirit of us trying to provide an
introduction to some of the evidence and science of IF – not an exhaustive 'last word' on the topic.
Is there any evidence that intermittent fasting aids weight-loss?
One of the most recent pieces of research on intermittent fasting is a 2012 study (PDF,
291.4Kb) which recruited 30 obese women known to have pre-existing risk factors for heart disease.
After an initial two week period they were then given a combination diet of low calorie liquid meals for
six days of a week (similar to Slim Fast diet products) and then asked to fast for one day a week
(comsuming no more than 120 calories).
After eight weeks, on average, the women lost around 4kg (8.8lb) in weight and around 6cm (2.3
inches) off their waist circumference.
However, there are a number of limitations to consider when looking at this as evidence that it might
be a generally beneficial thing to do for most ordinary people, including that:

These women may have had increased motivation to stick with the diet because they knew
their weight would be monitored (this is a psychological effect that slimming clubs make use
of).
The women had been told that they were at risk of heart disease. It is uncertain how well most
of us would cope with such as extreme diet.
The follow-up period was short – just two months. It is not clear whether this diet would be
sustainable in the long-term or whether it could cause any side effects.
30 people is quite a small sample size. A much larger sample – including men – is required to
see if intermittent fasting would be effective in most overweight or obese people.
Is there any evidence intermittent fasting increases life-span?
There is quite a wide range of work on the effects of IF on combating the effects of aging, but almost
all of these studies involved either rats, mice or monkeys. One big problem with studies in animals –
particularly rodents – is that they are only expected to live for a few years, this makes them ideal
subjects for longevity studies. However, to carry out similar, more useful experiments in humans,
requires decades-long research to gain credible results.
In an unsystematic look at the evidence, we find only one study involving humans: a 2006 review
(PDF, 64.7Kb) of an experiment actually carried out in 1957 in Spain.
In this 1957 study, 120 residents of an old people’s home were split into two groups (it is unclear from
the study whether this was done at random). The first group (the control group) ate a normal diet. The
second group (the IF group) ate a normal diet one day and then a restricted diet (estimated to be
around 900 calories) the next.
After three years there were 13 deaths in the control group and only six deaths in the IF group.
This study is again limited by the small sample size meaning that the differences in death are more
likely to be the results of a statistical fluke. Also, many experts would feel uneasy about issuing dietary
guidelines based on a study over half a century old with unclear methods. It is unlikely that this
experiment could be repeated today – denying food to elderly people in residential care is unlikely to
be looked at kindly by an ethics committee.
Is there any evidence intermittent fasting prevents cognitive decline?
It seems that all of the studies on the supposed protective effects of IF against conditions that can
cause a decline in cognitive function (such as dementia or Alzheimer’s disease) involve animals.
For example, a 2006 study (PDF, 843.1Kb) involved mice that had been genetically engineered to
develop changes in brain tissue similar to those seen in people with Alzheimer’s disease.
Mice on an IF diet appeared to experience a slower rate of cognitive decline than mice on a normal
diet (cognitive function was assessed using a water maze test).
While the results of these animals tests are certainly intriguing,animal studies have inherent
limitations. We can never be sure that the results will be applicable in humans.
Is there any evidence intermittent fasting prevent diseases?
Much of the published research into the potential preventative effects of IF involve measuring
biological markers associated with chronic disease, such as insulin-like growth factor-I (IGF-I) –
known to be associated with cancer.
Using these kinds of biological surrogates is a legitimate way to carry out research, but they do not
guarantee successful real-world outcomes.
For example, some medications that were found to lower blood-pressure readings taken in laboratory
conditions failed to prevent strokes once they had been introduced for use in the healthcare of
patients in the world.
A 2007 clinical review (PDF, 118.6Kb) looking at the effects of IF in humans in terms of ‘real-world’
health outcomes concluded that IF (specifically, alternative day fasting) may have a protective effect
against heart disease, type 2 diabetes and cancer. However, it concluded ‘more research is required
to establish definitively the consequences of ADF (alternative day fasting)’.
Conclusion
Due to the very real uncertainties about the 5:2, especially as little is known about whether it could be
harmful to health in the long-term, most health professionals would recommend you stick to the tried
and trusted methods for weight loss and disease prevention:
eating a healthy balanced diet with at least five portions of fruit and vegetables a day
taking regular exercise
quitting smoking if you smoke
drinking alcohol in moderation
Find recommended, simple, low cost ways to lose weight in theLive Well: lose weight pages.
Edited by NHS Choices. Follow Behind the Headlines on Twitter.
Links to the headlines
The power of intermittent fasting. BBC News, August 5 2012
The 5:2 diet: can it help you lose weight and live longer? The Daily Telegraph, August 16 2012
Links to the science
Kroeger CM, Klempel MC, Bhutani S, et al. Improvement in coronary heart disease risk factors during an
intermittent fasting/calorie restriction regimen: Relationship to adipokine modulations (PDF, 291.4Kb). Nutrition &
Metabolism. Published online October 31 2012
Johnson JB, Laub DR, John S. The effect on health of alternate day calorie restriction: Eating less and more than
needed on alternate days prolongs life (PDF, 64.66Kb). Medical Hypothesis. Published online 2006
Halagappa VKM, Guo Z, Pearson M, et al. Intermittent fasting and caloric restriction ameliorate age-related
behavioral deficits in the triple-transgenic mouse model of Alzheimer's disease (PDF, 843.1Kb). Neurobiology of
Disease. Published online January 13 2007
Varady KA, Hellerstein MK, et al. Alternate-day fasting and chronic disease prevention: a review of human and
animal trials (PDF, 118.6KB). American Journal of Clinical Nutrition. Published online 2007
SOURCE: http://www.nhs.uk/news/2013/01January/Pages/Does-the-5-2-intermittent-fasting-diet-work.aspx
How to Stimulate a Leptin Response in Your Body
Leptin, a hormone released by fat cells, plays a major role in the body's regulation of hunger and in the body's expenditure of energy. When leptin is released into one's system, the feeling of hunger dissipates. Similarly, when leptin levels are low, the body starts to signal that it is hungry. For those who wish to control their body weight, leptin hormone control is important. Knowing how to stimulate a leptin response in your body can help you curb your hunger when you want to eat less.
Steps
1
Shed some of your extra weight. Simply shedding numbers on a scale will not be good enough if you want to improve your body's leptin response; in particular, you'll need to burn off as many fat cells as you can. Studies have shown that although obese people have leptin in their system, their appetites are rarely quenched because the effect of leptin is blocked by their fat cells.
Perform cardiovascular exercises on a daily basis. Simply walking 30 minutes every day can burn enough fat to trigger a leptin response. The burning of fat cells releases the leptin that was stored in the cells into the bloodstream. As an added benefit, cardiovascular exercise also boosts your metabolism.
Perform weight resistance exercises on a daily basis. Lifting weights regularly burns off fat cells and calories and strengthens your muscles. An increase in muscle mass has been shown to improve metabolism, which aids in the burning of fat cells and the release of leptin into the system.
2
Include more fruits and vegetables in your diet. A number of fruits and vegetables are excellent sources of phytonutrients, such as carotenoids and flavonoids. These are anti-inflammatory agents that help fight the body's resistance to leptin.
Carrots, broccoli, spinach, tomatoes, winter squash and papaya are all excellent sources of carotenoids. Blueberries, cherries, pomegranate, citrus fruits, green tea, onions and dark chocolate are all excellent sources of flavonoids.
3
Consume more omega-3 fatty acids. Not all fats are harmful to your body. Omega-3 fatty acids have a unique chemical structure and they are good for you when consumed in moderate amounts. Omega-3 fatty acids can be found in fish, green and leafy vegetables,
nuts and beans. The consumption of omega-3 fatty acids aids in the reduction of blood vessel inflammation, which improves the body's ability to respond to leptin.
4
Avoid fast food and processed foods. Many food producers overload their products with salt and sugar as a means of covering up the tasteless nature of artificial food. Even the diet varieties (e.g., Diet Coke) rely on sugar substitutes to mask unsavory flavors. Because of this, unnaturally processed foods lack the necessary nutrients and properties that the body requires, resulting in a deficient leptin response.
SOURCE: http://m.wikihow.com/Stimulate-a-Leptin-Response-in-Your-Body
Leptin and Weight Loss:The Hormonal Key to Fat Reduction and Heart HealthBy Kimberly Pryor
Leptin is a relative newcomer on the hormonal playing field. It wasn’t discovered until 1994, but it’s one of the most interesting hormones for anyone trying to lose weight. Although it often takes back burner to insulin in discussions about weight loss, research is emerging that it is equally important in regulating proper body weight and that it may be the reason why people on diets experience “rebound” weight gain.
Leptin is synthesized and secreted primarily by adipocytes (fat cells). It is present in blood serum in direct proportion to the amount of adipose (fat) tissue and as fat cells become enlarged in obesity, they secrete more leptin. This important hormone communicates with the central nervous system to regulate energy intake and energy stores in the body so that the hypothalamus can efficiently maintain a stable body weight.
Leptin receptors are present in tissues throughout the body, suggesting that it can have direct effects on other aspects of health. Leptin helps regulate immunity1, maintain healthy blood pressure levels2, and support cognitive function3. In addition, women with premenstrual syndrome have been found to have overly high levels of this hormone4 as do individuals with hypothyroidism.5 High leptin levels correlate with left ventricular hypertrophy, a major risk factor for congestive heart failure6, and leptin levels are a significant predictor of fibrinogen7, a clotting factor and major risk factor for heart disease.
Clearly, leptin is of interest in a wide range of conditions, and may be one of the most important hormones in the human body.
Understanding LeptinAt first glance, leptin can seem like a confusing and contradictory hormone. Leptin suppresses food intake8 and increases thermogenesis9 and metabolic rate.10 Evidence also exists that leptin can mimic some of insulin’s actions. Accordingly, leptin increases glucose uptake in skeletal muscle and brown adipose tissue in vivo11-12, and normalizes blood glucose levels in diabetic rats.13
Consequently, one would think that it would be desirable to increase leptin levels.
However, in most overweight people, leptin levels are actually excessively high due to leptin resistance, a process similar to the concept of insulin resistance.
To understand why this is so, we must look at the way a normal weight body is designed to communicate. The process begins when the brain notes the amount of leptin secreted by fat cells. If the brain determines these leptin levels are normal, it shuts off the signal to store extra calories as fat. The body no longer feels like eating because the brain, with the help of leptin, has given the full signal.
When our hunter/gatherer ancestors experienced decreased food supply, calories stored as fat were broken down and used as fuel. This caused leptin levels to decline and metabolism to decrease to adjust to the decreased food supply. When food supply once again increased, so too did leptin levels. Once the hunter/gatherer humans had replenished their reserves, leptin signaled our ancestors to stop eating.
In today’s society, however, food surrounds us and overeating is common. This disrupts the hormonal signals in our bodies. Eventually leptin receptors become desensitized to leptin’s effects. Once a person becomes leptin resistant, the body has a difficult time transporting leptin past the blood brain barrier to the hypothalamus where it is needed to send satiety signals. Even though blood levels of leptin may be excessively high, brain levels are insufficiently low, resulting in food cravings and weight gain. The brain believes the body is in a famished state and tells it to continue to store fat.
In addition, circadian changes of blood leptin level in non-obese people are more significant than these changes in obese people.14 Because leptin inhibits cortisol, if leptin is highest first thing in the morning (when it should be at its lowest levels), it may inhibit cortisol production at a time when cortisol is needed to feel awake and energized.15
Leptin levels tend to rise as we age, one possible reason why individuals under 30 have an easier time losing weight gained than people who are in their 40s and beyond. Furthermore, estrogen deficiency is related to a rise in leptin, offering a potential explanation for why women gain weight more easily after menopause.16
Leptin and Weight GainLeptin is a powerful appetite suppressant—we even have leptin receptors on our taste buds, which help to regulate cravings for sweet foods.17 Ironically, as previously stated, leptin levels are excessively high in obese people and this leptin resistance is associated with weight gain. When a person becomes leptin resistant, leptin receptors throughout
the body, including those on the taste buds and in the brain, aren’t getting the message that food consumption should stop. Research indicates that lowering leptin levels in overweight people can restore this malfunctioning leptin system and trigger weight loss.
In one study, researchers investigated leptin changes in 26 obese adolescents (12 boys and 14 girls) during and after a 9-month weight-reduction program in a specialized institution with lifestyle education, moderate energy restriction and regular physical activity, followed by a 4-month period at home. After 9 months, the adolescents had lost 19 percent body weight and 41.3 percent fat mass. At the same time, plasma leptin concentration was 70 percent lower. After the subjects had returned home for four months, leptin rose to an intermediate level in the 10 adolescents who had regained some of the body weight they had lost.18
In another study of 23 obese patients (8 males, 15 females) who had undergone laparoscopic adjustable gastric banding surgery to achieve weight loss, their body mass index was reduced by 33 percent while the levels of circulating leptin declined by 52 percent. Leptin levels strongly and persistently correlated with body mass index (BMI) during the study and, compared to insulin, leptin showed the most significant and persistent correlation with BMI.19
Leptin research also has shed some light on why people who diet often gain back the unwanted pounds. Researchers studied 154 overweight Japanese men who were enrolled in a 24-month weight loss program. Rebound weight gain was defined as significant weight loss at 6 months but subsequent body weight regain during the next 18 months.
The results showed that 37 subjects maintained weight loss during 24 months, whereas 36 subjects had rebound weight gain. Subjects who maintained weight loss had at entry several things in common: significantly lower fat mass, lower leptin levels and lower plasma norepinephrine levels compared to those with rebound weight gain. In fact, body fat mass, leptin levels, and norepinephrine levels at the study’s start predicted the degree of change in body weight during the 24-month study period.
Subjects with rebound weight gain had a significantly higher polymorphism (or abnormality) in a certain gene that was linked to significantly higher levels of plasma leptin, norepinephrine, and body fat mass levels and a greater waist-to-hip ratio both at entry and throughout the study.20
Leptin and Cardiovascular HealthLeptin may govern other areas of our health. One of its most important responsibilities could be that of supporting the cardiovascular system. Studies have linked high leptin levels to an increased risk of cardiovascular disease and leptin receptors are expressed in coronary arteries21 and in the heart.6 In obese subjects, leptin levels are the most significant predictor of higher levels of fibrinogen, a clotting factor considered to be one of the most important risk factors for heart disease.7 In obese patients with left ventricular hypertrophy, a risk factor for congestive heart failure, the higher the leptin levels the greater the left ventricular mass.6
Another factor involved in leptin’s heart disease promoting role is its ability to upregulate endothelin-1 production. Endothelin-1 is one of several peptides derived from the vascular endothelium and is a potent vasoconstrictor. By constricting blood vessels, endothelin-1 could have a role to play in the development of cardiovascular disease, and by upregulating endothelin-1, leptin could be involved in obesity-related heart disease.22
High leptin levels also are associated with hypertension.23
Leptin-Controlling Lifestyle Factors Sufficient sleep is one of the most important factors in controlling leptin. Like melatonin, leptin is secreted in the highest amounts at night, and in human subjects deprived of sleep the timing of the leptin secretion peak occurred earlier, disrupting hormonal profiles and encouraging weight gain.24
Avoiding sugar and bad fats and instituting a daily exercise regimen also can help to a certain extent. However, research has shown that when engaged in a weight loss program, obese subjects aren’t as efficient at reducing leptin levels as normal weight subjects. When morbidly obese and lean females went on a 24-hour fast, serum leptin levels decreased by only 20 percent in obese subjects compared to 62 percent in lean subjects, even though the obese subjects did lose some of their body mass index.25
Nutritional Strategies While lifestyle factors are important in controlling leptin levels, to achieve weight loss, individuals may need to turn to leptin-lowering supplements. Scientists have explored the possibility that a number of nutritional supplements can reduce levels of this weight-controlling hormone.
As mentioned above, melatonin plays a key role in regulating leptin. Both of these hormones work together to regulate body mass and energy balance. In addition, melatonin receptors were recently found in adipocytes, where leptin is synthesized. Furthermore, pineal melatonin secretion declines with aging, whereas visceral fat, plasma insulin, and plasma leptin tend to increase.26
A number of studies show that melatonin supplementation can lower leptin levels and that the pineal gland helps control leptin release. In one study, giving melatonin to rats with pineal glands resulted in significant decreases in leptin levels compared to the control group. In rats without pineal glands—the gland where melatonin is synthesized—serum leptin levels were significantly elevated. Melatonin treatment of the rats without pineal glands resulted in suppressed leptin secretion.27
In another study, daily melatonin administration in middle-aged rats reduced body weight, intra-abdominal obesity, and plasma leptin and insulin levels to youthful levels, regardless of how much food the animals consumed. Compared to controls, 12 weeks’ of melatonin supplementation decreased body weight by 7 percent, intra-abdominal fat by 16 percent, plasma leptin by 33 percent, and plasma insulin by 25 percent. Melatonin-treated rats that were then crossed over to control treatment for a further 12 weeks gained body weight, whereas control rats crossed to melatonin treatment lost body weight. Food intake did not change in either group. Feed efficiency (grams of body weight change per gram of cumulative food intake), was negative in melatonin-treated rats and positive in control rats before crossover; this relationship was reversed after crossover.28
In a later study by some of the same researchers, melatonin reduced body weight and leptin levels in middle-aged rats fed a diet similar in high-fat content to the typical American diet.29
Beyond stimulating weight loss, melatonin helps reduce the free radical damage associated with nitric oxide, produced in fat cells when leptin levels are high. Nitric oxide causes oxidant damage and ultimately cell death and may be partly responsible for the increased heart disease rate associated with obesity.30
L-carnitine is another nutrient shown to exert some promising leptin-lowering effects. Overweight/obese premenopausal women consumed a hypocaloric diet (30 percent protein, 30 percent fat and 40 percent carbohydrates) in addition to increasing the number of steps per day. For ten weeks, 35 of the women received carnitine in a randomized, double-blind manner, while 35 women remained untreated.
After carnitine supplementation, leptin levels declined by nearly 6 percent. In addition, carnitine-treated subjects decreased total energy by 26.6 percent, energy from carbohydrates by 17.3 percent, body weight by 4.6 percent, body mass index by 4.5 percent, and waist circumference by 6.5 percent. Ten of 19 participants with insulin resistance became insulin sensitive and 7 of 8 participants with the metabolic syndrome no longer had the syndrome after the intervention.31
Lowering leptin levels also may account for conjugated linoleic acid’s (CLA) ability to cause weight loss. Researchers at Ohio State and Purdue Universities conducted a double-blind, eight-week study of 21 type-2 diabetics. One group of subjects consumed a CLA supplement daily, the other group consumed a safflower oil supplement as a control.
Diabetics who supplemented their diet with CLA had a lower body mass than subjects who did not include the fatty acid in their diet. In the group taking safflower supplements, weight remained the same. Higher CLA levels in the bloodstream were associated with lower levels of leptin. In the safflower group, leptin levels rose slightly.
In addition, the CLA-supplemented subjects had nearly five-fold lower blood sugar levels compared to patients taking the safflower oil.32
In animals, CLA also has exerted both weight-lowering and leptin-lowering properties. In one rodent study, compared to controls, CLA significantly reduced serum leptin concentration by 42 percent while also decreasing the weight of visceral adipose tissue. CLA supplementation produced a 5.2 percent decrease in body weight compared with the control even though food intake was similar in both groups.33
In vitro, CLA significantly reduced leptin secretion from cultured adipocytes (fat cells), and reduced leptin mRNA levels within the cells.34
Another natural substance with potent leptin-lowering properties is omega-3 fatty acids. In cultures where fish is eaten daily, blood leptin levels are low. Researchers compared two African tribes, both equal in their daily caloric consumption and lifestyles. The main difference between the two groups was that the 279 who dwelled near a lake derived approximately one quarter of their total calories from fish. The 329 members of the other group lived farther inland, and consumed the majority of their calories from fruits and vegetables.
The study comparing the two tribes found that men who consumed fish had 2.5 nanograms of leptin per milliliter of blood—less than one quarter of the leptin level of the non-fish-consuming males. Significantly lower leptin levels were also found in females who ate fish compared to their non-fish-consuming counterparts.
The researchers speculated that eating fish may alter the influence of leptin on body fat and help the body become more finely tuned to the signals leptin sends to the body.35
Conclusion
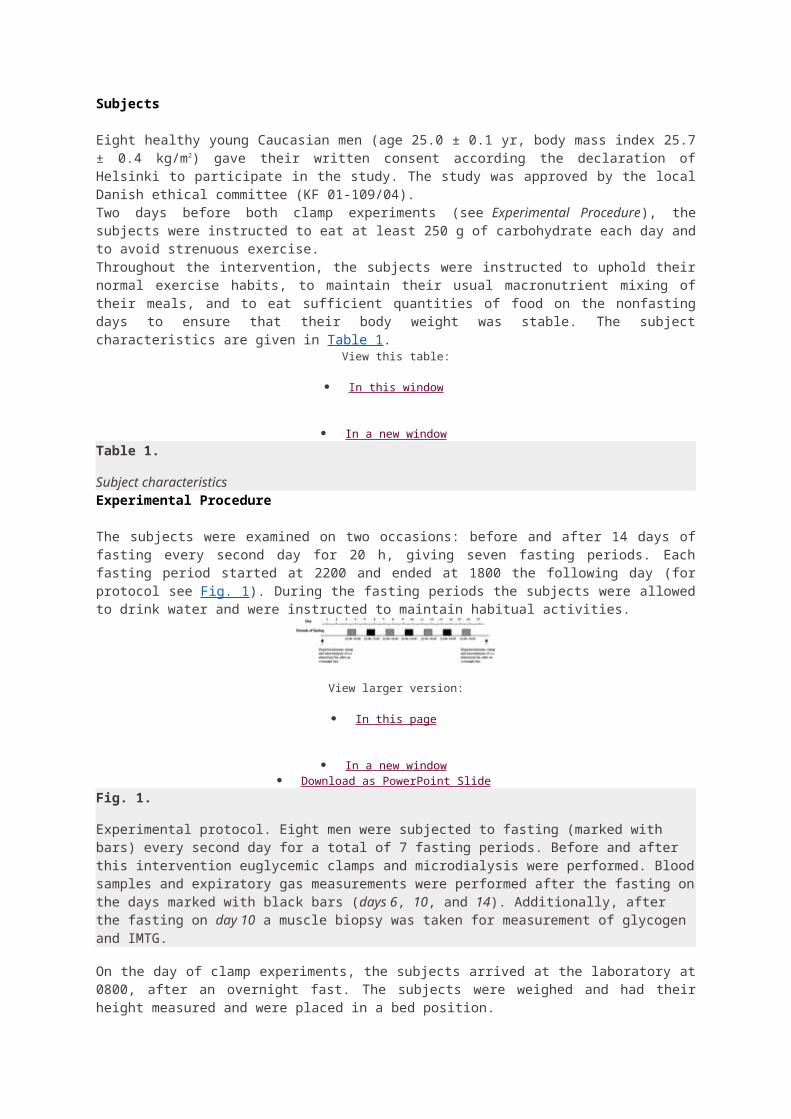
Leptin is emerging as a hormone that is integral to weight management. Studies suggest that the key to successfully and permanently lowering weight may be lowering levels of this hormone. A number of natural substances have been highlighted in this article. Melatonin, Carnitine, CLA, and omega-3 fatty acids all seem to play an important role in controlling leptin by restoring leptin sensitivity.
References1. Fantuzzi G, Sennello JA, Batra A, Fedke I, Lehr HA, Zeitz M, Siegmund B. Defining the role of T cell-derived leptin in the mo ulation of hepatic or intestinal inflammation in mice. Clin Exp Immunol. 2005 Oct;142(1):31-8.2. Mukherjee R, Villarreal D, Reams GP, Freeman RH, Tchoukina I, Spear RM. Leptin as a common link to obesity and hypertension. Timely Top Med Cardiovasc Dis. 2006 Jan 2;10:E1.3. Farr SA, Banks WA, Morley JE. Effects of leptin on memory processing. Peptides. 2005 Nov 14; [Epub ahead of print].4. Anim-Nyame N, Domoney C, Panay N, Jones J, Alaghband-Zadeh J, Studd JW. Plasma leptin concentrations are increased in women with premenstrual syndrome. Hum Reprod. 2000 Nov;15(11):2329-32.5. Leonhardt U, Ritzel U, Schafer G, Becker W, Ramadori G. Serum leptin levels in hypo- and hyperthyroidism. J Endocrinol. 1998 Apr;157(1):75-9.6. Perego L, Pizzocri P, Corradi D, Maisano F, Paganelli M, Fiorina P, Barbieri M, Morabito A, Paolisso G, Folli F, Pontiroli AE. Circulating leptin correlates with left ventricular mass in morbid (grade III) obesity before and after weight loss induced by bariatric surgery: a potential role for leptin in mediating human left ventricular hypertrophy. J Clin Endocrinol Metab. 2005 Jul;90(7):4087-93. Epub 2005 Apr 26. 7. Gomez-Ambrosi J, Salvador J, Paramo JA, Orbe J, de Irala J, Diez-Caballero A, Gil MJ, Cienfuegos JA, Fruhbeck G. Involvement of leptin in the association between percentage of body fat and cardiovascular risk factors. Clin Biochem. 2002 Jun;35(4):315-20.8. Halaas JL, Gajiwala KS, Maffei M, Cohen SL, Chait BT, Rabinowitz D, Lallone RL., Burley SK, Friedman JM. Science. 1995;269:543-546.9. Stehling O, Doring H, Ertl J, Preibisch G, Schmidt I. Am. J. Physiol.. 1996;271: R1770-R1774.10. Levin N, Nelson C, Gurney A, Vandlen R, de Sauvage, F. Proc. Natl. Acad. Sci. U.S.A. 1996;93:1726-1730.11. Kamohara S, Burcelin R, Halaas JL, Friedman JM, Charron MJ. Nature. 1997;389: 374-377.12. Yaspelkis BB, 3rd, Ansari L, Ramey EL, Holland GJ, Loy SF. Metabolism. 1999;48: 671-676.13. Chinookoswong N, Wang JL, Shi ZQ. Diabetes. 1999;48;1487-1492. 14. Radic R, Nikolic V, Karner I, Kosovic P, Kurbel S, Selthofer R, Curkovic M.Circadian rhythm of blood leptin level in obese and non-obese people. Coll Antropol. 2003 Dec;27(2):555-61. 15. Szucs N, Varga I, Jakab C, Patocs A, Glaz E, Toth M, Kiss R, Racz K. Leptin inhibits cortisol and corticosterone secretion in pathologic human adrenocortical cells. Pituitary. 2001 Jan-Apr;4(1-2):71-7. 16. Ainslie DA, Morris MJ, Wittert G, Turnbull H, Proietto J, Thorburn AW. Estrogen deficiency causes central leptin insensitivity and increased hypothalamic neuropeptide Y. Int J Obes Relat Metab Disord. 2001 Nov;25(11):1680-8.17. Ninomiya Y, Shigemura N, Yasumatsu K, Ohta R, Sugimoto K, Nakashima K, Lindemann B. Leptin and sweet taste. Vitam Horm. 2002;64:221-48. 18. Lazzer S, Vermorel M, Montaurier C, Meyer M, Boirie Y. Changes in adipocyte hormones and lipid oxidation associated with weight loss and regain in severely obese adolescents. Int J Obes (Lond). 2005 Oct;29(10):1184-91.19. Ram E, Vishne T, Maayan R, Lerner I, Weizman A, Dreznik Z, Konstantin B, Seror D, Pnina V. The relationship between BMI, plasma leptin, insulin and proinsulin before and after laparoscopic adjustable gastric banding. Obes Surg. 2005 Nov-Dec;15(10):1456-62.20. Masuo K, Katsuya T, Kawaguchi H, Fu Y, Rakugi H, Ogihara T, Tuck ML. Rebound weight gain as associated with high plasma norepinephrine levels that are mediated through polymorphisms in the beta2-adrenoceptor. Am J Hypertens. 2005 Nov;18(11):1508-16.21. Knudson JD, Dincer UD, Zhang C, Swafford AN Jr, Koshida R, Picchi A, Focardi M, Dick GM, Tune JD. Leptin receptors are expressed in coronary arteries, and hyperleptinemia causes significant coronary endothelial dysfunction. Am J Physiol Heart Circ Physiol. 2005 Jul;289(1):H48-56. Epub 2005 Mar 4.22. Luo JD, Zhang GS, Chen MS. Leptin and cardiovascular diseases. Timely Top Med Cardiovasc Dis. 2005 Dec 1;9:E34.23. Mukherjee R, Villarreal D, Reams GP, Freeman RH, Tchoukina I, Spear RM. Leptin as a common link to obesity and hypertension. Timely Top Med Cardiovasc Dis. 2006 Jan 2;10:E1.24. Spiegel K, Leproult R, Van Cauter E. [Impact of sleep debt on physiological rhythms] [Article in French]. Rev Neurol (Paris). 2003 Nov;159(11 Suppl):6S11-20. 25. Haluzik M, Matoulek M, Svacina S, Hilgertova J, Haas T. The influence of short-term fasting on serum leptin levels, and selected hormonal and metabolic parameters in morbidly obese and lean females. Endocr Res. 2001 Feb-May;27(1-2):251-60.26. Alonso-Vale MI, Andreotti S, Peres SB, Anhe GF, das Neves Borges-Silva C, Neto JC, Lima FB. Melatonin enhances leptin expression by rat adipocytes in the presence of insulin. Am J Physiol Endocrinol Metab. 2005 Apr;288(4):E805-12. Epub 2004 Nov 30.27. Canpolat S, Sandal S, Yilmaz B, Yasar A, Kutlu S, Baydas G, Kelestimur H. Effects of pinealectomy and exogenous melatonin on serum leptin levels in male rat. Eur J Pharmacol. 2001 Sep 28;428(1):145-8.28. Wolden-Hanson T, Mitton DR, McCants RL, Yellon SM, Wilkinson CW, Matsumoto AM, Rasmussen DD. Daily melatonin administration to middle-aged male rats suppresses body weight, intraabdominal adiposity, and plasma leptin and insulin independent of food intake and total body fat. Endocrinology. 2000 Feb;141(2):487-97.
29. Puchalski SS, Green JN, Rasmussen DD. Melatonin effect on rat body weight regulation in response to high-fat diet at middle age. Endocrine. 2003 Jul;21(2):163-7.30. McCann SM, Mastronardi C, DE Laurentiis A, Rettori V. The nitric oxide theory of aging revisited. Ann N Y Acad Sci. 2005 Dec;1057:64-84.31. Lofgren IE, Herron KL, West KL, Zern TL, Brownbill RA, Ilich JZ, Koo SI, Fernandez ML. Weight loss favorably modifies anthropometrics and reverses the metabolic syndrome in premenopausal women. J Am Coll Nutr. 2005 Dec;24(6):486-93.32. Belury MA, Mahon A, Banni S. The conjugated linoleic acid (CLA) isomer, t10c12-CLA, is inversely associated with changes in body weight and serum leptin in subjects with type 2 diabetes mellitus. J Nutr. 2003 Jan;133(1):257S-260S. 33. Rahman SM, Wang Y, Yotsumoto H, Cha J, Han S, Inoue S, Yanagita T. Effects of conjugated linoleic acid on serum leptin concentration, body-fat accumulation, and beta-oxidation of fatty acid in OLETF rats. Nutrition. 2001 May;17(5):385-90. 34. Kang K, Pariza MW. trans-10,cis-12-Conjugated linoleic acid reduces leptin secretion from 3T3-L1 adipocytes. Biochem Biophys Res Commun. 2001 Sep 21;287(2):377-82.35. Winnicki M, Somers VK, Accurso V, Phillips BG, Puato M, Palatini P, Pauletto P. Fish-rich diet, leptin, and body mass. Circulation. 2002 Jul 16;106(3):289-91.
SOURCE: http://www.vrp.com/weight-management/leptin-and-weight-loss-the-hormonal-key-to-fat-reduction-and-heart-health
Diet-Induced Leptin Resistance: The Heart of the Matter
1. Matthias H. Tschöp , 2. David Y. Hui and 3. Tamas L. Horvath
-Author Affiliations1. Department of Psychiatry and Obesity Research Center (M.H.T.), and
Department of Pathology and Lipid Research Center (D.Y.H.), University of Cincinnati, Cincinnati, Ohio 45327; and Department of Comparative Medicine (T.H.), Yale Medical School, New Haven, Connecticut 06520
1. Address all correspondence and requests for reprints to: Dr. Matthias H. Tschöp, University of Cincinnati Genome Research Institute, Department of Psychiatry, Obesity Research Center, 2170 East Galbraith Road, Cincinnati, Ohio 45327. E-mail: [email protected] recent decision to ban trans fatty acids (trans fats) in New York City and European countries such as Denmark has made clear how, in our society, high-fat foods have become almost synonymous with a bad influence on health. Although the exact mechanistic links remain to be understood, a high-fat diet is known to cause obesity and to, subsequently (or in parallel), damage glucose homeostasis and cardiovascular systems (1, 2). One of the more accepted molecular concepts thought to explain these processes is the model of leptin resistance: exposure to a high-fat diet impairs the sensitivity and physiological response to the satiety-inducing adipocyte hormone leptin, thereby contributing to a syndrome similar to what can be observed in leptin-deficient rodents or humans (3, 4). Leptin deficiency—and presumably diet-induced leptin resistance—leads to a syndrome with increased food intake, morbid obesity, impaired glucose metabolism, and multiple other comorbidities such as a dysfunctional reproductive systems and imbalanced bone metabolism (5). Because failure of leptin treatment for diet-induced obesity has also been attributed to leptin resistance, numerous efforts are still ongoing to better understand and ultimately prevent or cure leptin resistance (3). Existing models have proposed a number of different mechanisms to explain the high-fat-diet-induced development of leptin resistance, which is thought to be a pleiotropic phenomenon, although it has mainly been examined with regard to leptin’s action in the central nervous system (CNS) (6). The two most popular models explaining diet-induced leptin resistance include decreased transport of leptin across the blood brain barrier (7) and impaired intracellular leptin receptor signaling (6)—possibly a result of constant exposure to increased circulating amounts of either dietary lipids or leptin itself.With the general wisdom being that leptin resistance is a generalized phenomenon as much as a bad thing, recent findings by Somoza et al. (8), published in this issue of Endocrinology, come as a surprise. Somoza et al. report that the development of leptin resistance may be a process that specifically occurs in some tissues but not in others, such as, for example, the heart. If cardiac tissue, as an example, remains sensitive for leptin, heart muscle cells would exhibit signs of markedly enhanced leptin action in response to the increased leptin levels known to occur in diet-induced obesity. To study changes in cardiac metabolism during the development of diet-induced obesity, Somoza et al. started out by exposing mice to a high-fat diet for 2 months and comparing these with control mice on a standard chow. As expected, mice on a high-fat diet became obese and developed high leptin levels. However, such diet-induced obesity appeared to reflect metabolic consequences of the diet composition rather than effects of hyperphagia, because the number of consumed calories did not differ between study groups. Interestingly, fat content of the heart seemed to increase initially only, whereas after 8 wk of high-fat diet exposure there was no difference between treatment groups.Even more intriguing, two signaling pathways associated with increased fat oxidation and known to be activated by leptin were found to be markedly up-regulated in hearts of mice that were exposed to a high-fat diet. Specifically, Somoza et al. (8) found protein levels of uncoupling protein-2 (UCP2) and phosphorylated AMP-activated protein kinase (AMPK) to be up-regulated, but concentrations of lactate dehydrogenase as well as lactate to be decreased, in cardiac tissue. UCPs are classically associated with nonshivering thermogenesis by brown fat. UCP1 is an integral membrane protein that is located in the mitochondrial inner membrane of brown adipocytes. Its physiological role is to mediate a regulated, thermogenic proton leak (9, 10). UCP2 and UCP3 are more recently identified UCP1 homologs that might function to control the production of superoxide and other downstream reactive oxygen species (9, 10, 11). UCP2 can be activated by free radicals and free fatty acids or
thyroid hormone (T3). UCPs regulate mitochondrial biogenesis, free radical production, and local temperature and are therefore able to influence numerous cellular processes. Recent studies have shown that UCP2 has an important part in the pathogenesis of type-2 diabetes (10). Other reports indicate that UCP2 may have important neuroprotective functions and may be a regulator of synaptic plasticity (11). Interestingly, Somoza et al. found UCP2 to be increased in the heart upon high-fat-diet-induced obesity and propose that UCP2 may represent one molecular pathway that seems to be involved in cardiac protection from lipid deposition.The evolutionarily conserved serine/threonine kinase, AMPK, is an energy sensor that regulates cellular metabolism (12, 13). When activated, AMPK stimulates lipid oxidation to produce energy in numerous tissues including muscle. Recent data indicate that AMPK also is a mediator of the effects of adipocyte-derived and gut-derived hormones and peptides on fatty acid oxidation in peripheral tissues. In response to such diverse hormonal signals including leptin, ghrelin, and adiponectin, AMPK serves as a cross-talk signal integrator among peripheral tissues, as well as the CNS, in the control of whole-body energy balance (12, 13).Interestingly, and similar to their findings on UCP2, Somoza et al. (8) found that AMPK phosphorylation was higher in mice chronically exposed to a high-fat diet, possibly contributing to a switch of substrate choice, promoting fat oxidation. Consistent with these findings, lactate dehydrogenase in the heart was decreased in mice after 8 wk on a high-fat diet, and lactate levels were lower in cardiac tissue of these mice. These findings again would suggest a metabolic switch from using carbohydrate to using lipids as fuel.Because these findings would fit very well with increased leptin action in the heart (leptin activates both AMPK and UCP2), the authors hypothesized that, as expected in mice on a high-fat diet, leptin resistance may be induced in some tissues such as the hypothalamus but would not develop in others such as the heart. They tested that hypothesis by injecting leptin in mice after chronic exposure to either a high-fat or standard diet. The results confirmed, as shown by quantification of intracellular leptin-specific signal phosphorylated signal transducer and activator of transcription (6) that CNS neurons, but not heart muscle cells, had developed substantial resistance to leptin.In summary, although it induces leptin resistance in other organs such as the CNS, exposure to a high-fat diet seems to activate leptin target pathways in heart muscle cells with unharmed, if not increased, potency. Somoza et al. (8) were able to show that, consistent with an important functional relevance of such increased leptin signaling, mice on a high-fat diet showed up-regulated fat oxidation pathways, and no signs of lipid deposition in the heart were detected over a 2-month study period (8) (Fig. 1⇓).Although these novel observations reported by Somoza et al. (8) offer a number of potentially important new perspectives for obesity and cardiovascular research, they also raise several new questions. One obvious question would be whether the observed phenomenon is specific for heart tissue or whether other important organs and tissues may be similarly exempt from diet-induced leptin resistance and other pathological processes associated with diet-induced obesity. The provocative findings presented by Somoza et al. further emphasizes that future studies are needed to carefully dissect the tissue specificity and time course of leptin resistance and metabolic pathophysiology associated with the development of high-fat-diet-induced obesity. Particularly relevant in that regard would be skeletal muscle and liver, where little is known about the general importance and time-resolved involvement in the development of the leptin resistance syndrome.One difficulty with the interpretation of the provocative, but largely descriptive, dataset presented by Somoza et al. (8) is the lack of a clear causal link between 1) increased leptin levels, 2) maintained or even increased activity of pathways promoting fat oxidation in the heart, and 3) cardiac protection from lipid deposition. Although a functional relationship seems entirely possible, data, for example, from leptin-deficient mouse models and the use of tissue-specific mouse mutagenesis for cardiac UCP2 and AMPK would be necessary to prove the hypotheses proposed by the authors. Furthermore, it is known that circulating levels of multiple other signaling factors are changed during development of high-fat-diet-induced obesity (e.g. insulin, resistin, adiponectin, ghrelin, IL-6, and others) (14). Several of these circulating endocrine signals are not only known to play a role in the control of energy metabolism but also in the regulation of UCPs and AMPK (12, 13).Moreover, although it is an intriguing observation that triglyceride content of cardiac tissue was found to be normal after exposure to a high-fat diet, it would be interesting to investigate changes of parameters reflecting heart function such as heart muscle shortening or ejection fractions. If monitored at several time points during development of diet-induced obesity and in connection with changing levels of enhanced or blocked leptin, UCP2, and AMPK signaling, important insight could be gained regarding the role of leptin pathways as potential drug targets for the prevention and treatment of cardiovascular disease. Finally, if the intriguing speculations proposed by Somoza et al. are
correct, lipid deposition and toxicity should be no issue for cardiac tissue in diet-induced obesity. Although this may be an area in which important data sets are still missing to allow for clear answers, morbidly obese patients certainly do not seem to be protected in any way against cardiovascular complications by their hyperleptinemia. Perhaps, at least for the initial phase of exposure to a high-fat diet, maintained leptin sensitivity and increased leptin action in cardiac tissue does boost fat oxidation, thereby protecting the heart as an organ of most vital importance. It does seem intriguing to speculate whether such a phenomenon would be pure coincidence or a physiological defense mechanism triggered by CNS nutrient sensors that detect increased levels of circulating fatty acids and in turn stimulate leptin expression and secretion, ultimately to protect peripheral organs from ectopic lipid deposition. Although such a model is not novel and had been proposed before, Somoza et al. (8) provide evidence indicating that such a mechanism may, at least to some extent and for an initial time period, actually be successful.Although the observations of Somoza et al. involving UCP2 in cardiac protection from diet-induced obesity and its potential link with leptin action are new, a previous series of groundbreaking findings from Unger and colleagues (15, 16, 17) has paved the way for the studies presented here. Several studies from that group examined lipid-induced cardiac dysfunction and the ability of hyperleptinemia to prevent it. Additional aspects resulting form their work include an involvement of hypothalamic appetite centers and down-regulation of lipogenesis in peripheral tissues to minimize ectopic lipid deposition. Interestingly, findings similar to what is discussed here regarding leptin’s effects on cardiac lipid deposition have been reported for lipid toxicity in lung tissue, which occurs in leptin-deficient ob/ob mice and can be corrected by leptin replacement therapy.Despite several open questions, the studies reported by Somoza et al., together with earlier studies by Unger and colleagues, provide a unique connection between the energy balance regulation and the cardiovascular consequences of a high-fat diet and obesity. The data suggest that the pathophysiological mechanisms leading to leptin resistance must rely on tissue-specific mechanisms such as impaired blood brain barrier transport. Otherwise, the lack of leptin resistance in cardiac tissue would be difficult to explain.It would certainly be premature to conclude that hyperleptinemia may be a functionally relevant and physiologically necessary defense with beneficial rather than damaging impact in an organism during exposure to a high-fat diet. However, the evidence provided by Somoza et al. (8) highlights the necessity to further study the time-resolved and tissue-specific development of high-fat-diet-induced changes in cellular metabolism. These data also point to the equal importance of better understanding the role of multiorgan crosstalk in the pathogenesis of diet-induced obesity to pave the way for a pharmacological prevention and treatment for obesity and resulting consequences for metabolism and the cardiovascular system. Finally, although lipotoxic cardiomyopathy may not be a familiar entity to all clinicians at this point in time, the potential benefits of dietary intervention as well as AMPK agonists that are currently under development may offer valuable strategies for intervention in the future.
View larger version:
In this page
In a new window Download as PowerPoint Slide
FIG. 1.
Chronic exposure to a high-fat diet induces leptin resistance in the CNS but appears to activate leptin target pathways in heart muscle cells with unharmed, if not increased, potency. Somoza et al. (8 ) show that, consistent with an important functional relevance of such increased leptin signaling, mice on a high-fat diet showed up-regulated fat oxidation pathways and no signs of lipid deposition in the heart. Specifically, the authors
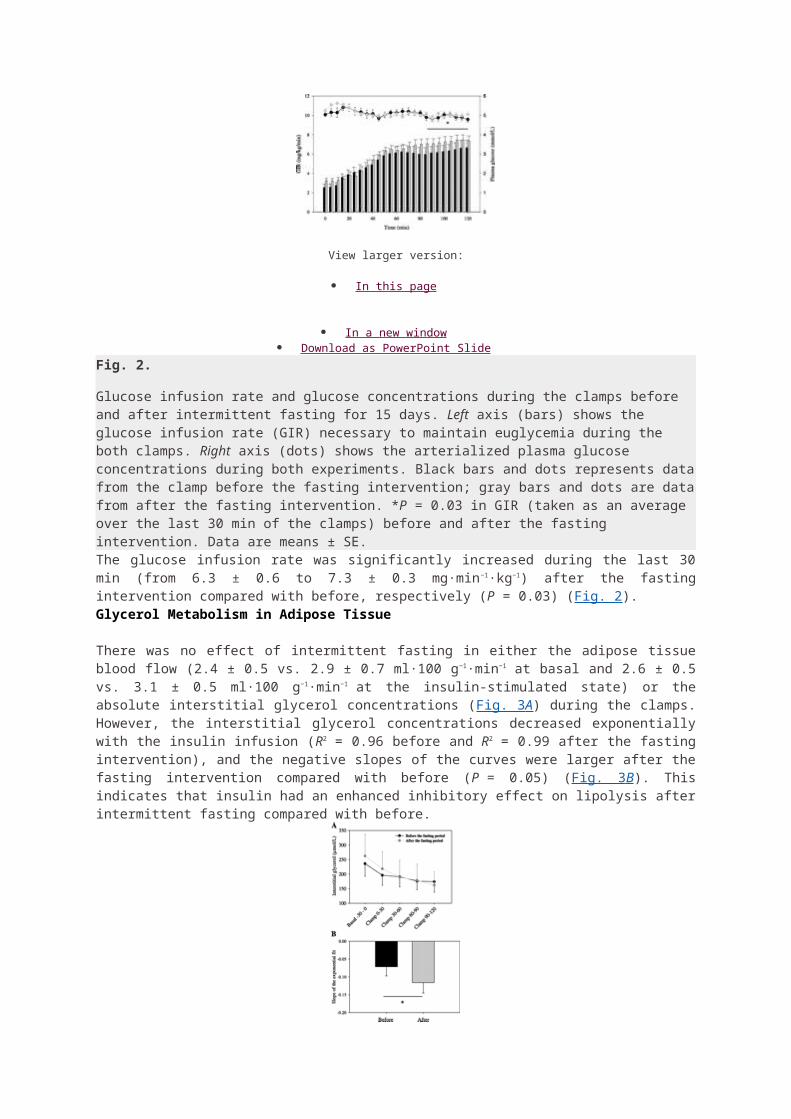
report that cardiac levels of UCP2 and phosphorylated AMPK increase upon chronic exposure to a high-fat diet. These effects may be a consequence of increased circulating leptin levels, which, due to tissue-specifically maintained leptin sensitivity in cardiac muscle cells, protect the heart from lipid deposition.
Next Section
Footnotes
Abbreviations: AMPK, AMP-activated protein kinase; CNS, central nervous system; UCP, uncoupling protein.
Received December 18, 2006. Accepted January 11, 2007.
Previous Section
References
1. ↵ Kuller LH 2006 Nutrition, lipids, and cardiovascular disease. Nutr Rev 64:S15–S26
2. ↵ Hensrud DD, Klein S 2006 Extreme obesity: a new medical crisis in the United States. Mayo Clin Proc 81(Suppl):S5–S10
3. ↵ Ahima RS 2006 Adipose tissue as an endocrine organ. Obesity (Silver Spring) 14(Suppl 5):242S–249S
4. ↵ Farooqi IS, O’Rahilly S 2006 Genetics of obesity in humans. Endocr Rev 27:710–718
Abstract / FREE Full Text
5. ↵ Friedman JM 2002 The function of leptin in nutrition, weight, and physiology. Nutr Rev 60:S1–S14
6. ↵ Munzberg H, Myers Jr MG 2005 Molecular and anatomical determinants of central leptin resistance. Nat Neurosci 8:566–570
CrossRef Medline
7. ↵ Banks WA 2006 Blood-brain barrier and energy balance. Obesity (Silver Spring) 14(Suppl 5):234S–237S
8. ↵ Somoza B, Guzmán R, Cano V, Merino B, Ramos P, Diez-Fernández C, Fernández-Alfonso MS, Ruiz-Gayo M 2007 Induction of cardiac uncoupling protein-2 expression and adenosine 5′-monophosphate-activated protein kinase phosphorylation during early states of diet-induced obesity in mice. Endocrinology 148:924–931
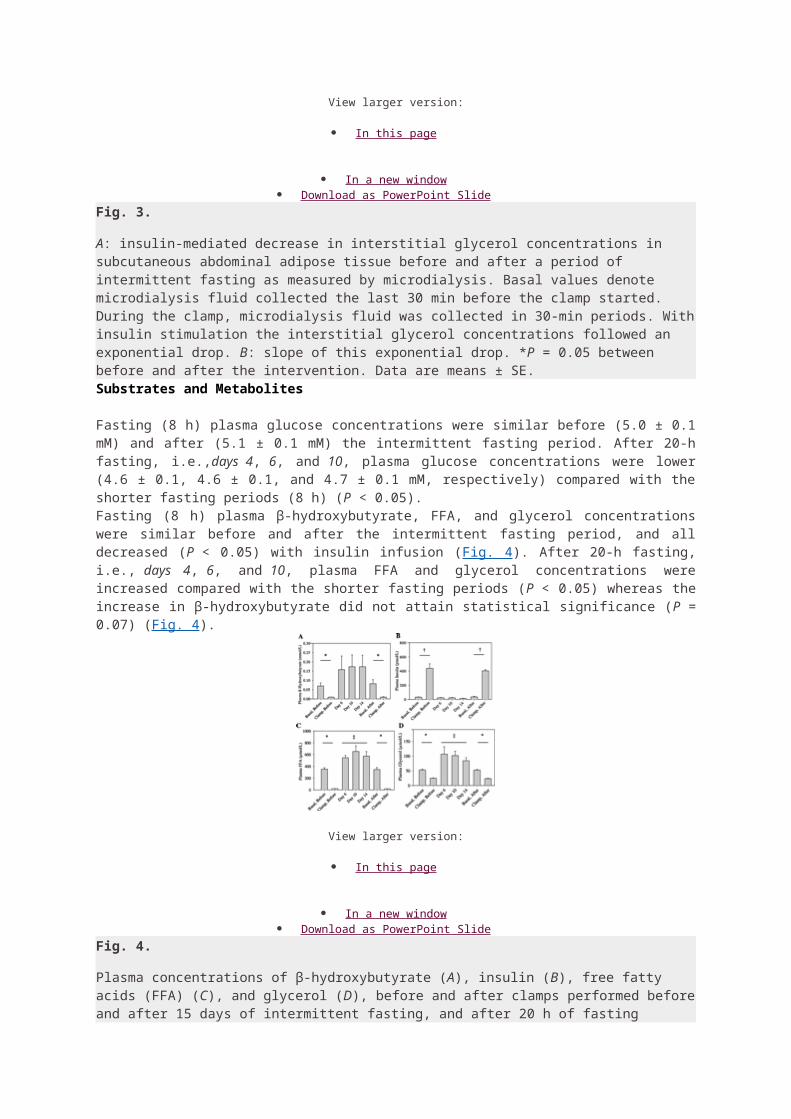
Abstract / FREE Full Text
9. ↵ Ricquier D 2005 Respiration uncoupling and metabolism in the control of energy expenditure. Proc Nutr Soc 64:47–52
CrossRef Medline
10. ↵ Krauss S, Zhang CY, Lowell BB 2005 The mitochondrial uncoupling-protein homologues. Nat Rev Mol Cell Biol 6:248–261
Medline
11. ↵ Andrews ZB, Diano S, Horvath TL 2005 Mitochondrial uncoupling proteins in the CNS: in support of function and survival. Nat Rev Neurosci 6:829–840
CrossRef Medline
12. ↵ Xue B, Kahn BB 2006 AMPK integrates nutrient and hormonal signals to regulate food intake and energy balance through effects in the hypothalamus and peripheral tissues. J Physiol 574:73–83
Abstract / FREE Full Text
13. ↵ Long YC, Zierath JR 2006 AMP-activated protein kinase signaling in metabolic regulation. J Clin Invest 116:1776–1783
CrossRef Medline
14. ↵ Tataranni PA, Ortega E 2005 Does an adipokine-induced activation of the immune system mediate the effect of overnutrition on type 2 diabetes? Diabetes 54:917–926
Abstract / FREE Full Text
15. ↵ Unger RH 2005 Hyperleptinemia: protecting the heart from lipid overload. Hypertension45:1031–1034
Abstract / FREE Full Text
16. ↵
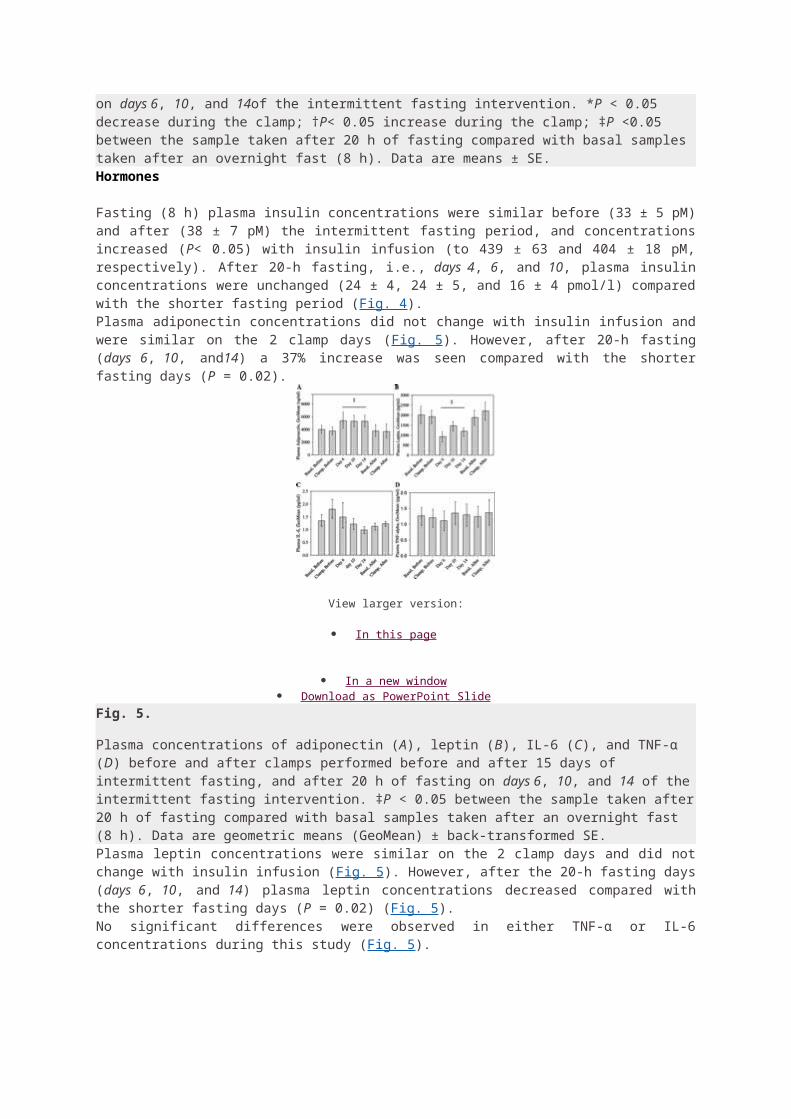
Lee Y, Naseem RH, Duplomb L, Park BH, Garry DJ, Richardson JA, Schaffer JE, Unger RH 2004 Hyperleptinemia prevents lipotoxic cardiomyopathy in acyl CoA synthase transgenic mice. Proc Natl Acad Sci USA 101:13624–13629
Abstract / FREE Full Text
17. ↵ Unger RH 2003 Minireview: weapons of lean body mass destruction: the role of ectopic lipids in the metabolic syndrome. Endocrinology 144:5159–5165
Abstract / FREE Full Text
SOURCE: http://endo.endojournals.org/content/148/3/921.full