The Labor Market Report - TN.gov
12
1 Black History Month The Tennessee Department of Labor and Workforce Development Data Phil Bredesen, Governor James G. Neeley, Commissioner The Labor Market Report Special Points of Interest: • A look at the history and labor market infor- mation of Black History Month • Tennessee Historical Civilian Labor Force Series, 1979 to Present • County Unemployment Rates • Civilian Labor Force Summary • State Unemployment Insurance Activities Inside This Issue: Black History Month is a remembrance of important people and events in the history of the African dias- pora. It is celebrated annually in the United States and Canada in February. It was founded in 1926 by historian Carter G. Woodson as “Negro History Week” during the second week in February to coincide with the birthdays of abolition- ist/editor Frederick Douglass and Presi- dent Abraham Lin- coln. Woodson was disturbed to find that history books from that period largely ig- nored the black American population and their American experience. He took on the challenge of writing black Ameri- cans into the nation’s history and to that end also founded the Association for the Study of African- American Life and History. This observance was still called “Negro His- tory Week” into the 1970s when it was re- named “Black History Week.” In 1976, it was changed to its current “Black History Month.” Canada officially recog- nized “Black History Month” in 1995. African-Americans make up 13.5 percent of the U.S. population. Including those of more than one race, the popu- lation estimate, as of July 1, 2008, is 41.1 million persons. This represents an increase of more than a half- million from the prior year. The projected population for July 2050 is 65.7 million (up to 15 percent of the to- tal population). There are 18 states in 2008 with an estimated black population of at least 1 million. They are Alabama, Califor- nia, Florida, Georgia, Illinois, Louisiana, Maryland, Michigan, Mississippi, New Jer- sey, New York, North Carolina, Ohio, Penn- sylvania, South Caro- lina, Tennessee, Texas and Virginia. The only southern states not in this group are Arkan- sas and Kentucky. The African-American popu- lation was the largest minority in all the above states except for California, Florida, New Jersey, and Texas. Other states where Af- rican-Americans were the largest minority included Arkansas, Delaware, the District of Columbia, Indiana, Kentucky, Maine, Min- nesota, Missouri, Wis- consin, and West Vir- ginia. The states with the largest percent of Afri- can-American popula- tion are Mississippi (38 percent), Louisiana (32 percent), Georgia (31 percent), Maryland (30 percent), South Caro- lina (29 percent), and Alabama (27 percent). (Continued on Page 2) Chattanooga MSA 7 Knoxville MSA 8 Memphis MSA 9 Nashville MSA 10 Smaller MSAs 11 Consumer Price Index 12 November 2009 Data The Labor Market Report Demographics
Transcript of The Labor Market Report - TN.gov

1
Black History Month
The Tennessee Department of Labor and Workforce Development
December 2002 Data
Phil Bredesen, Governor
James G. Neeley,
Commissioner
The Labor Market Report
Special Points of Interest: • A look at the history
and labor market infor-mation of Black History Month
• Tennessee Historical
Civilian Labor Force Series, 1979 to Present
• County Unemployment Rates
• Civilian Labor Force
Summary • State Unemployment
Insurance Activities Inside This Issue:
Black History Month is a remembrance of important people and events in the history of the African dias-pora. It is celebrated annually in the United States and Canada in February. It was founded in 1926 by historian Carter G. Woodson as “Negro History Week” during the second week in February to coincide with the birthdays of abolition-ist/editor Frederick Douglass and Presi-dent Abraham Lin-coln. Woodson was disturbed to find that history books from that period largely ig-nored the black American population and their American experience. He took on the challenge of writing black Ameri-cans into the nation’s history and to that end also founded the Association for the Study of African-American Life and History.
This observance was still called “Negro His-tory Week” into the 1970s when it was re-named “Black History Week.” In 1976, it was changed to its current “Black History Month.” Canada officially recog-nized “Black History Month” in 1995.
African-Americans make up 13.5 percent of the U.S. population. Including those of more than one race, the popu-lation estimate, as of July 1, 2008, is 41.1 million persons. This represents an increase of more than a half-million from the prior year. The projected population for July 2050 is 65.7 million (up to 15 percent of the to-tal population). There are 18 states in 2008 with an estimated black population of at least 1 million. They are Alabama, Califor-nia, Florida, Georgia, Illinois, Louisiana, Maryland, Michigan,
Mississippi, New Jer-sey, New York, North Carolina, Ohio, Penn-sylvania, South Caro-lina, Tennessee, Texas and Virginia. The only southern states not in this group are Arkan-sas and Kentucky. The African-American popu-lation was the largest minority in all the above states except for California, Florida, New Jersey, and Texas. Other states where Af-rican-Americans were the largest minority included Arkansas, Delaware, the District of Columbia, Indiana, Kentucky, Maine, Min-nesota, Missouri, Wis-consin, and West Vir-ginia. The states with the largest percent of Afri-can-American popula-tion are Mississippi (38 percent), Louisiana (32 percent), Georgia (31 percent), Maryland (30 percent), South Caro-lina (29 percent), and Alabama (27 percent). (Continued on Page 2)
Chattanooga MSA 7
Knoxville MSA 8
Memphis MSA 9
Nashville MSA 10
Smaller MSAs 11
Consumer Price Index 12
November 2009 Data
The Labor Market Report
Demographics
2
Black History Month in America
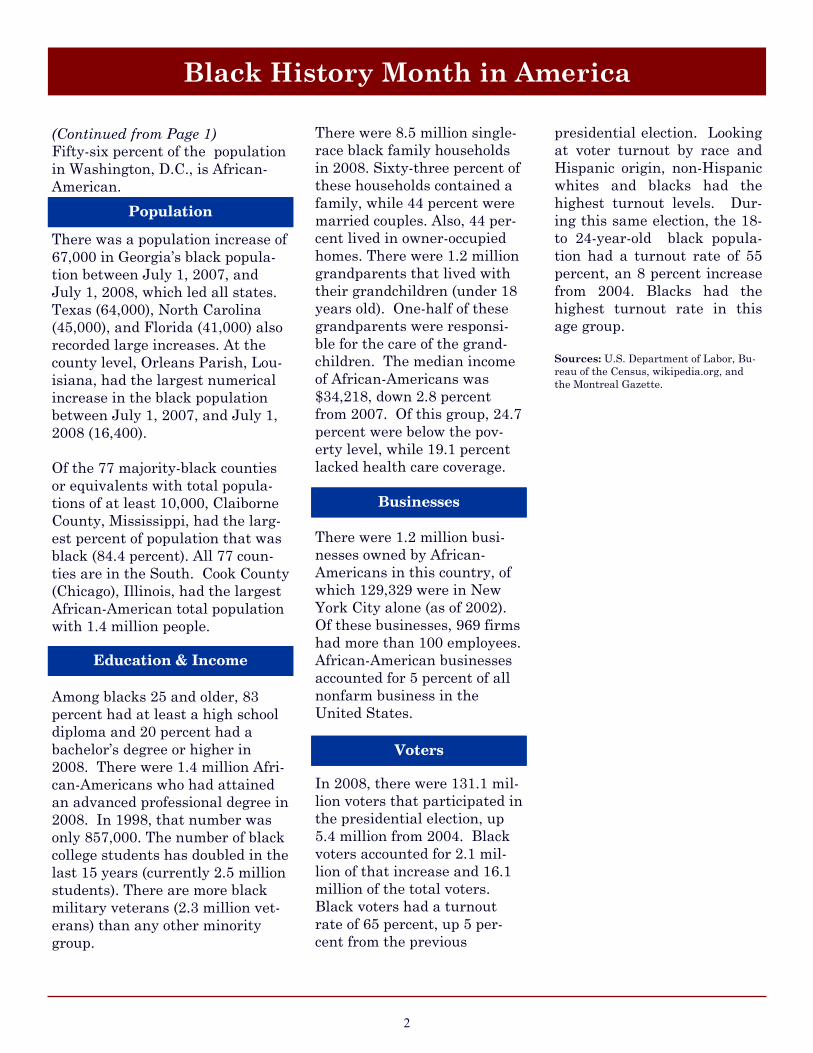
(Continued from Page 1) Fifty-six percent of the population in Washington, D.C., is African-American.
There was a population increase of 67,000 in Georgia’s black popula-tion between July 1, 2007, and July 1, 2008, which led all states. Texas (64,000), North Carolina (45,000), and Florida (41,000) also recorded large increases. At the county level, Orleans Parish, Lou-isiana, had the largest numerical increase in the black population between July 1, 2007, and July 1, 2008 (16,400). Of the 77 majority-black counties or equivalents with total popula-tions of at least 10,000, Claiborne County, Mississippi, had the larg-est percent of population that was black (84.4 percent). All 77 coun-ties are in the South. Cook County (Chicago), Illinois, had the largest African-American total population with 1.4 million people.
Among blacks 25 and older, 83 percent had at least a high school diploma and 20 percent had a bachelor’s degree or higher in 2008. There were 1.4 million Afri-can-Americans who had attained an advanced professional degree in 2008. In 1998, that number was only 857,000. The number of black college students has doubled in the last 15 years (currently 2.5 million students). There are more black military veterans (2.3 million vet-erans) than any other minority group.
There were 8.5 million single-race black family households in 2008. Sixty-three percent of these households contained a family, while 44 percent were married couples. Also, 44 per-cent lived in owner-occupied homes. There were 1.2 million grandparents that lived with their grandchildren (under 18 years old). One-half of these grandparents were responsi-ble for the care of the grand-children. The median income of African-Americans was $34,218, down 2.8 percent from 2007. Of this group, 24.7 percent were below the pov-erty level, while 19.1 percent lacked health care coverage.
There were 1.2 million busi-nesses owned by African-Americans in this country, of which 129,329 were in New York City alone (as of 2002). Of these businesses, 969 firms had more than 100 employees. African-American businesses accounted for 5 percent of all nonfarm business in the United States.
In 2008, there were 131.1 mil-lion voters that participated in the presidential election, up 5.4 million from 2004. Black voters accounted for 2.1 mil-lion of that increase and 16.1 million of the total voters. Black voters had a turnout rate of 65 percent, up 5 per-cent from the previous
presidential election. Looking at voter turnout by race and Hispanic origin, non-Hispanic whites and blacks had the highest turnout levels. Dur-ing this same election, the 18- to 24-year-old black popula-tion had a turnout rate of 55 percent, an 8 percent increase from 2004. Blacks had the highest turnout rate in this age group. Sources: U.S. Department of Labor, Bu-reau of the Census, wikipedia.org, and the Montreal Gazette.
Education & Income
Businesses
Population
Voters
3
Statewide
(NUMBERS IN THOUSANDS) MONTHLY DATA NOT SEASONALLY ADJUSTED
Civilian Labor ForceEmployed Unemployed
Year Nonfarm Employmentand Employ- **Manu- Rate
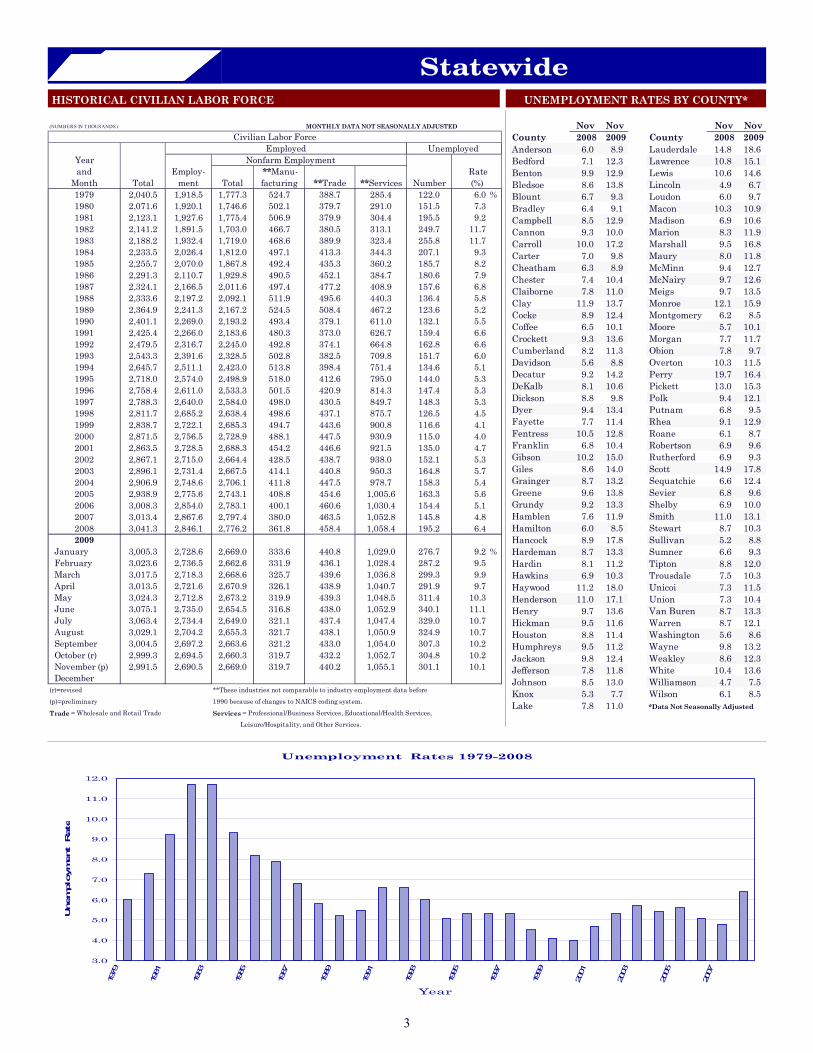
Month Total ment Total facturing **Trade **Services Number (%)1979 2,040.5 1,918.5 1,777.3 524.7 388.7 285.4 122.0 6.0 %1980 2,071.6 1,920.1 1,746.6 502.1 379.7 291.0 151.5 7.31981 2,123.1 1,927.6 1,775.4 506.9 379.9 304.4 195.5 9.21982 2,141.2 1,891.5 1,703.0 466.7 380.5 313.1 249.7 11.71983 2,188.2 1,932.4 1,719.0 468.6 389.9 323.4 255.8 11.71984 2,233.5 2,026.4 1,812.0 497.1 413.3 344.3 207.1 9.31985 2,255.7 2,070.0 1,867.8 492.4 435.3 360.2 185.7 8.21986 2,291.3 2,110.7 1,929.8 490.5 452.1 384.7 180.6 7.91987 2,324.1 2,166.5 2,011.6 497.4 477.2 408.9 157.6 6.81988 2,333.6 2,197.2 2,092.1 511.9 495.6 440.3 136.4 5.81989 2,364.9 2,241.3 2,167.2 524.5 508.4 467.2 123.6 5.21990 2,401.1 2,269.0 2,193.2 493.4 379.1 611.0 132.1 5.51991 2,425.4 2,266.0 2,183.6 480.3 373.0 626.7 159.4 6.61992 2,479.5 2,316.7 2,245.0 492.8 374.1 664.8 162.8 6.61993 2,543.3 2,391.6 2,328.5 502.8 382.5 709.8 151.7 6.0 1994 2,645.7 2,511.1 2,423.0 513.8 398.4 751.4 134.6 5.11995 2,718.0 2,574.0 2,498.9 518.0 412.6 795.0 144.0 5.31996 2,758.4 2,611.0 2,533.3 501.5 420.9 814.3 147.4 5.31997 2,788.3 2,640.0 2,584.0 498.0 430.5 849.7 148.3 5.31998 2,811.7 2,685.2 2,638.4 498.6 437.1 875.7 126.5 4.51999 2,838.7 2,722.1 2,685.3 494.7 443.6 900.8 116.6 4.12000 2,871.5 2,756.5 2,728.9 488.1 447.5 930.9 115.0 4.02001 2,863.5 2,728.5 2,688.3 454.2 446.6 921.5 135.0 4.72002 2,867.1 2,715.0 2,664.4 428.5 438.7 938.0 152.1 5.32003 2,896.1 2,731.4 2,667.5 414.1 440.8 950.3 164.8 5.72004 2,906.9 2,748.6 2,706.1 411.8 447.5 978.7 158.3 5.42005 2,938.9 2,775.6 2,743.1 408.8 454.6 1,005.6 163.3 5.62006 3,008.3 2,854.0 2,783.1 400.1 460.6 1,030.4 154.4 5.12007 3,013.4 2,867.6 2,797.4 380.0 463.5 1,052.8 145.8 4.82008 3,041.3 2,846.1 2,776.2 361.8 458.4 1,058.4 195.2 6.42009
January 3,005.3 2,728.6 2,669.0 333.6 440.8 1,029.0 276.7 9.2 % February 3,023.6 2,736.5 2,662.6 331.9 436.1 1,028.4 287.2 9.5 March 3,017.5 2,718.3 2,668.6 325.7 439.6 1,036.8 299.3 9.9 April 3,013.5 2,721.6 2,670.9 326.1 438.9 1,040.7 291.9 9.7 May 3,024.3 2,712.8 2,673.2 319.9 439.3 1,048.5 311.4 10.3 June 3,075.1 2,735.0 2,654.5 316.8 438.0 1,052.9 340.1 11.1 July 3,063.4 2,734.4 2,649.0 321.1 437.4 1,047.4 329.0 10.7 August 3,029.1 2,704.2 2,655.3 321.7 438.1 1,050.9 324.9 10.7 September 3,004.5 2,697.2 2,663.6 321.2 433.0 1,054.0 307.3 10.2 October (r) 2,999.3 2,694.5 2,660.3 319.7 432.2 1,052.7 304.8 10.2 November (p) 2,991.5 2,690.5 2,669.0 319.7 440.2 1,055.1 301.1 10.1 December (r)=revised **These industries not comparable to industry employment data before (p)=preliminary 1990 because of changes to NAICS coding system.
Trade = Wholesale and Retail Trade Services = Professional/Business Services, Educational/Health Services, Leisure/Hospitality, and Other Services.
Nov Nov Nov Nov County 2008 2009 County 2008 2009Anderson 6.0 8.9 Lauderdale 14.8 18.6Bedford 7.1 12.3 Lawrence 10.8 15.1Benton 9.9 12.9 Lewis 10.6 14.6Bledsoe 8.6 13.8 Lincoln 4.9 6.7Blount 6.7 9.3 Loudon 6.0 9.7Bradley 6.4 9.1 Macon 10.3 10.9Campbell 8.5 12.9 Madison 6.9 10.6Cannon 9.3 10.0 Marion 8.3 11.9Carroll 10.0 17.2 Marshall 9.5 16.8Carter 7.0 9.8 Maury 8.0 11.8Cheatham 6.3 8.9 McMinn 9.4 12.7Chester 7.4 10.4 McNairy 9.7 12.6Claiborne 7.8 11.0 Meigs 9.7 13.5Clay 11.9 13.7 Monroe 12.1 15.9Cocke 8.9 12.4 Montgomery 6.2 8.5Coffee 6.5 10.1 Moore 5.7 10.1Crockett 9.3 13.6 Morgan 7.7 11.7Cumberland 8.2 11.3 Obion 7.8 9.7Davidson 5.6 8.8 Overton 10.3 11.5Decatur 9.2 14.2 Perry 19.7 16.4DeKalb 8.1 10.6 Pickett 13.0 15.3Dickson 8.8 9.8 Polk 9.4 12.1Dyer 9.4 13.4 Putnam 6.8 9.5Fayette 7.7 11.4 Rhea 9.1 12.9Fentress 10.5 12.8 Roane 6.1 8.7Franklin 6.8 10.4 Robertson 6.9 9.6Gibson 10.2 15.0 Rutherford 6.9 9.3Giles 8.6 14.0 Scott 14.9 17.8Grainger 8.7 13.2 Sequatchie 6.6 12.4Greene 9.6 13.8 Sevier 6.8 9.6Grundy 9.2 13.3 Shelby 6.9 10.0Hamblen 7.6 11.9 Smith 11.0 13.1Hamilton 6.0 8.5 Stewart 8.7 10.3Hancock 8.9 17.8 Sullivan 5.2 8.8Hardeman 8.7 13.3 Sumner 6.6 9.3Hardin 8.1 11.2 Tipton 8.8 12.0Hawkins 6.9 10.3 Trousdale 7.5 10.3Haywood 11.2 18.0 Unicoi 7.3 11.5Henderson 11.0 17.1 Union 7.3 10.4Henry 9.7 13.6 Van Buren 8.7 13.3Hickman 9.5 11.6 Warren 8.7 12.1Houston 8.8 11.4 Washington 5.6 8.6Humphreys 9.5 11.2 Wayne 9.8 13.2Jackson 9.8 12.4 Weakley 8.6 12.3Jefferson 7.8 11.8 White 10.4 13.6Johnson 8.5 13.0 Williamson 4.7 7.5Knox 5.3 7.7 Wilson 6.1 8.5Lake 7.8 11.0 *Data Not Seasonally Adjusted
HISTORICAL CIVILIAN LABOR FORCE UNEMPLOYMENT RATES BY COUNTY*
Unemployment Rates 1979-2008
3.0
4.0
5.0
6.0
7.0
8.0
9.0
10.0
11.0
12.0
1979
1981
1983
1985
1987
1989
1991
1993
1995
1997
1999
2001
2003
2005
2007
Year
U n e m
p l o y m e n t R a t e
4
Statewide
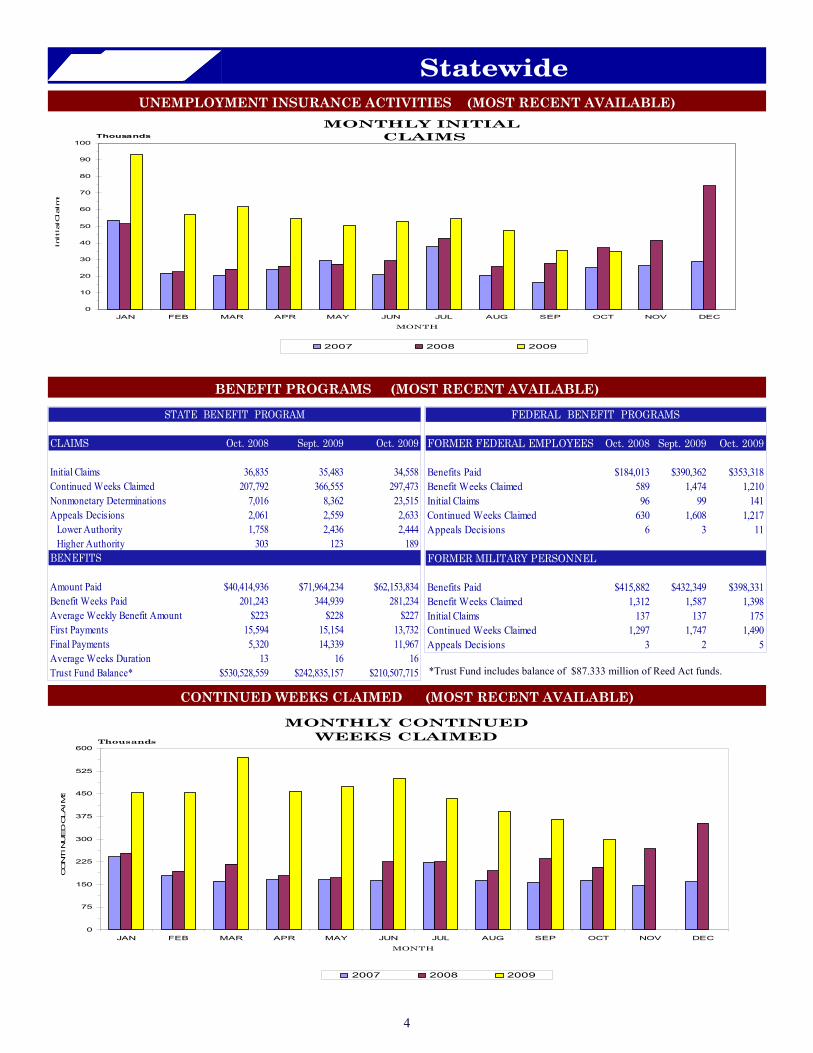
UNEMPLOYMENT INSURANCE ACTIVITIES (MOST RECENT AVAILABLE)
STATE BENEFIT PROGRAM
CLAIMS Oct. 2008 Sept. 2009 Oct. 2009
Initial Claims 36,835 35,483 34,558Continued Weeks Claimed 207,792 366,555 297,473Nonmonetary Determinations 7,016 8,362 23,515Appeals Decisions 2,061 2,559 2,633 Lower Authority 1,758 2,436 2,444 Higher Authority 303 123 189BENEFITS
Amount Paid $40,414,936 $71,964,234 $62,153,834Benefit Weeks Paid 201,243 344,939 281,234Average Weekly Benefit Amount $223 $228 $227First Payments 15,594 15,154 13,732Final Payments 5,320 14,339 11,967Average Weeks Duration 13 16 16Trust Fund Balance* $530,528,559 $242,835,157 $210,507,715
FEDERAL BENEFIT PROGRAMS
FORMER FEDERAL EMPLOYEES Oct. 2008 Sept. 2009 Oct. 2009
Benefits Paid $184,013 $390,362 $353,318Benefit Weeks Claimed 589 1,474 1,210Initial Claims 96 99 141Continued Weeks Claimed 630 1,608 1,217Appeals Decisions 6 3 11
FORMER MILITARY PERSONNEL
Benefits Paid $415,882 $432,349 $398,331Benefit Weeks Claimed 1,312 1,587 1,398Initial Claims 137 137 175Continued Weeks Claimed 1,297 1,747 1,490Appeals Decisions 3 2 5
BENEFIT PROGRAMS (MOST RECENT AVAILABLE)
CONTINUED WEEKS CLAIMED (MOST RECENT AVAILABLE)
*Trust Fund includes balance of $87.333 million of Reed Act funds.
MONTHLY CONTINUED WEEKS CLAIMED
0
75
150
225
300
375
450
525
600
JAN FEB MAR APR MAY JUN JUL AUG SEP OCT NOV DEC
Thousands
MONTH
C O
N T I N U
E D
C L A
I M S
2007 2008 2009
MONTHLY INITIAL CLAIMS
0
10
20
30
40
50
60
70
80
90
100
JAN FEB MAR APR MAY JUN JUL AUG SEP OCT NOV DEC
Thousands
MONTH
I n I t I a l C l a I m
s
2007 2008 2009

5
Statewide
Industry November OctoberRevised
2008 2009
PreliminaryNov. Oct.
Net ChangeNovember
2009 Nov. 20082009
20092009Nov.
NONFARM EMPLOYMENT AND LABOR FORCE IN TENNESSEE
ESTIMATED NONFARM EMPLOYMENT (in thousands)
Total Nonfarm 2,767.5 2,660.3 2,669.0 -98.5 8.7 Total Private 2,331.3 2,224.0 2,233.3 -98.0 9.3 Goods Producing 479.5 423.2 421.5 -58.0 -1.7 Mining & Construction 130.4 103.2 102.2 -28.2 -1.0 Manufacturing 349.1 320.0 319.3 -29.8 -0.7 Durable Goods Manufacturing 212.2 191.6 189.8 -22.4 -1.8 Wood Product Manufacturing 13.6 11.9 11.6 -2.0 -0.3 Nonmetallic Mineral Product Manufacturing 14.3 12.7 12.5 -1.8 -0.2 Primary Metal Manufacturing 10.7 9.9 9.9 -0.8 0.0 Fabricated Metal Product Manufacturing 38.3 35.6 35.0 -3.3 -0.6 Machinery Manufacturing 29.7 28.3 28.2 -1.5 -0.1 Computer & Electronic Product Manufacturing 7.1 6.5 6.4 -0.7 -0.1 Electrical Equipment & Appliance Manufacturing 20.1 18.4 18.3 -1.8 -0.1 Transportation Equipment Manufacturing 50.4 43.0 42.8 -7.6 -0.2 Furniture & Related Product Manufacturing 13.7 11.8 11.7 -2.0 -0.1 Miscellaneous Manufacturing 14.3 13.5 13.4 -0.9 -0.1 Nondurable Goods Manufacturing 136.9 128.4 129.5 -7.4 1.1 Textile Mills, Products, & Apparel 14.5 12.8 12.7 -1.8 -0.1 Food Manufacturing 31.7 30.0 30.2 -1.5 0.2 Beverage & Tobacco Product Manufacturing 4.8 4.5 4.4 -0.4 -0.1 Paper Manufacturing 16.7 16.0 15.8 -0.9 -0.2 Printing & Related Support Activities 15.4 13.7 13.6 -1.8 -0.1 Chemical Manufacturing 26.9 25.8 25.7 -1.2 -0.1 Plastics & Rubber Products Manufacturing 24.7 22.0 22.5 -2.2 0.5 Plastics Product Manufacturing 12.7 11.5 11.6 -1.1 0.1 Rubber Product Manufacturing 12.0 10.5 10.9 -1.1 0.4 Service Providing 2,288.0 2,237.1 2,247.5 -40.5 10.4 Trade, Transportation, & Utilities 596.4 565.5 573.1 -23.3 7.6 Wholesale Trade 130.1 124.4 125.1 -5.0 0.7 Merchant Wholesalers, Durable Goods 66.9 63.2 63.5 -3.4 0.3 Merchant Wholesalers, Nondurable Goods 45.8 44.1 43.9 -1.9 -0.2 Wholesale Electronic Markets 17.4 17.1 17.7 0.3 0.6 Retail Trade 325.3 307.8 315.1 -10.2 7.3 Motor Vehicle & Parts Dealers 40.8 38.8 38.5 -2.3 -0.3 Furniture & Home Furnishings Stores 9.3 9.0 9.2 -0.1 0.2 Building Material, Garden Equipment, & Supplies 25.9 25.7 25.7 -0.2 0.0 Food & Beverage Stores 48.0 47.2 47.7 -0.3 0.5 Health & Personal Care Stores 24.4 24.4 24.7 0.3 0.3 Gasoline Stations 23.3 22.7 22.8 -0.5 0.1 Clothing & Clothing Accessories Stores 31.1 27.7 29.6 -1.5 1.9 Sporting Goods, Hobby, Book, & Music Stores 12.7 11.7 12.4 -0.3 0.7 General Merchandise Stores 73.4 68.4 71.1 -2.3 2.7 Miscellaneous Store Retailers 16.5 15.5 15.5 -1.0 0.0 Nonstore Retailers 10.0 9.2 9.4 -0.6 0.2 Transportation, Warehousing, & Utilities 141.0 133.3 132.9 -8.1 -0.4 Utilities 3.4 3.4 3.4 0.0 0.0 Transportation & Warehousing 137.6 129.9 129.5 -8.1 -0.4 Truck Transportation 59.0 53.6 52.9 -6.1 -0.7 Information 49.1 45.9 46.2 -2.9 0.3 Publishing Industries (except internet) 12.9 12.4 12.5 -0.4 0.1 Telecommunications 18.4 18.5 18.7 0.3 0.2 Financial Activities 144.9 136.7 137.4 -7.5 0.7 Finance & Insurance 109.2 103.4 103.9 -5.3 0.5 Real Estate, Rental, & Leasing 35.7 33.3 33.5 -2.2 0.2 Professional & Business Services 321.9 312.7 314.5 -7.4 1.8 Professional, Scientific, & Technical Services 109.5 107.2 108.7 -0.8 1.5 Management of Companies & Enterprises 24.3 24.5 24.6 0.3 0.1 Administrative, Support, & Waste Management 188.1 181.0 181.2 -6.9 0.2 Educational & Health Services 365.0 370.6 371.9 6.9 1.3 Educational Services 42.3 41.7 41.7 -0.6 0.0 Health Care & Social Assistance 322.7 328.9 330.2 7.5 1.3 Ambulatory Health Care Services 120.8 124.8 125.3 4.5 0.5 Hospitals 105.8 109.3 109.3 3.5 0.0 Nursing & Residential Care Facilities 54.8 54.9 55.7 0.9 0.8 Social Assistance 41.3 39.9 39.9 -1.4 0.0 Leisure & Hospitality 273.3 269.3 268.3 -5.0 -1.0 Arts, Entertainment, & Recreation 29.3 30.0 28.7 -0.6 -1.3 Accommodation & Food Services 244.0 239.3 239.6 -4.4 0.3 Accommodation 32.8 28.8 29.1 -3.7 0.3 Food Services & Drinking Places 211.2 210.5 210.5 -0.7 0.0 Other Services 101.2 100.1 100.4 -0.8 0.3 Repair & Maintenance 21.1 20.8 21.0 -0.1 0.2 Personal & Laundry Services 24.7 23.3 23.1 -1.6 -0.2 Government 436.2 436.3 435.7 -0.5 -0.6 Federal Government 49.5 51.6 51.0 1.5 -0.6 State Government 99.5 96.9 96.9 -2.6 0.0 State Government Educational Services 48.9 49.1 49.2 0.3 0.1 Local Government 287.2 287.8 287.8 0.6 0.0 Local Government Educational Services 147.8 148.2 148.9 1.1 0.7
The data from all the nonfarm employment estimates tables in-clude all full- and part-time nonfarm wage and salary employees who worked during or received pay for any part of the pay period that includes the 12th of the month. This is a count of jobs by place of work. Agricultural workers, proprietors, self-employed persons, workers in private households, and unpaid family workers are excluded. These numbers may not add due to rounding. Data is based on the 2008 benchmark.
Total nonfarm employment decreased by 98,500 jobs from November 2008 to November 2009. During this period, there were large seasonal decreases in mining/construction (down 28,200 jobs); retail trade (down 10,200 jobs), which includes declines of 2,300 in both motor vehicle/ parts dealers and general merchandise stores; transportation/warehousing (down 8,100 jobs), which includes a drop of 6,100 jobs in truck transportation; transportation equipment manufacturing (down 7,600 jobs); financial activities (down 7,500 jobs), which includes a decrease of 5,300 jobs in finance/insurance and 2,200 less jobs in real estate/rental/leasing; professional/business services (down 7,400 jobs), which includes a decline of 6,900 jobs in administrative/support/waste management; wholesale trade (down 5,000 jobs), which includes declines of 3,400 jobs in durable goods wholesalers and 1,900 jobs in nondurable goods wholesalers; and accommodation/food services (down 4,400 jobs), which includes a drop of 3,700 jobs in accommodation. This was partially offset by increases in health care/social assistance (up 7,500 jobs), which includes increases of4,500 jobs in ambulatory health care services and 3,500 jobs in hospitals, combined with a 1,400 job decline in social assistance; federal government (up 1,500 jobs); and 1,100 more jobs in local government educational services. During November, nonfarm employment increased by 8,700 jobs. The largest seasonal increases were in retail trade (up 7,300 jobs), which includes increases of 2,700 in general merchandise stores and 1,900 jobs in clothing/ clothing accessories stores; professional/business services (up 1,800 jobs), which includes an increase of 1,500 jobs in professional/scientific/ technical services; and health care/social assistance (up 1,300 jobs). This was partially offset by decreases in arts/entertainment/ recreation (down 1,300 jobs), and mining/ construction (down 1,000 jobs). Tennessee's seasonally adjusted estimated unemployment rate for November 2009 was 10.3 percent, down 0.2 percent from the October rate. This is the 28th consecutive month that the current rate is greater than or equal to the national average. The United States’ unemployment rate was 10.0 percent in November 2009. In November 2008, the national unemployment rate was 6.8 percent, and the state’s unemployment rate was 7.2 percent. Across Tennessee, the unemployment rate decreased in 50 counties, increased in 36 counties, and remained the same in nine counties. There were 23 counties with an unemployment rate less than 10 percent but no counties had unemployment rates greater than 20 percent. Thelowest rate occurred in Lincoln County at 6.7 percent, down 0.2 percent from the previous month. The highest rate was Lauderdale County’s 18.6 percent, down from 18.8 percent in October 2009.
6
CIVILIAN LABOR FORCE
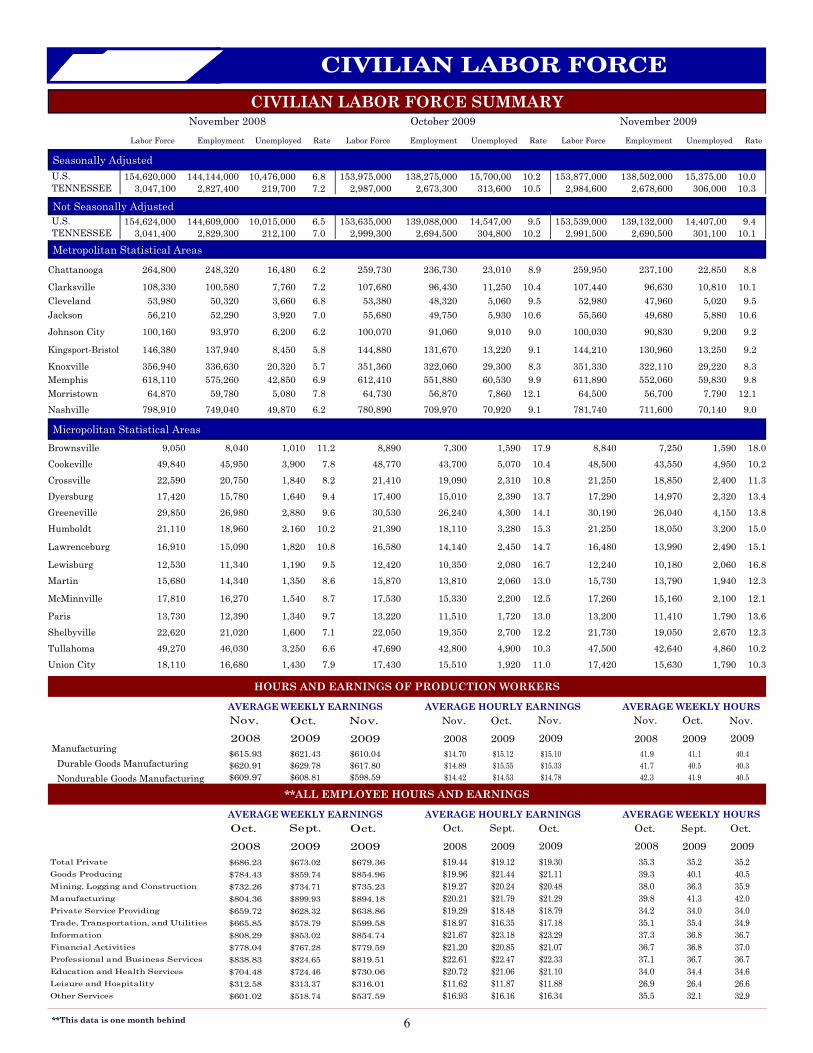
CIVILIAN LABOR FORCE SUMMARY
Not Seasonally Adjusted
Metropolitan Statistical Areas
Micropolitan Statistical Areas
Seasonally Adjusted U.S. TENNESSEE
U.S. TENNESSEE
November 2008 October 2009 November 2009 Labor Force Employment Unemployed Rate Labor Force Employment Unemployed Rate
154,620,000 144,144,000 10,476,000 6.8 153,975,000 138,275,000 15,700,00 10.2 153,877,000 138,502,000 15,375,00 10.0 3,047,100 2,827,400 219,700 7.2 2,987,000 2,673,300 313,600 10.5 2,984,600 2,678,600 306,000 10.3
154,624,000 144,609,000 10,015,000 6.5 153,635,000 139,088,000 14,547,00 9.5 153,539,000 139,132,000 14,407,00 9.4 3,041,400 2,829,300 212,100 7.0 2,999,300 2,694,500 304,800 10.2 2,991,500 2,690,500 301,100 10.1
Chattanooga 264,800 248,320 16,480 6.2 259,730 236,730 23,010 8.9 259,950 237,100 22,850 8.8
Clarksville 108,330 100,580 7,760 7.2 107,680 96,430 11,250 10.4 107,440 96,630 10,810 10.1 Cleveland 53,980 50,320 3,660 6.8 53,380 48,320 5,060 9.5 52,980 47,960 5,020 9.5 Jackson 56,210 52,290 3,920 7.0 55,680 49,750 5,930 10.6 55,560 49,680 5,880 10.6 Johnson City 100,160 93,970 6,200 6.2 100,070 91,060 9,010 9.0 100,030 90,830 9,200 9.2
Kingsport-Bristol 146,380 137,940 8,450 5.8 144,880 131,670 13,220 9.1 144,210 130,960 13,250 9.2 Knoxville 356,940 336,630 20,320 5.7 351,360 322,060 29,300 8.3 351,330 322,110 29,220 8.3 Memphis 618,110 575,260 42,850 6.9 612,410 551,880 60,530 9.9 611,890 552,060 59,830 9.8 Morristown 64,870 59,780 5,080 7.8 64,730 56,870 7,860 12.1 64,500 56,700 7,790 12.1 Nashville 798,910 749,040 49,870 6.2 780,890 709,970 70,920 9.1 781,740 711,600 70,140 9.0
Brownsville 9,050 8,040 1,010 11.2 8,890 7,300 1,590 17.9 8,840 7,250 1,590 18.0 Cookeville 49,840 45,950 3,900 7.8 48,770 43,700 5,070 10.4 48,500 43,550 4,950 10.2 Crossville 22,590 20,750 1,840 8.2 21,410 19,090 2,310 10.8 21,250 18,850 2,400 11.3 Dyersburg 17,420 15,780 1,640 9.4 17,400 15,010 2,390 13.7 17,290 14,970 2,320 13.4 Greeneville 29,850 26,980 2,880 9.6 30,530 26,240 4,300 14.1 30,190 26,040 4,150 13.8 Humboldt 21,110 18,960 2,160 10.2 21,390 18,110 3,280 15.3 21,250 18,050 3,200 15.0
Lawrenceburg 16,910 15,090 1,820 10.8 16,580 14,140 2,450 14.7 16,480 13,990 2,490 15.1
Lewisburg 12,530 11,340 1,190 9.5 12,420 10,350 2,080 16.7 12,240 10,180 2,060 16.8 Martin 15,680 14,340 1,350 8.6 15,870 13,810 2,060 13.0 15,730 13,790 1,940 12.3
McMinnville 17,810 16,270 1,540 8.7 17,530 15,330 2,200 12.5 17,260 15,160 2,100 12.1
Paris 13,730 12,390 1,340 9.7 13,220 11,510 1,720 13.0 13,200 11,410 1,790 13.6 Shelbyville 22,620 21,020 1,600 7.1 22,050 19,350 2,700 12.2 21,730 19,050 2,670 12.3 Tullahoma 49,270 46,030 3,250 6.6 47,690 42,800 4,900 10.3 47,500 42,640 4,860 10.2 Union City 18,110 16,680 1,430 7.9 17,430 15,510 1,920 11.0 17,420 15,630 1,790 10.3
Labor Force Employment Unemployed Rate
**ALL EMPLOYEE HOURS AND EARNINGS
HOURS AND EARNINGS OF PRODUCTION WORKERS
AVERAGE WEEKLY EARNINGS AVERAGE HOURLY EARNINGS AVERAGE WEEKLY HOURS
Manufacturing Durable Goods Manufacturing Nondurable Goods Manufacturing
AVERAGE WEEKLY EARNINGS AVERAGE HOURLY EARNINGS AVERAGE WEEKLY HOURS
Total PrivateGoods ProducingMining, Logging and ConstructionManufacturingPrivate Service ProvidingTrade, Transportation, and UtilitiesInformationFinancial ActivitiesProfessional and Business ServicesEducation and Health ServicesLeisure and HospitalityOther Services
$686.23$784.43$732.26$804.36$659.72$665.85$808.29$778.04$838.83$704.48$312.58$601.02
$673.02$859.74$734.71$899.93$628.32$578.79$853.02$767.28$824.65$724.46$313.37$518.74
$679.36$854.96$735.23$894.18$638.86$599.58$854.74$779.59$819.51$730.06$316.01$537.59
$19.44$19.96$19.27$20.21$19.29$18.97$21.67$21.20$22.61$20.72$11.62$16.93
$19.12$21.44$20.24$21.79$18.48$16.35$23.18$20.85$22.47$21.06$11.87$16.16
$19.30$21.11$20.48$21.29$18.79$17.18$23.29$21.07$22.33$21.10$11.88$16.34
35.339.338.039.834.235.137.336.737.134.026.935.5
35.240.136.341.334.035.436.836.836.734.426.432.1
35.240.535.942.034.034.936.737.036.734.626.632.9
**This data is one month behind
Oct. Oct. Oct.
Nov. Nov. Nov. Nov. Nov. Nov.
2009 2009 2009200820082008
2008 2008 20082009 20092009
200920092009Oct. Oct. Oct.
Sept.Sept.Sept.Oct. Oct. Oct. 2009 2009 2009
$615.93$620.91$609.97
$621.43$629.78$608.81
$610.04$617.80$598.59
$14.70$14.89$14.42
$15.12$15.55$14.53
$15.10$15.33$14.78
41.941.742.3
41.140.541.9
40.440.340.5

7
— TN-Hamilton, Marion, Sequatchie. GA-Catoosa, Dade, Walker
C H A T T A N O O G A M S AU N E M P L O Y M E N T R A T E S
(NOT SEASONALLY ADJUSTED)
3.0
4.0
5.0
6.0
7.0
8.0
9.0
10.0
JAN FEB MAR APR MAY JUN JUL AUG SEP OCT NOV DECMONTH
RA
TE
2007 2008 2009
Chattanooga MSA
Total nonfarm employment increased by 800 jobs from October 2009 to November 2009. There were seasonal increases in professional/ business services (up 400 jobs); retail trade (up 300 jobs), which included an increase of 200 jobs in general merchandise stores; local government (up 300 jobs); and mining/ construction (up 200 jobs). This was partially offset by declines in leisure/hospitality and durable goods manufacturing (both down 200 jobs). During the past 12 months, nonfarm jobs decreased by 7,700. During that time, goods-producing dropped by 3,400 jobs, while service-providing declined by 4,300.
Revised Preliminary Net Change Industry November October November Nov. 2008 Oct. 2009
2008 2009 2009 Nov. 2009 Nov. 2009
CIVILIAN LABOR FORCE SUMMARY
ESTIMATED NONFARM EMPLOYMENT (in thousands)
November 2008
Labor Force Employment Unemployed Rate Labor Force Employment Unemployed Rate Labor Force Employment Unemployed Rate
October 2009 November 2009
Athens Micro
Chattanooga City
24,120 21,850 2,270 9.480,950 76,090 4,860 6.0
23,650 20,640 3,010 12.780,060 72,490 7,570 9.5
23,560 20,570 3,000 12.779,860 72,480 7,380 9.2
Total Nonfarm 246.5 238.0 238.8 -7.7 0.8 Total Private 210.6 202.4 202.9 -7.7 0.5 Goods Producing 42.7 39.3 39.3 -3.4 0.0 Mining & Construction 10.3 8.6 8.8 -1.5 0.2 Manufacturing 32.4 30.7 30.5 -1.9 -0.2 Durable Goods Manufacturing 15.1 13.8 13.6 -1.5 -0.2 Nondurable Goods Manufacturing 17.3 16.9 16.9 -0.4 0.0 Service Providing 203.8 198.7 199.5 -4.3 0.8 Trade, Transportation, & Utilities 54.8 51.6 51.9 -2.9 0.3 Wholesale Trade 8.8 8.4 8.5 -0.3 0.1 Retail Trade 26.6 24.7 25.0 -1.6 0.3 General Merchandise Stores 6.5 6.2 6.4 -0.1 0.2 Transportation, Warehousing, & Utilities 19.4 18.5 18.4 -1.0 -0.1 Information 3.8 3.6 3.6 -0.2 0.0 Financial Activities 18.5 18.3 18.3 -0.2 0.0 Professional & Business Services 25.9 25.0 25.4 -0.5 0.4 Educational & Health Services 31.1 31.0 30.9 -0.2 -0.1 Leisure & Hospitality 23.1 23.1 22.9 -0.2 -0.2 Accommodation & Food Services 20.3 20.8 20.7 0.4 -0.1 Other Services 10.7 10.5 10.6 -0.1 0.1 Government 35.9 35.6 35.9 0.0 0.3 Federal Government 6.1 5.6 5.6 -0.5 0.0 State Government 6.4 6.6 6.6 0.2 0.0 Local Government 23.4 23.4 23.7 0.3 0.3
8
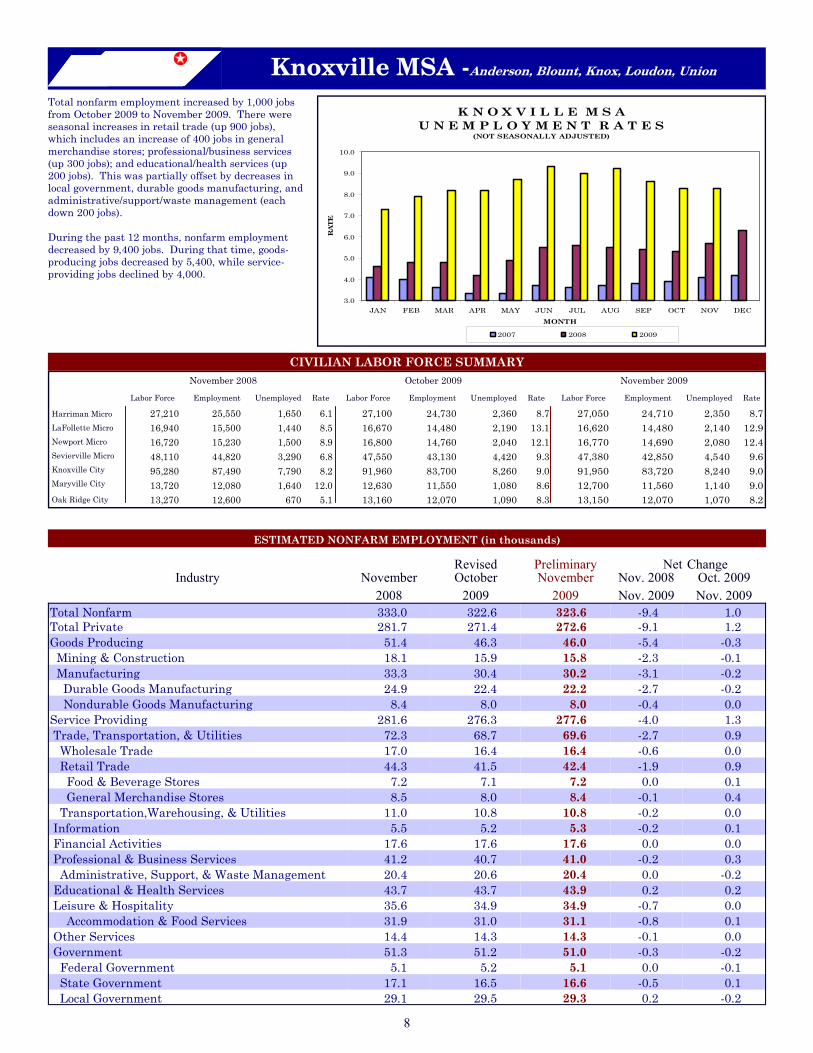
Knoxville MSA -Anderson, Blount, Knox, Loudon, Union
ESTIMATED NONFARM EMPLOYMENT (in thousands)
K N O X V I L L E M S A U N E M P L O Y M E N T R A T E S
(NOT SEASONALLY ADJUSTED)
3.0
4.0
5.0
6.0
7.0
8.0
9.0
10.0
JAN FEB MAR APR MAY JUN JUL AUG SEP OCT NOV DECMONTH
RA
TE
2007 2008 2009
Total nonfarm employment increased by 1,000 jobs from October 2009 to November 2009. There were seasonal increases in retail trade (up 900 jobs), which includes an increase of 400 jobs in general merchandise stores; professional/business services (up 300 jobs); and educational/health services (up 200 jobs). This was partially offset by decreases in local government, durable goods manufacturing, and administrative/support/waste management (each down 200 jobs). During the past 12 months, nonfarm employment decreased by 9,400 jobs. During that time, goods-producing jobs decreased by 5,400, while service-providing jobs declined by 4,000.
Revised Preliminary Net Change Industry November October November Nov. 2008 Oct. 2009
2008 2009 2009 Nov. 2009 Nov. 2009 Total Nonfarm 333.0 322.6 323.6 -9.4 1.0 Total Private 281.7 271.4 272.6 -9.1 1.2 Goods Producing 51.4 46.3 46.0 -5.4 -0.3 Mining & Construction 18.1 15.9 15.8 -2.3 -0.1 Manufacturing 33.3 30.4 30.2 -3.1 -0.2 Durable Goods Manufacturing 24.9 22.4 22.2 -2.7 -0.2 Nondurable Goods Manufacturing 8.4 8.0 8.0 -0.4 0.0 Service Providing 281.6 276.3 277.6 -4.0 1.3 Trade, Transportation, & Utilities 72.3 68.7 69.6 -2.7 0.9 Wholesale Trade 17.0 16.4 16.4 -0.6 0.0 Retail Trade 44.3 41.5 42.4 -1.9 0.9 Food & Beverage Stores 7.2 7.1 7.2 0.0 0.1 General Merchandise Stores 8.5 8.0 8.4 -0.1 0.4 Transportation,Warehousing, & Utilities 11.0 10.8 10.8 -0.2 0.0 Information 5.5 5.2 5.3 -0.2 0.1 Financial Activities 17.6 17.6 17.6 0.0 0.0 Professional & Business Services 41.2 40.7 41.0 -0.2 0.3 Administrative, Support, & Waste Management 20.4 20.6 20.4 0.0 -0.2 Educational & Health Services 43.7 43.7 43.9 0.2 0.2 Leisure & Hospitality 35.6 34.9 34.9 -0.7 0.0 Accommodation & Food Services 31.9 31.0 31.1 -0.8 0.1 Other Services 14.4 14.3 14.3 -0.1 0.0 Government 51.3 51.2 51.0 -0.3 -0.2 Federal Government 5.1 5.2 5.1 0.0 -0.1 State Government 17.1 16.5 16.6 -0.5 0.1 Local Government 29.1 29.5 29.3 0.2 -0.2
CIVILIAN LABOR FORCE SUMMARY November 2008
Labor Force Employment Unemployed Rate
October 2009
Labor Force Employment Unemployed Rate
November 2009
Labor Force Employment Unemployed Rate
Harriman Micro LaFollette Micro Newport Micro Sevierville Micro Knoxville City Maryville City
Oak Ridge City
27,210 25,550 1,650 6.116,940 15,500 1,440 8.516,720 15,230 1,500 8.948,110 44,820 3,290 6.895,280 87,490 7,790 8.213,720 12,080 1,640 12.013,270 12,600 670 5.1
27,100 24,730 2,360 8.716,670 14,480 2,190 13.116,800 14,760 2,040 12.147,550 43,130 4,420 9.391,960 83,700 8,260 9.012,630 11,550 1,080 8.613,160 12,070 1,090 8.3
27,050 24,710 2,350 8.716,620 14,480 2,140 12.916,770 14,690 2,080 12.447,380 42,850 4,540 9.691,950 83,720 8,240 9.012,700 11,560 1,140 9.013,150 12,070 1,070 8.2

9
Memphis MSA - TN - Fayette, Shelby, Tipton. AR - Crittenden. MS - DeSoto, Marshall, Tate, Tunica
ESTIMATED NONFARM EMPLOYMENT (in thousands)
M E M P H I S M S A U N E M P L O Y M E N T R A T E S
(NOT SEASONALLY ADJUSTED)
3.0
4.0
5.0
6.0
7.0
8.0
9.0
10.0
11.0
JAN FEB MAR APR MAY JUN JUL AUG SEP OCT NOV DECMONTH
RA
TE
2007 2008 2009
Total nonfarm employment increased by 1,300 jobs from October 2009 to November 2009. There were seasonal increases in retail trade (up 1,800 jobs), which includes an increase of 800 jobs in general merchandise stores; and transportation/warehousing/utilities, administrative/support/waste management, and educational/health services (all up 300 jobs). This was partially offset by declines in nondurable goods manufacturing (down 300 jobs); and mining/construction, wholesale trade, accom-modation/food services, local government, and state government (all up 200 jobs). During the past 12 months, nonfarm employment decreased by 13,500 jobs. During that time, goods- producing jobs decreased by 4,700, while service-providing jobs declined by 8,800.
Revised Preliminary Net Change
Industry November October November Nov. 2008 Oct. 2009
2008 2009 2009 Nov. 2009 Nov. 2009 Total Nonfarm 634.4 619.6 620.9 -13.5 1.3 Total Private 543.5 528.4 530.2 -13.3 1.8 Goods Producing 74.7 70.5 70.0 -4.7 -0.5 Mining & Construction 25.0 23.3 23.1 -1.9 -0.2 Manufacturing 49.7 47.2 46.9 -2.8 -0.3 Durable Goods Manufacturing 24.7 23.1 22.8 -1.9 -0.3 Nondurable Goods Manufacturing 25.0 24.1 24.1 -0.9 0.0 Service Providing 559.7 549.1 550.9 -8.8 1.8 Trade, Transportation, & Utilities 171.6 164.4 166.3 -5.3 1.9 Wholesale Trade 36.2 34.3 34.1 -2.1 -0.2 Retail Trade 70.6 67.4 69.2 -1.4 1.8 Food & Beverage Stores 9.9 9.8 9.9 0.0 0.1 General Merchandise Stores 14.3 13.6 14.4 0.1 0.8 Transportation,Warehousing, & Utilities 64.8 62.7 63.0 -1.8 0.3 Information 7.2 6.7 6.7 -0.5 0.0 Financial Activities 32.9 32.5 32.4 -0.5 -0.1 Professional & Business Services 83.3 78.8 79.1 -4.2 0.3 Professional, Scientific, & Technical Services 18.8 18.3 18.3 -0.5 0.0 Management of Companies & Enterprises 5.3 5.1 5.1 -0.2 0.0 Administrative, Support, & Waste Management 59.2 55.4 55.7 -3.5 0.3 Educational & Health Services 80.4 81.3 81.6 1.2 0.3 Health Care & Social Assistance 69.4 70.3 70.4 1.0 0.1 Leisure & Hospitality 68.8 68.8 68.6 -0.2 -0.2 Accommodation & Food Services 61.1 59.9 59.7 -1.4 -0.2 Other Services 24.6 25.4 25.5 0.9 0.1 Government 90.9 91.2 90.7 -0.2 -0.5 Federal Government 15.2 15.9 15.8 0.6 -0.1 State Government 15.6 15.0 14.8 -0.8 -0.2 Local Government 60.1 60.3 60.1 0.0 -0.2
CIVILIAN LABOR FORCE SUMMARY November 2008
Labor Force Employment Unemployed Rate
November 2009
Labor Force Employment Unemployed Rate
October 2009
Labor Force Employment Unemployed Rate
Bartlett City Collierville City
GermantownCity
Memphis City
26,280 24,950 1,330 5.120,380 19,380 990 4.919,740 18,890 860 4.4
313,890 289,620 24,270 7.7
26,120 24,030 2,090 8.020,100 18,660 1,440 7.219,470 18,180 1,290 6.6
313,020 278,830 34,190 10.9
26,120 24,010 2,110 8.120,030 18,650 1,380 6.919,470 18,170 1,300 6.7
312,240 278,660 33,580 10.8

10
Nashville MSA — Cannon, Cheatham, Davidson, Dickson, Hickman, Macon, Robertson, Rutherford, Smith, Sumner, Trousdale, Williamson, Wilson
N A S H V I L L E M S A U N E M P L O Y M E N T R A T E S
(NOT SEASONALLY ADJUSTED)
3.0
4.0
5.0
6.0
7.0
8.0
9.0
10.0
11.0
JAN FEB MAR APR MAY JUN JUL AUG SEP OCT NOV DECMONTH
RATE
2007 2008 2009
ESTIMATED NONFARM EMPLOYMENT (in thousands)
Total nonfarm employment increased by 3,700 jobs from October 2009 to November 2009. There were seasonal increases in retail trade (up 2,600 jobs), which includes an increase of 700 jobs in general merchandise stores; profes-sional/business services (up 900 jobs), which includes in-creases of 500 jobs in administrative/support/waste man-agement and 400 jobs in professional/scientific/technical services; accommodation/food services (up 600 jobs), which includes an increase of 400 jobs in food services/drinking places; educational/health services (up 400 jobs); and non-durable goods manufacturing and wholesale trade (both up 200 jobs). This was partially offset by losses in arts/entertainment/recreation (down 400 jobs), mining/construction (down 300 jobs), and durable goods manufacturing, other services, and federal government (each down 200 jobs).
. Revised Preliminary Net Change Industry November October November Nov. 2008 Oct. 2009
2008 2009 2009 Nov. 2009 Nov. 2009
Total Nonfarm 757.8 728.0 731.7 -26.1 3.7 Total Private 653.1 623.1 627.0 -26.1 3.9 Goods Producing 109.5 97.1 96.8 -12.7 -0.3 Mining & Construction 38.4 33.7 33.4 -5.0 -0.3 Manufacturing 71.1 63.4 63.4 -7.7 0.0 Durable Goods Manufacturing 47.1 41.0 40.8 -6.3 -0.2 Nondurable Goods Manufacturing 24.0 22.4 22.6 -1.4 0.2 Service Providing 648.3 630.9 634.9 -13.4 4.0 Trade, Transportation, & Utilities 154.6 147.6 150.4 -4.2 2.8 Wholesale Trade 36.9 36.4 36.6 -0.3 0.2 Retail Trade 88.1 83.0 85.6 -2.5 2.6 Food & Beverage Stores 12.9 12.9 13.0 0.1 0.1 General Merchandise Stores 18.2 17.3 18.0 -0.2 0.7 Transportation,Warehousing, & Utilities 29.6 28.2 28.2 -1.4 0.0 Information 21.3 20.2 20.3 -1.0 0.1 Financial Activities 45.9 45.1 45.1 -0.8 0.0 Finance & Insurance 35.4 35.0 35.0 -0.4 0.0 Real Estate, Rental, & Leasing 10.5 10.1 10.1 -0.4 0.0 Professional & Business Services 100.3 93.2 94.1 -6.2 0.9 Professional, Scientific, & Technical Services 37.9 36.6 37.0 -0.9 0.4 Management of Companies & Enterprises 9.7 9.9 9.9 0.2 0.0 Administrative, Support, & Waste Management 52.7 46.7 47.2 -5.5 0.5 Educational & Health Services 112.0 112.4 112.8 0.8 0.4 Educational Services 19.1 18.9 19.0 -0.1 0.1 Health Care & Social Assistance 92.9 93.5 93.8 0.9 0.3 Leisure & Hospitality 79.6 77.7 77.9 -1.7 0.2 Arts, Entertainment, & Recreation 9.1 9.4 9.0 -0.1 -0.4 Accommodation & Food Services 70.5 68.3 68.9 -1.6 0.6 Accommodation 12.0 11.5 11.7 -0.3 0.2 Food Services & Drinking Places 58.5 56.8 57.2 -1.3 0.4 Other Services 29.9 29.8 29.6 -0.3 -0.2 Government 104.7 104.9 104.7 0.0 -0.2 Federal Government 12.0 12.1 11.9 -0.1 -0.2 State Government 29.3 29.5 29.6 0.3 0.1 Local Government 63.4 63.3 63.2 -0.2 -0.1
CIVILIAN LABOR FORCE SUMMARY
Labor Force Employment Unemployed Rate November 2008
Labor Force Employment Unemployed Rate
October 2009
Labor Force Employment Unemployed Rate
November 2009
Columbia Micro Brentwood City Columbia City Franklin City Gallatin City Hendersonville LaVergne City Murfreesboro City Nashville City Smyrna City
37,180 34,210 2,970 8.017,090 16,350 740 4.315,210 13,980 1,240 8.131,400 29,610 1,790 5.713,560 12,360 1,200 8.925,660 24,150 1,510 5.916,840 15,680 1,160 6.953,980 49,590 4,390 8.1
323,890 305,720 18,170 5.620,630 19,000 1,640 7.9
36,150 31,800 4,350 12.016,620 15,500 1,120 6.714,950 12,990 1,960 13.130,400 28,070 2,330 7.713,250 11,720 1,530 11.524,940 22,890 2,050 8.216,600 14,860 1,740 10.551,970 47,000 4,970 9.6
318,190 289,770 28,420 8.920,010 18,010 2,000 10.0
35,870 31,630 4,240 11.816,670 15,540 1,130 6.814,850 12,920 1,930 13.030,530 28,130 2,400 7.913,220 11,750 1,480 11.225,010 22,940 2,070 8.316,650 14,900 1,750 10.552,120 47,110 5,010 9.6
318,530 290,440 28,100 8.820,020 18,050 1,980 9.9

11
Clarksville MSA is Montgomery County, Stewart County, Christian County, KY, & Trigg County, KY. Cleveland MSA is Bradley & Polk counties. Jackson MSA is Chester & Madison counties. Johnson City MSA is Carter, Unicoi, & Washington counties. Kingsport-Bristol MSA is Hawkins County, Sullivan County, Scott County, VA, Washington County, VA, & Bristol City, VA. Morristown MSA is Grainger, Hamblen, & Jefferson counties.
Nonfarm Employment (Smaller MSAs)
Clarksville, TN-KY MSA ***Cleveland, TN MSA Jackson, TN MSA
October 2009 November 2009 October 2009 November 2009 October 2009 November 2009 Revised Prelim. Revised Prelim. Revised Prelim.
Johnson City, TN MSA Kingsport/Bristol, TN-VA MSA ***Morristown, TN MSA
October 2009 November 2009 October 2009 November 2009 October 2009 November 2009 Revised Prelim. Revised Prelim. Revised Prelim.
Total Nonfarm 81,000 81,100 39,500 39,300 58,900 59,000 Total Private 61,500 61,700 33,800 33,600 46,500 46,500 Goods Producing 13,700 13,600 10,700 10,700 11,700 11,600 Mining & Construction 2,800 2,700 1,600 1,600 2,600 2,600 Manufacturing 10,900 10,900 9,100 9,100 9,100 9,000 Durable Goods Manufacturing 7,100 7,000 4,300 4,300 5,400 5,300 Nondurable Goods Manufacturing 3,800 3,900 4,800 4,800 3,700 3,700 Service Providing 67,300 67,500 28,800 28,600 47,200 47,400 Trade, Transportation, & Utilities 14,600 14,900 6,700 6,700 11,900 12,000 Wholesale Trade 1,800 1,800 900 900 2,600 2,600 Retail Trade 10,600 10,900 4,500 4,500 7,100 7,200 General Merchandise Stores 3,300 3,400 N/A N/A N/A N/A Transportation,Warehousing, & Utilities 2,200 2,200 1,300 1,300 2,200 2200
Information 900 900 300 300 800 800 Financial Activities 2,500 2,500 1,700 1,700 1,600 1,600 Professional & Business Services 7,600 7,600 2,600 2,600 4,300 4,300 Educational & Health Services 10,400 10,500 5,100 5,100 8,500 8,500 Leisure & Hospitality 8,700 8,600 4,300 4,100 5,700 5,700 Other Services 3,100 3,100 2,400 2,400 2,000 2,000 Government 19,500 19,400 5,700 5,700 12,400 12,500 Federal Government 6,300 6,400 300 300 500 500 State Government 3,600 3,500 800 800 1,800 1,900 Local Government 9,600 9,500 4,600 4,600 10,100 10,100
Total Nonfarm 80,500 80,600 118,700 118,600 47,800 47,800 Total Private 62,400 62,700 102,500 102,300 40,400 40,500 Goods Producing 11,400 11,400 28,200 28,000 14,000 14,000 Mining & Construction 3,000 3,000 7,100 7,000 2,000 2,000 Manufacturing 8,400 8,400 21,100 21,000 12,000 12,000 Durable Goods Manufacturing N/A N/A 9,100 9,000 N/A N/A Nondurable Goods Manufacturing N/A N/A 12,000 12,000 N/A N/A Service Providing 69,100 69,200 90,500 90,600 33,800 33,800 Trade, Transportation, & Utilities 13,100 13,300 24,400 24,500 10,900 11,000 Wholesale Trade 2,200 2,200 4,900 4,900 2,200 2,200 Retail Trade 9,700 9,900 15,200 15,300 5,900 6,000 General Merchandise Stores N/A N/A N/A N/A N/A N/A Transportation,Warehousing, & Utilities 1,200 1,200 4,300 4,300 2,800 2,800 Information 2,100 2,100 2,400 2,400 700 700 Financial Activities 4,600 4,600 4,100 4,100 1,200 1,200 Professional & Business Services 7,500 7,500 8,600 8,600 3,100 3,100 Educational & Health Services 13,300 13,400 18,800 18,800 5,900 5,900 Leisure & Hospitality 8,000 8,000 12,100 12,000 3,300 3,300 Other Services 2,400 2,400 3,900 3,900 1,300 1,300 Government 18,100 17,900 16,200 16,300 7,400 7,300 Federal Government 2,700 2,600 1,100 1,100 400 300 State Government 7,100 7,100 2,300 2,300 1,500 1,500 Local Government 8,300 8,200 12,800 12,900 5,500 5,500
*** These metro areas had their funding restored by BLS, effective June 2009

12
Tennessee Department of Labor & Workforce Development Employment Security Division, Research & Statistics 220 French Landing Drive Nashville, TN 37243
Phone: 615-741-2284 Fax: 615-532-9434 E-mail: [email protected]
U.S. Consumer Price Index November 2009
FIRST CLASS MAIL POSTAGE & FEES PAID BUREAU OF LABOR STATISTICS PERMIT NO. G-738
We’re on the Web www.tennessee.gov/labor-wfd
Check out The Source at www.sourcetn.org
T E N N E S S E E U N E M P L O Y M E N T R A T E S
(Seasonally Adjusted)
3.0
5.0
7.0
9.0
11.0
JAN FEB MAR APR MAY JUN JUL AUG SEP OCT NOV DEC
RATE
2007 2008 2009
Group Index Yearly MonthlyU.S. City AverageAll Items (1982-84=100) / All Urban Consumers 216.330 1.8 0.1All Items (1982-84=100) / Wage Earners & Clerical Workers 212.003 2.3 0.2SouthAll Items (1982-84=100) / All Urban Consumers 209.738 2.0 0.2All Items (1982-84=100) / Wage Earners & Clerical Workers 206.859 2.5 0.4
Percent Change
The Tennessee Department of Labor and Workforce Development is an equal opportunity employer/program. Auxiliary aids and services are available upon request. TTY: 615-532-2879 or 1-800-848-0299