
The Korean Economy: Past, Present, Future Challenges and Lessons from its Experiences
56
The Korean Economy: Past, Present, Future Challenges and Lessons from its Experiences April 2013 Hyun-Hoon LEE (Kangwon National University)
description
The Korean Economy: Past, Present, Future Challenges and Lessons from its Experiences. April 2013 Hyun-Hoon LEE (Kangwon National University). Professor, Department of International Trade and Business, Kangwon National University, Korea - Current - PowerPoint PPT Presentation
Transcript of The Korean Economy: Past, Present, Future Challenges and Lessons from its Experiences

The Korean Economy: Past, Present, Future
Challenges and Lessons from its Experiences
April 2013Hyun-Hoon LEE
(Kangwon National University)
2
Professor, Department of International Trade and Business, Kangwon National University, Korea - Current
Dean, Asia-Pacific Cooperation Academy, Kangwon National University, Korea
Senior Analyst, Asia-Pacific Economic Cooperation (APEC) Secretariat
Senior Environmental Affairs Officer, United Nations Economic and Social Commission for Asia and the Pacific (UNESCAP)
Visiting Professor, Keio University, University Melbourne, Bank of Korea, etc.
Ph.D. in Economics, University of Oregon, U.S.
Hyun-Hoon LEE

3

1. Transformation of the Korean Economy (1945-2011)
2. The Current Status of the Korean Economy
ContentsContents
3. Challenges Ahead
4. Lessons from the Korean Experiences

1. Transformation of the Korean Economy (1945-2011)
6
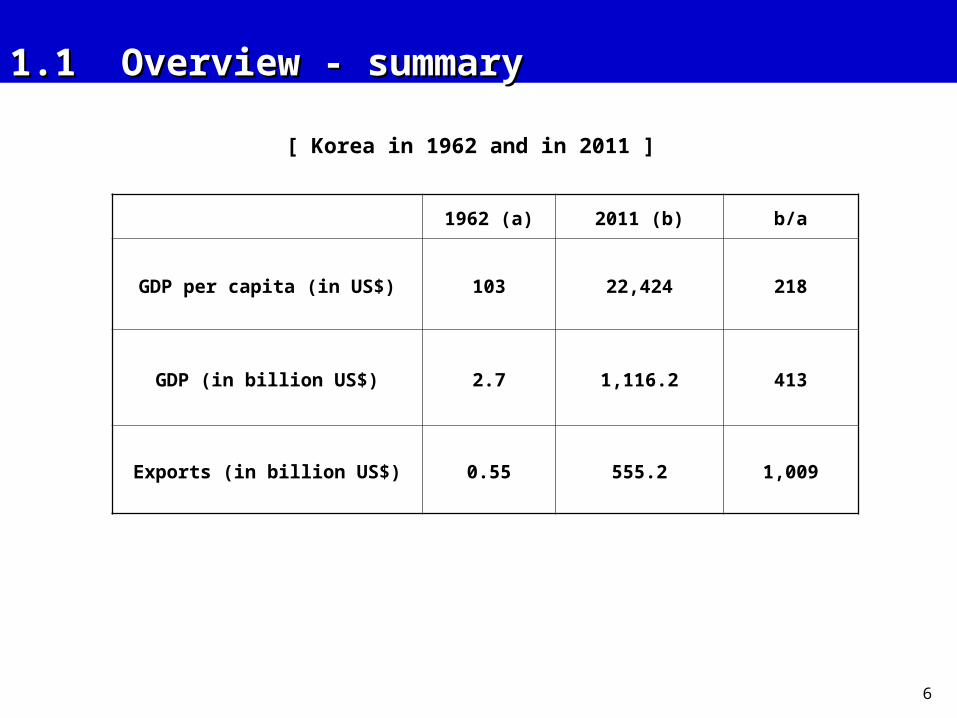
1962 (a) 2011 (b) b/a
GDP per capita (in US$) 103 22,424 218
GDP (in billion US$) 2.7 1,116.2 413
Exports (in billion US$) 0.55 555.2 1,009
[ Korea in 1962 and in 2011 ]
1.1 Overview - summary1.1 Overview - summary

7
1.1 Overview - Per Capita Income1.1 Overview - Per Capita Income
Liberationfrom JapaneseColonial Rule
Six 5-Year-Economic- Development Plans
FinancialCrisis
200519801961 1970 1995
5,000
10,000
67 89
11,432
7,355
1953
Per Capita Income (US$)
1990
1945
16,413
OECDMember100(1964)
1,000(1977)
1998 2007
20,045
8
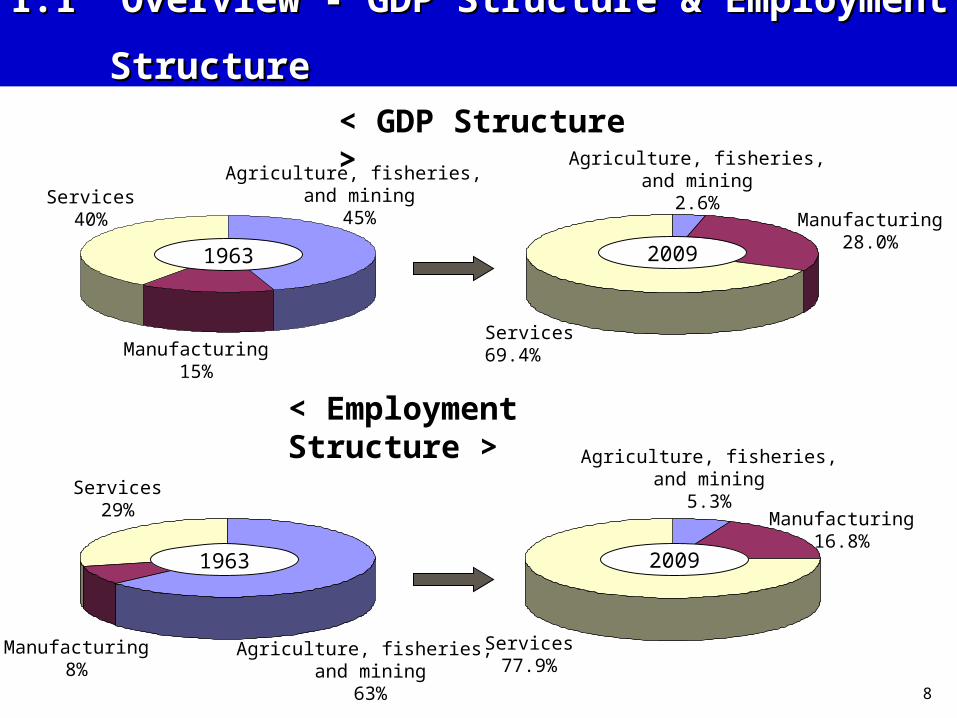
Agriculture, fisheries, and mining
45%
Manufacturing15%
Services40%
Services29%
Agriculture, fisheries, and mining
63%
Manufacturing8%
< Employment Structure >
1963
1963
Agriculture, fisheries,and mining
5.3%Manufacturing
16.8%
Services77.9%
2009
Agriculture, fisheries,and mining
2.6%Manufacturing
28.0%
Services69.4%
2009
1.1 Overview - GDP Structure & Employment Structure1.1 Overview - GDP Structure & Employment Structure< GDP Structure >

9
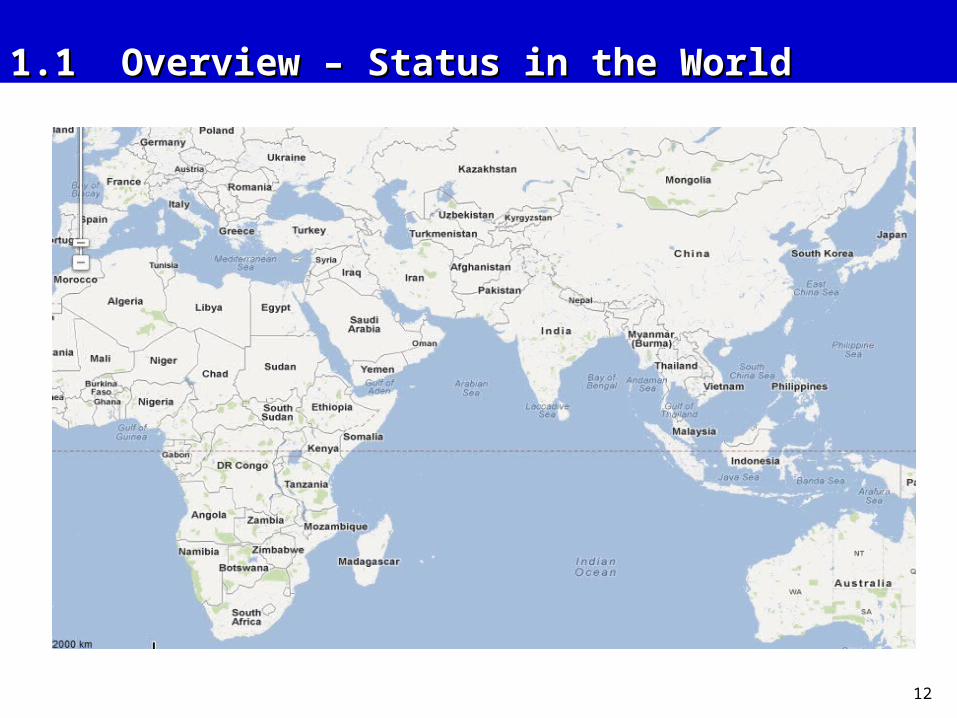
12th largest trading nation; 14th largest economy; No 1 shipbuilder; No 5 producer of automobiles; No 4 producer of electronics; No 1 producer of semiconductors; No 5 producer of textiles; And perhaps one of the most dynamic countries.
Nassassinated in 1979 by the head of KCIA
1.1 Overview – Status in the World1.1 Overview – Status in the World

10
Rank Country GDP(US
Billion) 11 Russia 1,72712 Spain 1,40713 Mexico 1,03514 Korea 1,015
15 Netherlands 779
16 Turkey 73417 Indonesia 707
18 Switzerland 528
19 Poland 46920 Belgium 46941 Singapore 209
Rank Country GDP(US
Billion) 1 U.S. 14,5872 China 5,9273 Japan 5,4594 Germany 3,2815 France 2,5606 U.K. 2,2497 Brazil 2,0888 Italy 2,0519 India 1,72710 Canada 1,527
20 largest economies in the world in terms of GDP (2010)20 largest economies in the world in terms of GDP (2010)
1.1 Overview – Status in the World1.1 Overview – Status in the World

11
1.1 Overview – Status in the World1.1 Overview – Status in the World
12
1.1 Overview – Status in the World1.1 Overview – Status in the World
13
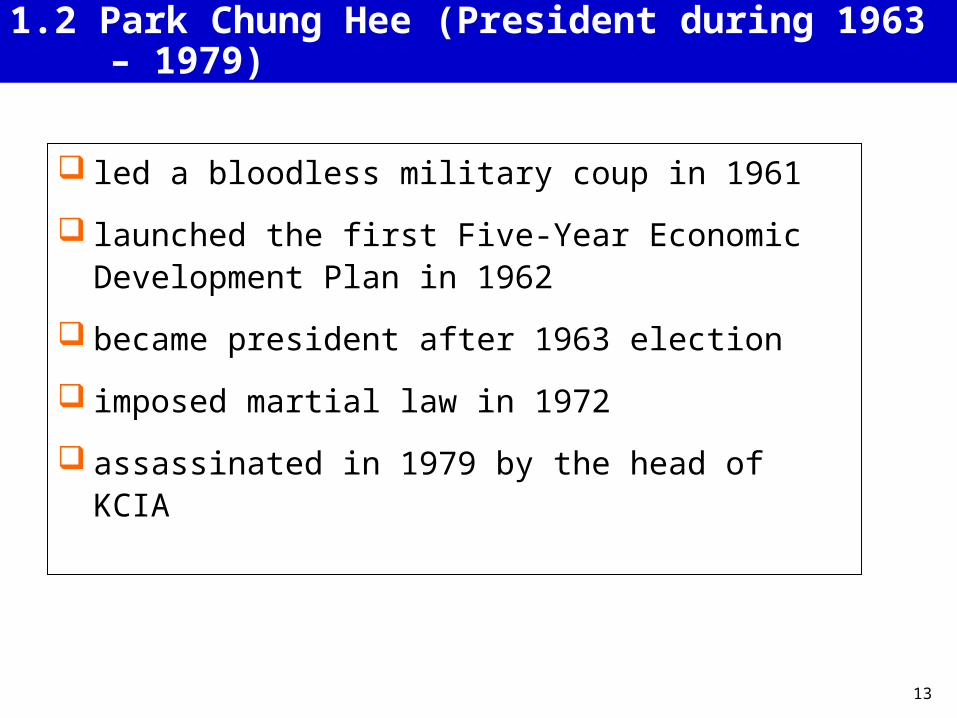
led a bloodless military coup in 1961 launched the first Five-Year Economic
Development Plan in 1962 became president after 1963 election imposed martial law in 1972 assassinated in 1979 by the head of KCIA
1.2 Park Chung Hee (President during 1963 – 1979)

14
Prosperity and independence by pursuit of a high-growth economic strategy
Export-led industrialization strategy
Market economy, but strong government intervention
1.2 Park’s strategies
15
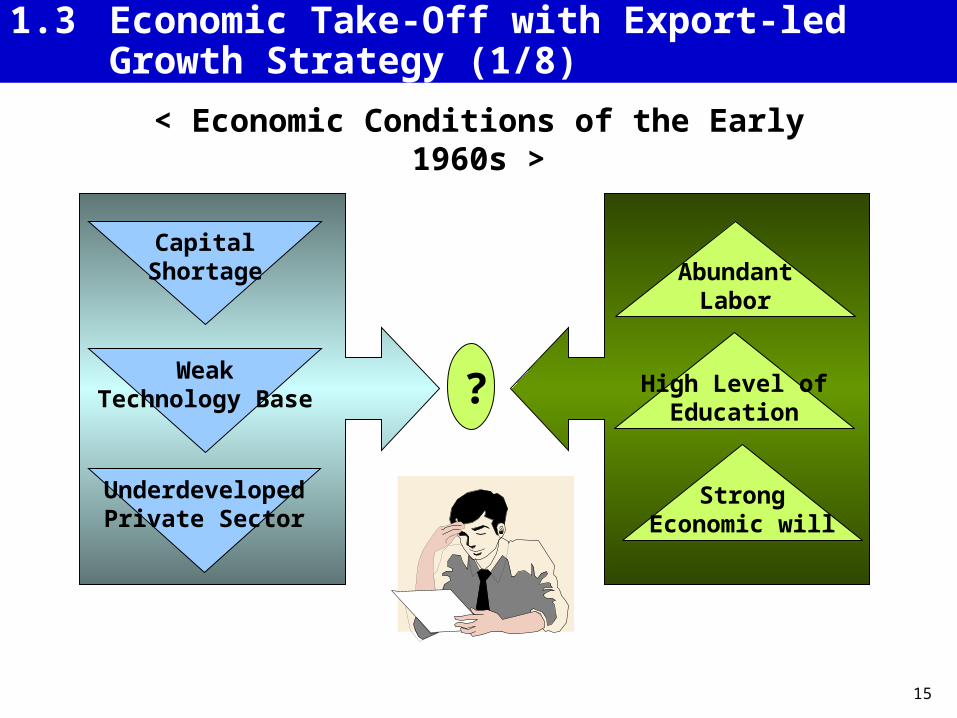
CapitalShortage
WeakTechnology Base
UnderdevelopedPrivate Sector
AbundantLabor
StrongEconomic will
High Level ofEducation
?
< Economic Conditions of the Early 1960s >
1.3 Economic Take-Off with Export-led Growth Strategy (1/8)
16
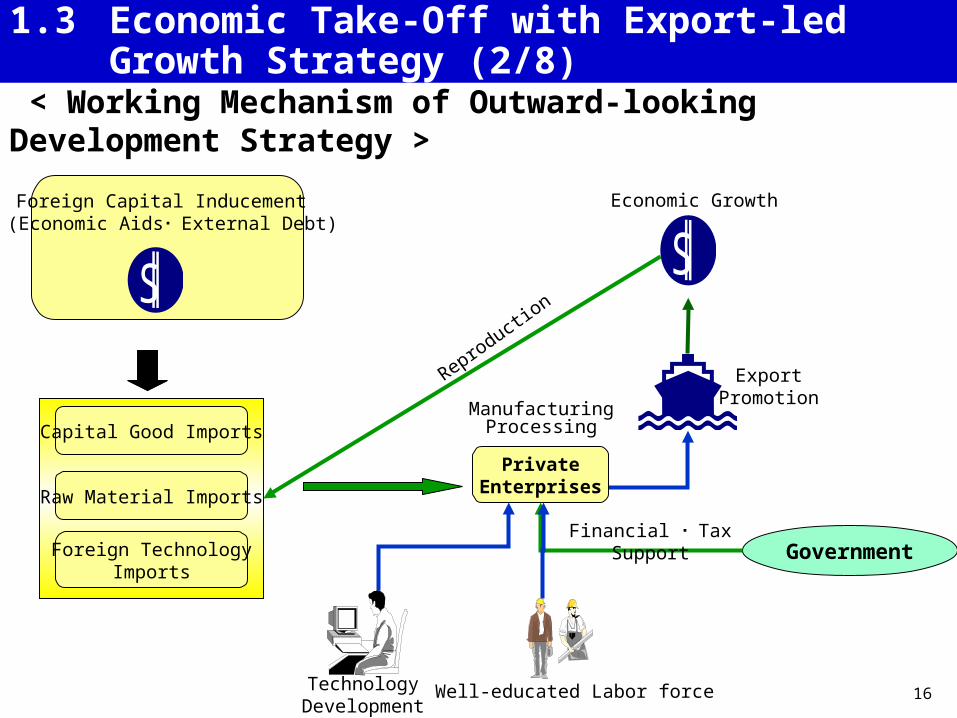
Economic Growth
Reproduction
SExport
PromotionManufacturingProcessing
PrivateEnterprises
Government
TechnologyDevelopment
Financial Tax Support
Well-educated Labor force
Foreign TechnologyImports
Capital Good Imports
Raw Material Imports
Foreign Capital Inducement (Economic Aids External Debt)
S
< Working Mechanism of Outward-looking Development Strategy >
1.3 Economic Take-Off with Export-led Growth Strategy (2/8)

17
export targets set by the government. financial support for exporters at preferential rates. tax concessions. allowance for retaining foreign exchange earnings. exempted from import controls and tariffs. fiscal policy in favor of key industrial firms. a sliding-peg system of exchange rate adjustment. awards from the president.
Major tools for export promotion policy
1.3 Economic Take-Off with Export-led Growth Strategy (3/8)

18
< Growth in Imports and Exports >
0
20
40
53 56 59 62 65 68 71 74 77 80 83 86 89 92 95 98 01 04
(% of GDP)
Imports
Exports
Trade balance
1.3 Economic Take-Off with Export-led Growth Strategy (4/8)
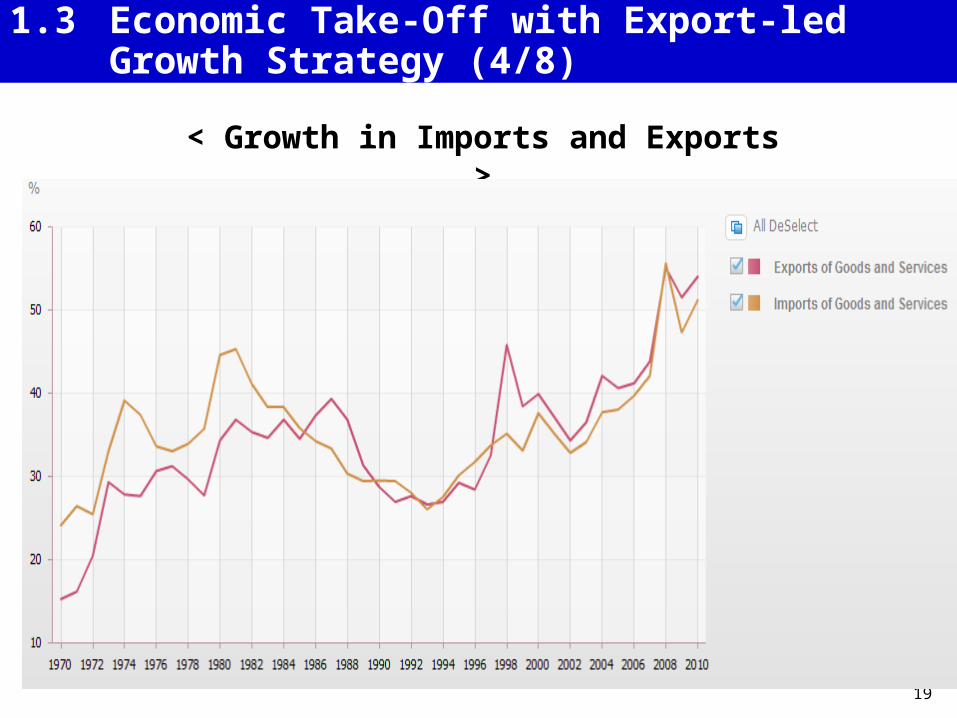
19
< Growth in Imports and Exports >
1.3 Economic Take-Off with Export-led Growth Strategy (4/8)

20
Policy Change Toward
HCI Development
Iron and Steel Electronics
Petro-Chemical Products
Automobile Ship-building Machinery
Mobilizing Financial Resources Selecting National
Champions(“Chaebol”)
1.2 Economic Take-Off with Export-led Growth Strategy (5/8)

21
ExportCommodity
Profile
1960 1970 1990 2000 1980
HCI Product
Agricultural Product
Light Industry Product
50%
2007
Semiconductor, Mobile Phone, DTV, Display, Automobile, Ship-building, etc.
83.7%
8.9%
7.4.%
< Changes in Export Commodity Profile: From Light Industry to Heavy Industry >
1.2 Economic Take-Off with Export-led Growth Strategy (6/8)

22
【 Top 10 export items of Korea (%) 】
Source : KOTIS, MTI
Rank1970 1980 1990 2000 2010
Item Share Item Share Item Share Item Share Item Share
1 Textiles 40.8 Garments 16.0 Garments 11.7 Semiconductor 15.1
Semiconductor 10.8
2 Plywood 11.0 Steel Plate-rolled Products 5.4 Semiconductor 7.0 Computer 8.5 Vessel 10.5
3 Wigs 10.8 Footwear 5.2 Footwear 6.6 Automobile 7.7 Automobile 7.5
4 Iron ores 5.9 Vessel 3.6 Video Apparatus 5.6 Petrochemical products 5.3 Flat penal display 6.9
5 Electronic goods 3.5 Audio Apparatus 3.4 Vessel 4.4 Vessel 4.9 Petrochemical
products 6.7
6 Confectionery 2.3 Man made filament fabrics 3.2 Computer 3.9 Wireless
telecom 4.6 Wireless telecom 5.9
7 Footwears 2.1 Rubber Products 2.9 Audio Apparatus 3.8 Synthetic Resin 2.9 Parts of Automobile 4.0
8 Tobaccos 1.6 Woods & Wood items 2.8 Steel Plate-rolled
Products 3.8 Steel Plate-rolled Products 2.8 Synthetic Resin 3.6
9 Iron products 1.5 Video Apparatus 2.6 Man made filament fabrics 3.6 Garments 2.7
Steel Plate-rolled Products 3.5
10 Metal products 1.5 Semiconductor 2.5 Automobile 3.0 Video Apparatus 2.1 Computer 1.9
Total 81.1 47.6 53.4 56.6 62.0
1.2 Economic Take-Off with Export-led Growth Strategy (7/8)

23
【 Top 10 export markets for Korea (%) 】
Rank
1970 1980 1990 2000 2010
Country % Country % Country % Country % Country %
1
2
3
4
5
6
7
8
9
10
U.S.
Japan
Hong Kong
Germany
Canada
Netherlands
U.K.
Vietnam
Singapore
Sweden
47.3
28.1
3.3
3.3
2.3
1.6
1.6
1.5
1.3
0.9
U.S.
Japan
Saudi Arabia
Germany
Hong Kong
Iran
U.K.
Indonesia
Netherlands
Canada
26.3
17.4
5.4
5.0
4.7
3.5
3.3
2.1
2.0
2.0
U.S.
Japan
Hong Kong
Germany
Singapore
U.K.
Canada
Taiwan
France
Indonesia
29.8
19.4
5.8
4.4
2.8
2.7
2.7
1.9
1.7
1.7
U.S.
Japan
China
Hong Kong
Taiwan
Singapore
U.K.
Germany
Malaysia
Indonesia
21.8
11.9
10.7
6.2
4.7
3.3
3.1
3.0
2.0
2.0
China
U.S.
Japan
Hong Kong
Singapore
Taiwan
Germany
India
Mexico
Indonesia
25.1
10.7
6.0
5.4
3.3
3.2
2.5
2.3
2.1
1.9
Total 91.4 71.6 72.9 68.8 62.4
Source : KOTIS
1.2 Economic Take-Off with Export-led Growth Strategy (8/8)

24
【 Top 5 export items from Algeria to Korea in 2010 】
Source : UN Comtrade, HS2007
1.2
【 Top 5 export items from Korea to Algeria in 2010 】
Rank Items Trade Value Share(%)
1 Mineral fuels $285,019,319 99.5
2 Fish and crustaceans $979,694 0.3
3 Aluminum and articles thereof $222,853 0.1
4 Nuclear reactors, boilers, machinery and mechanical appliances $67,613 0.0
5 Residues and waste from the food industries $67,261 0.0
Total All Items $286,467,916 100
Rank Items Trade Value Share(%)
1 Vehicles other than railway or tramway rolling-stock $554,802,650 36.6
2 Nuclear reactors, boilers, machinery and mechanical appliances $344,371,878 22.7
3 Articles of iron or steel $188,381,683 12.4
4 Ships, boats and floating structures $145,183,471 9.6
5 Plastics and articles $99,157,812 6.5
Total All Items $1,514,111,937 100

25
Financial repressiondue to prolonged
government intervention
High inflation andlarge fiscal deficits
Over-investment in HCIs
Negative economic growth (-3.9%) and political crisis in 1980
• Inefficient resource allocation• Macroeconomic instability• Rising inequality
Change in policy stance:“Liberalization and Stabilization”
1.3 Pitfalls of the Government-led Development (1980-97)
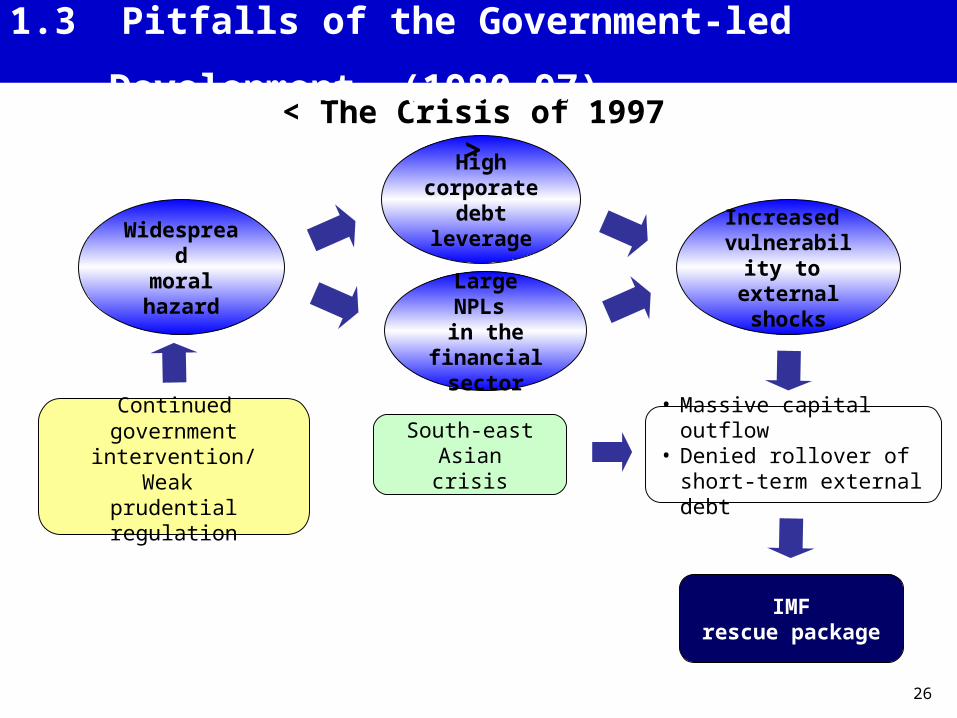
26
Increased vulnerability
to external shocks
IMFrescue package
• Massive capital outflow• Denied rollover of short-
term external debt
Continued government intervention/
Weak prudential regulation
Large NPLs in the
financialsector
South-east Asiancrisis
Highcorporate
debt leverageWidespread
moral hazard
< The Crisis of 1997 >
1.3 Pitfalls of the Government-led Development (1980-97)

27
Cleaning up non-performing loans
Acceleratingliberalization
Improving corporate governance
Expanding social safety net
- Early graduation from the IMF program- Foreign reserves of more than USD 258bn in May 2008
Improved external positions
- GDP growth: -6.7% (1998) 10.7% (1999)- Unemployment: 6.8% (1998) 3.2% (Sept 2007)
Rapid economic recovery
- Debt-equity ratio: 396% (1997) 182% (2002) - No. of banks: 33 (1997) 20 (2001)
Stronger corporate and financial sector
1.4 The Financial Crisis and Economic Reform
2. The Current Status of the Korean Economy

29Source: Bank of Korea
Per
cent
2.1a Real GDP Growth Rate – year on year2.1a Real GDP Growth Rate – year on year

30Source: Bank of Korea
Per
cent
2.2 Business Condition Index: Prospects, All Industries2.2 Business Condition Index: Prospects, All Industries

31 Source: National Statistical Office
2.3 Unemployment Rate 2.3 Unemployment Rate

32
2.4 Stock Market – Korea Composite Stock Price Index2.4 Stock Market – Korea Composite Stock Price Index

33Source: Bank of Korea
2.5 Consumer Prices (year-on-year, % change)2.5 Consumer Prices (year-on-year, % change)
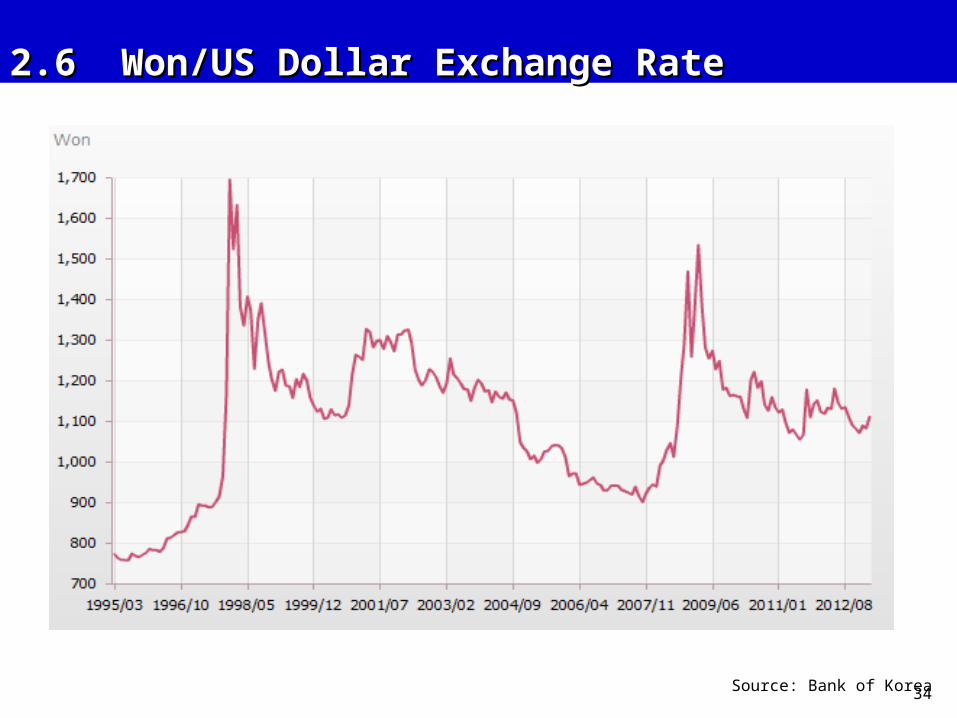
34Source: Bank of Korea
2.6 Won/US Dollar Exchange Rate 2.6 Won/US Dollar Exchange Rate

35
2.7 Current Account Balance2.7 Current Account Balance

36
2.8 International Reserves2.8 International Reserves

3. Challenges Ahead

38
3.1 Potential Growth Rate and Productivity (1/2)Economic growth of Korea depended on accumulation of resources such as capital and labor.
Korea has shown one of the highest saving ratio. It is well endowed with highly educated and well trained labor.
China
India
Korea
0
2
4
6
8
10
12
1960 1965 1970 1975 1980 1985 1990 1995 2000 2005 2010
Year
Average year of total schooling (total)
0
2
4
6
8
10
12
China India Korea, Rep.
Average year of total schooling (2010)
female
total

39
(%)
1991 2000∼ 1991 1997∼(before economic
crisis)
1.0
6.1
1.2
6.9
0.9
4.8
2003 2012∼(after economic
crisis)
Productivity
Labor
Capital 3.3 3.92.3
1.8 1.8
1.6
잠재성장률 추세변화와 요인III. 한국의 잠재 경제성장률과 그 제고방안 / 39
< Potential Growth Rate and Contributing Factors >
Source: KDI
3.1 Potential Growth Rate and Productivity (2/2)Growth depending on factor accumulation ran its course, and productivity should lead further growth. Education and training system toward the knowledge-based economy Promoting public and private R&D activities Creating an investment-friendly environment Upgrading the institutional quality

40
3.2 Income Disparity (1/3) Income Disparity (1/3) Income disparity has recently increased, reflecting structural changes in industries and labor markets.
The Government has pursued “shared growth”, “fare society”, and “symbiosis society”. But there has been growing discontent among people.
0.2
0.22
0.24
0.26
0.28
0.3
0.32
0.34
6
7
8
9
10
11
12
13
14
15
Relative Poverty Ratio and Gini Coefficient
Relative Poverty Ratio (%): Left Gini Coefficient (%): Right

41
3.2 Income Disparity (2/3) Income Disparity (2/3)
Periods Regime Economic policies Welfare policiesPark Jung-hee
Authoritarian dictatorship (1961-1979)Chun Doo-hwan Industrialization Developmental Welfare State
or Minimalist Welfare State(1980-1987) Government dominant growth
strategyRoh Tae-woo (1988-1992) Growth First, Distribution Later
Democratization Transition periodKim Young-sam (1993-1997)
Kim Dae-jung (1998-2002) Globalization and post-industrialization
Productive Welfare
Democratic government Noh Mu-hyun (2003-2007) Market driven growth Participatory WelfareLee Myung-bak (2008-present) Balance between growth and
distributionActive Welfare
Different regimes have pursued different welfare policies.

42
3.2 Income Disparity (3/3) Income Disparity (3/3) Three major problems in employment:
(1) high degree of dualism between regular workers and non-regular workers; (2) high unemployment rate of the youth; and(3) low employment rate of women.
20
22
24
26
28
30
32
34
36
38
2001. 8 2002. 8 2003. 8 2004. 8 2005. 8 2006. 8 2007. 8 2008. 8 2009. 8 2010. 8 2011. 3
Share of Non-regular workers (%)
Share of Non-regular workers
0
2
4
6
8
10
12
14
Total Unemployment vs. Youth Unempolyment (%, 1990-2010)
Unemployment rate (%) Youth unemployment rate (%)
30.0
35.0
40.0
45.0
50.0
55.0
60.0
65.0
70.0
75.0
80.0
199019911992199319941995199619971998199920002001200220032004200520062007200820092010
Female Employment Rate vs. Male Employment Rate (%, 1990-2010)
Total employment rate (%) Male employment rate (%)
Female employment rate (%)

43
3.3 Challenges from China (1/2)
0
0.5
1
1.5
2
2.5
1993 20041993 2004 1993 20041993 2004
US
China
Korea
Japan
China
China
ChinaKorea
Korea
Korea US
US
US
Japan
Japan
Japan
Medium-low tech Medium high tech High techLow tech
During the period of 1990s and 2000s, Korea gained a CA in high-tech products and improved medium-high tech, while CA declined in medium-low tech and Low tech products.
China showed similar pattern and became challenges to Korea in the World market.

44
3.3 Challenges from China (2/2)China is now number on trading partner for Korea, thus is providing the largest market for Korea. Yet, Korea is becoming overly dependant on China.
Rank
1970 1980 1990 2000 2010
Country % Country % Country % Country % Country %
1
2
3
4
5
6
7
8
9
10
U.S.
Japan
Hong Kong
Germany
Canada
Netherlands
U.K.
Vietnam
Singapore
Sweden
47.3
28.1
3.3
3.3
2.3
1.6
1.6
1.5
1.3
0.9
U.S.
Japan
Saudi Arabia
Germany
Hong Kong
Iran
U.K.
Indonesia
Netherlands
Canada
26.3
17.4
5.4
5.0
4.7
3.5
3.3
2.1
2.0
2.0
U.S.
Japan
Hong Kong
Germany
Singapore
U.K.
Canada
Taiwan
France
Indonesia
29.8
19.4
5.8
4.4
2.8
2.7
2.7
1.9
1.7
1.7
U.S.
Japan
China
Hong Kong
Taiwan
Singapore
U.K.
Germany
Malaysia
Indonesia
21.8
11.9
10.7
6.2
4.7
3.3
3.1
3.0
2.0
2.0
China
U.S.
Japan
Hong Kong
Singapore
Taiwan
Germany
India
Mexico
Indonesia
25.1
10.7
6.0
5.4
3.3
3.2
2.5
2.3
2.1
1.9
Total 91.4 71.6 72.9 68.8 62.4
【 Top 10 export markets for Korea (%) 】

45
3.4 Aging Society
< Share of the old (65+) >
0
5
10
15
20
25
30
35
40
60 65 70 75 80 85 90 95 00 05 10 15 20 25 30 35 40 45 50
(% of total population)
EU
Korea
Japan
US
Australia andNew Zealand
The speed of population aging is far higher in Korea than other major developed countries. Reforming the public pension and health insurance program Extending employment opportunities for female, elderly and disadvantaged groups

46
3.5 Challenges of Regionalism3.5 Challenges of Regionalism
Major economies of the world have pursued regionalism, while multilateralism under the WTO has been staggering.
Through FTA, Korea aims to enhance regional cooperation and to be a center of R&D, logistics and financial services in Asia.
It also endeavors to transform into an open and globalised economy, promoting FTA with a variety of economies.
Chile, Singapore, EFTA, ASEAN,
USA, EU, India, Peru, Turkey, ColumbiaCanada, Indonesia, China, CJK ,
Vietnam, RCEP
Japan, Mexico, GCC, Australia, New Zealand, MERCOSUR, Malaysia, etc.
FTA completed
Negotiation in progress
FTA under consideration
< Korea’s Promotion of FTA >
47
3.5 Worsening Environment (1/2)3.5 Worsening Environment (1/2)
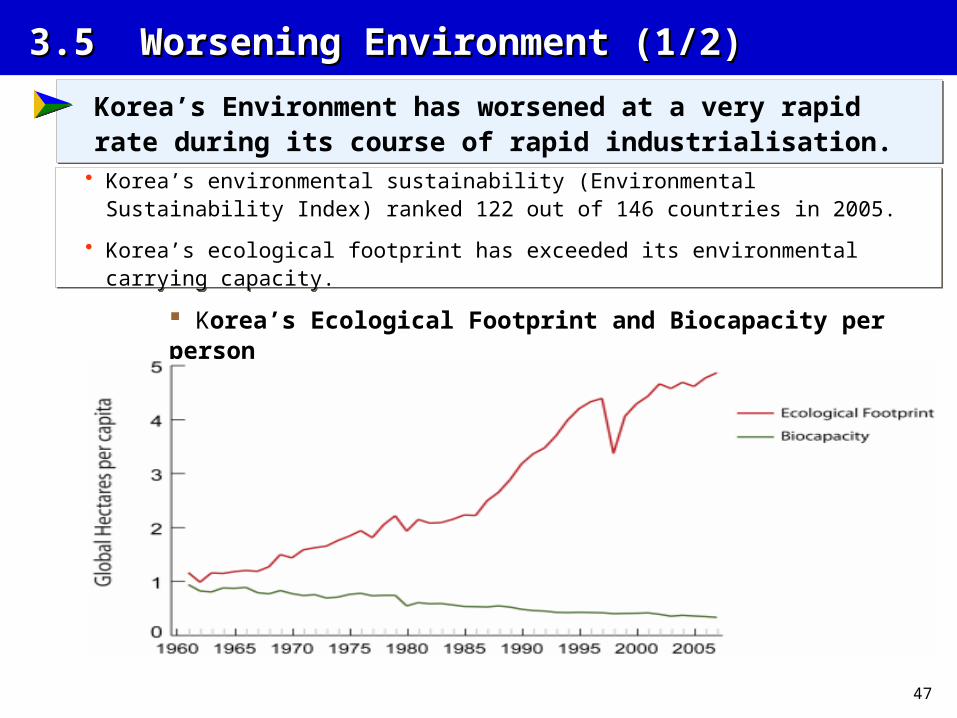
Korea’s Environment has worsened at a very rapid rate during its course of rapid industrialisation.
Korea’s environmental sustainability (Environmental Sustainability Index) ranked 122 out of 146 countries in 2005.
Korea’s ecological footprint has exceeded its environmental carrying capacity.
Korea’s Ecological Footprint and Biocapacity per person

48
A special attention needs to be given to environmental sustainability during the course of economic growth.
Korea has adopted a new paradigm of economic growth, namely the paradigm of “Green Growth” or environmentally sustainable economic growth.
3.5 Worsening Environment (2/2)3.5 Worsening Environment (2/2)
Two Principles of Green Growth (1) Creation of synergy between growth and
environmental sustainability Many policy makers and businesses tend to believe that investment in the environment is a sunken cost, but the environment and the economy can be integrated to create synergy.
(2) Improving eco-efficiency To enhance the environmental sustainability, countries need to reduce not only “relative” environmental impact per unit of production, but also the “absolute” size of environmental impact per person.

4. Lessons from the Korean Experiences

50
4.1 Strong political leadership and stability
President’s strong leadership and political stability are a precondition.
President’s strong commitment to economic growth led Korean people’s willingness to “work hard, save more, and sacrifice.”
Long-term goals were set and policies were consistently implemented.

51
4.2 Market economy
Market economy is always more efficient than planned economy.
Capitalistic market economy was put in place after the liberalization in 1945.
In the early stage of development, the Government intervened in the market .
Because the Government’s intervention continued even in the later stage, the Korean economy faced the financial crisis in 1997.
Since 1998, economic reform toward “more liberalization and lesser government intervention” has helped the Korean economy revive its growth engine .

52
4.3 Outward orientation
Outward orientation with strong incentives for exports is better than Inward orientation with the policy of import substitution.
Korean firms were forced to meet the global standard.
Korean firms were able to enjoy the economies of scale.
Korea was able to secure $ which was used to purchase raw materials, technology and build new factories..
53
4.4 Human capital through good education
Human capital is the key to economic growth and it can be build up only through good education
Korea was relatively well endowed with relatively well educated labor.
Korean people consider investment in education yields more return than any other kinds of investment.
Various R&D centers were established and Korean scientists and engineers were recruited from abroad

54
4.5 A New Growth Paradigm of Sustainable Development is Need
A special attention needs to be given to environmental sustainability during the course of economic growth.
Inclusive Growth Green Growth

55


