The involvement of the plasma membrane in the development of Dictyostelium discoideum. I....
18
224 Biochimica et Biophysica Acta, 465 (1977) 224--241 @ Elsevier/North-Holland Biomedical Press BBA 77620 THE INVOLVEMENT O " THE PLASMA MEMBRANE IN THE DEVELOPMENT OF DICTYOSTELIUM DISCOIDEUM I. PURIFICATION OF THE PLASMA MEMBRANE DANIEL MCMAHON, MARCIA MILLER * and SHARON LONG ** Division of Biology, California Institute of Technology, Pasadena, Calif. 91125 (U.S.A.) (Received July 30th, 1976) Summary A method for the isolation and purification of plasma membranes of Dictyo- stelium discoideum by equilibrium centrifugation on sucrose followed by Renografin continuous density gradients has been developed and monitored both with electron microscopy and a number of enzyme assays. On the basis of electron microscopy, the final plasma membrane fractions are judged to be free of nuclei, rough endoplasmic reticulum, lysosomes and peroxisomes. Some pro- files of the mitochondrial inner membranes are found within the plasma mem- brane fractions, but this contamination has been estimated to be only 5%. On the basis on enzyme assays, the plasma membrane fractions contain all the 5'- nucleotidase activity in the final gradients and are free of catalase, acid phos- phatase and malate dehydrogenase activity (markers for peroxisomes, lyso- somes, soluble enzymes and the matrix of mitochondria). Their content of glu- cose-6-phosphatase is reduced by more than 70%. The large majority of RNA and DNA have been removed from the preparation. Introduction Specific sites on the plasma membrane are implicated in number of steps in the development of Dictyostelium discoideum. These include movement of the amoebae [1], sensation of chemotactic stimuli [2--5], cellular adhesion during aggregation [6,7 ] and cellular interactions regulating the biochemical differen- tiation of pseudoplasmodial cells [8--11]. To identify the components of the cell surface which participate in these events, we have developed a technique * Present address: Department of Cytogenetics, City of Hope Hospital Medical Center, Duarte, Calif., U.S.A. ** Present address: Department of Biology, Yale University, New Haven, Conn., U.S.A.
-
Upload
daniel-mcmahon -
Category
Documents
-
view
212 -
download
0
Transcript of The involvement of the plasma membrane in the development of Dictyostelium discoideum. I....

224
Biochimica et Biophysica Acta, 465 (1977) 224--241 @ Elsevier/North-Holland Biomedical Press
BBA 77620
THE INVOLVEMENT O " THE PLASMA MEMBRANE IN THE DEVELOPMENT OF D I C T Y O S T E L I U M DISCOIDEUM
I. PURIFICATION OF THE PLASMA MEMBRANE
DANIEL MCMAHON, MARCIA MILLER * and SHARON LONG **
Division of Biology, California Institute of Technology, Pasadena, Calif. 91125 (U.S.A.)
(Received July 30th, 1976)
Summary
A method for the isolation and purification of plasma membranes of Dictyo- stelium discoideum by equilibrium centrifugation on sucrose followed by Renografin continuous density gradients has been developed and monitored both with electron microscopy and a number of enzyme assays. On the basis of electron microscopy, the final plasma membrane fractions are judged to be free of nuclei, rough endoplasmic reticulum, lysosomes and peroxisomes. Some pro- files of the mitochondrial inner membranes are found within the plasma mem- brane fractions, but this contamination has been estimated to be only 5%. On the basis on enzyme assays, the plasma membrane fractions contain all the 5'- nucleotidase activity in the final gradients and are free of catalase, acid phos- phatase and malate dehydrogenase activity (markers for peroxisomes, lyso- somes, soluble enzymes and the matrix of mitochondria). Their content of glu- cose-6-phosphatase is reduced by more than 70%. The large majority of RNA and DNA have been removed from the preparation.
Introduct ion
Specific sites on the plasma membrane are implicated in number of steps in the development of Dictyostel ium discoideum. These include movement of the amoebae [1], sensation of chemotactic stimuli [2--5], cellular adhesion during aggregation [6,7 ] and cellular interactions regulating the biochemical differen- tiation of pseudoplasmodial cells [8--11]. To identify the components of the cell surface which participate in these events, we have developed a technique
* Present address: D e p a r t m e n t of Cytogene t ics , City of Hope Hospi ta l Medical Center , Duar te , Calif., U.S.A.
** Presen t address: D e p a r t m e n t of Biology, Yale Univers i ty , New Haven , Conn. , U.S.A.

225
for isolating the plasma membrane under conditions which are gentle and avoiding extremes of ionic strength or pH or the removal of divalent cations from the isolation medium. We report here a method of isolating plasma mem- branes from D. discoideum amoebae during the log phase of growth which we have examined for purity both with electron microscopy and assays for enzyme markers for various cellular organelles. While we have confined our efforts pri- marily to the plasma membrane of log phase cells, we also provide some evi- dence that the isolation method is suitable for cells during aggregation and pre- culmination stages of development.
Materials and Methods
Culture of cells. Cells of D. discoideum, strain A3, were grown in HL-5 or 1.6X HL-5 medium at 22°C on rotary shakers (100 rev./min) and harvested at a concentration of 5 • 106--1 • 107 per ml. Cells were either used immediately after harvest (as described below) for the preparation of membranes or were allowed to develop [10,12] and membranes were then prepared from the cells.
Chemicals. Biochemicals were the products of Worthington Biochemical Co., Sigma-Aldrich, or Calbiochem. Renografin-76 was the product of E.R. Squibb, Inc. Diphenylamine was recrystallized from boiling hexane, and orcinol recrys- tallized from boiling benzene or toluene before use. Glutaraldehyde was obtained from Traub Laboratories and diaminobenzidine from Sigma.
Biochemical assays. Glucose-6-phosphatase, adenosine-5'-monophosphatase (5'-nucleotidase) and thiamine pyrophosphatase were assayed by the method of Morre [13], malate dehydrogenase by the method of Ochoa [14], and catalase by the method of Baudhuin et al. [15]. Protein was measured by the Lowry et al. [16] method.
To measure the activity of acid phosphatase, 0.2 ml of enzyme suspension was added to 1 ml of substrate solution (5.5 M p-ni trophenylphosphate in 50 mM citrate buffer, pH 4.8) and after incubating the assay mixture for 30 min at 37°C, 4 ml of 0.1 M NaOH was added to terminate the reaction. The absor- bance of the solution was measured at 400 nm and the absolute activity of the enzyme was calculated, using a standard of pure p-nitrophenol.
Cytochromes were measured by absorption spectroscopy of highly scattering suspensions, at the temperature of liquid N2, by the method of Butler [17]. When the content of nucleic acids were measured, the plasma membranes or unfractionated cells were precipited and washed twice in 10% trichloroacetic acid. DNA was measured by the diphenylamine and RNA by the orcinol method using the hydrolysate [ 18].
Solutions. Tris/magnesium buffer is 20 mM Tris • HC1 (pH 8.0), 5 mM MgC12. Homogenization buffer (10 mM Tris • HC1, pH 7.9, 10 mM MgC12, 0.1 mM EDTA, 394 mM sucrose) was saturated with phenylmethylsulfonyl fluoride, an inhibitor of s~rine proteases, before use. Citrate buffer is 10.9 mM sodium citrate (pH 6.9), 1.2 mM EDTA, 5 mM MgC12.
Linear sucrose gradients were made by mixing 18 ml of 0.5 M sucrose in Tris/magnesium buffer with 18 ml of 2 M sucrose in the same buffer [19]. Linear Renografin gradients were made by mxing 18 ml of citrate buffer with 18 ml of a solution composed of equal parts citrate buffer, containing 10 mM MgC12, and Renografin-76.
226
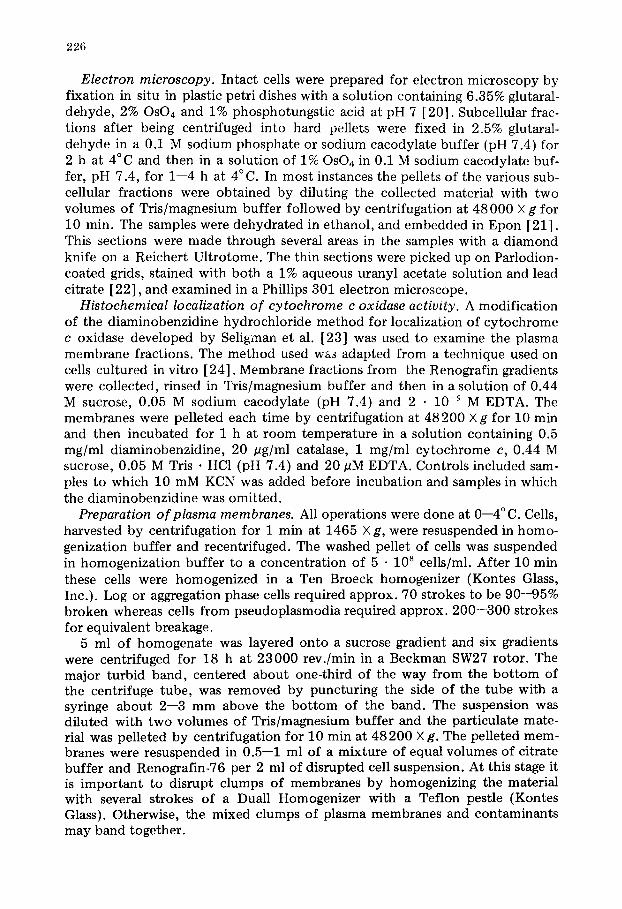
Electron microscopy. Intact cells were prepared for electron microscopy by fixation in situ in plastic petri dishes with a solution containing 6.35% glutaral- dehyde, 2% OsO4 and 1% phosphotungstic acid at pH 7 [20]. Subcellular frac- tions after being centrifuged into hard pellets were fixed in 2.5% glutaral- dehyde in a 0.1 M sodium phosphate or sodium cacodylate buffer (pH 7.4) for 2 h at 4°C and then in a solution of 1% OsO4 in 0.1 M sodium cacodylate buf- fer, pH 7.4, for 1--4 h at 4°C. In most instances the pellets of the various sub- cellular fractions were obtained by diluting the collected material with two volumes of Tris/magnesium buffer followed by centrifugation at 48 000 X g for 10 min. The samples were dehydrated in ethanol, and embedded in Epon [21]. This sections were made through several areas in the samples with a diamond knife on a Reichert Ultrotome. The thin sections were picked up on Parlodion- coated grids, stained with both a 1% aqueous uranyl acetate solution and lead citrate [22], and examined in a Phillips 301 electron microscope.
Histochemical localization o f cytochrome c oxidase activzty. A modification of the diaminobenzidine hydrochloride method for localization of cytochrome c oxidase developed by Seli~man et al. [23] was used to examine the plasma membrane fractions. The method used wa3 adapted from a technique used on cells cultured in vitro [24]. Membrane fractions from the Renografin gradients were collected, rinsed in Tris/magnesium buffer and then in a solution of 0.44 M sucrose, 0.05 M sodium cacodylate (pH 7.4) and 2 • 10 -s M EDTA. The membranes were pelleted each time by centrifugation at 48200 X g for 10 min and then incubated for 1 h at room temperature in a solution containing 0.5 mg/ml diaminobenzidine, 20 pg/ml catalase, 1 mg/ml cytochrome c, 0.44 M sucrose, 0.05 M Tris • HC1 (pH 7.4) and 20 pM EDTA. Controls included sam- ples to which 10 mM KCN was added before incubation and samples in which the diaminobenzidine was omitted.
Preparation o f plasma membranes. All operations were done at 0--4°C. Cells, harvested by centrifugation for 1 min at 1465 X g, were resuspended in homo- genization buffer and recentrifuged. The washed pellet of cells was suspended in homogenization buffer to a concentration of 5 • 10 s cells/ml. After 10 min these cells were homogenized in a Ten Broeck homogenizer (Kontes Glass, Inc.). Log or aggregation phase cells required approx. 70 strokes to be 90--95% broken whereas cells from pseudoplasmodia required approx. 200--300 strokes for equivalent breakage.
5 ml of homogenate was layered onto a sucrose gradient and six gradients were centrifuged for 18 h at 23000 rev./min in a Beckman SW27 rotor. The major turbid band, centered about one-third of the way from the bot tom of the centrifuge tube, was removed by puncturing the side of the tube with a syringe about 2--3 mm above the bot tom of the band. The suspension was diluted with two volumes of Tris/magnesium buffer and the particulate mate- rial was pelleted by centrifugation for 10 min at 48200 X g. The pelleted mem- branes were resuspended in 0.5--1 ml of a mixture of equal volumes of citrate buffer and Renografin-76 per 2 ml of disrupted cell suspension. At this stage it is important to disrupt clumps of membranes by homogenizing the material with several strokes of a Duall Homogenizer with a Teflon pestle (Kontes Glass). Otherwise, the mixed clumps of plasma membranes and contaminants may band together.

227
5 ml of resuspended membranes were placed in the bot tom of a centrifuge tube and a linear Renografin gradient was layered on top of the membrane sus- pension. After 2 h the gradients were centrifuged in the SW27 rotor for 12 h at 23000 rev./min. The major turbid band located about one-half of the way up the gradient was removed as described above, diluted with two volumes of Tris/ magnesium buffer centrifuged for 10 min at 48200 X g. The pellet from six gradients was resuspended in 10 ml of Tris/magnesium buffer and recentri- fuged. 25--30 mg of membrane protein were recovered from 1.5 • 10 ~° cells. This comprises 1--2% of the initial protein content of the homogenate.
Results
A typical log phase cell, fixed while attached to a plastic petri dish is shown in Fig. 1. A nucleus with prominent peripheral nucleoli in the center of the cell, numerous mitochondria, and a number of vesicular organelles are obvious. The endoplasmic reticulum is masked by the dense cytoplasm, filled with ribo- somes. No Golgi apparatus is apparent. Some suggestion of oriented micro- filaments can be discerned at the bot tom 10% of the cell where it is attached to the substratum (see also ref. 1).
The preparation of the plasma membranes from these cells was monitored with enzyme assays and using the electron microscope during their purification. Assays of marker enzymes were performed on serial 1.5-ml fractions of the entire gradient to follow the distribution and recovery of enzymes during puri- fication. The pellet material was combined with the bot tom 1.5 ml fraction before assay. It was not feasible to examine entire gradients in this much detail using the electron microscope, so after identifying the major regions of interest in the gradients by assay of marker enzymes, appropriate regions were pooled and these fractions examined in the electron microscope.
Appropriate enzyme markers for cellular organelles were chosen on the basis of previous investigations. Adenosine-5'-monophosphatase (AMPase) was chosen as a marker of the plasma membrane [25]. In order to support the presence of 5'-nucleotidase on the cell surface, the activity of intact cells in the assay was compared to that of an equal number of cells disrupted by sonica- tion. The intact cells exhibited 50% of the activity of the disrupted cells (pre- viously unpublished results). Cutler and Rossomando [26], using cytochemical assays, have shown that this enzyme is found on the external face of the plasma membrane. Although Green and Newell [27] have suggested that AMPase is not associated with the plasma membrane of D. discoideum, our results and those of Lee et al. [28] and Cutler and Rossomando [26] conflict with this sugges- tion. The absence of this enzyme from the preparation of Green and Newell [27] may reflect some degradation of their membranes since both Lee et al. [28] and Rossomando and Cutler [29] have shown that t reatment of D. discoi- deum membranes with phospholipase C releases this enzyme into the superna- tant. Acid phosphatase is a lysosomal enzyme in D. discoideum [30,31]. Catalase is a marker of peroxisomes [15,32] in the related genus Acantha- moeba [33], and also appears to the membrane bound in D. discoideum [34]. Glucose-6-phosphatase was used as a marker for endoplasmic reticulum [13, 27], and malate dehydrogenase was a marker for soluble enzymes and for the

228
F i g . 1. A n e l e c t r o n m i c r o g J c a p h o f a cel l p r e p a r e d f o r e l e c t r o n m i c r o s c o p y in s i t u o n a p l a s t i c p e t r i d i s h . T h e cel ls c o n t a i n a n u c l e u s ( N ) w i t h p r o m i n e n t n u c l e o l i a d j a c e n t t o t h e n u c l e a r m e m b r a n e . T h e c y t o -
p l a s m is f i l l ed w i t h n u m e r o u s m i t o c h o n d r i a (M) , o t h e r v e s i c u l a r o r g a n e l l e s ( V ) , a n d m a n y r i b o s o m e s . T h e b a s a l p o r t i o n o f t h i s ce l l h a s a t h i c k s u b c o r t i c a i m i c r o f i l a r n e n t o u s l a y e r ( M F ) . M a g n i f i c a t i o n , × 1 4 7 2 0 .
matrix of the mitochondrion [ 14,35 ]. The suitability of the latter two enzymes was confirmed by the agreement between the results of biochemical and elec- tron microscopic assays. No activity of thiamine pyrophosphatase, a marker for the Golgi apparatus [ 13] was detected in crude homogenates.
Fig. 2 ,summarizes the results of determinations of several parameters which were measured on a single sucrose gradient. Protein, as measured by the Lowry method, is distributed diffusely largely through the bot tom half and upper third of the gradient. The major turbid region of the gradient, as measured using A400nm, is localized in six fractions which are centered one-third of the way up the gradient. The enzyme, AMPase, the marker of the plasma mem- brane, was distributed in two peaks. One of these contained 17% of the total

2 2 9
E c 2 . 0 - "E-. c E
- b
~ i . @ -
c~ 0 . 5 - - ~:
c 2 . 0 - ~
~ o
~ 0.5 c3
! I I
I I
! I
9k-- ~ [ i
T / / I 2 / i
/ J, .
I 0
8 i
6
4
2
I I I
I I I I I
i ~ o • " " /:':~".."-
v..d, " :: \ : / , • - P-El ~ ~ "/k : \ .: i
W .:¥ " 4 :: ~ . . z~ A
- ~ ... o ~ ° ~ A , , F '~
I I I I I 5 I 0 15 2 0 2 5 3 0
F r a c t i o n
Fig. 2. D i s t r i b u t i o n o f m a r k e r e n z y m e s in a sucrose grad ient . T h e cel l h o m o g e n a t e was c e n t r i f u g e d in a sucrose grad ient , as d e s c r i b e d in t h e t e x t , a n d t h e t u r b i d i t y , p r o t e i n c o n t e n t and e n z y m e ac t iv i ty of 1.5- ml f r a c t i o n s c o l l e c t e d f r o m the ent ire grad ient w e r e d e t e r m i n e d . T h e s e d e t e r m i n a t i o n s are d iv ided a m o n g t w o pane l s for c lar i ty . T h e grad ien t w a s c e n t r i f u g e d f r o m r ight t o l e f t .
act iv i ty on the gradient and was f o u n d in the pos i t i on e x p e c t e d for a so luble e n z y m e on the basis o f s e d i m e n t a t i o n rate. Other m e t h o d s o f h o m o g e n i z i n g D. discoideum have y ie lded an even greater fract ion o f this e n z y m e in the so lub le fract ion [ 2 8 ] . The remain ing 83% o f the act iv i ty was dis tr ibuted in the crude p lasma m e m b r a n e ( fract ions 9 - - 1 4 ) . Malate d e h y d r o g e n a s e , a so luble e n z y m e o f the c y t o p l a s m and a marker for the matr ix o f the m i t o c h o n d r i o n was also d is tr ibuted primari ly in t w o regions o f the gradient. 39% was f o u n d in t h e p o s i t i o n - e x p e c t e d for a so lub le e n z y m e whereas 47% was f o u n d in the l o w e r hal f o f the gradient. AA~pro~. 13% o f the to ta l act iv i ty was d i s tr ibuted under the major turbid band. A l t h o u g h a small a m o u n t o f g lucose -6 -phos - phatase was f o u n d in the upper p o r t i o n o f the gradient , the bulk o f this act iv i ty was broad ly dis tr ibuted in the l o w e r hal f o f the gradient. A b o u t one- th ird o f the act iv i ty underla id the major turbid band. The bulk o f the acid p h o s p h a t a s e
230
activity was found in the turbid region of the gradient, less than 2% of the activity was detected in the region of the gradient which contains soluble pro- teins. Therefore, few of the lysosomes were disrupted during preparation. While the peak of acid phosphatase activity was displaced from the peak of turbidity and AMPase activity, 70% of the acid phosphatase activity was found under the major turbid band. In other experiments which are not presented here, approx. 70% of the catalase activity of the gradient was also found in the crude plasma membranes and in other experiments an enzymatic marker of the nucleus, a-amanitin-sensitive RNA polymerase, was found in the pellet (McMahon and Seed, previously unpublished results). Smart and Hynes [19] found that approx. 75% of the ~25I incorporated into intact cells with lactoperoxidase was in this band. These assays suggest that the major turbid band contains the cells' plasma membranes, that it is free of nuclei, but that it also contains about one- fourth of the mitochondria, up to one-half of the endoplasmic reticulum, and the majority of the lysosomes and peroxisomes.
Therefore, fractions from this gradient were examined by electron micros- copy to determine whether the distribution of morphological components resembled that expected on the basis of the distribution of enzymatic activity. Fig. 3 presents a section of the material found in the crude homogenate. The single cell, which dominates this picture, whose plasma membrane is ripped on the periphery, demonstrates the appearance of cellular organelles when the cell has been disrupted. Especially noteworthy is the alteration in the appearance of the mitochondria, which become swollen. The microfilaments and the endo- plasmic reticulum became somewhate more visible under the less compacted conditions of the disrupted cell.
Figs. 4 and 5 illustrate the composition of the crude plasma membrane frac- tions. In Fig. 4 the upper half of the band is seen to be composed almost entirely of membrane vesicles 0.5--1.0 pm in diameter. The bot tom half of the band (Fig. 5) contains membrane vesicles and occasional sheets of membrane several microns in length. Occasional membrane profiles, 10 pm in length, were seen in this band. In agreement with the biochemical assays no nuclei are visible but occasional ribosomes and mitochondria are visible. The fractions below the turbid band (Figs. 6 and 7) are more enriched with mitochondria and rough endoplasmic reticulum. The pellet (Fig. 8) is almost entirely composed of rough endoplasmic reticulum (and ribosomes), mitochondria and nuclei. Thus the composition of various fractions as determined with the electron micros- cope agrees with that determined by enzymatic analysis.
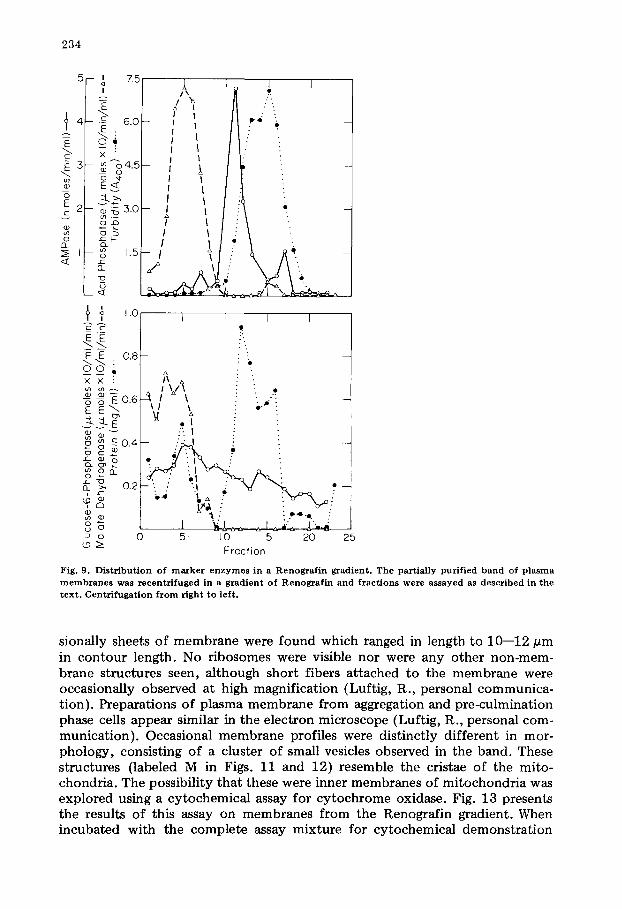
We tried several techniques to reduce contamination of the plasma mem- branes with other membranous organelles, but only one was successful in removing much of the contaminating material while maintaining the activity of the marker enzymes. Fig. 9 shows the results of enzymatic assays of the par- tially purified plasma membrane preparation after flotation in a gradient of Renografin. During this centrifugation some of the 5'-nucleotidase activity is lost. We assume that this represents decay of the activity found only in the plasma membrane fraction since the enzyme is not found in any other fraction. The major turbid band, which contains the majority of protein, is free of both acid phosphatase and malate dehydrogenase. However, some of the glucose-6- phosphatase (29% of the activity on the gradient) remained in this band. The

2 3 1
Fig. 3. An e l ec t ron m i c r o g r a p h of a r u p t u r e d cell in the h o m o g e n a t e a f te r d i s rup t ion of the cells in the Ten Broeck h o m o g e n i z e r . The p l a s m a m e m b r a n e of this cell is r ipped (uppe r cen te r ) . All the cellular c o m p o n e n t s , inc lud ing nuc leus (N), ves icular organel les ( p r e s u m a b l y inc luding p e r o x i s o m e s and lyso- somes) (V), r i b o s o m e s (R), m i c r o f i l a m e n t s (MF) a nd the p l a sma m e m b r a n e (PM), are still r ecognizab le . The m i t o c h o n d r i a (M) are en la rged a nd dense ma te r i a l is p r e sen t in m a n y of these m i t o c h o n d r i a . The subcor t i ca l m i c r o f i l a m e n t s y s t e m is m o r e a p p a r e n t a f t e r d i s rup t ion o f the cells. Magni f ica t ion , X 16 500.
Fig. 4. An e l ec t ron m i c r o g r a p h of the less dense half of the p l a s m a m e m b r a n e band in a sucrose grad ien t . This f r ac t ion con ta ins large a nd smal l m e m b r a n e vesicles ( ranging to 1 # m in d i a m e t e r ) , m i t o c h o n d r i a (M) and a few r i b o s o m e s (R). This c o r r e s p o n d s to f rac t ions 12- -15 in the sucrose g rad ien t (Fig. 2). Magni f ica t ion , X 22 500.
2 3 2
Y J
!~ i ̧ ~
5
~ ~ , [ ~ ~
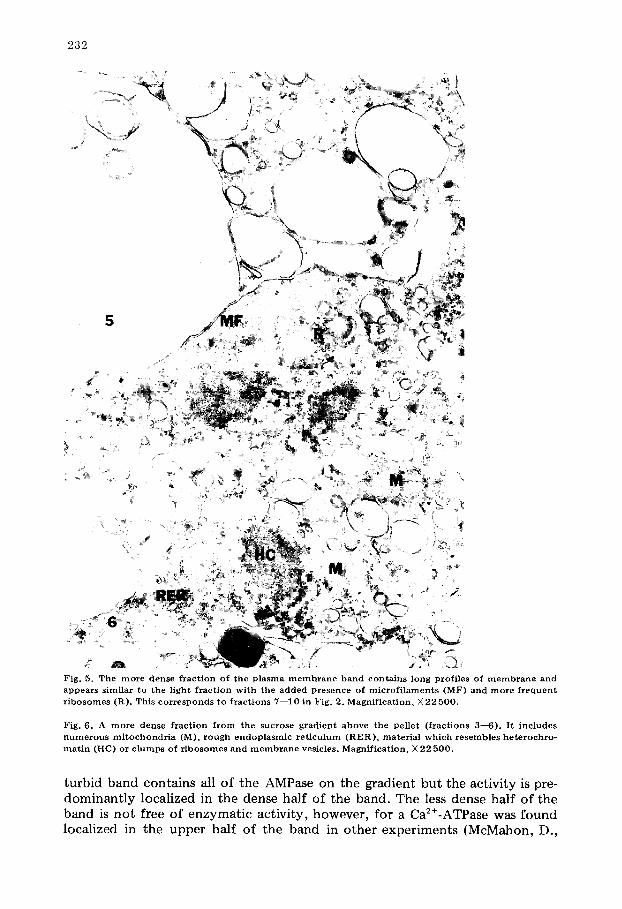
Fig. 5. The m o r e dense f r a c t i o n of t h e p l a s m a m e m b r a n e b a n d c o n t a i n s long prof i les of m e m b r a n e and appea r s s imi la r to the l igh t f r a c t i o n w i t h the a d d e d p re sence of m i c r o f i l a m e n t s ( M F ) and m o r e f r e q u e n t r i b o s o m e s (R) . This c o r r e s p o n d s to f r a c t i o n s 7 - -10 in Fig . 2. M a g n i f i c a t i o n , X 22 500 .
Fig . 6. A m o r e dense f r a c t i o n f r o m the sucrose g r a d i e n t above the pel le t ( f r ac t ions 3- -6) . I t i nc ludes n u m e r o u s m i t o c h o n d r i a (M), r o u g h e n d o p l a s m i c r e t i c u l u m ( R E R ) , m a t e r i a l w h i c h r e s e m b l e s h e t e r o c h r o - m a t i n (HC) or c l u m p s of r i b o s o m e s a n d m e m b r a n e vesicles. M a g n i f i c a t i o n , × 2 2 5 0 0 .
turbid band contains all of the AMPase on the gradient but the activity is pre- dominantly localized in the dense half of the band. The less dense half of the band is not free of enzymatic activity, however, for a Ca2+-ATPase was found localized in the upper half of the band in other experiments (McMahon, D.,
233
o ,
)
7
!
M
o
8
R
~o
M
: y U : ~ : i ,
- . s a ~
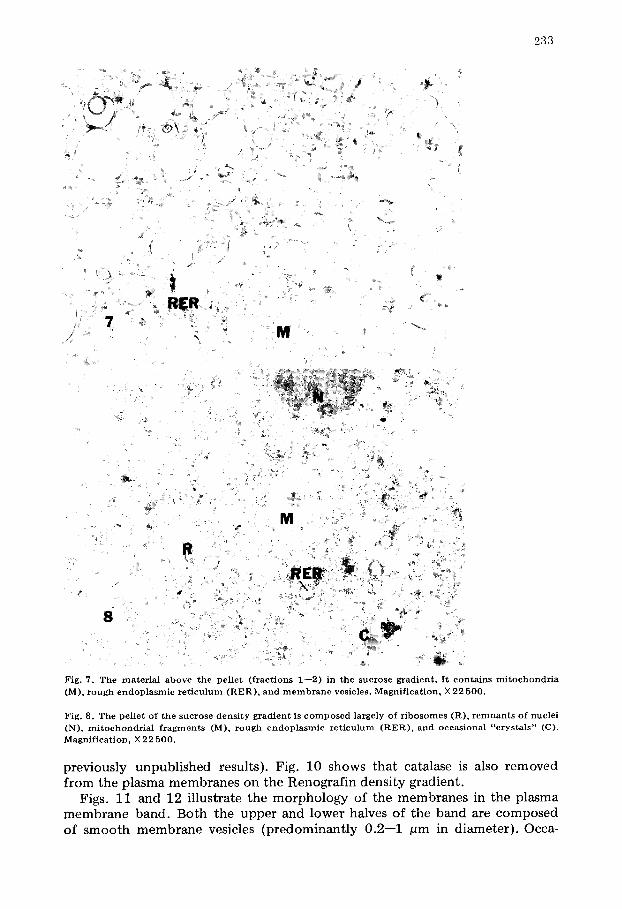
Fig. 7. The ma te r i a l a b o v e t h e pel le t ( f rac t ions 1 - -2) in t h e s u c r o s e gradien t . I t con ta ins m i t o c h o n d r i a (M), r ough endop la smic r e t i c u l u m ( R E R ) , a n d m e m b r a n e v e s i c l e s . Magnif ica t ion , × 22 500.
F i g . 8 . T h e pellet of t h e s u c r o s e d e n s i t y grad ien t is c o m p o s e d largely of r i b o so mes (R), r e m n a n t s of nuclei (N), m i t o c h o n d r i a l f r a g m e n t s (M), rough e ndop l a s mic r e t i c u l u m ( R E R ) , and occas ional " c r y s t a l s " (C). Magnif ica t ion , × 22 500.
previously unpublished results). Fig. 10 shows that catalase is also removed from the plasma membranes on the Renografin density gradient.
Figs. 11 and 12 illustrate the morphology of the membranes in the plasma membrane band. Both the upper and lower halves of the band are composed of smooth membrane vesicles (predominantly 0.2--1 pm in diameter). Occa-
2 3 4
5 ~ 7.51 / I / I
I I ...-". o i ', I 1 : " .
-~ i I f I I 1 : : :{oo !i H : I ', l i t : -~s.o- I ~ / - \ ~. -I
~ ~ I l i \ . I " 6 ~ I ~ I : ~ ". l ~ . r - I I I : ~ : I
~,,~ ^ ~I " \ / \ " . . l
X X : I l l co
~ E O . 6 E E ~
~ o w .~ 0 . 4
m o n o ~
0_ 2 o.2 i
g_~ 2 o
1.0 I
I%
V '+ • 1 :'! I
I I t
~ A # ' " I
• 4
• . ~ * . l "
0 5 I0 15 20 25 Fract ion
F i g . 9 . D i s t r i b u t i o n o f m a r k e r e n z y m e s i n a R e n o g r a f i n g r a d i e n t . T h e p a r t i a l l y p u r i f i e d b a n d o f p l a s m a
m e m b r a n e s w a s r e c e n t r i f u g e d i n a g r a d i e n t o f R e n o g r a f i n a n d f r a c t i o n s w e r e a s s a y e d as d e s c r i b e d i n t h e t e x t . C e n t r i f u g a t i o n f r o m r i g h t t o l e f t .
sionally sheets of membrane were found which ranged in length to 10--12 pm in contour length. No ribosomes were visible nor were any other non-mem- brane structures seen, although short fibers attached to the membrane were occasionally observed at high magnification (Luftig, R., personal communica- tion). Preparations of plasma membrane from aggregation and pre-culmination phase cells appear similar in the electron microscope (Luftig, R., personal com- munication). Occasional membrane profiles were distinctly different in mor- phology, consisting of a cluster of small vesicles observed in the band. These structures (labeled M in Figs. 11 and 12) resemble the cristae of the mito- chondria. The possibility that these were inner membranes of mitochondria was explored using a cytochemical assay for cytochrome oxidase. Fig. 13 presents the results of this assay on membranes from the Renografin gradient. When incubated with the complete assay mixture for cytochemical demonstration

235
1 ?
2 5
E
E E 2O
I©
c1 ~ 5
I J I i I r
p-~, ....~ 0.4 : ~ i l: ;.~
,, , . . , . / \ c:l_ ~ ' e.o ,o/ \ .
0 4 8 12 16 2 0 2 4
F r o c t i o n
F i g , 1 0 , D i s t r i b u t i o n o f e a t a l a s e i n a R e n o g r a f i n g r a d i e n t , T h e d i s t r i b u t i o n o f c a t a l a s e , a m a r k e r f o r
p e r o x i s o m e s , w a s d e t e r m i n e d w h e n p a r t i a l l y p u r i f i e d p l a s m a m e m b r a n e s w e r e c e n t r i f u g e d i n a R e n o g r a f i n
g r a d i e n t . C e n t r i f u g a t i o n f r o m r i g h t t o l e f t .
of cytochrome c oxidase, the large membrane profiles did not stain, but the clusters of small vesicles did (Fig. 13a). If KCN was added to the incubation mixture (Fig. 13b) or diaminobenzidine was omitted from the incubation mix- ture (data not presented) the presumptive cristae no longer stained.
The content of mitochondrial membranes in the plasma membrane prepara- tion was examined in another way. Difference spectra at the temperature of liquid N2 were used to detect cytochromes. Fig. 14 shows the difference spec- trum Of a plasma membrane preparation containing 4.4 mg of membrane pro- tein. The spectrum shows that membranes are free of cytochrome c but do con- tain cytochrome oxidase {peak centered at 598 nm) and cytochrome c (peak centered at 559 nm). Differentiation of the spectrum indicates that there axe two cytochromes b, b-562 and b-559 (Poff, K., personal communication). These samples had been purposely made highly light-scattering by adding CaCO3 to the cuvette. This enhances the sensitivity of detection of cyto- chromes but makes determination of the absolute content of cytochromes dif- ficult. Therefore a known amount of cytochrome c was added to the prepara- tion and its difference spectrum was determined again. On the basis of the absorption of the added cytochrome c and the extinction coefficients of cyto- chromes c, a + a3, and b [36,37] it is possible to estimate the content of cyto- chrome oxidase at 0.09 nmol/mg protein and of cytochrome b at 0.07 nmol/ mg protein.
The orcinol and diphenylamine methods were used to determine the RNA (on the basis of ribose content) and the DNA (on its deoxyribose content) of the preparation. Determinations made on preparations of plasma membranes and on whole cells from three stages of development are presented in Table I. These values themselves may over-estimate the contamination with nucleic acids since very small amounts of nucleic acid are being measured in the presence of very much greater amounts of protein, lipid and membrane-asso- ciated carbohydrate and, in the case of the measurements of DNA, these deter-

236
M
11
M
12
13a 13b
F i g . 1 1 . T h e t o p f r a c t i o n o f t h e p l a s m a m e m b r a n e s f r o m a R e n o g r a f i n g r a d i e n t c o n t a i n s o n l y m e m b r a n e v e s i c l e s . T h e p r e d o m i n a n t t y p e o f m e m b r a n e s t a i n s m o r e d e n s e l y a n d is r e l a t i v e l y l a rge i n p r o f i l e . T h e m i n o r c o m p o n e n t is a c l u s t e r o f s m a l l v e s i c l e s r e m i n i s c e n t o f t h e m i t o c h o n d r i a l c r i s t a e ( M ) . M a g n i f i c a t i o n , X 3 5 4 4 0 .
F i g . 1 2 . T h e l o w e r h a l f o f t h e p l a s m a m e m b r a n e f r a c t i o n i n t h e R e n o g r a f i n g r a d i e n t is s i m i l a r t o t h e t o p h a l f o f t h e f r a c t i o n . B o t h m e m b r a n e c o n f i g u r a t i o n s a r e p r e s e n t i n t h i s f r a c t i o n as we l l . N o t e t h e s m a l l c l u s t e r s o f m e m b r a n o u s v e s i c l e s (M) . M a g n i f i c a t i o n , × 4 0 5 0 0 .
F i g . 1 3 . (a a n d b ) E l e c t r o n m i e r o g r a p h s o f t h e d i a m i n o b e n z i d i n e h i s t o c h e m i c a i a s s a y f o r c y t o c h r o m e c o x i d a s e . D e n s e s t a i n i n g o v e r p o r t i o n s o f t h e m e m b r a n e s i n a i n d i c a t e t h e P r e s e n c e o f c y t o c h r o m e c o x i d a s e , b is a n e l e c t r o n m i c r o g r a p h o f a c o n t r o l p r e p a r a t i o n c o n t a i n i n g 1 0 m M K C N , a n i n h i b i t o r o f c y t o c h r o m e e l e c t r o n t r a n s p o r t , T h e m e m b r a n e f r a g m e n t s l a c k t h e d e n s e s t a i n s e e n i n a . M a g n i f i c a t i o n , X 6 2 4 0 0 .

TA
BL
E
I
RA
TIO
S
OF
N
UC
LE
IC
AC
IDS
T
O
PR
OT
EIN
IN
W
HO
LE
C
EL
LS
A
ND
P
LA
SM
A
ME
MB
RA
NE
S
Th
e v
alu
es
for
RN
A
an
d
DN
A
con
ten
t a
re
the
mea
n
+
S.E
. o
f tw
o
ind
epen
den
t d
eter
min
ati
on
s o
f ce
lls
or
of
pla
sma
m
emb
ran
es.
Dev
elo
pm
ent
ph
ase
ug
R
NA
-rib
ose
lmg
p
rote
in
fig
D
NA
-deo
xy
rib
ose
/mg
p
rote
in
Cel
ls
Pla
sma
m
emb
ran
es
Pla
sma
m
emb
ran
es/
cell
s
Pla
sma
m
emb
ran
es
Pla
sma
m
emb
ran
es/
cell
s
Veg
eta
tiv
e 11
.9
+_
0.3
0.96
f
0.16
0.
08
1.62
+
0.
28
0.14
1 +
0.
11
0.09
Ag
gre
ga
tio
n
10.4
f
0.3
0.40
f
0.11
0.
04
4.71
f
1.4
0.20
0 f
0.06
0.
04
Pre
culm
ina
tio
n
8.58
+
0.
15
0.42
f
0.08
0.
05
0.66
5 IO
.12
0.37
5 f.
0.
09
0.56

238
0.8
J
~ 0 . 4
I 500 600
I
I / - +7~g cytochrome
I 55O
Wavelength (nm)
Fig. 14 . D i f f e r ence s p e c t r u m of t he p l a s m a m e m b r a n e f r a c t i o n . The l o w e r curve is a d i f f e r e n c e s p e c t r u m of p l a s m a m e m b r a n e s , m a d e b y the m e t h o d of Bu t l e r [ 1 7 ] , p u r i f i e d o n R e n o g r a f i n g r ad i en t s . The u p p e r curve w h i c h is d i s p l a c e d u p w a r d b y 0 . 1 3 A r e p r e s e n t s a s p e c t r u m of t he s ame p r e p a r a t i o n a f t e r t he add i - t i o n o f 7 #g o f c y t o c h r o m e c. 4 .4 m g of m e m b r a n e p r o t e i n were used .
minations were close to the limits of detection. Nevertheless, the measured content of both RNA and DNA in these preparations is extremely low. The ratio of RNA content to protein content varies from 4 to 8% of that found in the whole cell. The ratio of DNA content to protein is 4--9% of that found in the whole cell, for vegetative and aggregation phase [38,39]. The relatively high DNA content of the pre-culmination phase membranes is partially due to a higher relative DNA content of the membranes and partially to an unex- plained drop in the relative DNA content of the whole cells. Since only 1--2% of the total cellular protein is present in the plasma membrane fraction, 99-- 99.5% of the cellular DNA has been removed from the pre-culmination phase plasma membranes. These assays confirm the removal of nuclei and rough endoplasmic reticulum.
In other experiments we have examined purified plasma membranes from all three stages for their content of other enzymes of D. discoideum. The mem- branes contained no tyrosine transaminase, uridine-diphosphoglucose pyro- phosphorylase or glycogen phosphorylase. They did contain alkaline phos- phatase (McMahon, D., previously unpublished results). Other experiments have shown that the plasma membranes also contain discoidin [47] which has been identified by its molecular weight and sugar-specific binding properties [48].
Discussion
The method of preparation described here yields a preparation of plasma membranes which is free of several membranous cellular organelles. Biochem-

239
ical assays and/or electron microscopy indicate that the plasma membranes are free of nuclei, lysosomes, intact mitochondria, and peroxisomes. Attempts to detect and monitor the presence of a Golgi apparatus were unsuccessful. None of several soluble enzymes measured were found in these preparations. Nevertheless, a small fraction of the membrane preparation consists of the inner membrane of the mitochondrion. The extent of contamination of the preparations with the mitochondrial inner membrane cannot be determined with absolute accuracy since mitochondria of D. discoideum have not been purified to homogeneity and completely characterized. Nevertheless it is pos- sible to estimate the extent of the contamination. Erickson and Ashworth [40] have determined that partially purified mitochondria of D. discoideum, strain Ax-2, contain 0.16 nmol cytochromes a + a3, and 0.27 nmol cytochrome b per mg protein. These cytochromes are localized in the inner membrane of the mitochondrion [35,41]. If we assume that 20% of the mitochondrial protein is found in the inner membrane of D. discoideurn mitochondria [35], then mito- chondrial inner membranes constitute 11% of the protein in this preparation (i.e. 11% = content of cytochrome oxidase in these preparations/estimated con- tent of cytochrome oxidase in the inner membrane of the mitochondrion of D. discoideum). If we use the content of cytochrome b of the preparation, our estimate of contamination with mitochondrial inner membrane is 5%.
In light of the difference between these estimates it is interesting that Stuchell et al. [34] have also partially purified a preparation of D. discoideum mitochondria from strain A3. Their measurement of the cytochrome b content of these mitochondria agrees with the measurement of Erickson and Ashworth [40] but they estimate a content of cytochrome oxidase 2.2 times greater than the previous estimate. Using this value the extent of contamination of our plasma membranes with mitochondrial inner membrane would be 5% on the basis of either cytochrome. The estimate of extent of contamination would be reduced if further purification increased the content of cytochromes measured by Erickson and Ashworth [40] or Stuchell et al. [34].
This question can be addressed in another way. The phospholipid content of plasma membrane preparations purified by our method has been measured by Dr. John Ellingson. The fraction of the total phospholipids which is cardiolipin (plus lysocardiolipin) is 3.1 and 1.5% of the phospholipid is phosphatidyl- choline (and lysophosphatidylcholine) (Ellingson, J., unpublished results). If we assume that all of the cariolipin and phosphatidylcholine represent phos- pholipid contributed by mitochondrial contamination we can make maximal estimates of the content of mitochondria on the basis of the phospholipid measurements. Cariolipin is principally confined to the inner membrane of mammalian mitochondria where it composes 21--22% of the phospholipid [41, 42]. If cardiolipin content is similar for D. discoideum mitochondria, and all of the cariolipin comes from contaminating mitochondrial inner membrane, then the extent of contamination of the preparations with inner membrane of mitochondria is 14%. Phosphatidylcholine is partitioned relatively equally between the inner and outer membranes of those mitochondria where it has been measured and constitutes about 40--45% of the phospholipids [41--43]. Assuming that the total content of phosphatidylcholine was contributed by the sum of all inner and outer mitochondrial membranes contaminating the

240
preparation, they would compose 3--4% of the membrane in the preparation. It seems likely that the extent of contamination of this plasma membrane preparation with mitochondrial inner membrane is approx. 5%. Although no morphometr ic measurements have been made, this agrees with the general impression which is given by electron microscopy of the preparation.
Several of our observations indicate there is little, if any, endoplasmic reticulum in the plasma membrane preparation. The insignificant content of RNA and absence of ribosomes indicate that the preparations contain very little rough endoplasmic reticulum. However, this does not exclude the pos- sibility of contamination with smooth endoplasmic reticulum. If the endo- plasmic reticulum of D. discoideum has a phospbatidylcholine content of 55% similar to that of other endoplasmic reticula [44], an argument similar to that presented for mitochondria above suggests the plasma membranes contain slight contamination. Endoplasmic reticulum from both plants and mammals contains cytochrome bs with an Ama x at 555 nm [45,46]. We did not detect a b-type cytochrome with this Amax. This also argues against possible contaimi- nation with smooth endoplasmic reticulum. However, the plasma membrane band from the Renografin gradient contains 14% of the glucose-6-phosphatase activity recovered during preparation (i.e. 48% of the membrane-bound glu- cose-6-phosphatase was in the crude plasma membranes recovered from the sucrose gradient, 30% of the total glucose-6-phosphatase activity was recovered in the plasma membrane band on Renografin gradients). Because the measure- ments discussed above suggest that there is very little endoplasmic reticulum in this band, this may represent a glucose-6-phosphatase activity of the plasma membrane. Green and Newell [27] have also concluded that D. discoideum plasma membranes have an endogenous glucose-6-phosphatase activity.
Our identification of the plasma membrane fraction rests on the morphology of the membranes, the relatively large size of the membranous profiles (most easily explained as representing fragments of the cell surface) and the presence of all of the membrane-associated AMPase in the plasma membrane fraction. On the basis of recovery of 5'-nucleotidase activity, we can estimate that we have recovered about 90% of the plasma membranes in the original extract.
Although we have characterized the membrane isolated from vegetative cells relatively extensively, it has not been possible to examine those of aggregation and preculimination phases in as much detail. Their relative purity, however, is supported by their morphology in the electron microscope, by their low con- tent of nucleic acids, and also by the fact that, in spite of a number of changes in composit ion associated with development, their composit ion of proteins and glycoproteins overlaps to a considerable extent with that of log phase plasma membranes as indicated by sodium dodecyl sulfate gel electrophoresis [12].
Acknowledgments
We wish to thank Drs. W. Butler, K. Poff and H. Schmidt for their aid with the analysis of the content of cytochromes in these preparations by low tem- perature spectroscopy; Dr. R. Luftig, for his examination of several prepara- tions in the electron microscope; and Mr. W. Fry and Dr. J. Cross for their help in several assays. This work was supported by U.S.P.H.S. Grant GM06965.

241
References
1 Clarke, M., Schatter, G., Mazia, D. and Spudich, J.A. (1975) Proc. Natl. Acad. Sci. U.S. 72, 1758-- 1762
2 Konijn, T.M., Van de Meere, J.G.C., Bonner, J.T. and Barkley, D.S. (1967) Proc. Natl. Acad. Sci. U.S. 58, 1152--1154
3 Mato, J.M. and Konijn, T.M. (1975) Biochim. Biophys. Acta 385, 173--179 4 Malchow, D. and Gerisch, G. (1973) Biochem. Biophys. Res. Commun. 55, 200--204 5 Henderson, E.J. (1975) J. Biol. Chem. 250, 4730--4736 6 Gerisch, G. (1968)Cur t . Top. Dev. Biol. 3, 157--197 7 Beug, H., Katz, F.E. and G. Gerisch (1973) J. Cell Biol. 56 ,647- -658 8 Newell, P.C., Longlands, M. and Sussman, M. (1971) J. Mol. Biol. 58, 541--554 9 McMahon, D. (1973) Proc. Natl. Acad. Sci. U.S. 70, 2396--2400
10 McMahon, D., Hoffman, S., Fry, W. and West, C. (1975) in Developmental Biology: Pattern Forma- t ion, Gene Regulat ion (McMahon, D. and Fox, C.F., eds.), pp. 60--75, W.A. Benjamin, Inc., Palo Alto, Calif.
11 McMahon, D. and Hoffman, S. (1976) in The Cell Surface of Normal and Transformed Cells (Hynes, R., ed.), Wiley Inc., London, in the press
12 Hoffman, S. and McMahon, D. (1977) Biochim. Biophys. Acta 465 ,242- -259 13 Morre, D.J. (1971) in Methods in Enzymology (Jakoby, W.B., ed.), Vol. XXII, pp. 130--148, Aca-
demic Press, New York 14 Ochoa, S. (1955) in Methods in Enzymology (Colowick, S.P. and Kaplan, N.O., eds.), Vol. I, pp.
735--739, Academic Press, New York 15 Baudhuin, P., Beaufay, H., Rahmanli , Y., Sellinger, O.Z., Wattiaux, R., Jacques, P. and DeDuve, C.
(1964) Biochem. J. 92, 179--184 16 Lowry, O.H., Rosebrough, N.J., Farr, A.L. and Randall , R.J. (1951) J. Biol. Chem. 193 ,265 - -275 17 Butler, W.L. (1972) in Methods in Enzymology (San Pier, o, A., ed.), Vol. XXIV, pp. 3--25, Academic
Press, New York 18 Schneider, W.C. (1957) in Methods in Enzymology (Colowick, S.P. and Kaplan, N.O., eds), Vol. III,
pp. 6 8 0 - 6 8 7 , Academic Press, New York 19 Smart, J. and Hynes, R. (1974) Nature 251 ,319- -321 20 Sch~/fer-Darmell, S. (1967) Z. Zellforsch. Mikroskop. Anat. 78 ,441 - -462 21 Coon, M.G. and Manasek, F.J. (1970) Carnegie Inst. Yearb. 68, 540--542 22 Venable, J.H. and Coggeshall, R. (1965) J. Cell Biol. 2 5 , 4 0 7 - 4 0 8 23 Seligman, A.M., Kamovsky, M.J., Wasserkrung, H.L. and Hanker, J.S. (1968) J. Cell Biol. 38, 1--14 24 Storrie, B. and Attardi , G. (1973) J. Cell Biol. 56 ,819- -831 25 DePierre, J.W. and Karnovsky, M.L. (1973) J. Cell Biol. 56 ,275- -303 26 Cutler, L.S. and Rossomando, E.F. (1975) Exp. Cell Res. 95, 79--87 27 Green, A.A. and Newell, P.C. (1974) Biochem. J. 140, 313--322 28 Lee, A., Chance, K. and Weeks, G. (1976) Arch. Biochem. Biophys. in the press 29 Rossomando, E.F. and Cutler, L.S. (1975) Exp. Cell Res. 95, 67--78 30 Wiener, E. and Ashworth, J.M. (1970) Biochem. J. 118 ,505 - -512 31 Gezelius, K. (1971) Arch. Mikrobiol. 75, 327--337 32 Leighton, F., Poole, B., Beaufay, H., Baudhuin, P., Coffey, J.W., Fowler, S. and DeDuve, C. (1968) J.
Cell Biol. 37 ,482 - -513 33 Miiller, M. (1969) Ann. N.Y. Acad. Sei. 168, 292--301 34 Stuchell, R.N., Wcinstein, B.I. and Beattie, D.S. (1975) J. Biol. Chem. 250, 570--576 35 Schnaltman, C. and Greenawalt, J.W. (1968) J. Cell Biol. 38, 158--175 36 Kopaczyk, K.C. (1967) in Methods in Enzymology (Estabrook, R.W. and Pullman, M.E., eds.). Vol.
X, pp. 253--258, Academic Press, New York 37 Rieske, J.S. (1967) in Methods in Enzymology (Estahrook, R.W. and Pullman, M.E., eds.), Vol. X, pp.
488--493, Academic Press, New York 38 Ashworth, J.M. and Watts, D.J. (1970) Biochem. J. 119 ,175 - -182 39 Leach, C.K. and Ashworth, J.M. (1972) J. Mol. Biol. 68, 35--48 40 Erickson, S.K. and Ashworth, J.M. (1969) Biochem. J. 113, 567--568 41 Parson, D.F., Williams, G.R., Thompson, W., Wilson, D. and Chance, B. (1967) in Mitochondrial
Structure and Compar tmenta t ion (Quagliariello, E., Papa, S., Slater, E.C. and Tager, J.M., eds.), pp. 29--70, Adriatics Editrice, Bari, I taly
42 Stoffel, W. and Schiefer, H.-G. (1968) Z. Physiol. Chem. 349, 1017--1026 43 Getz, G.S., Bartley, W., Lurie, D. and Not ton, B.M. (1968) Biochim. Biophys. Acta 152 ,325- -339 44 DePierre, J.W. and Dallner, G. (1975) Biochim. Biophys. Acta 415, 411--472 45 Garfinkel, D. (1957) Arch. Biochem. Biophys. 71 ,111 - - 120 46 Lord, J.M., Kagawa, T., Moore, T.S. and Beevers, H. (1973) J. Cell Biol. 57, 659--667 47 Simpson, D.L., Rosen, S.D. and Barondes, S.H. (1974) Biochemistry 13, 3487--3493 48 West, C. and McMahon, D. (1976) J. Cell Biol. 70, 411a