The “Intercepts” Form and graphing linear inequalities Alegbra I, Standard 6.
35
The “Intercepts” Form and graphing linear inequalities Alegbra I, Standard 6
-
Upload
alisha-king -
Category
Documents
-
view
222 -
download
2
Transcript of The “Intercepts” Form and graphing linear inequalities Alegbra I, Standard 6.

The “Intercepts” Formand graphing linear
inequalities
Alegbra I, Standard 6

One line, many forms
Any time we have an x and y in an equation, without any power, and using only the primary math operations such as adding, subtracting multiplying and dividing, we have a “linear” equation.
The math just works that way. I may not be able to tell you where the line is on the graph right way, but can say with certainty that: “That is a straight line.”

A straight line equation in disguise
y = 5x + 2 y -5x = 2 1/2y – (5/2)x = 0 2y = 10x + 4
All of these are in fact the same equation. We have just moved the numbers around a bit using algebra.

California Algebra 1, Standard 6
“Students graph a linear equation and compute the x- and y-intercepts (e.g., graph 2x + 6y = 4). They are also able to sketch the region defined by linear inequality (e.g., they sketch the region defined by 2x + 6y < 4).”

So today we are concentrating on:
-5x + y = 2
This is equation is in what is known as the Intercepts form. It is called what it is because this form makes it easy to find out where this line will hit the x axis (that point is called the x-intercept) and where it hits the y axis (that point is called the y-intercept).

What do incepts have in common, mathematically?
Here is a line with two intercepts.
The red dot is the Y-intercept, the exact place where the Y axis and the line meet.
Y-axis

The green dot is an X-intercept.
It is the exact spot where the x-axis and the line meet.
What do incepts have in common, mathematically?
X-axis

What are the co-ordinates?
(0,3) (-2.5,0)
What if the lines was in a different place?
X-axis

So you see…
The X coordinate of the Y-intercept is always 0. The Y coordinate of the X-intercept is always 0. Notice the little switcharoo there.
– Zeroing the Y gives you the X.– Zeroing the X gives you the Y.
Always go to the opposite co-ordinate.
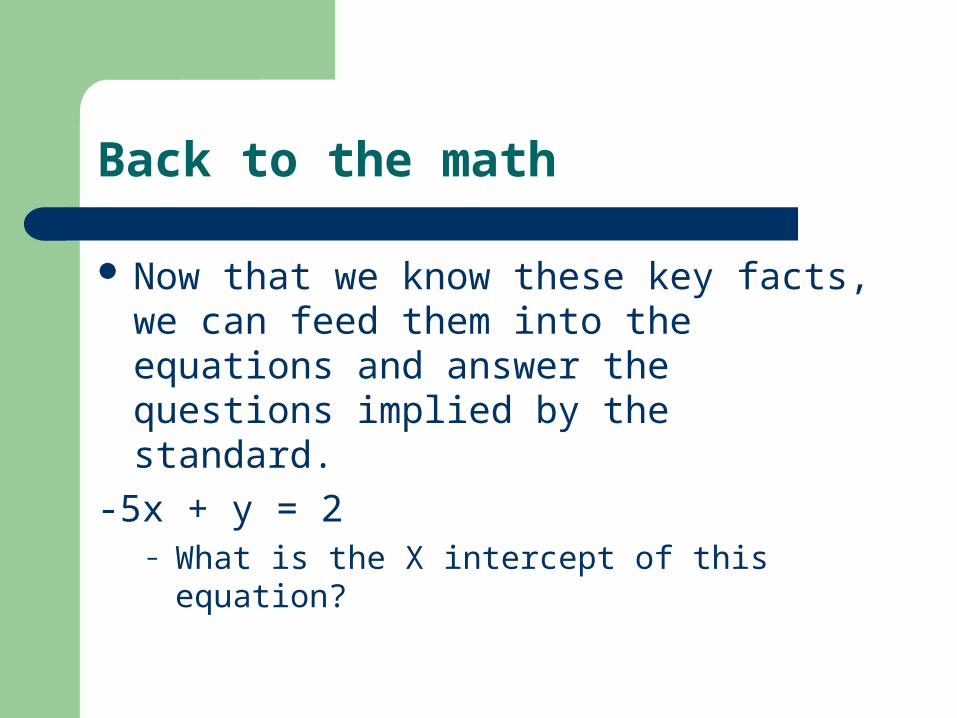
Back to the math
Now that we know these key facts, we can feed them into the equations and answer the questions implied by the standard.
-5x + y = 2– What is the X intercept of this equation?
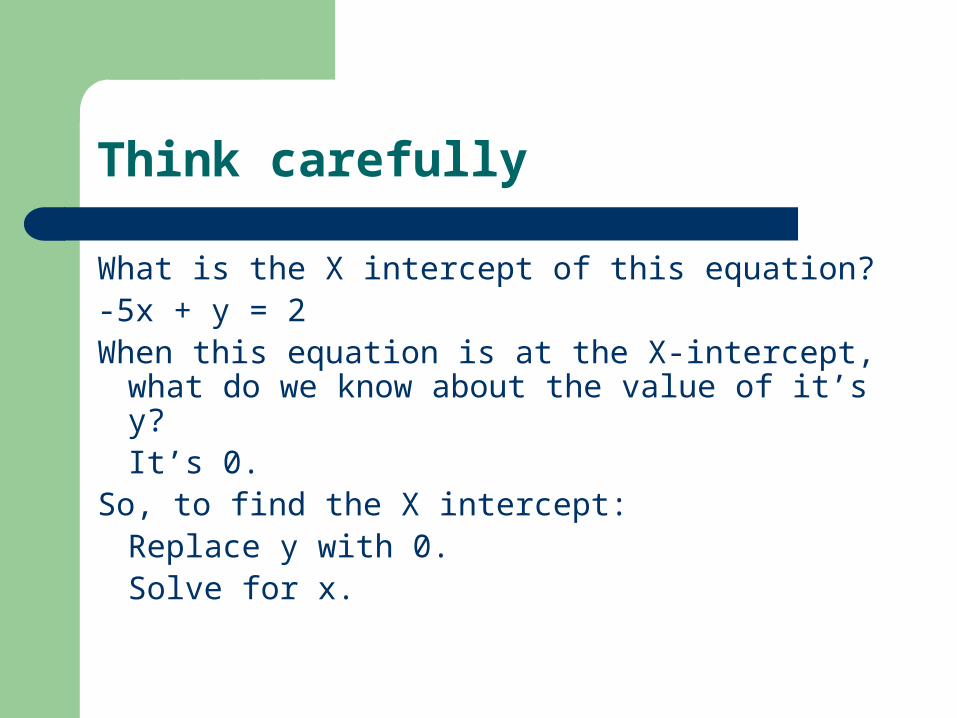
Think carefully
What is the X intercept of this equation?-5x + y = 2When this equation is at the X-intercept, what
do we know about the value of it’s y?It’s 0.
So, to find the X intercept:Replace y with 0.Solve for x.

Just do it.
-5x + y = 2
-5x + (0) = 2
-5x = 2
x = -2/5
This means that the line created by -5x + y = 2 will touch the x axis at -2/5.

Finding the Y-intercept
We found that whenever a line is touching the Y-axis then the X value is 0.
So….– Plug in 0 for X.– Solve for y.– You will have your y-intercept value.
Just do it:
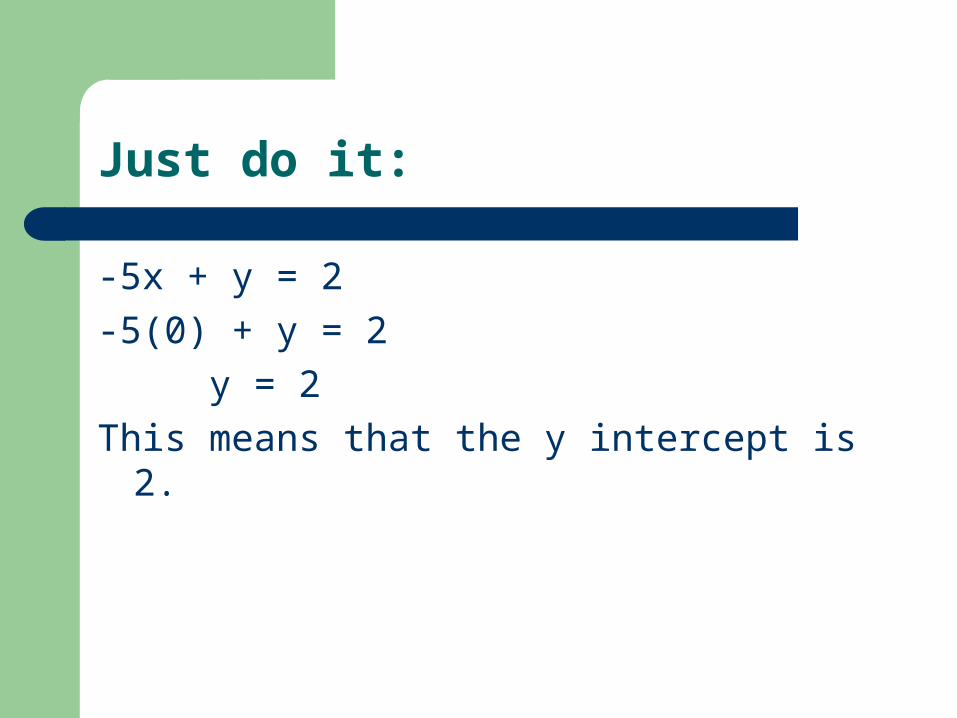
-5x + y = 2
-5(0) + y = 2
y = 2
This means that the y intercept is 2.

Let’s do another, quickly now.
Find the X and Y intercepts of -2y -4x = 10 and graph it.
Set X = 0 to find the Y-int.-2y – 4x = 10
-2y – 4(0) = 10
-2y = 10
y = -5
Set Y = 0 to find the X-int.-2y – 4x = 10
-2(0) – 4x = 10
-4x = 10
x = -2 1/2

If we have two points, we can draw a line.
We have (0,-5)– the Y-intercept
We have (-2 ½, 0)– the X-intercept
Plot these points draw a line through them.
Remember to extend the line to the boundaries of the graph.
x
y
Break time. Stop and do somepractice with these ideas.
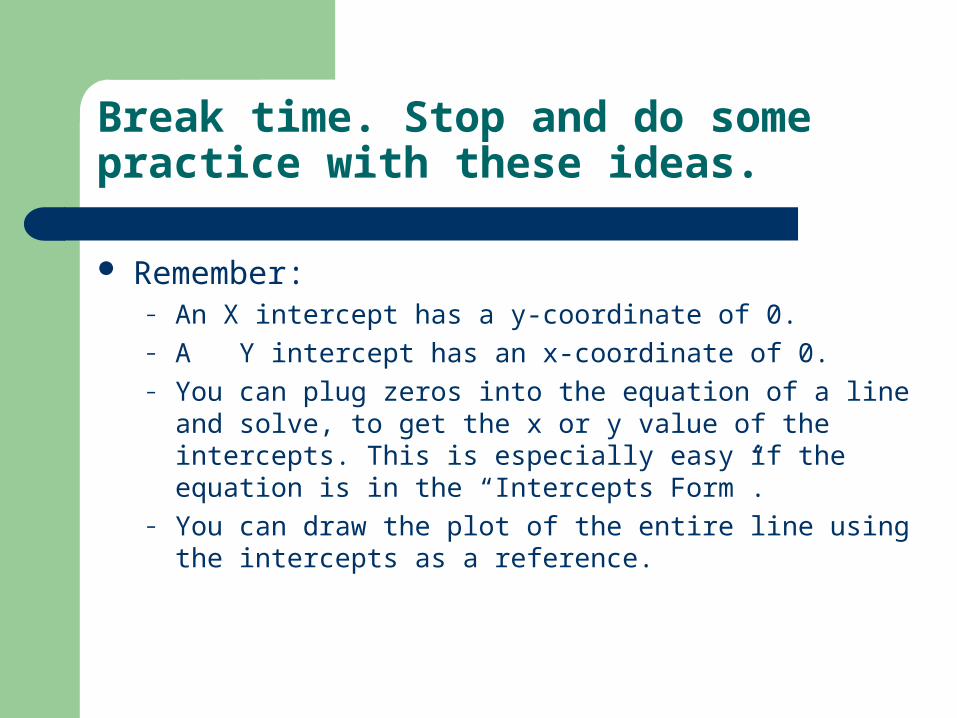
Remember:– An X intercept has a y-coordinate of 0.– A Y intercept has an x-coordinate of 0.– You can plug zeros into the equation of a line and solve, to
get the x or y value of the intercepts. This is especially easy if the equation is in the “Intercepts Form”.
– You can draw the plot of the entire line using the intercepts as a reference.

Graphing the solution to an inequality
Break over. Let’s move on to fully cover the standard. First some theory. Inequalities are more difficult to graph because the
say more about a set of numbers then an equation does.
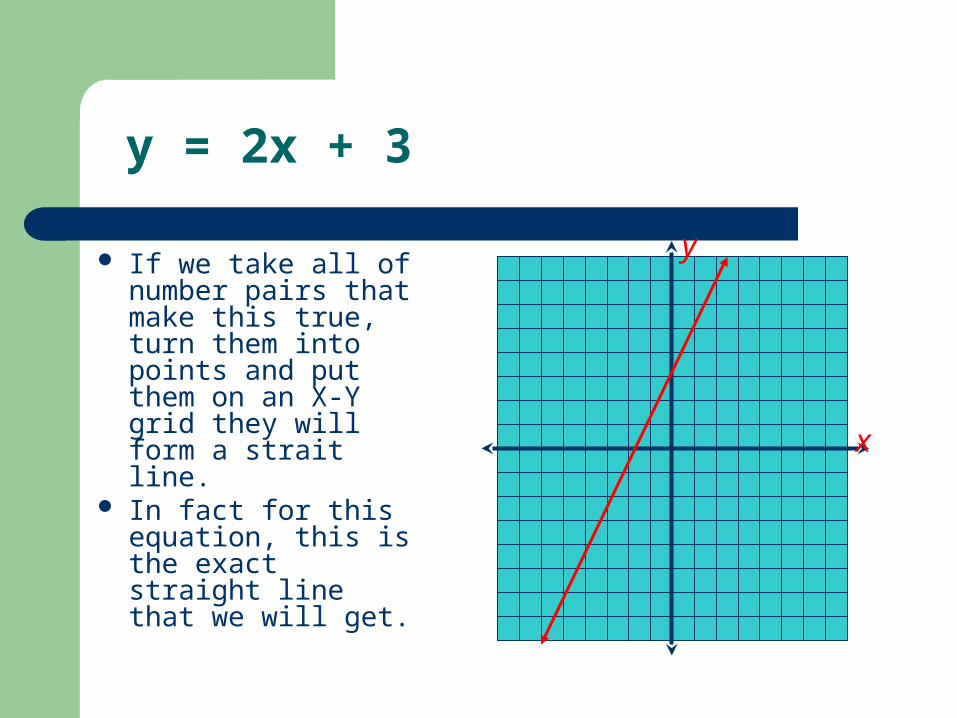
Here is an equation:y = 2x + 3The numbers that make this true are called it’s solution set. I
hope you can see that there are certain number pairs, X and Y that will make this true and certain numbers that won’t.
y = 2x + 3
If we take all of number pairs that make this true, turn them into points and put them on an X-Y grid they will form a strait line.
In fact for this equation, this is the exact straight line that we will get.
x
y

The graph has meaning!!
Mathematical graphs like this should be drawn with great care and precision because they are suppose to give information, not just look pretty.
Even without the equation present I should be able to generate the equation, and be able to read what points make that equation true and what points make it false.
x
y

For example: y = 2x + 3 continued
(0,3), (1,5) and (2,7) would each make a true statement.
Why? Because they lie
on the line.
x
y

False points for y= 2x + 3
x
y• (0,6) (3,0) (0,0) (-6,0) ( 3,3) all lead to false statements if you plug them into y = 2x + 3
• Why? Two Reasons:
• The math just works out that way.
• They are not one the line.
• If they were on the line the math would work.

What does all this have to do with inequalities?
Patience, I’m getting to that. I will try not to be so long winded, but
that means that I might not be able to fully explain WHY this works. I will just tell you HOW it works.
Inequalities block out an entire HALF of the graph.

You still have a line.
You still have a border line the is defined by the statement.
For example: y > 2x + 3 Has the same
border line as: y = 2x + 3
x
y
The big difference:
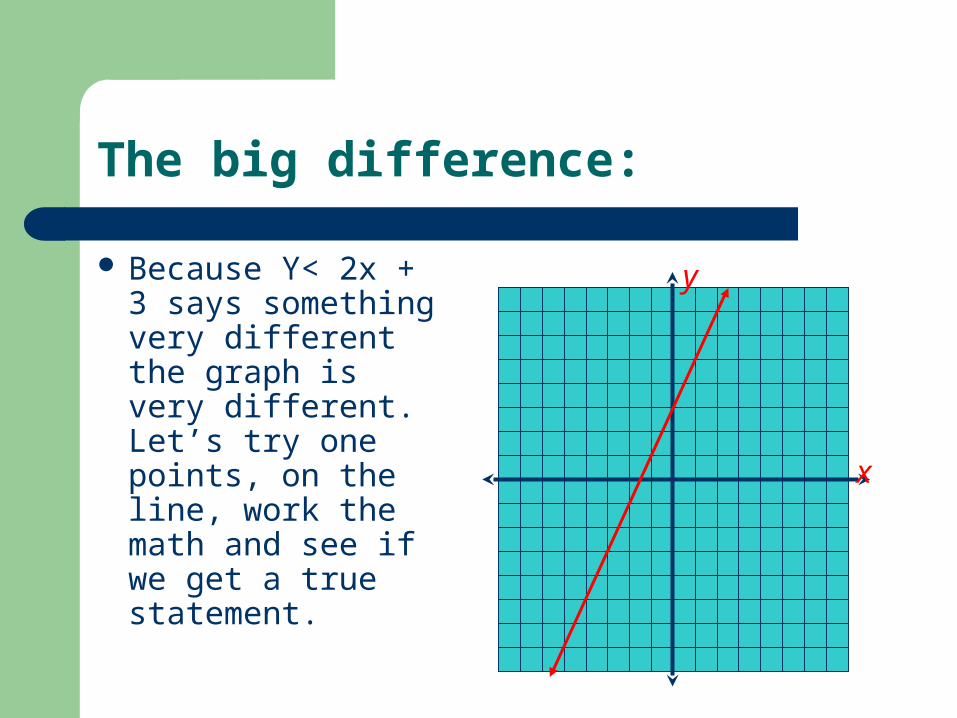
Because Y< 2x + 3 says something very different the graph is very different. Let’s try one points, on the line, work the math and see if we get a true statement.
x
y

Try (0,3)
Y< 2x + 3
3 < 2(0) + 3
3 < 3 ????
Is it?
NO. It’s clearly false, but what do we do about the drawing then?
x
y
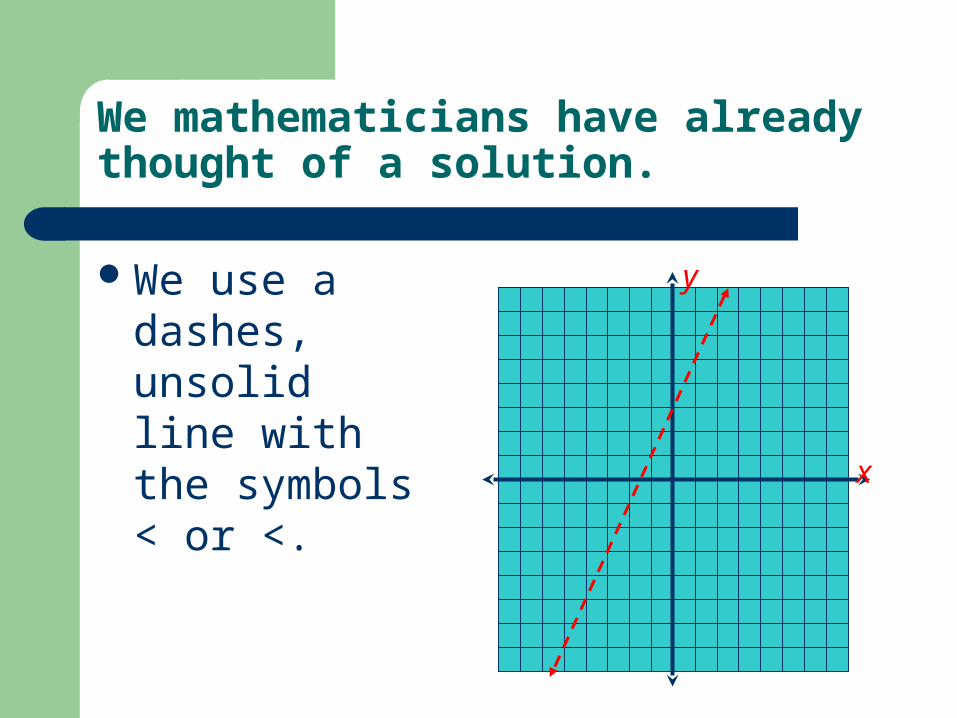
We mathematicians have already thought of a solution.
We use a dashes, unsolid line with the symbols < or <.
x
y

Try (0,3) with ≤
Y ≤ 2x + 3
3 ≤ 2(0) + 3
3 ≤ 3 ????
Is it?
YES. Now with the extra room, we get truth. So should we change the graph?
x
y

A solid line means the border is true.
We use a SOLID line as a border for ≤ or ≥
Now sorry we are not done yet.
x
y

News flash: for inequalities!!
One whole half of the points will make the inequality true.
And one whole half of the points will make it false.
In math, shading is used to indicate truth, and openness or blankness means false.

Which side do we shade?
A test point will tell us.
Y ≤ 2x + 3
(0,0)
0 ≤ 2(0) + 3
0 ≤ 3 TRUE!
Therefore the point (0,0) is on the side of truth.
x
y
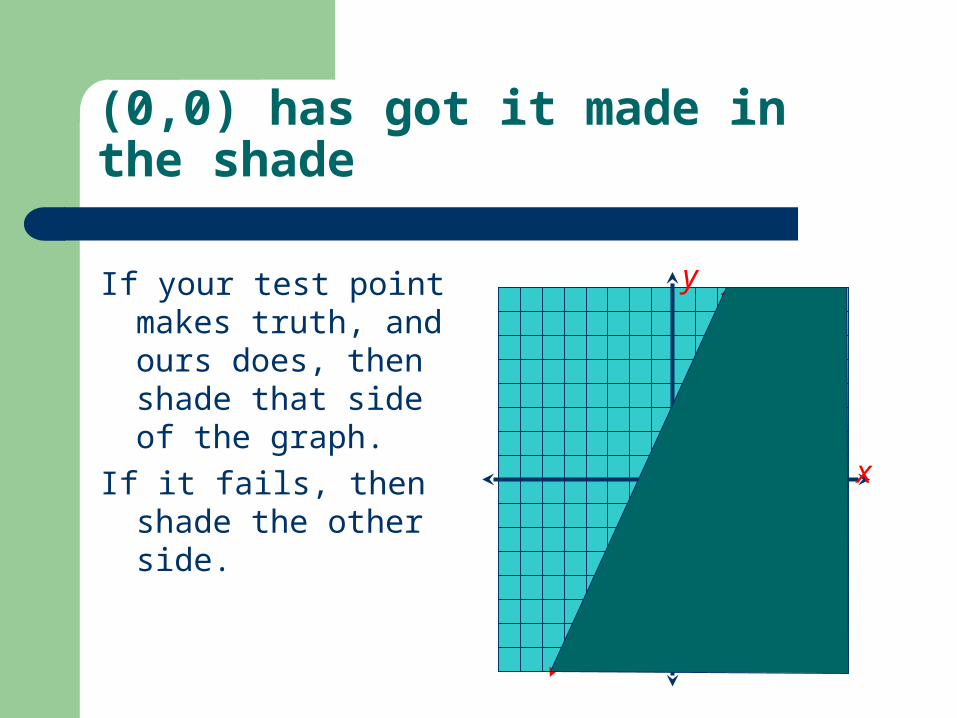
(0,0) has got it made in the shade
If your test point makes truth, and ours does, then shade that side of the graph.
If it fails, then shade the other side. x
y

Review
Use standard line plotting techniques plot points that draw the border line of the inequality.
For < or > use a dashed line. For ≥ or ≤ use a solid line. Pick a test point that is obviously on one side
of the line or another. (0,0) usually works well, unless it is actually on the border line.

Review continued
If the test point reads true:– Shade that side of the border line.
If the test point reads false:– Shade the OTHER SIDE of the border line.

Bye bye. Thanks for watching
This PowerPoint is posted on:– http://teachertube.com– http://worldofteaching.com
These videos are sponsored by:– http://whaleboneir.com
The presentation system seen in our videos is a low cost interactive whiteboard, created by using:
– A Wii Remote control– Smoothboard 2.0 software– The Sword II IR pen– An IO Gear bluetooth adapter– A laptop computer– A large HDTV or a digital projector
![Linear alegbra [Seymour lipson]](https://static.fdocuments.net/doc/165x107/557d0ffad8b42a063b8b50ae/linear-alegbra-seymour-lipson.jpg)