Copyright © 2012 Pearson Education, Inc. 2.3 Another Look at Linear Graphs ■ Graphing Horizontal...
28
Copyright © 2012 Pearson Education, Inc. 2.3 Another Look at Linear Graphs ■ Graphing Horizontal Lines and Vertical Lines ■ Graphing Using Intercepts ■ Parallel and Perpendicular Lines ■ Recognizing Linear Equations
-
Upload
allen-cameron -
Category
Documents
-
view
218 -
download
0
Transcript of Copyright © 2012 Pearson Education, Inc. 2.3 Another Look at Linear Graphs ■ Graphing Horizontal...
Copyright © 2012 Pearson Education, Inc.
2.3 Another Look at Linear
Graphs
■ Graphing Horizontal Lines and
Vertical Lines
■ Graphing Using Intercepts
■ Parallel and Perpendicular Lines
■ Recognizing Linear Equations
Slide 2- 2Copyright © 2012 Pearson Education, Inc.
Graphing Horizontal Lines and Vertical Ines
Slope of a Horizontal Line The slope of a horizontal line is 0.The graph of any function of the form f(x) = b or y = b is a horizontal line that crosses the y-axis as (0, b).
Slide 2- 3Copyright © 2012 Pearson Education, Inc.
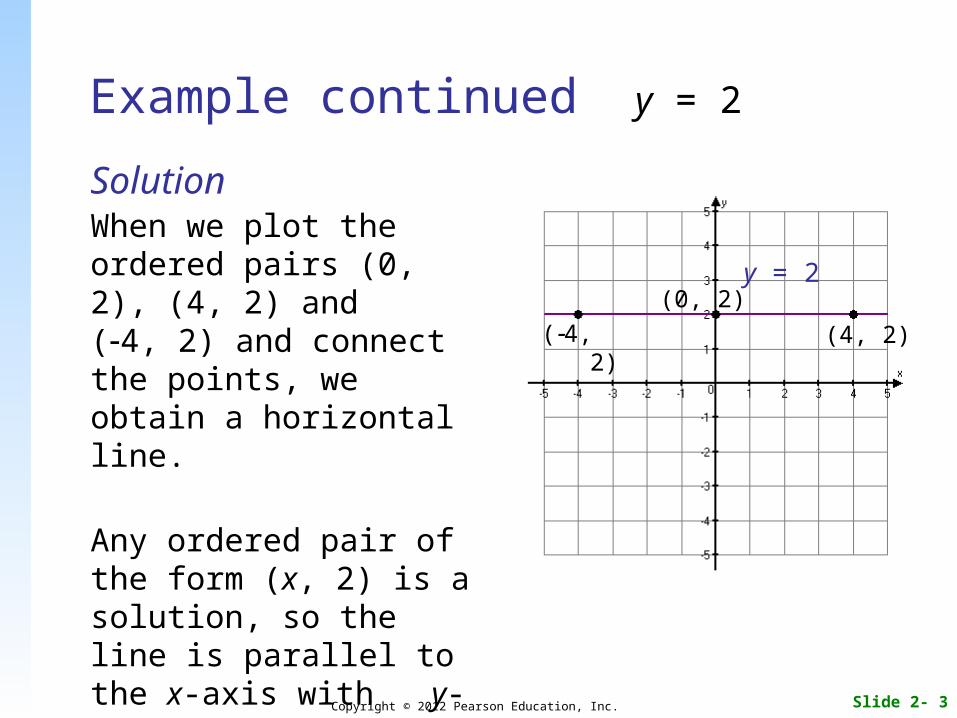
Example continued y = 2
SolutionWhen we plot the ordered pairs (0, 2), (4, 2) and (4, 2) and connect the points, we obtain a horizontal line.
Any ordered pair of the form (x, 2) is a solution, so the line is parallel to the x-axis with y-intercept (0, 2).
y = 2
(4, 2)
(0, 2)
(4, 2)
Slide 2- 4Copyright © 2012 Pearson Education, Inc.
Slope of a Vertical Line The slope of a vertical line is undefined.
Slide 2- 5Copyright © 2012 Pearson Education, Inc.
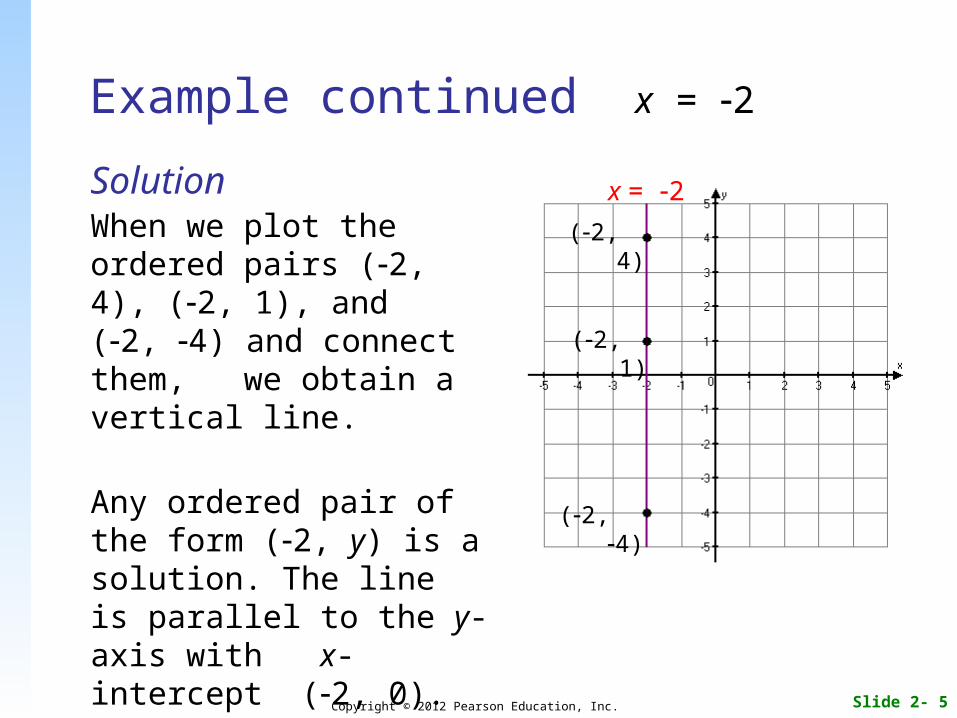
Example continued x = 2
SolutionWhen we plot the ordered pairs (2, 4), (2, 1), and (2, 4) and connect them, we obtain a vertical line.
Any ordered pair of the form (2, y) is a solution. The line is parallel to the y-axis with x-intercept (2, 0).
x = 2
(2, 4)
(2, 4)
(2, 1)
Slide 2- 6Copyright © 2012 Pearson Education, Inc.
Slope of a Vertical Line The slope of a vertical line is undefined.The graph of any equation of the form (x) = a is a vertical line that crosses the x-axis as (a, 0).
Slide 2- 7Copyright © 2012 Pearson Education, Inc.
Graphing Using Intercepts
The point at which the graph crosses the y-axis is called the y-intercept. The x-coordinate of a y-intercept is always 0.
The point at which the graph crosses the x-axis is called the x-intercept. The y-coordinate of a x-intercept is always 0.
Slide 2- 8Copyright © 2012 Pearson Education, Inc.
To Determine Intercepts The x-intercept is (a, 0). To find a, let y = 0 and solve the original equation for x. The y-intercept is (0, b). To find b, let x = 0 and solve the original equation for y.
Slide 2- 9Copyright © 2012 Pearson Education, Inc.
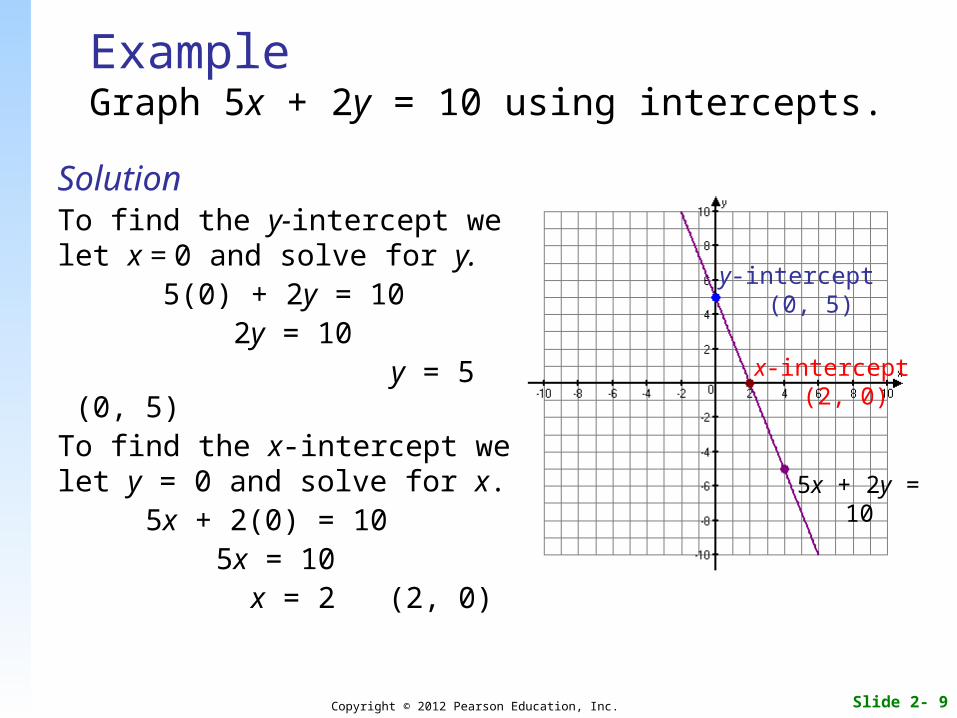
ExampleGraph 5x + 2y = 10 using intercepts.
SolutionTo find the y-intercept we let x = 0 and solve for y. 5(0) + 2y = 10
2y = 10 y = 5 (0, 5)To find the x-intercept we let y = 0 and solve for x. 5x + 2(0) = 10
5x = 10 x = 2 (2, 0)
5x + 2y = 10
x-intercept (2, 0)
y-intercept (0, 5)
Slide 2- 10Copyright © 2012 Pearson Education, Inc.
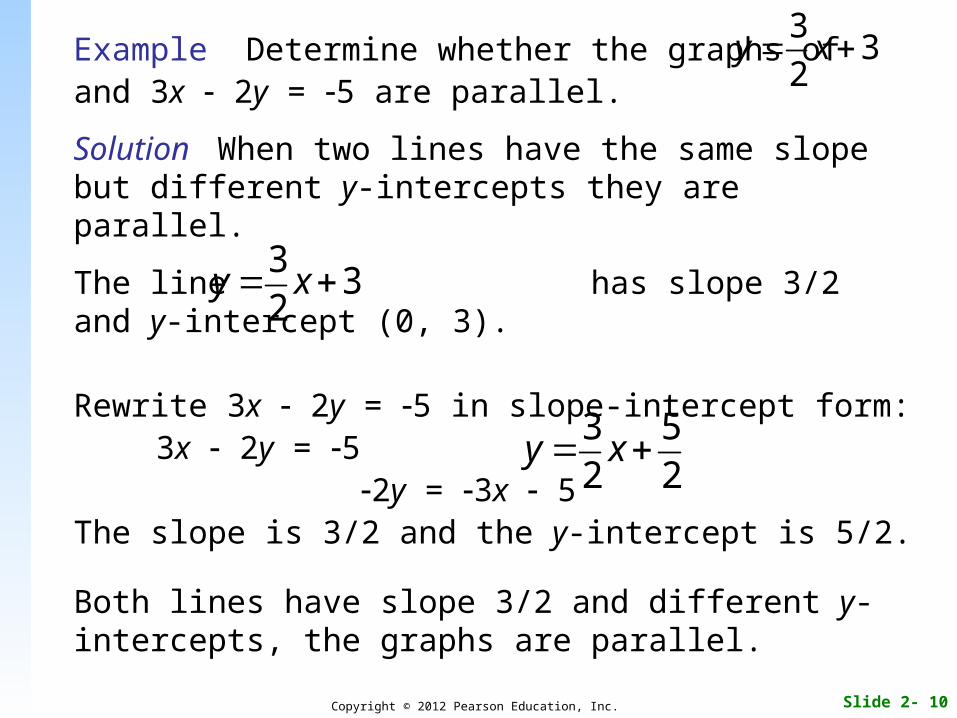
Example Determine whether the graphs of and 3x 2y = 5 are parallel.
Solution When two lines have the same slope but different y-intercepts they are parallel.
The line has slope 3/2 and y-intercept (0, 3).
Rewrite 3x 2y = 5 in slope-intercept form:3x 2y = 5
2y = 3x 5The slope is 3/2 and the y-intercept is 5/2.
Both lines have slope 3/2 and different y-intercepts, the graphs are parallel.
33
2y x
33
2y x
3 52 2
y x
Slide 2- 11Copyright © 2012 Pearson Education, Inc.
Slope and Perpendicular LinesTwo lines are perpendicular if the product of their slopes is 1 or if one line is vertical and the other is horizontal.
Slide 2- 12Copyright © 2012 Pearson Education, Inc.
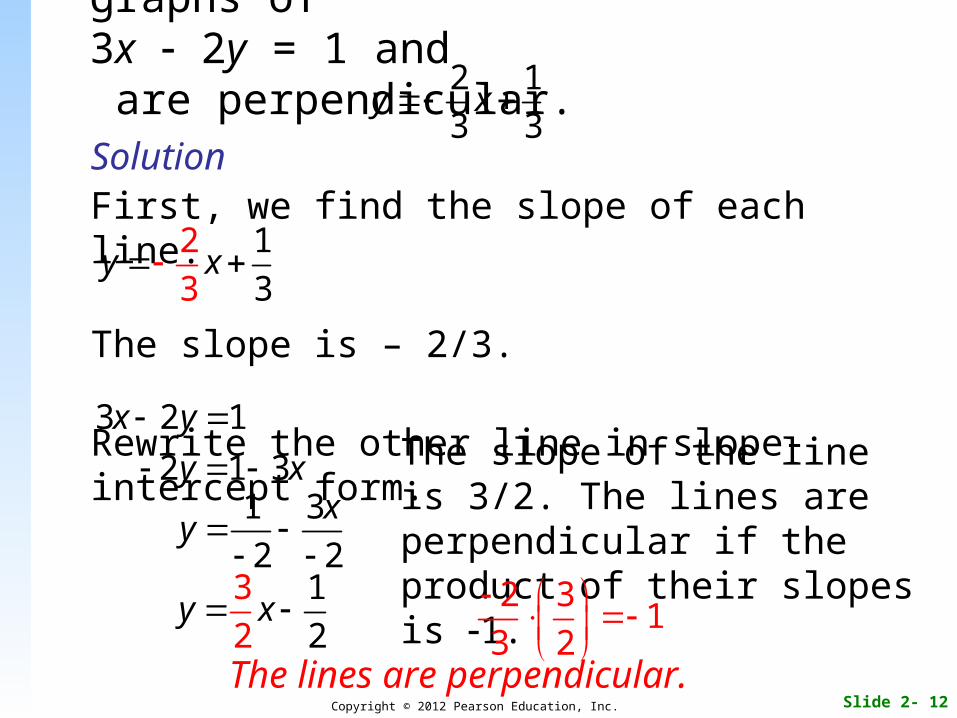
Example Determine whether the graphs of 3x 2y = 1 and are perpendicular.Solution First, we find the slope of each line. The slope is – 2/3.
Rewrite the other line in slope-intercept form.
2 1
3 3y x
2
3
1
3y x
3 2 1x y 2 1 3y x
1 3
2 2
xy
1
2
3
2y x
The slope of the line is 3/2. The lines are perpendicular if the product of their slopes is 1.
2 31
3 2
The lines are perpendicular.
Slide 2- 13Copyright © 2012 Pearson Education, Inc.
Recognizing Linear Equations
A linear equation may appear in different forms, but all linear equations can be written in standard form Ax + By = C.
Slide 2- 14Copyright © 2012 Pearson Education, Inc.
Example
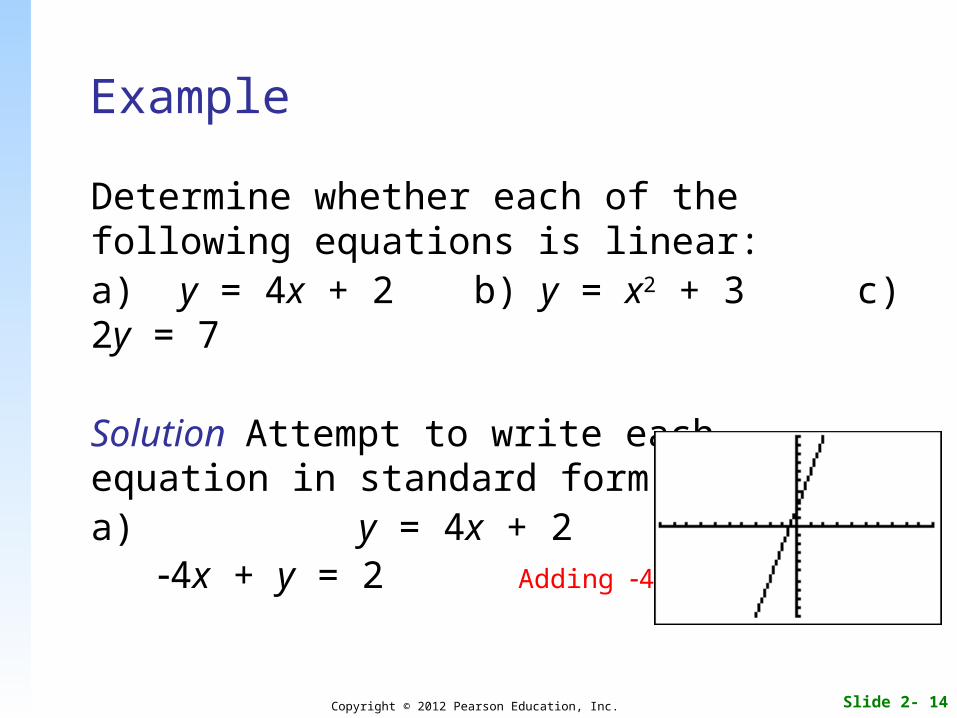
Determine whether each of the following equations is linear: a) y = 4x + 2 b) y = x2 + 3 c) 2y = 7
Solution Attempt to write each equation in standard form. a) y = 4x + 2 4x + y = 2 Adding 4x to both sides
Slide 2- 15Copyright © 2012 Pearson Education, Inc.
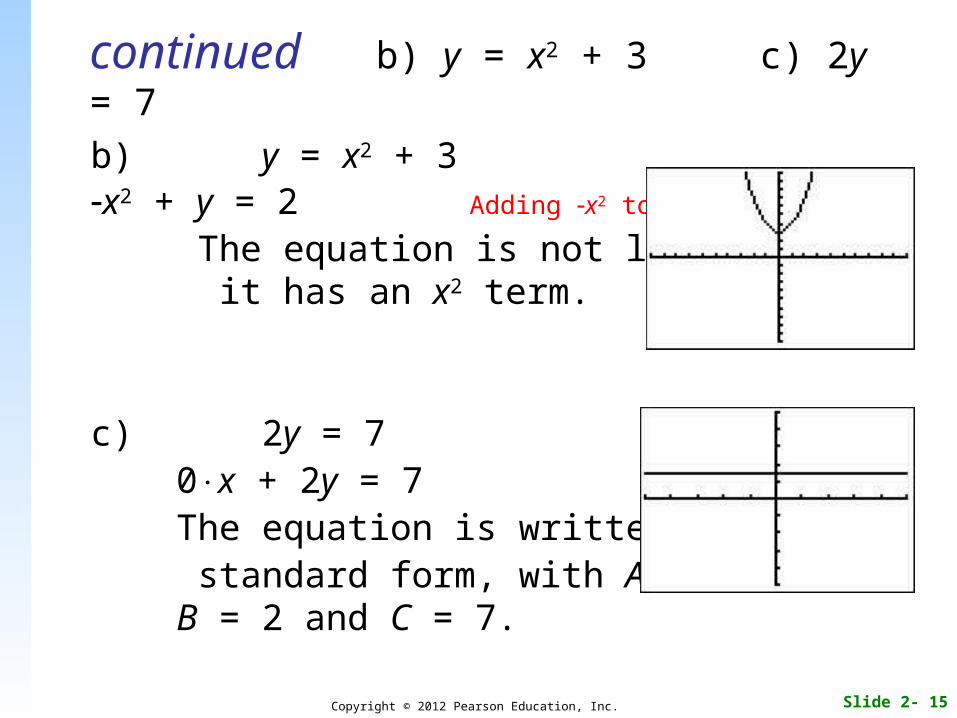
continued b) y = x2 + 3 c) 2y = 7
b) y = x2 + 3x2 + y = 2 Adding x2 to both sides
The equation is not linear since it has an x2 term.
c) 2y = 7 0x + 2y = 7 The equation is written in standard form, with A = 0, B = 2 and C = 7.
Copyright © 2012 Pearson Education, Inc.
2.4 Introduction to Curve Fitting:
Point-Slope Form
■ Point-Slope Form
■ Interpolation and Extrapolation
■ Curve Fitting
■ Linear Regression
Slide 2- 17Copyright © 2012 Pearson Education, Inc.
Point-Slope FormAny equation is said to be written in point-slope form and has a graph that is a straight line.The slope of the line is m. The line passes through (x1,y1).
1 1( )y y m x x
Slide 2- 18Copyright © 2012 Pearson Education, Inc.
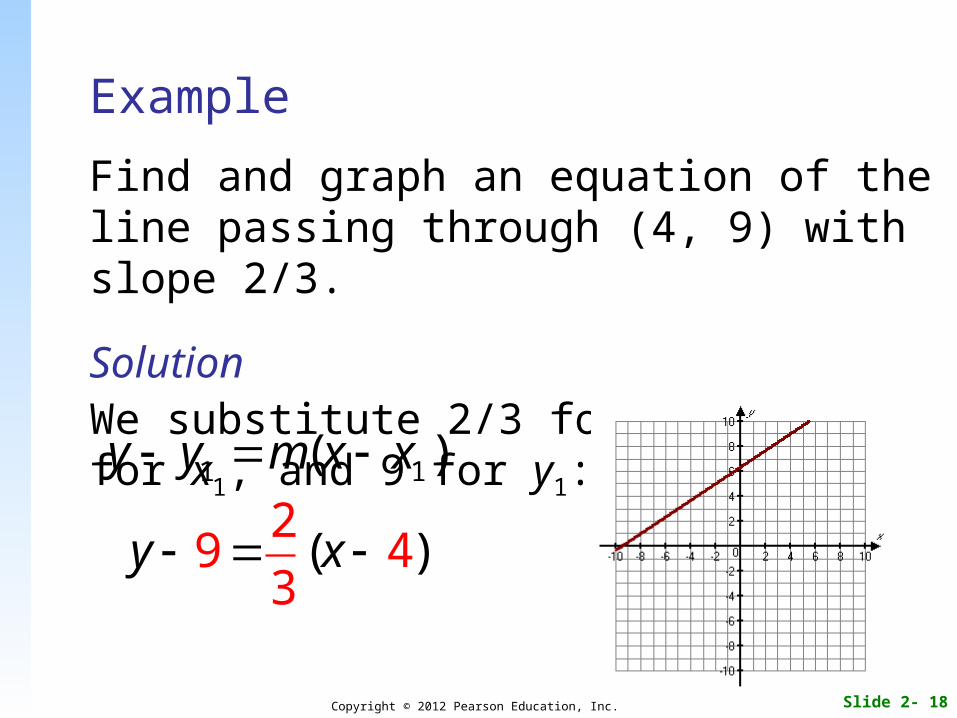
Example
Find and graph an equation of the line passing through (4, 9) with slope 2/3.
SolutionWe substitute 2/3 for m, and 4 for x1, and 9 for y1:
1 1( )y y m x x 2
9 43
( )y x
Slide 2- 19Copyright © 2012 Pearson Education, Inc.
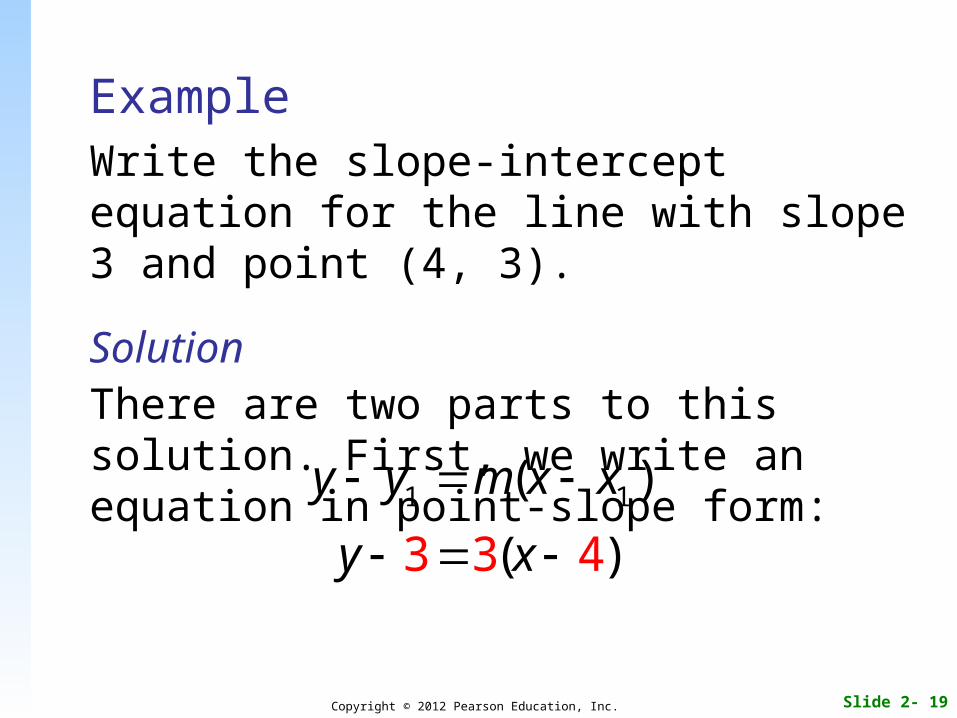
ExampleWrite the slope-intercept equation for the line with slope 3 and point (4, 3).
SolutionThere are two parts to this solution. First, we write an equation in point-slope form:
1 1( )y y m x x
(3 4)3y x
Slide 2- 20Copyright © 2012 Pearson Education, Inc.
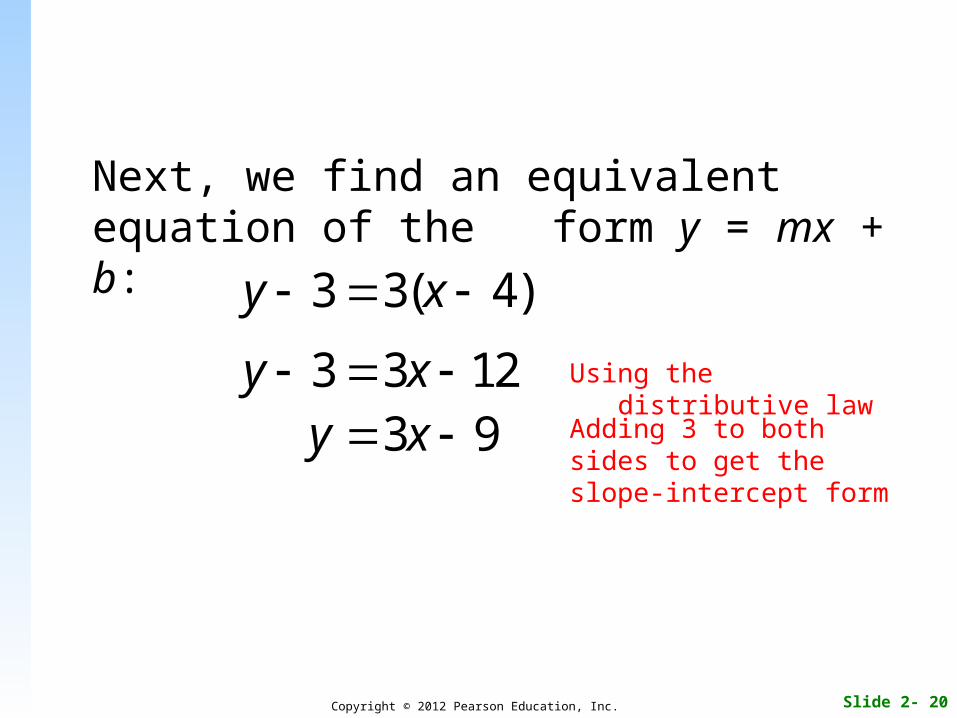
Next, we find an equivalent equation of the form y = mx + b:
3 3( 4)y x
3 3 12y x 3 9y x
Using the distributive law
Adding 3 to both sides to get the slope-intercept form
Slide 2- 21Copyright © 2012 Pearson Education, Inc.
Interpolation and Extrapolation
It is possible to use line graphs to estimate real-life quantities that are not already known. To do so, we calculate the coordinates of an unknown point by using two points with known coordinates. When the unknown point is located between the two points, this process is called interpolation. Sometimes a graph passing through the known points is extended to predict future values. Making predictions in this manner is called extrapolation.
Slide 2- 22Copyright © 2012 Pearson Education, Inc.
Example
Aerobic exercise. A person’s target heart rate is the number of beats per minute that bring the most aerobic benefit to his or her heart. The target heart rate for a 20-year-old is 150 beats per minute and for a 60-year-old, 120 beats per minute.
a) Graph the given data and calculate the target heart rate for a 46-year-old.
b) Calculate the target heart rate for a 70-year-old.
Slide 2- 23Copyright © 2012 Pearson Education, Inc.
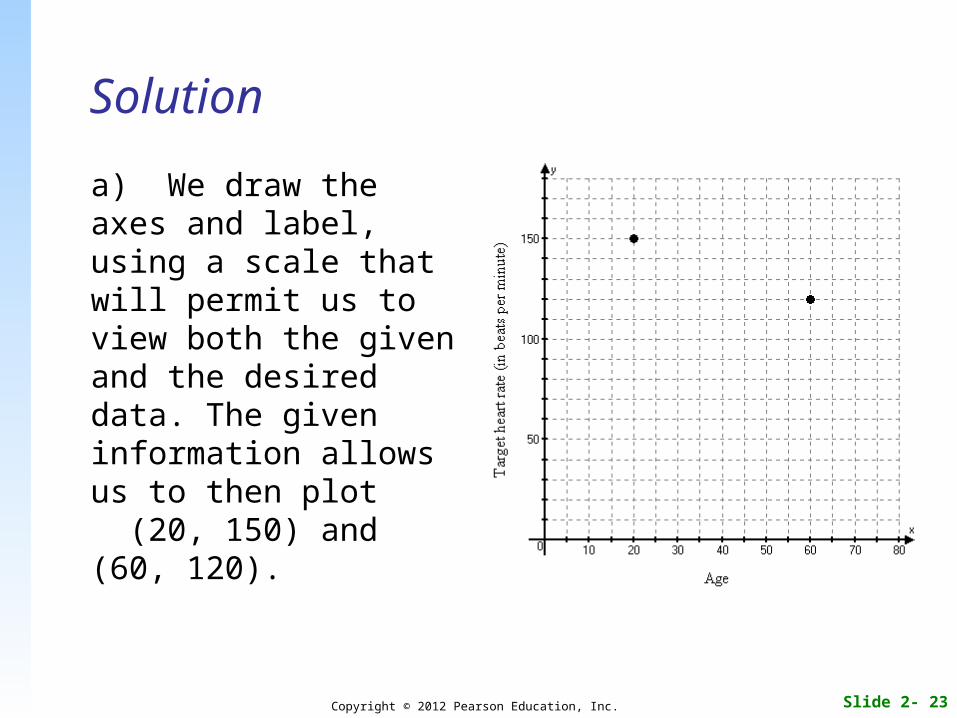
Solution
a) We draw the axes and label, using a scale that will permit us to view both the given and the desired data. The given information allows us to then plot (20, 150) and (60, 120).
Slide 2- 24Copyright © 2012 Pearson Education, Inc.
Solution continued
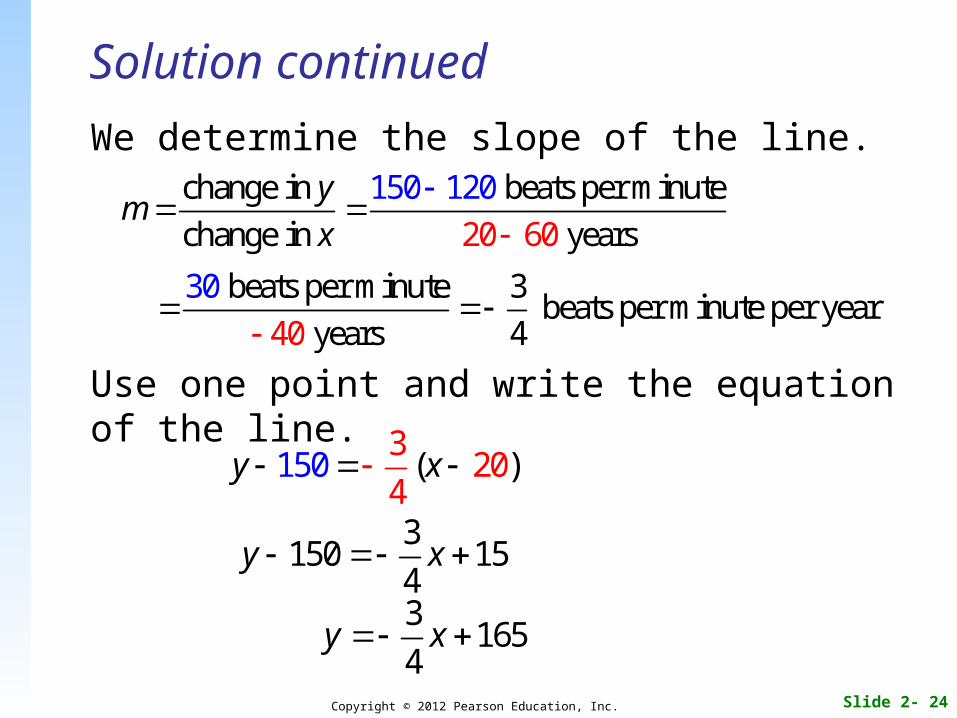
We determine the slope of the line.
Use one point and write the equation of the line.
150 12change in beats per minute
ch
0
ange in years20 60
ym
x
beats per minute 3 beats per minute per year
years 4
3
40
0
320
4(5 )1 0y x
3150 15
4y x
3165
4y x

Slide 2- 25Copyright © 2012 Pearson Education, Inc.
Solution continued
a) To calculate the target heart rate for a 46-year-old, we substitute 46 for x in the slope-intercept equation:
The graph confirms the target heart rate.
3( ) 165
434.
46
15 30.65 51
y
Slide 2- 26Copyright © 2012 Pearson Education, Inc.
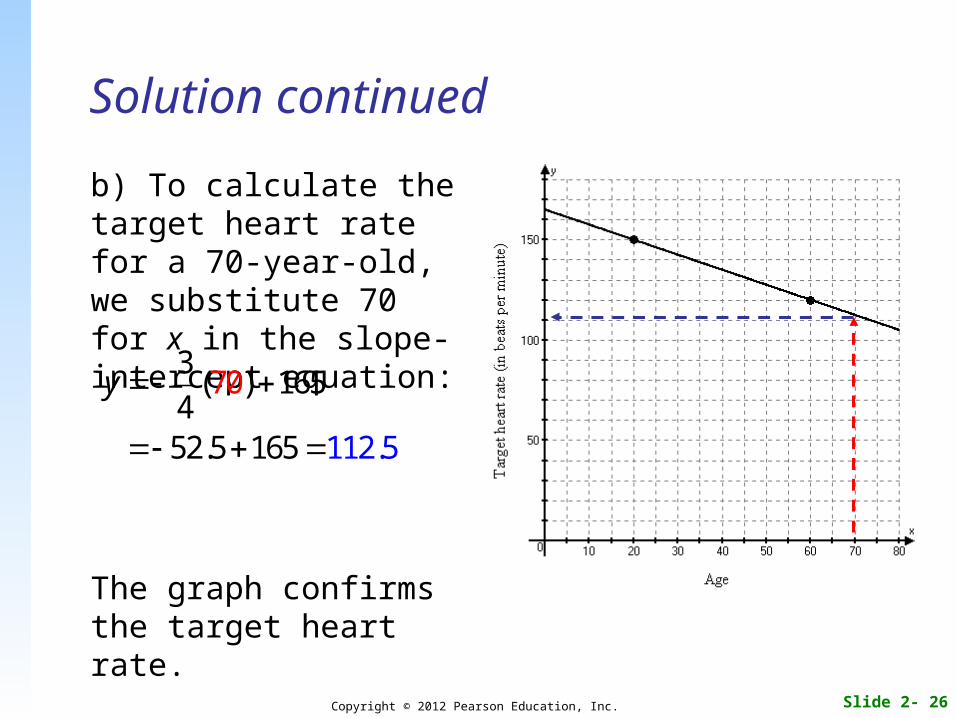
Solution continued
b) To calculate the target heart rate for a 70-year-old, we substitute 70 for x in the slope-intercept equation:
The graph confirms the target heart rate.
3( ) 165
452.
70
15 12.65 51
y
Slide 2- 27Copyright © 2012 Pearson Education, Inc.
Curve Fitting
The process of understanding and interpreting data, or lists of information, is called data analysis.
One helpful tool in data analysis is curve fitting, or finding an algebraic equation that describes the data.
Slide 2- 28Copyright © 2012 Pearson Education, Inc.
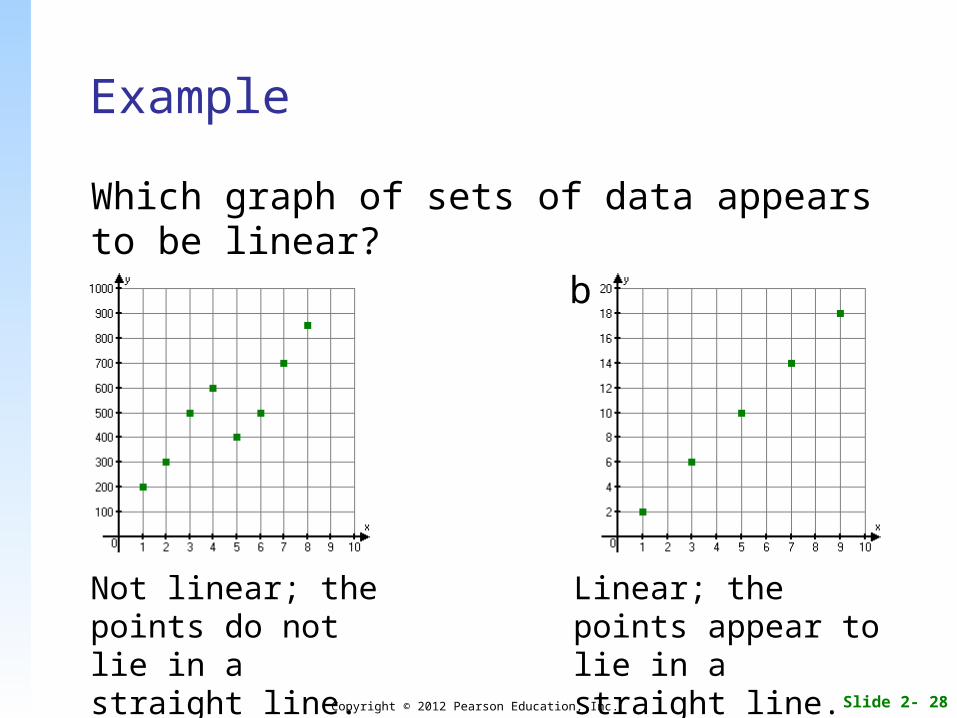
Example
Which graph of sets of data appears to be linear?a. b.
Not linear; the points do not lie in a straight line.
Linear; the points appear to lie in a straight line.