The Integration of Space Born and Ground Remotely Sensed Data in Exploring the Environmental...
15
The integration of space born and ground remotely sensed data in exploring the environmental stresses and deterioration in Ras-Gharib area, Gulf of Suez, Egypt Mohamed Nagib Hegazy and Hala Effat National Authority for Remote Sensing and Space Sciences, 23 Joseph Tito st. El Nuzha El Gedida,P.O. Box 1564 Alf Maskan, Cairo, Egypt E-mail: [email protected] [email protected] Abstract: Different remotely sensed techniques were used in an integrated way for studying the factors affecting the deterioration of the environmental parameters for area subjected to different natural and man made stresses. These remotely sensed data include: satellite data of Landsat Enhanced Thematic Mapper (ETM+), Space Shuttle data of Shuttle Radar Topography Mission (SRTM), and data from ground subsurface geo-electrical investigation. This study was applied on a coastal area that includes oil exploration and production activities.Throuout the years the area was subjected to different environmental stresses that led to environmental deterioration of its physical and biological parameters. The satellite imageries were used to identify changes happened in the land cover and land-use classes including change in the size of water bodies, sabkhas, vegetation cover disappear and crude oil leakage as a point contamination source. The SRTM data was used to build the DEM and the terrain characteristics for the area including surface topographic properties and surface water and contamination regime. Based on the findings of a geo-electric survey (using Schlumberger Geo-electric Sounding) the ground surface water level was measured and the presence of fresh, brackish or salt water was identified. A field investigation was conducted and the surface and ground water contaminations was monitored and measured. Air pollutions and noise was also measured and identified. All these different environmental parameters as a result of the oil industry were identified and hot spots that subjected to environmental deterioration were pointed out for immediate environmental actions and measures. Geographic Information System (GIS) was used to include all these data layers as an active database for the area for the purpose of identifying hot spots and prioritizing locations based on their environmental con ditions as well as for monitoring plans. Key words: Landsat ETM+, SRTM, land cover, terrain characteristics, surface water regime, geo- electrical investigation, GIS, Ras-Ghareb, Egypt
-
Upload
sabrianto-aswad -
Category
Documents
-
view
218 -
download
0
Transcript of The Integration of Space Born and Ground Remotely Sensed Data in Exploring the Environmental...

8/12/2019 The Integration of Space Born and Ground Remotely Sensed Data in Exploring the Environmental Stresses and De…
http://slidepdf.com/reader/full/the-integration-of-space-born-and-ground-remotely-sensed-data-in-exploring 1/15
The integration of space born and ground remotely sensed data in
exploring the environmental stresses and deterioration in Ras-Gharib
area, Gulf of Suez, Egypt
Mohamed Nagib Hegazy and Hala Effat
National Authority for Remote Sensing and Space Sciences, 23 Joseph Tito st. El Nuzha El Gedida,P.O. Box 1564 Alf Maskan, Cairo, Egypt
E-mail: [email protected]
Abstract:
Different remotely sensed techniques were used in an integrated way for studying the
factors affecting the deterioration of the environmental parameters for area subjected to
different natural and man made stresses. These remotely sensed data include: satellitedata of Landsat Enhanced Thematic Mapper (ETM+), Space Shuttle data of Shuttle
Radar Topography Mission (SRTM), and data from ground subsurface geo-electrical
investigation. This study was applied on a coastal area that includes oil exploration and production activities.Throuout the years the area was subjected to different environmental
stresses that led to environmental deterioration of its physical and biological parameters.
The satellite imageries were used to identify changes happened in the land cover and
land-use classes including change in the size of water bodies, sabkhas, vegetation cover
disappear and crude oil leakage as a point contamination source.
The SRTM data was used to build the DEM and the terrain characteristics for the areaincluding surface topographic properties and surface water and contamination regime.
Based on the findings of a geo-electric survey (using Schlumberger Geo-electricSounding) the ground surface water level was measured and the presence of fresh,
brackish or salt water was identified.
A field investigation was conducted and the surface and ground water contaminationswas monitored and measured. Air pollutions and noise was also measured and identified.
All these different environmental parameters as a result of the oil industry were identified
and hot spots that subjected to environmental deterioration were pointed out for
immediate environmental actions and measures.Geographic Information System (GIS) was used to include all these data layers as an
active database for the area for the purpose of identifying hot spots and prioritizing
locations based on their environmental conditions as well as for monitoring plans.
Key words:
Landsat ETM+, SRTM, land cover, terrain characteristics, surface water regime, geo-electrical investigation, GIS, Ras-Ghareb, Egypt
8/12/2019 The Integration of Space Born and Ground Remotely Sensed Data in Exploring the Environmental Stresses and De…
http://slidepdf.com/reader/full/the-integration-of-space-born-and-ground-remotely-sensed-data-in-exploring 2/15
1. Assessment Methodology
1.1 Approach
1.1.1 Remote SensingSatellite images were obtained and analyzed to get acquainted with the drainage
basins, flood routes and general ecology of the area.
Two different types of remotely sensed data were used for the production of the
physical environment baseline maps:
- A Shuttle Radar Topography Mission Scene (SRTM) of a resolution of 3
Arc. Second was used to produce all the terrain characteristics maps.- Two Landsat Scenes were used to conduct this study. The first is a TM
image acquired on 1984 while the second is an ETM+ acquired on 2000.
Data processing was carried out using two powerful wide-spread software:
- ERDAS IMAGINE Version 8.7 for remotely sensed data processing.- ARC/GIS Version 9.0 for Geographic Information Systems.
Using different satellite data, field studies, measurements and verifications,different thematic maps for the physical environment baseline were produced.
1.1.2 Geophysical Survey
The geophysical survey comprised electrical exploration of the geological and
hydrogeological features of the area. The survey dealt with the electrical state ofthe earth and provided conclusions concerning the electrical properties of rocks
and minerals under different geological environments, as well as their influencesupon various geological phenomena.
The resistivity method was carried out using Schlumberger configuration (verticalelectrical sounding) to detect the subsurface geologic sections and to determine
the thickness of the different lithologic layers through the subsurface sections. In
this method, an electric current (a direct or very low frequency alternatingcurrent) is introduced into the ground by two or more electrodes and the potential
difference is measured between two points (probes) suitably chosen with respect
to the current electrodes. The potential difference for a unit current sent through
the ground is a measure of electrical resistance of the ground between the probes(Battacharya and Patra, 1968).
More details about the application of the method and interpretation of data are presented in Annex 2.
1.1.3 Surface Water Sampling
Six locations were identified in the exposed surface waters and salt marshes of
Area "A". Samples were collected for laboratory analysis. The objective of the
sampling exercise was to acquire quantifiable characterization of the surface
8/12/2019 The Integration of Space Born and Ground Remotely Sensed Data in Exploring the Environmental Stresses and De…
http://slidepdf.com/reader/full/the-integration-of-space-born-and-ground-remotely-sensed-data-in-exploring 3/15
water quality and to assess the impacts, in relation to Area "A" operations.
Grab samples were collected from the six locations on 17th
of April and were
transported to laboratory on the same day for analysis. The samples wereanalyzed for chemical parameters (COD, TDS, TKN, oil and grease, H2S, heavy
metals, TOC, and BTEX).
1.1.4 Groundwater and Soil Sampling
Groundwater level and flow characteristics were assessed by the geophysical
survey as mentioned in Section 2.1.4. According to the basins of the area, slopesand aspect, 15 locations were identified for drilling groundwater monitoring
wells. These 15 locations were selected to detect the fate of spills resulting fromthe activities at the four oil fields.
Four other locations were identified for drilling boreholes and collecting soil
samples. The objectives of the boreholes were to identify the depth of soil
impacted by oil spills from storage tanks in block stations. Furthermore, four
other locations were selected for excavating trial pits in order to take shallow soilsamples from certain areas.
2. Description of the Environment
2.1 Geology and Hydrogeology
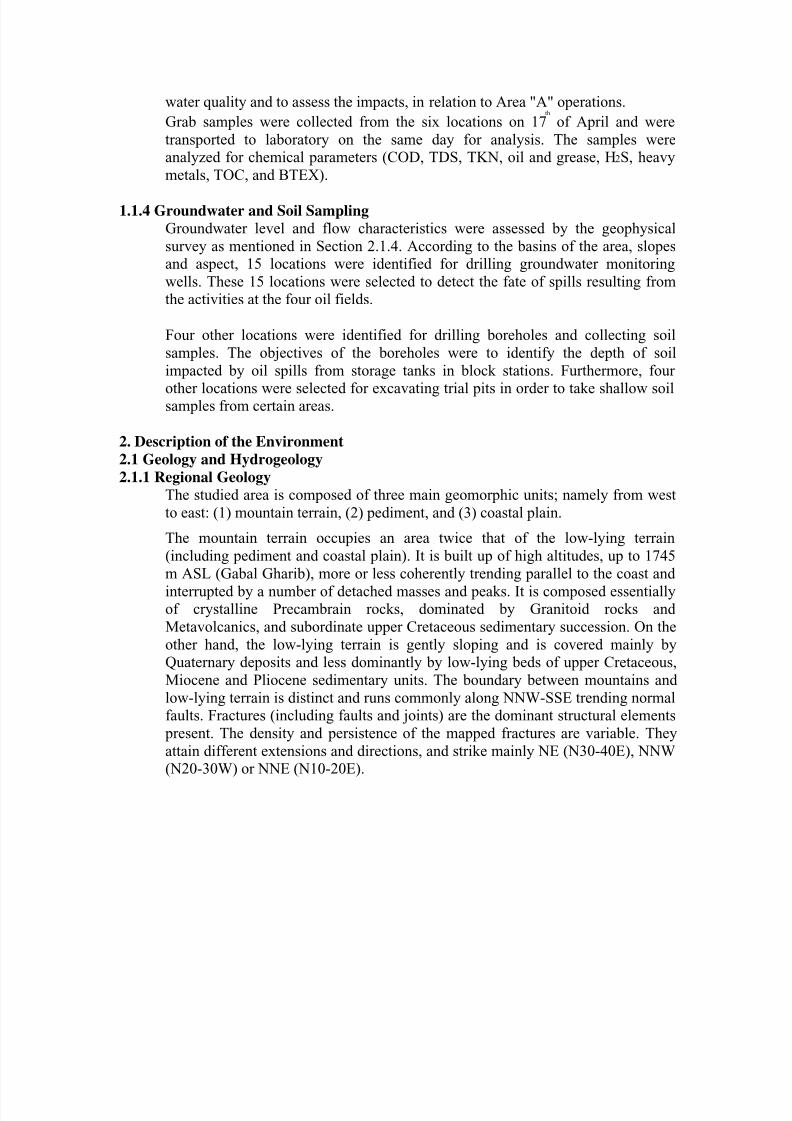
2.1.1 Regional Geology
The studied area is composed of three main geomorphic units; namely from west
to east: (1) mountain terrain, (2) pediment, and (3) coastal plain.
The mountain terrain occupies an area twice that of the low-lying terrain
(including pediment and coastal plain). It is built up of high altitudes, up to 1745
m ASL (Gabal Gharib), more or less coherently trending parallel to the coast and
interrupted by a number of detached masses and peaks. It is composed essentiallyof crystalline Precambrain rocks, dominated by Granitoid rocks and
Metavolcanics, and subordinate upper Cretaceous sedimentary succession. On the
other hand, the low-lying terrain is gently sloping and is covered mainly byQuaternary deposits and less dominantly by low-lying beds of upper Cretaceous,
Miocene and Pliocene sedimentary units. The boundary between mountains and
low-lying terrain is distinct and runs commonly along NNW-SSE trending normalfaults. Fractures (including faults and joints) are the dominant structural elements
present. The density and persistence of the mapped fractures are variable. They
attain different extensions and directions, and strike mainly NE (N30-40E), NNW(N20-30W) or NNE (N10-20E).
8/12/2019 The Integration of Space Born and Ground Remotely Sensed Data in Exploring the Environmental Stresses and De…
http://slidepdf.com/reader/full/the-integration-of-space-born-and-ground-remotely-sensed-data-in-exploring 4/15
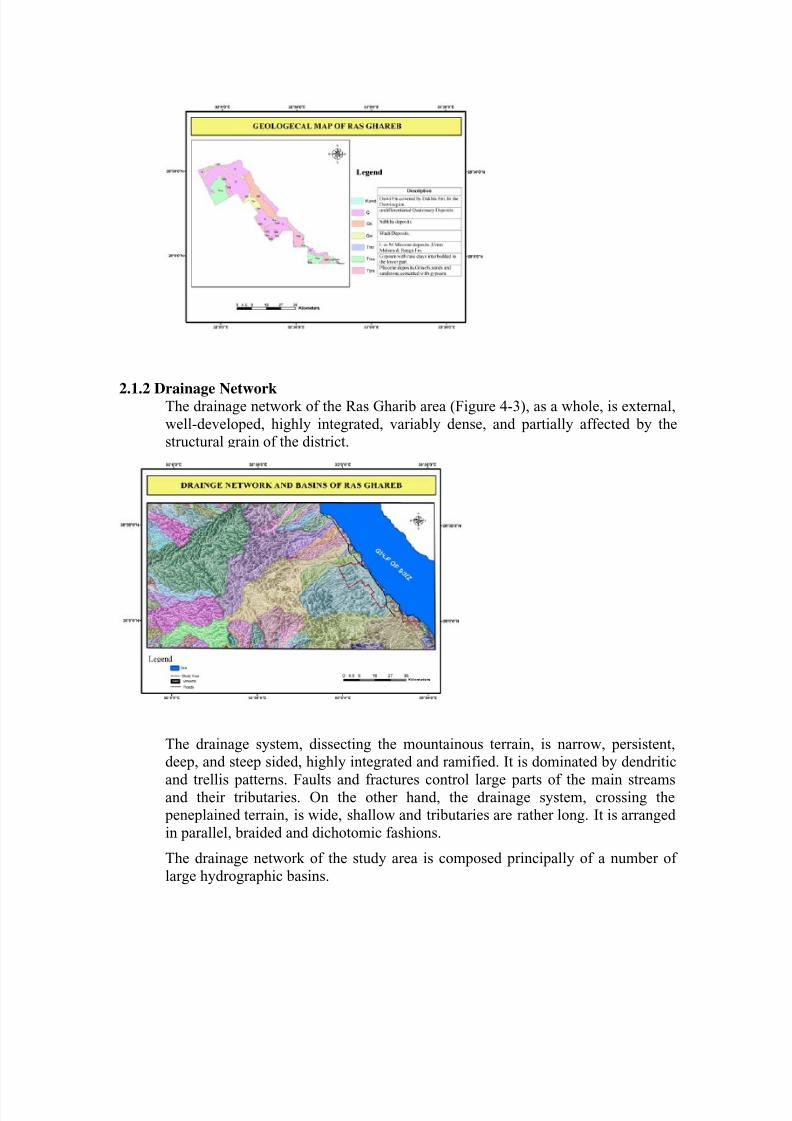
2.1.2 Drainage NetworkThe drainage network of the Ras Gharib area (Figure 4-3), as a whole, is external,
well-developed, highly integrated, variably dense, and partially affected by thestructural grain of the district.
The drainage system, dissecting the mountainous terrain, is narrow, persistent,deep, and steep sided, highly integrated and ramified. It is dominated by dendritic
and trellis patterns. Faults and fractures control large parts of the main streamsand their tributaries. On the other hand, the drainage system, crossing the peneplained terrain, is wide, shallow and tributaries are rather long. It is arranged
in parallel, braided and dichotomic fashions.
The drainage network of the study area is composed principally of a number of
large hydrographic basins.
8/12/2019 The Integration of Space Born and Ground Remotely Sensed Data in Exploring the Environmental Stresses and De…
http://slidepdf.com/reader/full/the-integration-of-space-born-and-ground-remotely-sensed-data-in-exploring 5/15
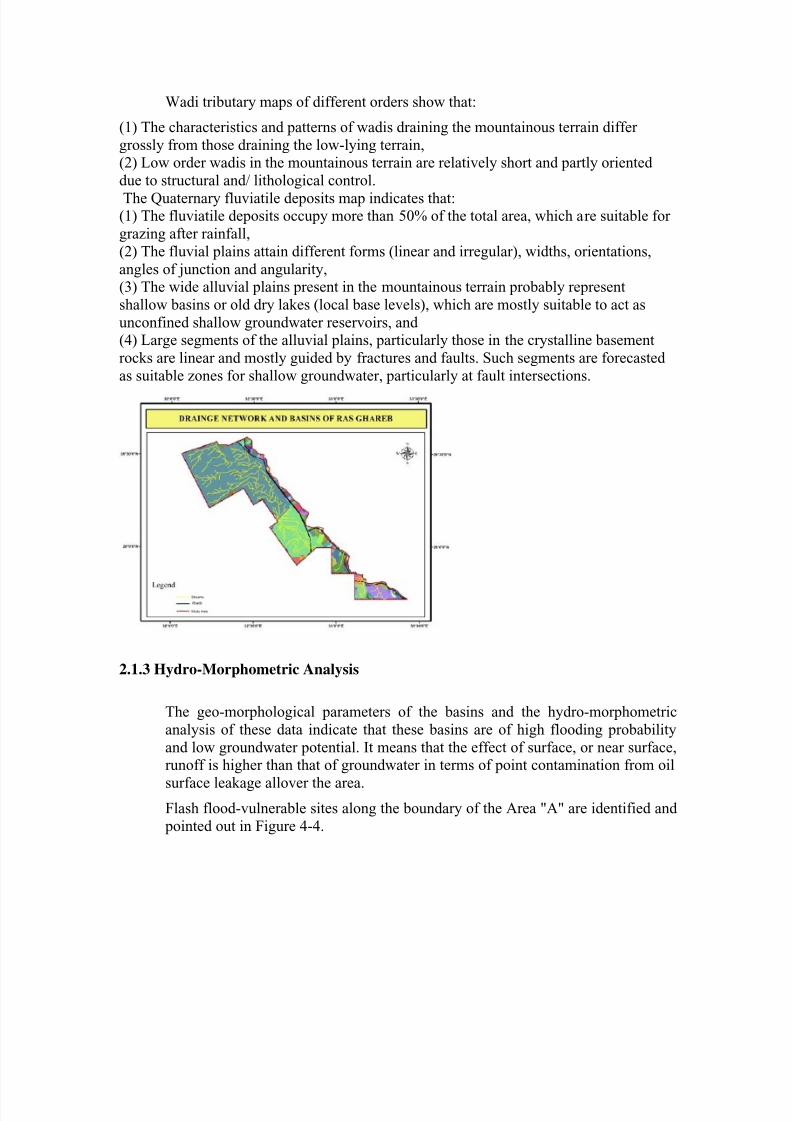
Wadi tributary maps of different orders show that:
(1) The characteristics and patterns of wadis draining the mountainous terrain differ
grossly from those draining the low-lying terrain,(2) Low order wadis in the mountainous terrain are relatively short and partly oriented
due to structural and/ lithological control.
The Quaternary fluviatile deposits map indicates that:(1) The fluviatile deposits occupy more than 50% of the total area, which are suitable for
grazing after rainfall,
(2) The fluvial plains attain different forms (linear and irregular), widths, orientations,
angles of junction and angularity,(3) The wide alluvial plains present in the mountainous terrain probably represent
shallow basins or old dry lakes (local base levels), which are mostly suitable to act as
unconfined shallow groundwater reservoirs, and(4) Large segments of the alluvial plains, particularly those in the crystalline basement
rocks are linear and mostly guided by fractures and faults. Such segments are forecasted
as suitable zones for shallow groundwater, particularly at fault intersections.
2.1.3 Hydro-Morphometric Analysis
The geo-morphological parameters of the basins and the hydro-morphometric
analysis of these data indicate that these basins are of high flooding probability
and low groundwater potential. It means that the effect of surface, or near surface,runoff is higher than that of groundwater in terms of point contamination from oil
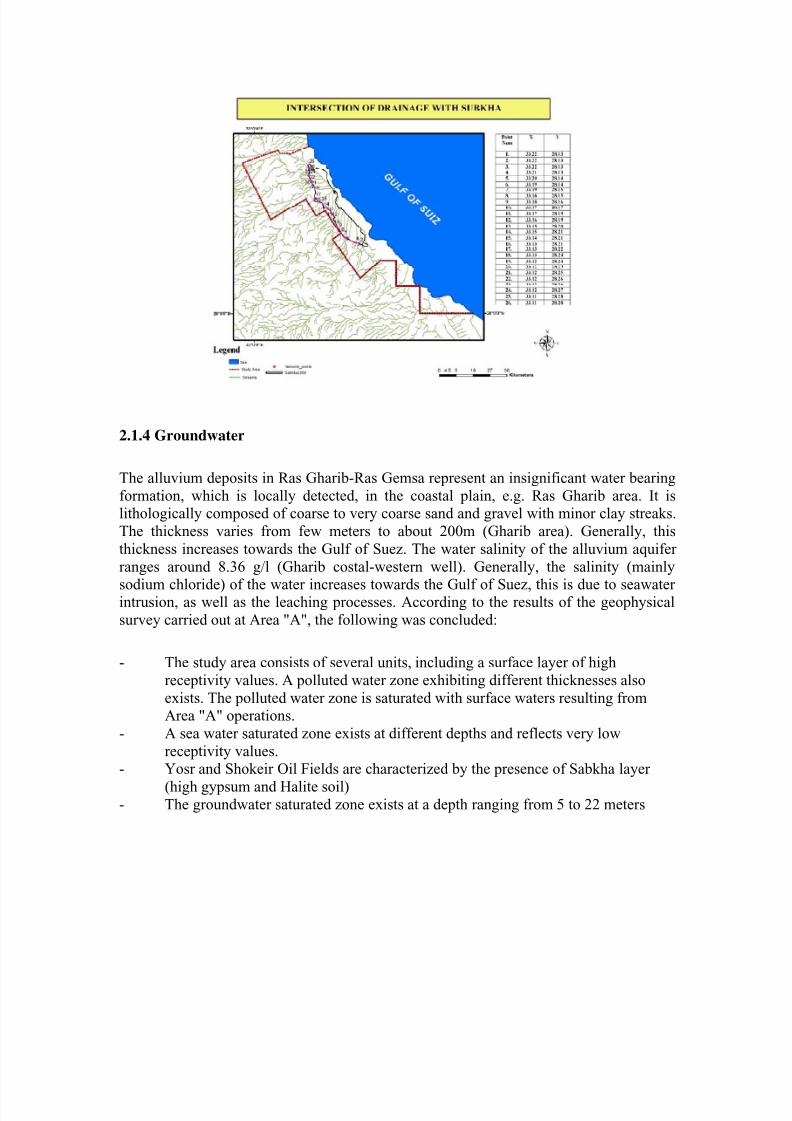
surface leakage allover the area.Flash flood-vulnerable sites along the boundary of the Area "A" are identified and
pointed out in Figure 4-4.
8/12/2019 The Integration of Space Born and Ground Remotely Sensed Data in Exploring the Environmental Stresses and De…
http://slidepdf.com/reader/full/the-integration-of-space-born-and-ground-remotely-sensed-data-in-exploring 6/15
2.1.4 Groundwater
The alluvium deposits in Ras Gharib-Ras Gemsa represent an insignificant water bearing
formation, which is locally detected, in the coastal plain, e.g. Ras Gharib area. It islithologically composed of coarse to very coarse sand and gravel with minor clay streaks.
The thickness varies from few meters to about 200m (Gharib area). Generally, this
thickness increases towards the Gulf of Suez. The water salinity of the alluvium aquifer
ranges around 8.36 g/l (Gharib costal-western well). Generally, the salinity (mainly
sodium chloride) of the water increases towards the Gulf of Suez, this is due to seawaterintrusion, as well as the leaching processes. According to the results of the geophysical
survey carried out at Area "A", the following was concluded:
- The study area consists of several units, including a surface layer of high
receptivity values. A polluted water zone exhibiting different thicknesses also
exists. The polluted water zone is saturated with surface waters resulting fromArea "A" operations.
- A sea water saturated zone exists at different depths and reflects very low
receptivity values.- Yosr and Shokeir Oil Fields are characterized by the presence of Sabkha layer
(high gypsum and Halite soil)- The groundwater saturated zone exists at a depth ranging from 5 to 22 meters
8/12/2019 The Integration of Space Born and Ground Remotely Sensed Data in Exploring the Environmental Stresses and De…
http://slidepdf.com/reader/full/the-integration-of-space-born-and-ground-remotely-sensed-data-in-exploring 7/15
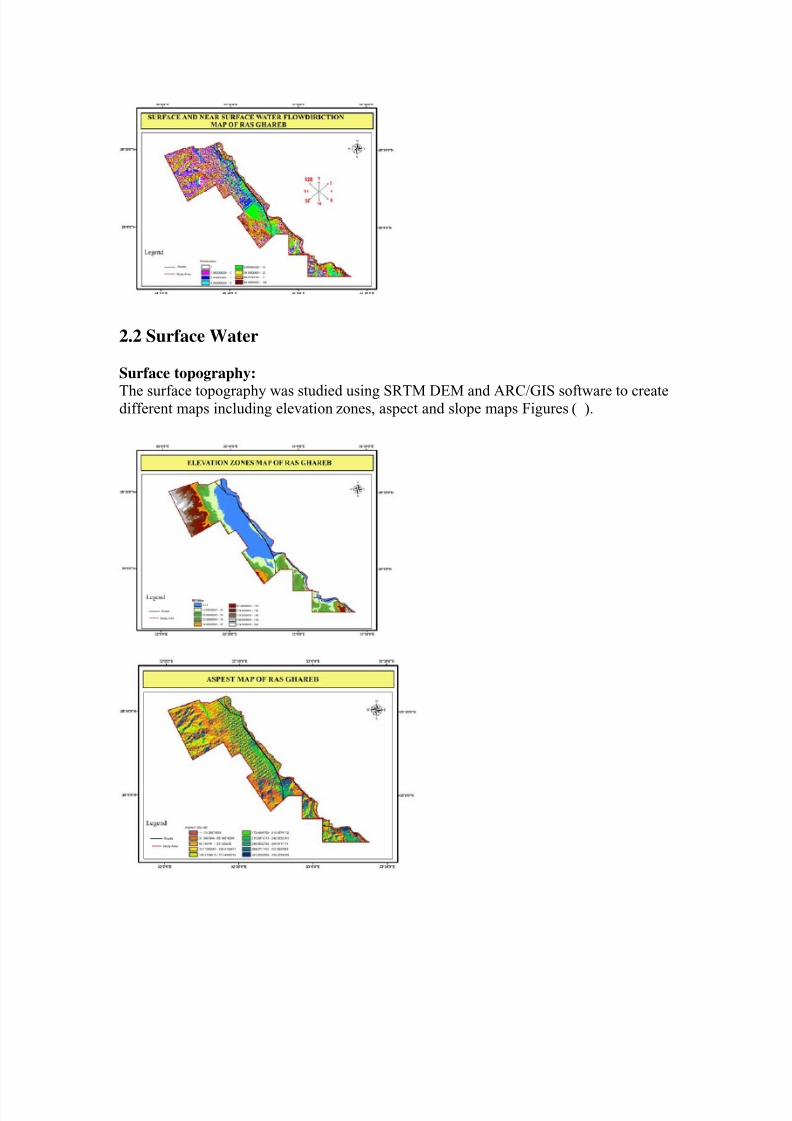
2.2 Surface Water
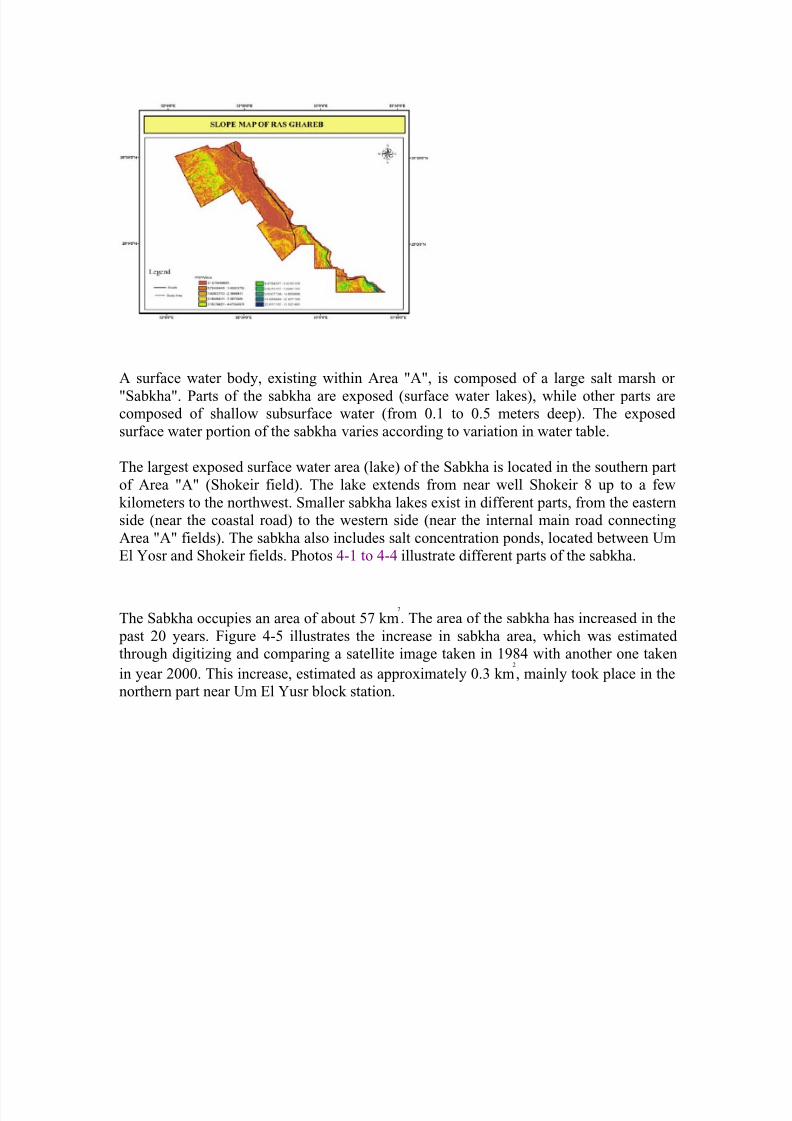
Surface topography:
The surface topography was studied using SRTM DEM and ARC/GIS software to createdifferent maps including elevation zones, aspect and slope maps Figures ( ).
8/12/2019 The Integration of Space Born and Ground Remotely Sensed Data in Exploring the Environmental Stresses and De…
http://slidepdf.com/reader/full/the-integration-of-space-born-and-ground-remotely-sensed-data-in-exploring 8/15
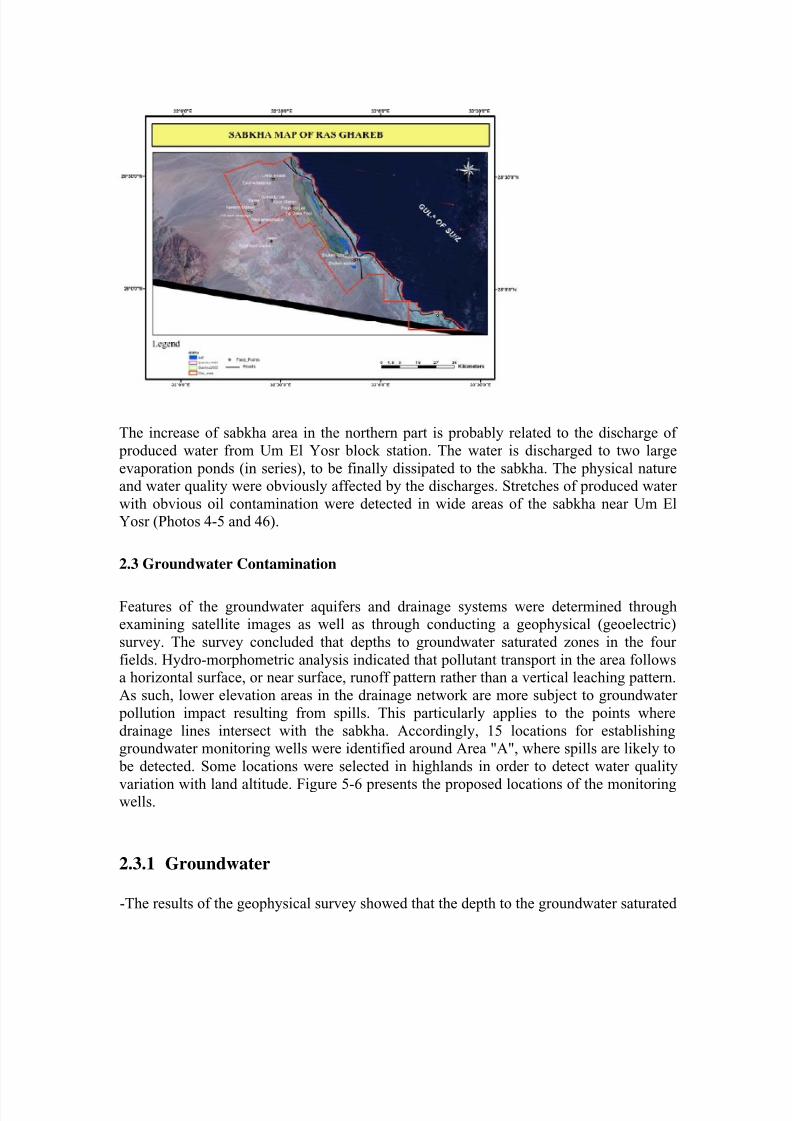
A surface water body, existing within Area "A", is composed of a large salt marsh or
"Sabkha". Parts of the sabkha are exposed (surface water lakes), while other parts arecomposed of shallow subsurface water (from 0.1 to 0.5 meters deep). The exposed
surface water portion of the sabkha varies according to variation in water table.
The largest exposed surface water area (lake) of the Sabkha is located in the southern part
of Area "A" (Shokeir field). The lake extends from near well Shokeir 8 up to a few
kilometers to the northwest. Smaller sabkha lakes exist in different parts, from the easternside (near the coastal road) to the western side (near the internal main road connecting
Area "A" fields). The sabkha also includes salt concentration ponds, located between UmEl Yosr and Shokeir fields. Photos 4-1 to 4-4 illustrate different parts of the sabkha.
The Sabkha occupies an area of about 57 km2
. The area of the sabkha has increased in the
past 20 years. Figure 4-5 illustrates the increase in sabkha area, which was estimatedthrough digitizing and comparing a satellite image taken in 1984 with another one taken
in year 2000. This increase, estimated as approximately 0.3 km2
, mainly took place in thenorthern part near Um El Yusr block station.
8/12/2019 The Integration of Space Born and Ground Remotely Sensed Data in Exploring the Environmental Stresses and De…
http://slidepdf.com/reader/full/the-integration-of-space-born-and-ground-remotely-sensed-data-in-exploring 9/15
The increase of sabkha area in the northern part is probably related to the discharge of
produced water from Um El Yosr block station. The water is discharged to two large
evaporation ponds (in series), to be finally dissipated to the sabkha. The physical natureand water quality were obviously affected by the discharges. Stretches of produced water
with obvious oil contamination were detected in wide areas of the sabkha near Um ElYosr (Photos 4-5 and 46).
2.3 Groundwater Contamination
Features of the groundwater aquifers and drainage systems were determined throughexamining satellite images as well as through conducting a geophysical (geoelectric)
survey. The survey concluded that depths to groundwater saturated zones in the four
fields. Hydro-morphometric analysis indicated that pollutant transport in the area followsa horizontal surface, or near surface, runoff pattern rather than a vertical leaching pattern.
As such, lower elevation areas in the drainage network are more subject to groundwater
pollution impact resulting from spills. This particularly applies to the points where
drainage lines intersect with the sabkha. Accordingly, 15 locations for establishinggroundwater monitoring wells were identified around Area "A", where spills are likely to
be detected. Some locations were selected in highlands in order to detect water quality
variation with land altitude. Figure 5-6 presents the proposed locations of the monitoringwells.
2.3.1 Groundwater
-The results of the geophysical survey showed that the depth to the groundwater saturated
8/12/2019 The Integration of Space Born and Ground Remotely Sensed Data in Exploring the Environmental Stresses and De…
http://slidepdf.com/reader/full/the-integration-of-space-born-and-ground-remotely-sensed-data-in-exploring 10/15
zone varies between 5 meters to 25 meters.
-Hydro-morphometric analysis indicated that pollutant transport in the area is taking
horizontal surface, or near surface, runoff pattern rather than a vertical leaching pattern.
Therefore, the locations where groundwater quality is most liable to be impacted by spills
are at the intersections of the drainage lines with the sabkha body.
2.4. Results of the quantitative interpretation
The thirty vertical electrical sounding stations of the studied area are interpreted
in terms of actual receptivity and depths for the encountered layers constituting the
shallow section of the study area. This interpretation is carried out by using manual
interpretation as an initial model for Sclumberger and IPI2win program. Accordingly,
the varieties of limestone, which reflect higher values of resistivities, while. Groundwater
saturated zone exhibit lower resistivity values. .Moreover, the sea water saturated zones
reflect very low resistivity values. The interpretation of the vertical electrical sounding
curves reveals that, the number of interpreted layers is ranged between four and seven
layers. Also, the true resistivity values are carried from 0.1 to 25000 ohm.m. Added, the
thicknesses of these layers are ranged from 0.225 to 122 m, as shown in Figures of the
VES interpretation . The final result of the interpretation of the VES curves indicate that
the study area consist of different layers such as surface layer of high resistivity values,
polluted water saturated zone, groundwater saturated zone and sea water saturated zone
can be indicated as follows:
1. The study area consists of several units such as surface layer of high receptivity
values, the polluted water zone which saturated from the surface water from the
processing stations, which exhibit different thicknesses.
2. Sea water saturated zone at different depths and reflect very low receptivity
values.
3. Groundwater saturated zone at depth ranged from 5 to 22 meters.
4. Yusr and Shukeir Oil Fields characterized by the presence of Sabkha layer (high
gypsum and Halite soil)
5. Dry zone, which show high receptivity values.
6. At kareem Oil Field the depth of the test wells must ranged from 10 to 15m.
8/12/2019 The Integration of Space Born and Ground Remotely Sensed Data in Exploring the Environmental Stresses and De…
http://slidepdf.com/reader/full/the-integration-of-space-born-and-ground-remotely-sensed-data-in-exploring 11/15
7. At Ayun Oil Field the depth of the test wells must ranged from 20 to 25m.
8. At yusr Oil Field the depth of the test wells must ranged from 10 to 15m.
9. At Shukeir Oil Field the depth of the test wells must ranged from 5 to 10m.
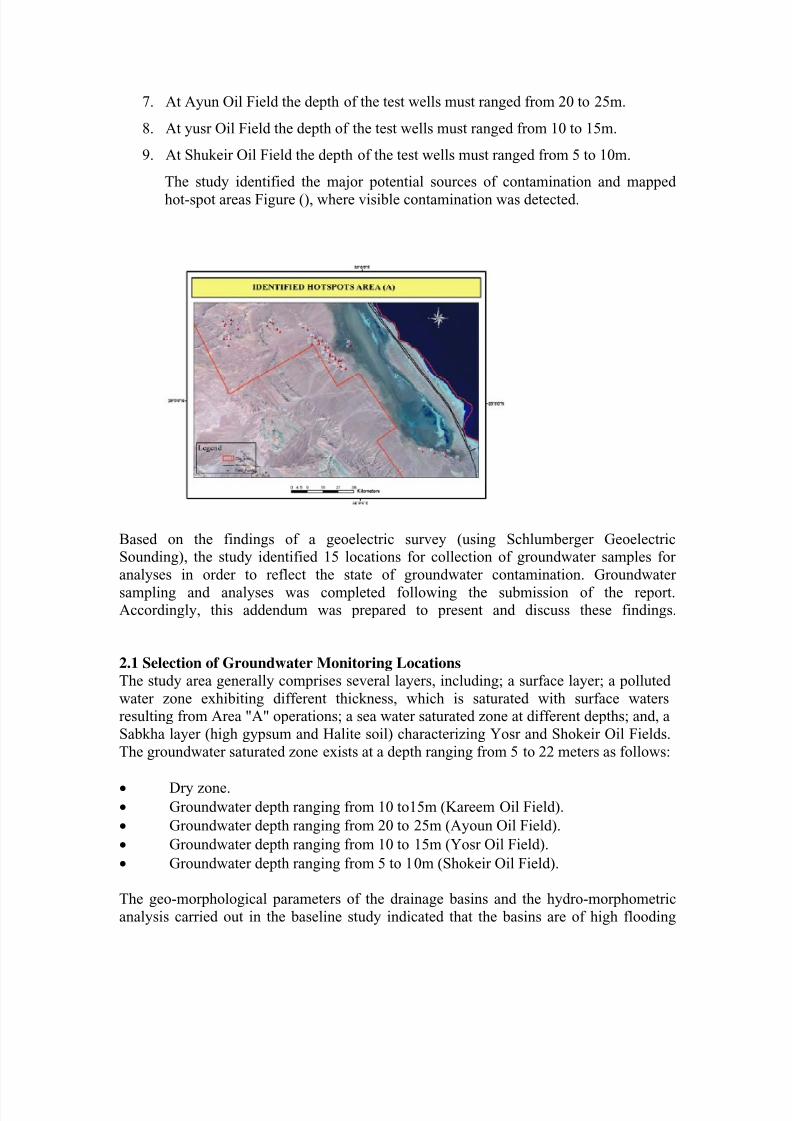
The study identified the major potential sources of contamination and mapped
hot-spot areas Figure (), where visible contamination was detected.
Based on the findings of a geoelectric survey (using Schlumberger GeoelectricSounding), the study identified 15 locations for collection of groundwater samples for
analyses in order to reflect the state of groundwater contamination. Groundwater
sampling and analyses was completed following the submission of the report.Accordingly, this addendum was prepared to present and discuss these findings.
2.1 Selection of Groundwater Monitoring Locations
The study area generally comprises several layers, including; a surface layer; a polluted
water zone exhibiting different thickness, which is saturated with surface watersresulting from Area "A" operations; a sea water saturated zone at different depths; and, a
Sabkha layer (high gypsum and Halite soil) characterizing Yosr and Shokeir Oil Fields.
The groundwater saturated zone exists at a depth ranging from 5 to 22 meters as follows:
• Dry zone.• Groundwater depth ranging from 10 to15m (Kareem Oil Field).
• Groundwater depth ranging from 20 to 25m (Ayoun Oil Field). • Groundwater depth ranging from 10 to 15m (Yosr Oil Field). • Groundwater depth ranging from 5 to 10m (Shokeir Oil Field).
The geo-morphological parameters of the drainage basins and the hydro-morphometric
analysis carried out in the baseline study indicated that the basins are of high flooding
8/12/2019 The Integration of Space Born and Ground Remotely Sensed Data in Exploring the Environmental Stresses and De…
http://slidepdf.com/reader/full/the-integration-of-space-born-and-ground-remotely-sensed-data-in-exploring 12/15
probability and low groundwater potential. This means that the effect of surface or nearsurface, runoff is higher than that of groundwater in terms of point contamination from
oil surface leakage allover the area. In other words, the pollutant transport in the area is
following a horizontal surface, or near surface, runoff pattern rather than a verticalleaching pattern.
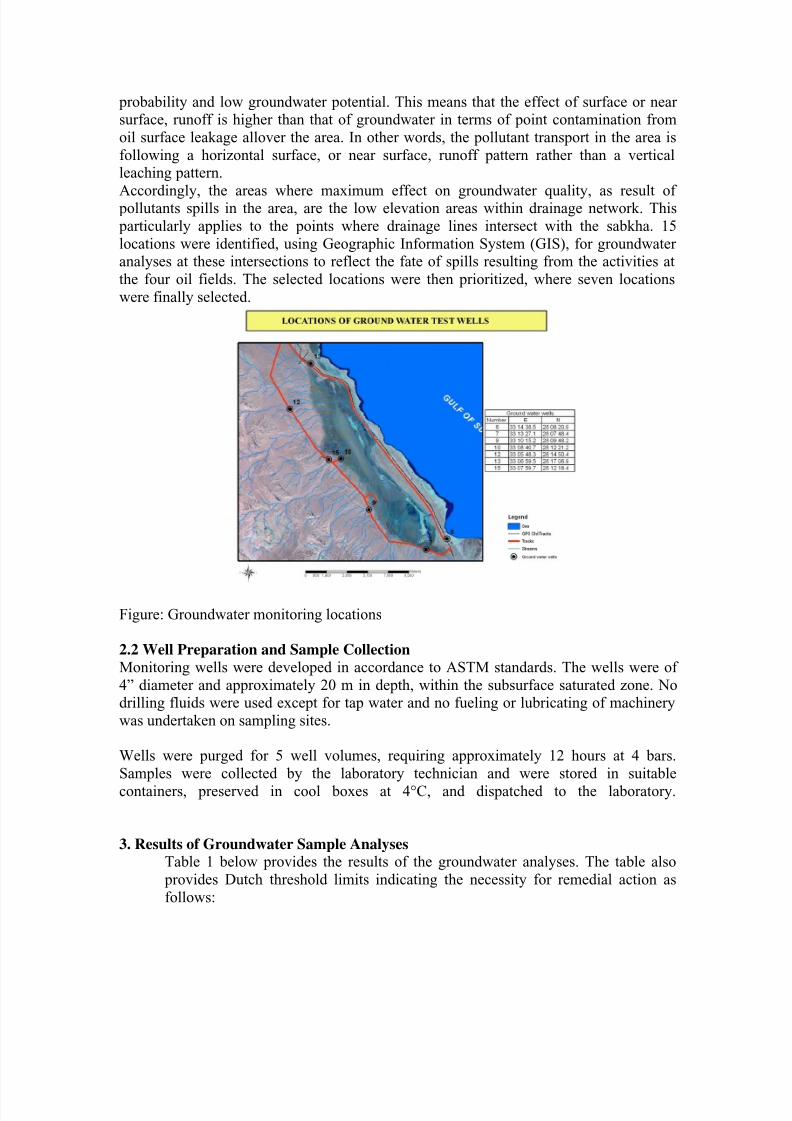
Accordingly, the areas where maximum effect on groundwater quality, as result of pollutants spills in the area, are the low elevation areas within drainage network. This
particularly applies to the points where drainage lines intersect with the sabkha. 15
locations were identified, using Geographic Information System (GIS), for groundwateranalyses at these intersections to reflect the fate of spills resulting from the activities at
the four oil fields. The selected locations were then prioritized, where seven locations
were finally selected.
Figure: Groundwater monitoring locations
2.2 Well Preparation and Sample Collection
Monitoring wells were developed in accordance to ASTM standards. The wells were of
4” diameter and approximately 20 m in depth, within the subsurface saturated zone. Nodrilling fluids were used except for tap water and no fueling or lubricating of machinery
was undertaken on sampling sites.
Wells were purged for 5 well volumes, requiring approximately 12 hours at 4 bars.
Samples were collected by the laboratory technician and were stored in suitable
containers, preserved in cool boxes at 4°C, and dispatched to the laboratory.
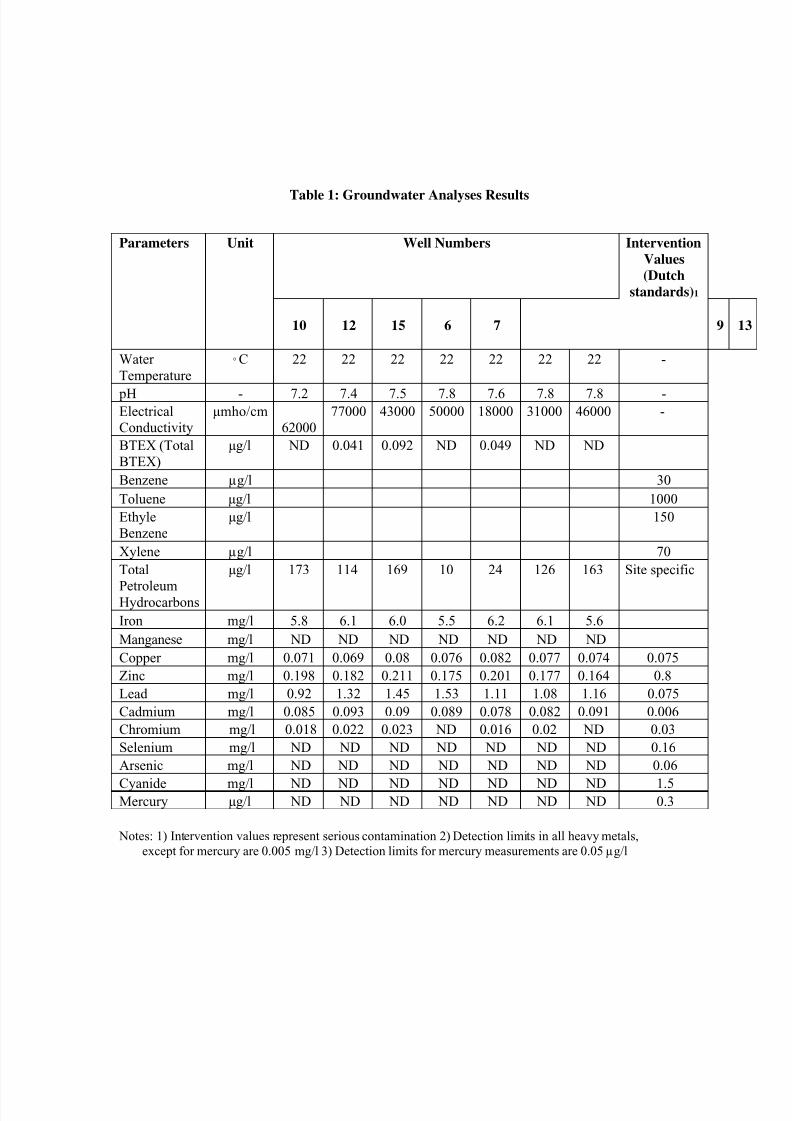
3. Results of Groundwater Sample Analyses
Table 1 below provides the results of the groundwater analyses. The table also
provides Dutch threshold limits indicating the necessity for remedial action as
follows:
8/12/2019 The Integration of Space Born and Ground Remotely Sensed Data in Exploring the Environmental Stresses and De…
http://slidepdf.com/reader/full/the-integration-of-space-born-and-ground-remotely-sensed-data-in-exploring 13/15
Table 1: Groundwater Analyses Results
Parameters Unit Well Numbers Intervention
Values
(Dutch
standards)1
10 12 15 6 7 9 1
Water
Temperature° C 22 22 22 22 22 22 22 -
pH - 7.2 7.4 7.5 7.8 7.6 7.8 7.8 -Electrical
Conductivity
µmho/cm
62000
77000 43000 50000 18000 31000 46000 -
BTEX (Total
BTEX)
µg/l ND 0.041 0.092 ND 0.049 ND ND
Benzene µg/l 30
Toluene µg/l 1000
Ethyle
Benzene
µg/l 150
Xylene µg/l 70
Total
PetroleumHydrocarbons
µg/l 173 114 169 10 24 126 163 Site specific
Iron mg/l 5.8 6.1 6.0 5.5 6.2 6.1 5.6
Manganese mg/l ND ND ND ND ND ND ND
Copper mg/l 0.071 0.069 0.08 0.076 0.082 0.077 0.074 0.075
Zinc mg/l 0.198 0.182 0.211 0.175 0.201 0.177 0.164 0.8
Lead mg/l 0.92 1.32 1.45 1.53 1.11 1.08 1.16 0.075
Cadmium mg/l 0.085 0.093 0.09 0.089 0.078 0.082 0.091 0.006
Chromium mg/l 0.018 0.022 0.023 ND 0.016 0.02 ND 0.03
Selenium mg/l ND ND ND ND ND ND ND 0.16
Arsenic mg/l ND ND ND ND ND ND ND 0.06
Cyanide mg/l ND ND ND ND ND ND ND 1.5Mercury µg/l ND ND ND ND ND ND ND 0.3
Notes: 1) Intervention values represent serious contamination 2) Detection limits in all heavy metals,
except for mercury are 0.005 mg/l 3) Detection limits for mercury measurements are 0.05 µg/l
8/12/2019 The Integration of Space Born and Ground Remotely Sensed Data in Exploring the Environmental Stresses and De…
http://slidepdf.com/reader/full/the-integration-of-space-born-and-ground-remotely-sensed-data-in-exploring 14/15
3.1 TPH and BTEX (Benzene, Toluene, Ethyle Benzene and Xylene)
Total petroleum hydrocarbons were measured to determine the concentration of
petroleum in the soil. The results indicated the existence of low levels of TPH in the
groundwater. BTEX, were also measured in the groundwater. The total measured BTEX
levels were found lower than the intervention values of any of its individual components
(Benzene,Toluene,EthyleBenzeneorXylene)
3.2 Heavy Metals
Zinc, chromium, selenium, arsenic, cyanide and mercury were found below the
intervention values. Copper levels were found around the intervention values, whereas
lead and cadmium are above the intervention values
4. Analysis of Results
In general, the results of the groundwater analyses were found consistent throughout the
sampled locations, values exceeded the intervention levels for lead and cadmium in all
the samples. However, highest levels of cadmium were found near Karim and Ayoun.
Groundwater analyses results also showed that the highest levels of BTEX and TPH weredetected at well numbers 10 and 15 respectively, which are downstream Um El Yosr
station.
It is expected that the high levels recorded at point 9 resulted from surface leakage
(almost continuous) from the pipelines linking the oil fields to Shukeir station. This areais of lower altitude in comparison to the surroundings, which creates higher pressure onthe pipelines, making it of more potential to leak.
Crude oil is generally composed of a wide range of hydrocarbons and a small amount ofimpurities. The composition of the crude varies significantly according to its source.
Crude may also include different types of heavy metals including arsenic, cadmium,
mercury and nickel. However, analyses of the crude oil produced in the area areunavailable. Moreover, the produced water during exploration and production activities
could generally be a source of brine, petroleum hydrocarbons, natural radioactivity and
heavy metals. Leaks, spills and releases of this water may contaminate both soil and
groundwater. Heavy metals could also result from additives used in petroleum activities,disposal of drilling muds, disposal of batteries, transformers, etc.

8/12/2019 The Integration of Space Born and Ground Remotely Sensed Data in Exploring the Environmental Stresses and De…
http://slidepdf.com/reader/full/the-integration-of-space-born-and-ground-remotely-sensed-data-in-exploring 15/15
Surface transport of petroleum wastes generally occurs when large amounts aredischarged onto ground, especially in the existence of storm water runoff. Hydrocarbons
move with surface runoff as they are lighter than water. Subsurface transport could occur
above the water table or through the geologic formations (especially when abandonedwells are improperly plugged), where hydrocarbons, salt and heavy metals may flow into
formations that contain fresh water.
In conclusion, the investigations proved that there has been a detectable negative impact
on the groundwater quality. It is difficult to relate the contribution of each activity in the
area to this impact. However, and as mentioned earlier, it is expected that the pollutantswere transported, from their potential sources (production and other activities in the area),
through surface and near surface runoff towards the lower elevation areas, which were
selected for groundwater analyses. Figure 2 relates each monitoring location to its
potential contamination source (represented in different colors) in the upstream area.
Currently, groundwater is of no use in the area as it is of high salinity. Surface waterappears to be healthy, with the exception of the northern parts of the sabkha and other
locations upstream operations in wells and block stations. The survey team could see fish
living in these waters. It is expected that if the sources of pollution in the area are cleanedand discontinued, the quality of both surface and groundwater would improve with time.
Environmental Baseline Survey – Area "A” (Addendum)
Figure 2: Monitoring Points and their Relation to Identified Hotspots as well as theirRelation to Oil and Other Activities
![Khwaja Gharib Nawaz Hudhrat Syed Moinuddin al-Chishti (Rehmatullahi Alehe) [Urdu]](https://static.fdocuments.net/doc/165x107/577cd13b1a28ab9e7893ee73/khwaja-gharib-nawaz-hudhrat-syed-moinuddin-al-chishti-rehmatullahi-alehe.jpg)