
THE INFLUENCE OF SMALL COMPOSITIONAL AND STRUCTURAL ...
21
I. Šoljić Jerbić et al. The influence of small compositional and structural... goriva i maziva, 52, 3 : 231-251, 2013. 231 Ivana Šoljić Jerbić, Tomislav Penović, Elvira Vidović, Ante Jukić ISSN 0350-350X GOMABN 52, 3, 231-251 Izvorni znanstveni rad / Original scientific paper THE INFLUENCE OF SMALL COMPOSITIONAL AND STRUCTURAL DIFFERENCES IN ETHYLENE/PROPYLENE COPOLYMERS AS A LUBRICATING OIL RHEOLOGY MODIFIER ON THEIR SOLUTION VISCOMETRIC BEHAVIOR Abstract The influence of the composition and structure of amorphous ethylene-propylene copolymer, EPC on viscometric behavior of mineral lubricating oils was examined and described. It is shown that even small differences in composition and structure of the same polymeric product, which are unavoidable consequence of the statistical nature of polymerization reactions, can display significant changes related to viscosity and thickening efficiency. Molecular weight of the additive has the most significant effect on viscosity since their very small increase causes a substantial increase in viscosity of olefin copolymer (OCP) solutions. Composition and distribution of comonomer sequences are important parameters, but do not show explicit nor linear effect on the solution viscosity. The interdependence of ethylene content, molecular weight and viscosity of additive solutions is expressed by an empirical function which is calculated using the Marquardt-Levenberg iterative algorithm. Understanding of the dependencies between the composition and structure together with the application characteristics is necessary for the formulation of lubricants and for achieving the optimal performance of a polymeric additive. Keywords: amorphous ethylene-propylene copolymer, composition, structure, viscosity, lubricant formulation
Transcript of THE INFLUENCE OF SMALL COMPOSITIONAL AND STRUCTURAL ...

I. Šoljić Jerbić et al. The influence of small compositional and structural...
goriva i maziva, 52, 3 : 231-251, 2013. 231
Ivana Šoljić Jerbić, Tomislav Penović, Elvira Vidović, Ante Jukić
ISSN 0350-350X GOMABN 52, 3, 231-251
Izvorni znanstveni rad / Original scientific paper
THE INFLUENCE OF SMALL COMPOSITIONAL AND STRUCTURAL DIFFERENCES
IN ETHYLENE/PROPYLENE COPOLYMERS AS A LUBRICATING OIL RHEOLOGY MODIFIER ON THEIR SOLUTION VISCOMETRIC BEHAVIOR
Abstract
The influence of the composition and structure of amorphous ethylene-propylene copolymer, EPC on viscometric behavior of mineral lubricating oils was examined and described. It is shown that even small differences in composition and structure of the same polymeric product, which are unavoidable consequence of the statistical nature of polymerization reactions, can display significant changes related to viscosity and thickening efficiency. Molecular weight of the additive has the most significant effect on viscosity since their very small increase causes a substantial increase in viscosity of olefin copolymer (OCP) solutions. Composition and distribution of comonomer sequences are important parameters, but do not show explicit nor linear effect on the solution viscosity. The interdependence of ethylene content, molecular weight and viscosity of additive solutions is expressed by an empirical function which is calculated using the Marquardt-Levenberg iterative algorithm. Understanding of the dependencies between the composition and structure together with the application characteristics is necessary for the formulation of lubricants and for achieving the optimal performance of a polymeric additive. Keywords: amorphous ethylene-propylene copolymer, composition, structure, viscosity, lubricant formulation

The influence of small compositional and structural...... I. Šoljić Jerbić et al.
232 goriva i maziva, 52, 3 : 231-251, 2013.
UTJECAJ MALIH RAZLIKA U SASTAVU I STRUKTURI ETILEN/PROPILEN
KOPOLIMERNOG ADITIVA NA VISKOZNOST OTOPINA MAZIVIH ULJA
Sažetak Istražen je i opisan utjecaj sastava i strukture poliolefinskog aditiva (amorfni etilen-propilen kopolimer, EPC) na viskozimetrijsko ponašanje njegovih otopina u mineralnom mazivom ulju. Ustanovljeno je da i vrlo male razlike u sastavu i strukturi istoga tipa polimernog proizvoda, a koje su često neizbježna posljedica statističke prirode reakcija polimerizacije, mogu uzrokovati značajne promjene viskoznosti i učinkovitosti zgušnjavanja. Najveći utjecaj na viskoznost ima molekulska masa, budući da njeno malo povećanje znatno povećava viskoznost EPC otopina. Sastav i raspodjela komonomernih sekvencija su važni parametri, ali ne pokazuju jedno-značan niti linearan utjecaj na viskoznost otopina. Međuovisnost udjela etilena, molekulske mase i viskoznosti otopina polimernog aditiva prikazana je empirijskom funkcijom izračunatom uporabom Marquardt-Levenberg iteracijskog algoritma. Razumijevanje odnosa između sastava, strukture i primjenskih svojstava nužno je pri formuliranju maziva za postizanje optimalnog djelovanja polimernog aditiva.
Ključne riječi: amorfni etilen-propilen kopolimer, sastav, struktura, viskoznost, formuliranje maziva
1. Introduction One of the widely used and most important classes of lubricant additives are ethylene-propylene amorphous copolymers (EPC or olefin copolymer, OCP). Their main virtues compared to other viscosity modifiers are their high thickening efficiency and relatively low cost [1-3]. The physical properties of the EP random copolymer are strongly dependent on several factors, primarily on the ethylene/ propylene molar ratio and the distribution of comonomer sequences across the polymer chain [1,4,5]. Most frequently, the content of ethylene in the copolymer is between 40 and 60 mol. %. Higher ethylene content in the copolymer contributes to a higher viscosity index of oil solutions, while very long ethylene sequences adversely affect the solubility of the copolymer in most mineral oils, especially at lower temperatures [6-8]. Hence, in order to provide good rheological properties, the comonomer sequence distribution in macromolecules has to be narrow and random, since the compositional heterogeneity of EPC additives may have significant impact on the viscosity of mineral oils. Viscosity is the most important property of lubricating oil. A key factor which determines the viscosity of dilute polymer solution is the hydrodynamic volume of polymer coil. It reflects polymer-solvent interactions in the absence of strong specific

I. Šoljić Jerbić et al. The influence of small compositional and structural...
goriva i maziva, 52, 3 : 231-251, 2013. 233
polymer interactions and it is a sophisticated function of many parameters: in homopolymer solutions, type of polymer and solvent, molecular weight and polydispersity of a dissolved polymer, as well as its concentration and temperature of the system. Besides the above mentioned factors, in case of a copolymer, the correlation should take average chemical composition, chemical composition distribution, sequence distribution, segment-segment interactions, as well as copolymer segments-solvent interactions, etc [9-18] into consideration. Thus, very small differences in the structure of polymers and especially copolymers can cause significant changes in the hydrodynamic volume of the polymer coil and can directly affect viscosity of their solutions. Among other materials, polymers stand out as "products by process" since the history of the polymerization reaction reflects on the values of the molecular weight distribution, the degree of branching, the distribution of sequences, etc. Despite the advanced methods of process control and the optimization of process or product properties, small deviations from the desired composition and structure of the copolymers still occur. In the case of specific applications, such as the use of copolymers as viscosity index improvers of lubricating oils, even these small deviations can have a significant impact on the performance characteristics and can cause changes in the formulation of the final products. In this paper, the compositional and structural analysis of eight samples of ethylene/propylene copolymers, same type of commercial viscosity index improver, were performed and their influence on viscometric behavior in xylene solutions were established. 13C NMR technique was used to characterize the composition and sequence distribution of EP copolymers [19-26] and their main structural properties were determined by size exclusion chromatography (SEC). Viscosity of diluted polymer solutions was examined in xylene, as a model solvent for mineral base oil, in order to assess polymer / solvent molecular interactions. Additionally, the crystallinity and melting behavior of the EPC samples was examined by x-ray diffraction (XRD) and differential scanning calorimetry (DSC) [1,2,6,27]. The interdependence of the copolymer composition, the molar mass values and the viscosity of the polymer solutions were described by using an empirical function derived by the Marquardt-Levenberg iteration algorithm [28,29].
2. Experimental 2.1. Materials Commercial samples of amorphous ethylene-propylene copolymers with specified composition range of 40 to 60 mol. % of ethylene (EPC 1-8) was used as received as well as reagent grade solvents: xylene, o-dichlorobenzene and tetrahydrofurane. 2.2. Copolymer characterization methods The dilute polymer solutions were prepared by dissolving the appropriate mass of ethylene-propylene copolymer in xylene, followed by dilution to a measured volume. Viscometric measurements were carried out at 30 ± 0.02 °C using a Cannon–Fenske 50 K capillary viscometer immersed in a constant temperature bath.
The influence of small compositional and structural...... I. Šoljić Jerbić et al.
234 goriva i maziva, 52, 3 : 231-251, 2013.
Relative viscosities of polymer solutions were calculated by dividing the flow times of solutions by that of the pure solvent (rel = / o = t / to). The reproducibility of experiments was assured by measurement replication whereat no significant discrepancy between replicated measurements was observed. In order to establish a copolymer composition, all the OCP samples were analyzed by 13C NMR on a Bruker Avance spectrometer. The 13C NMR spectra were recorded on the 300 MHz, in o-dichlorobenzene with deuterated DMSO as an internal standard. The overall composition of the copolymers was determined based on the method of triad distribution. The total ethylene content was determined by the sum of the corresponding triads ([E] = [PEP] + [EEP] + [EEE]) according to the assignment of chemical shift. Molecular weight distributions of investigated copolymers were determined at room temperature using the GPC-20 Polymer Laboratories size exclusion chromatograph. Measurements were performed in tetrahydrofurane as an eluent with a flow rate of 1.0 mL min-1. The calibration curve was based on the polystyrene standards (EasyCal PS-1B, 580-2560000 g mol-1) of narrow distribution. The DSC analysis was performed on a Mettler Toledo DSC1 calorimeter. The samples (ca 10 mg) were scanned at 10 °C min−1 under dry nitrogen (50 cm3 min−1). After that they were cooled from room temperature to −100 °C and maintained at this temperature for 2 min. They were then heated to 150 °C and cooled to −100 °C. This procedure was repeated twice. The actual value of the glass transition Tg was estimated by the point-of-inflection method using heating curves. The amorphous structure of ethylene-propylene copolymers was examined by x-ray diffraction. Experiments were carried out on a Philips X'Pert PRO diffractometer at room temperature.
3. Results and Discussion 3.1. Molecular weight distribution The molecular weight distributions of the examined EPC samples were determined by the size exclusion chromatography (SEC). The obtained weight-average (Mw), number-average (Mn), and z-average (Mz) molecular weights and the polydispersity index (PI) values are given in Table 1. 3.2. Compositional analysis The 13C NMR technique was used for a detailed characterization of the molecular structure of copolymer chains, since it is sensitive to monomer sequencing and compositional variations [27]. Figure 1 shows the 13C NMR spectrum of one of the EPC samples. Nine separated peaks can be seen in the spectrum marked by the letters from A to I. The detailed assignments and relative chemical shifts for each peak are presented in Table 2 [24]. The intensity of each peak in the 13C NMR spectra was used to calculate the sequence content of the comonomers. The triad concentration was calculated from both methine and methylene data by using following six equations:

I. Šoljić Jerbić et al. The influence of small compositional and structural...
goriva i maziva, 52, 3 : 231-251, 2013. 235
)II5III(k)PPP( HGDBA (1)
)III2I2(k)EPPPPE( HGDB (2)
)I(k)EPE( D (3)
)IIIIII(k5)EEE( HDBAFE (4)
)I(k)PEP( H (5)
)I(k)EEPPEE( G (6)
where k is the normalization factor, I is the integral area with their subscripts denoting the integral ranges in Figure 1 and ρ(ijk)s are the triad ijk (E and P) distributions. Those equations were simultaneously solved in an internal program by using Microsoft® Office Excel and the obtained results are presented in Table 3.
Figure 1: 13C NMR spectrum of EPC showing different region belonging to various monomer sequences The content of ethylene (E) and propylene (P), respectively, was calculated from the following equations proposed by Randall and Kakugo [4,23]:
EEPPEEPEPEEEE (7)
E1=EPEEPPPPEPPPP (8)

The influence of small compositional and structural...... I. Šoljić Jerbić et al.
236 goriva i maziva, 52, 3 : 231-251, 2013.
Table 1: Average molecular weight (Mn, Mw, Mz) together with polydispersity index values (PI) for commercial samples of ethylene-propylene copolymers (EPC)
Sample Mn / g mol-1 Mw / g mol-1 Mz / g mol-1 PI = Mw / Mn
EPC-1 83601 149134 247287 1.78 EPC-2 83165 147835 244925 1.78 EPC-3 95184 157542 243329 1.66 EPC-4 86234 149682 243552 1.74 EPC-5 78905 141437 237545 1.79 EPC-6 86062 149918 244601 1.74 EPC-7 85082 148233 242246 1.74 EPC-8 89693 147087 225618 1.64
Table 2: 13C NMR assignments and chemical shifts of the methylene group of EPC [30,31]
Area Integration Chemical shift (ppm) Carbon type
A 43.5 – 48.5 48.1 – 45.3 Sαα
B 36.1 – 39.8
38.8 38.4 37.9 37.6
Sαγ Sαδ Sαγ Sαδ
C 36.1 – 34.3 35.7 34.9
Sαβ Sαβ
D 32.4 – 34.3 33.8 33.5 33.2
Tγγ Tγδ Tδδ
E 32.4 – 29.1
31.2 30.9 30.85 30.8 30.4
28.7, 28.6
Tβγ Tβδ Sγγ Tβδ Sγδ Sδδ
F 29.1 – 28.1 28.4 Tββ
G 28.1 – 25.8 27.8 27.5, 27.3
Sβγ Sβδ
H 25.8 – 23.8 24.8, 24.7 Sββ
I 22.5 – 18.0 22-21.3
21.3-20.6 20.6-19.5
Pββ Pββ + Pβδ + Pβγ
Pββ + Pβγ + Pβδ + Pγγ

I. Šoljić Jerbić et al. The influence of small compositional and structural...
goriva i maziva, 52, 3 : 231-251, 2013. 237
Table 3: Comonomer sequence distribution in the ethylene-propylene copolymers
Sample EPC-1 EPC-2 EPC-3 EPC-4 EPC-5 EPC-6 EPC-7 EPC-8
k 7.10 4.12 2.72 3.04 3.42 3.62 5.16 1.67 ρ (PPP) 40.35 39.40 36.30 35.42 38.44 38.96 41.16 36.02
ρ (PPE+EPP) 8.13 11.05 10.60 10.56 9.85 10.69 10.82 5.58 ρ(EPE) 1.14 4.53 3.94 4.43 4.64 4.24 4.89 5.86 ρ (EEE) 41.43 33.10 38.68 37.13 35.40 35.17 30.44 42.68 ρ (PEP) 2.86 3.26 2.42 3.10 3.10 2.74 4.39 1.84
ρ (PEE+EEP) 6.09 8.66 8.06 9.36 8.55 8.20 8.30 8.02 E / mol.% 50.38 45.02 49.17 49.59 47.06 46.12 43.14 52.54 P / mol.% 49.62 54.98 50.83 50.41 52.94 53.88 56.87 47.46
From the obtained results, it can be observed that the ethylene (from 43.1 to 52.5 mol %) and propylene content differs in all examined copolymer samples (Figure 2), which can cause a considerable variation in the viscosity of their dilute solutions.
Figure 2: Ethylene (E) and propylene (P) molar fractions in eight samples of ethylene-propylene copolymers (EPC)

The influence of small compositional and structural...... I. Šoljić Jerbić et al.
238 goriva i maziva, 52, 3 : 231-251, 2013.
A detailed compositional analysis of eight different batches of ethylene-propylene copolymer (EPC) samples has shown that the triad fraction is essentially composed of long propylene (PPP) and ethylene sequences (EEE), as expected from 72 to 82 mol. %. At the same time, other sequences presented in the examined EPC samples (PPE, EEP, EPE, and PEP) are contained in a small share (see Table 3). In order to investigate how narrow the comonomer sequence distribution is, a statistical analysis was performed and the results are given in Table 4 and presented in Figure 3. The experimentally determined values of the triad distribution for the eight examined samples of EPC were mathematically described by the Gaussian function (Figure 3). The calculated values are in a very good agreement with the experimentally obtained data and the statistical coefficients presented in Table 4 confirm the goodness of fit (R2 > 0.95).
Table 4: Statistical coefficients that describe the goodness of fit between the calculated (Gaussian function) and experimentally obtained data.
Sample *SSE *R2 *Adj. R2 *RMSE * *
EPC-1 0.000857 0.9952 0.992 0.0169 0.7870 0.6194
EPC-2 0.003699 0.9694 0.949 0.03511 0.9418 0.8870
EPC-3 0.00147 0.9891 0.9818 0.02214 0.9012 0.8121
EPC-4 0.001834 0.9846 0.9744 0.02473 0.9473 0.8975
EPC-5 0.002615 0.9793 0.9656 0.02953 0.9186 0.8438
EPC-6 0.002611 0.9798 0.9664 0.02950 0.9156 0.8384
EPC-7 0.006845 0.9522 0.9036 0.04777 0.9358 0.8758
EPC-8 0.004873 0.9693 0.9488 0.04030 0.8092 0.6548
*SSE - the sum of squares due to error; R2 - the coefficient of multiple determination; Adj. R2 - the degree of freedom adjusted R-square; RMSE - the root mean squared error; - standard deviation; - variance. The estimated parameters of the Gaussian function, such as standard deviation () and variance (), give an insight into the width of the comonomer distribution of the examined samples. Samples EPC-1 and EPC-8 show the narrowest, while samples EPC-2 and EPC-4 exhibit the most heterogeneous comonomer distribution.

I. Šoljić Jerbić et al. The influence of small compositional and structural...
goriva i maziva, 52, 3 : 231-251, 2013. 239
Figure 3a: Comparison of the calculated and experimentally determined triad sequence distribution of eight different batches of commercial samples of ethylene-propylene copolymers (EPC 1-6)

The influence of small compositional and structural...... I. Šoljić Jerbić et al.
240 goriva i maziva, 52, 3 : 231-251, 2013.
Figure 3b: Comparison of the calculated and experimentally determined triad sequence distribution of eight different batches of commercial samples of ethylene-propylene copolymers (EPC 7-8) 3.3. Crystallinity The length of an ethylene sequences is highly dependent on the ethylene content in the ethylene-propylene copolymers, i.e. as the ratio of ethylene (E) / propylene (P) increases, the triad fraction of the EEE sequences rises [2]. These sequences have a different tendency to crystallize, and above ~ 60 wt. % of ethylene they become long enough to crystallize, which can cause an unfavorable effect on low-temperature rheological properties of lubricating oils [2,3]. A long ethylene sequence is structurally similar to paraffinic wax, so that it can interact with a waxy component of base oil at low temperatures and create three-dimensional lattice structures that prevent free flow, whereby giving high pour point values. Since the rheological properties of the EPC are strongly dependent on the crystalline phase, the DSC and the x-ray diffraction measurements were performed for all EPC samples. Obtained results are presented at Figures 4 and 5. The DSC curves (Figure 4) show that the examined EPC samples are entirely amorphous, since only glass transitions occur in the investigated temperature range. The glass transition temperature is clearly defined at around - 55.5 °C for all EPC samples. These results are in line with the literature data [32], where the crystalline phase was recorded only for samples with 80 mol. % of ethylene in the copolymer. The obtained roentgenogram (Figure 5) confirmed the DSC results, i.e. that the EPC samples were entirely amorphous and that there is no crystalline phase.

I. Šoljić Jerbić et al. The influence of small compositional and structural...
goriva i maziva, 52, 3 : 231-251, 2013. 241
Figure 4: DSC curves for the examined EPC samples
Figure 5: X-ray diffraction scan for the EPC-8 sample

The influence of small compositional and structural...... I. Šoljić Jerbić et al.
242 goriva i maziva, 52, 3 : 231-251, 2013.
3.4. Viscometric characterization The viscosity of the diluted solutions of eight different batches of amorphous polyolefinic additive poly(ethylene-co-propylene) (EPC) was examined in xylene as a model solvent using a calibrated capillary viscometer immersed in a constant temperature bath at 30 ± 0.02 °C. Measurements were performed in the dilute concentration range from 0.001 to 0.005 g cm-3 in order to satisfy the linear concentration dependence proposed by Huggins [33]:
2red sp H/ [ ] [ ] [ ]k b (9)
where red refers to the reduced and sp to the specific viscosity, [] is the limiting viscosity number, is the weight concentration of polymer, and kH is the Huggins' constant, that is empirically related to the thermodynamical quality of solvent. In Table 5 experimentally determined value of relative, rel, specific, sp, and reduced viscosity are listed, red, depending on the copolymer weight concentration in solution . The experimentally determined dependence of the reduced viscosity on the copolymer weight concentration is presented in Figure 6.
Table 5: Dependence of the relative rel, specific sp, and reduced viscosity red on the copolymer weight concentration in the xylene solution at 30 °C for all investigated EPC / xylene systems.
(g cm-3) EPC-1 EPC-2 EPC-3 EPC-4 EPC-5 EPC-6 EPC-7 EPC-8
0.001 1.135 1.127 1.112 1.136 1.128 1.130 1.131 1.124 0.002 1.279 1.264 1.248 1.287 1.271 1.274 1.284 1.265 0.003 1.449 1.420 1.397 1.459 1.436 1.437 1.447 1.429 0.004 1.637 1.611 1.566 1.645 1.623 1.615 1.639 1.606
ηrel (cm3 g-1)
0.005 1.839 1.817 1.753 1.857 1.826 1.808 1.867 1.807 0.001 0.135 0.127 0.112 1.136 1.128 0.130 0.131 0.124 0.002 0.279 0.264 0.248 1.287 1.271 0.274 0.284 0.265 0.003 0.449 0.420 0.397 1.459 1.436 0.437 0.447 0.429 0.004 0.637 0.611 0.566 1.645 1.623 0.615 0.639 0.604
ηsp (cm3 g-1)
0.005 0.839 0.817 0.753 1.857 1.826 0.808 0.867 0.807 0.001 134.5 126.8 112.0 135.6 127.8 129.9 130.8 124.0 0.002 139.6 132.1 124.0 143.6 135.6 137.0 141.8 132.3 0.003 149.7 140.0 132.5 153.0 145.2 145.8 149.1 143.1 0.004 159.3 152.8 141.5 161.3 155.9 153.7 159.9 150.9
ηred (cm3 g-1)
0.005 167.8 163.5 150.7 171.3 165.2 161.7 173.4 161.5

I. Šoljić Jerbić et al. The influence of small compositional and structural...
goriva i maziva, 52, 3 : 231-251, 2013. 243
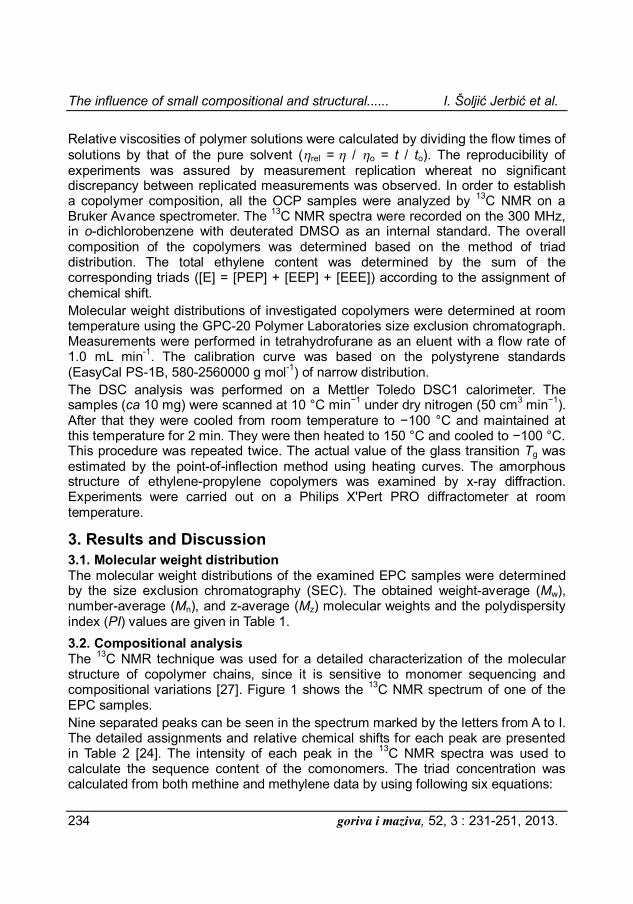
From the obtained results, it can be observed that the Huggins' extrapolation straight lines describe all the EPC / xylene investigated systems very well, with linear regression coefficient higher than 0.95. The corresponding Huggins' constants (kH) and the limiting viscosity numbers ([]), together with the slope of Huggins' straight line (b) are listed in Table 6 and presented in Figures 7 and 8.
Table 6: Experimental values of the slope of Huggins' straight lines (b), the limiting viscosity numbers ([]) and Huggins' constants (kH) together with the linear regression coefficients (R2) for the investigated diluted solutions of EPC samples in xylene at 30 o C.
[η] / cm3 g-1 b / cm6 g-2 kH R2
EPC-1 124.24 8642.7 0.56 0.9907
EPC-2 114.80 9407.2 0.71 0.9772
EPC-3 103.71 9477.8 0.88 0.9961
EPC-4 126.18 8925.1 0.56 0.9988
EPC-5 117.45 9502.1 0.69 0.9975
EPC-6 121.54 8023.7 0.54 0.9992
EPC-7 120.03 10319.0 0.72 0.9901
EPC-8 114.27 9358.4 0.72 0.9978
As one can see from the values given in the tables and presented in figures, the viscosity of all EPC solutions increases with the increase of the copolymer concentration. Even though all the samples are declared as the same commercial product, which implies the congenial polymers, there are significant differences regarding their viscosity properties and their viscosity dependence on concentration. The values of limiting viscosity numbers that are a measure of polymer / solvent interactions and directly proportional to the size of hydrodynamic coil of the polymer molecules in solution, are in range from 103.7 to 126.2 cm3 g-1. The slopes of Huggins' straight line b, which is a measure of polymer / polymer interaction, are in range from 8600 to 10300 cm6 g-2 (Table 6). At the same time, the values of Huggins' constants kH are changing within the range from 0.54 to 0.88. Generally, one can observe that the values of limiting viscosity numbers are higher for EPC samples that exhibit better solvent / polymer molecular interactions (kH values are around 0.5). Moreover, in that case, molecular polymer/ polymer interactions are less pronounced which is reflected in lower values of b (the slope of Huggins' straight line). Additionally, a statistical analysis of the viscometric study was carried out and results are given in Table 7.

The influence of small compositional and structural...... I. Šoljić Jerbić et al.
244 goriva i maziva, 52, 3 : 231-251, 2013.
Figure 6: Dependence of a reduced viscosity on weight concentration of the diluted EPC solutions in xylene at 30 °C.
Figure 7: Experimentally determined values of limiting viscosity numbers ([]) for the investigated diluted solutions of EPC samples (1-8) in xylene at 30 °C.

I. Šoljić Jerbić et al. The influence of small compositional and structural...
goriva i maziva, 52, 3 : 231-251, 2013. 245
Table 7: Statistical analysis of the results obtained by viscometric study
[η] / cm3 g-1 *R *Di *CV / % b /
cm6 g-2 *R *Di *CV / %
EPC-1 124.24 22.47 6.46 5.49 8642.7 2295.30 564.30 6.13
EPC-2 114.80 *xSi 2.98 2.53 9407.2 *xSi 200.20 2.17
EPC-3 103.71 117.78 14.07 11.94 9477.8 9207.00 270.80 2.94
EPC-4 126.18 * 8.40 7.13 8925.1 * 281.91 3.06
EPC-5 117.45 7.08 0.33 0.28 9502.1 682.20 295.11 3.21
EPC-6 121.54 RSD / % 3.76 3.19 8023.7 RSD / % 1183.32 12.85
EPC-7 120.03 2.25 1.91 10319.0 1112.00 12.08
EPC-8 114.27 6.01
3.51 2.98 9358.4 7.41
151.42 1.64
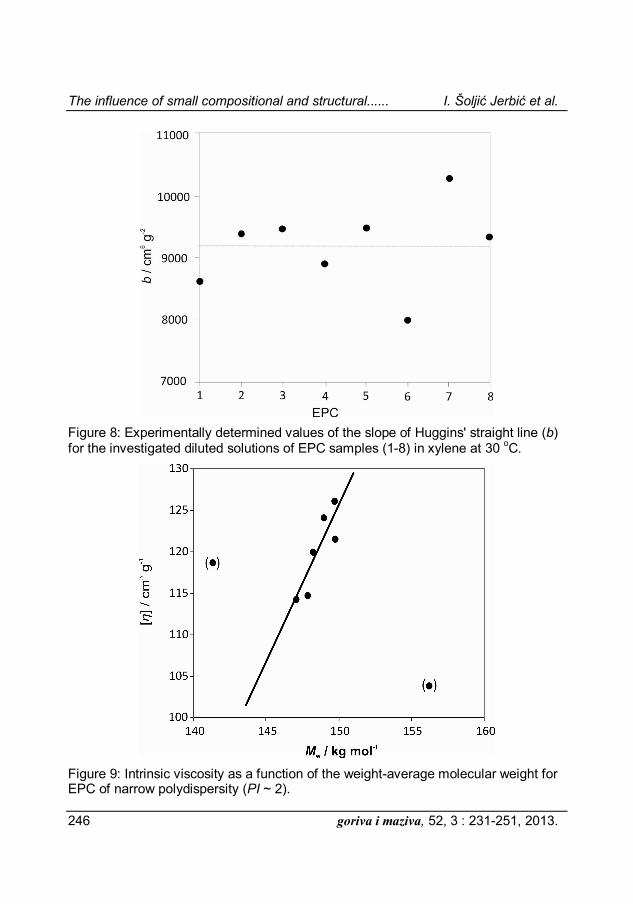
*R - range (difference between the min. and max. value); xSi – average value; - standard deviation; RSD - relative standard deviation; Di - mean deviation; CV - coefficient of variation (deviation from the mean value). The statistical analysis indicates that there are significant discrepancies between the examined EPC samples (batches), whereas the obtained [] and b are asymmetrically scattered around average values (see Figures 7 and 8). Thus, the calculated coefficient of variation (CV = Di / xsi . 100 %) for [] is in range from 0.28 (EPC-5) to 11.94 % (EPC-3) and for b from 1.64 (EPC-8) to 12.85 % (EPC-6) (Table 7). The variations of the results obtained by viscometry are probably a consequence of the small differences in composition and structural characteristics of the copolymer samples. Therefore, in the following part, a detailed analysis of the composition and structure of eight ethylene-propylene copolymer samples was conducted. The relationship between the intrinsic viscosity and the weight-average molecular weight Mw can be described by a linear dependence (Figure 9); with increasing Mw values, the intrinsic viscosity increases. Here, the weight-average molecular weights of the EPC-3 and EPC-5 solutions depart significantly from the linear dependence, and therefore are not taken into account. Although a literature finding [2] implies that the intrinsic viscosity increases with ethylene content increase in ethylene/propylene copolymers of equal molecular weight, the change of ethylene (propylene) content determined by 13C NMR cannot be directly related to the viscosity values.
The influence of small compositional and structural...... I. Šoljić Jerbić et al.
246 goriva i maziva, 52, 3 : 231-251, 2013.
Figure 8: Experimentally determined values of the slope of Huggins' straight line (b) for the investigated diluted solutions of EPC samples (1-8) in xylene at 30 oC.
Figure 9: Intrinsic viscosity as a function of the weight-average molecular weight for EPC of narrow polydispersity (PI ~ 2).

I. Šoljić Jerbić et al. The influence of small compositional and structural...
goriva i maziva, 52, 3 : 231-251, 2013. 247
3.5. Mathematical description In order to establish a relationship between all the key parameters, such as the ethylene content in a copolymer (x(E)), the weight-average (Mw) molecular weight values and the intrinsic viscosity of polymer solutions ([]), an empirical function derived by the Marquardt-Levenberg iteration algorithm was used and reasonable good fit (R2 = 0.9668) was obtained with the following equation:
[] = - 54.01 . 103 – 2.04 . 103 . Mw + 729.81 . x(E) + 2.20 . 102 Mw2 – 2.44 . x(E)2 (10)
Adequacy of the proposed empirical model was examined by analysis of variance (ANOVA) and results are presented in the Table 8. Table 8: Analysis of variance (ANOVA) for proposed model
Source *SS *DF *MS Fo-value p-value
Model 86768.9 5 17353.8
Residual 3.93 1 3.93
Total 86772.8 6 14462.1
4415.7 5.21 . 10-3
*R2 = 0.9668 *Adj. R2 = 0.8338
*PRESS = 4210.88 *Pred. R2 = 0.9515
*SS – sum of squares; DF – degrees of freedom; MS – mean square; R2 - the coefficient of multiple determination; Adj. R2 - the degree of freedom adjusted R-square; PRESS – predicted residual sum of squares; Pred. R2 – predicted R2. It can be observed that all calculated parameters indicate that the model is significant and describes very well the variability of experimental data. Figure 10 shows the plot of [] vs. Mw and x(E) obtained for the examined EPC samples; both the experimental data and the fitted surface obtained by equation (10) are plotted. With increasing weight-average molecular weights values, the intrinsic viscosity of the diluted polymer solutions increases, as well. Moreover, within the narrow range of composition with ethylene content from 0.42 to 0.54 mol. %, the lowest value of viscosity is obtained for that of 0.46 mol. %. Comparison of the calculated and experimentally determined values of intrinsic viscosity is shown in Figure 11. From the presented diagram it can be observed that points do not deviate significantly from the ideal line (R2 = 1) with R2 = 0.9668. This implies the ability of the model to predict the variability in new data in high percentage (about 95.2 %, see Table 8.). It is important to notice that the resulting function presents a possible approach and research methodology, but in order to obtain more detailed and reliable mathematical description, a greater number of samples is required (n > 8) which may cover wider range of ethylene content and molecular weight values.

The influence of small compositional and structural...... I. Šoljić Jerbić et al.
248 goriva i maziva, 52, 3 : 231-251, 2013.
Figure 10: Interdependence between the ethylene content (x(E)), the molecular weight values (Mw) and the viscosity of the diluted polymer solution ([]).
Figure 11: Comparison of the calculated (predicted by the model, []model) and experimentally determined values of intrinsic viscosity ([]exp).

I. Šoljić Jerbić et al. The influence of small compositional and structural...
goriva i maziva, 52, 3 : 231-251, 2013. 249
4. Conclusions In the formulation of lubricant, regarding both the economical and performance reasons, it is desirable to limit the amount of polymer needed to achieve a set of necessary rheological properties. In this work, it was established that even small differences of composition and structure of additive based on the amorphous ethylene-propylene copolymer (EPC) significantly influence its viscometric behavior. Therefore, understanding of the dependencies between the composition and structure, and application characteristics such as viscosity i.e. thickening efficiency is necessary for the achieving of an optimal performance of a polymeric additive. Acknowledgements The financial support of the Ministry of Science, Education and Sports of the Republic of Croatia (Grant No. 125-1251963-1980) is acknowledged.
References 1. R.M. Mortier, S.Y. Orszulik. Chemistry and Technology of Lubricants. 2nd ed, Chapman and Hall. London, 1997. 2. L.R. Rudnick. Lubricant Additives: Chemistry and Applications. CRC Press. Wilmington 2003. 3. G. Ver Strate, M.J. Struglinski. Polymers as Lubricating Oil Viscosity Modifiers; in Schulz, D.N. and Glass, J.E. eds. Polymers as Rheology Modifiers; ACS Symposium Series 462, American Chemical Society: Philadelphia, 1991, p. 256-272. 4. M. Kakugo, Y. Naito, K. Mizunuma, T. Miyatake. Carbon-13 NMR determination of monomer sequence distribution in ethylene-propylene copolymers prepared with δ-titanium trichloride-diethylaluminum chloride. Macromolecules 1982; 15:1150. 5. T. Hayashi, Y. Inoue, R. Chujo. Ethylene-propylene copolymerization mechanism based on the sequence distributions determined by carbon-13 NMR spectra. Macromolecules 1988; 21: 3139. 6. D. Zi-Xiu, X. Jun-Ting, Q. Dong, F. Zhi-Qiang. Thermal fractionation and effect of comonomer distribution on the crystal structure of ethylene–propylene copolymers. Polymer 2009; 50: 2510. 7. F.J. Zhang, J.P. Liu, H.Y. Fu Q Huang, Z.J Hu, S. Yao et al. Polydispersity of ethylene sequence length in metallocene ethylene/α-olefin copolymers. I. Characterized by thermal-fractionation technique. J Polym Sci Part B Polym Phys 2002; 40: 813. 8. F.J. Zhang, Q. Fu, T.J. Lu, H.Y. Huang, T.B. He. Improved thermal fractionation technique for chain structure analysis of ethylene/α-olefin copolymers. Polymer 2002; 43: 1031. 9. M. Bohdanecky, J. Kovář. Viscosity of polymer solutions. Elsevier. Amsterdam, 1982.

The influence of small compositional and structural...... I. Šoljić Jerbić et al.
250 goriva i maziva, 52, 3 : 231-251, 2013.
10. A. Jukić, M. Rogošić, I. Bolarić, Lj. Tomašek, Z. Janović. Viscometric study of miscibility and interactions of some polyolefins and poly(alkyl methacrylates) in dilute xylene solutions. J Mol Liq 2004; 112: 161. 11. A. Jukić, Lj. Tomašek, Z. Janović. Polyolefin and poly(alkyl methacrylate) mixed additives as mineral lubricating oil rheology modifiers. Lubr Sci 2005; 17: 431. 12. I.D. Rubin, M.M. Kapuscinski. Viscosities of ethylene-propylene-diene terpolymer blends in oil. J Appl Polym Sci A 1993; 49: 111. 13. I.D. Rubin, A.J. Stipanović, A. Sen. Effect of OCP structure on viscosity in oil. Soc Automot Eng Tech Paper 1990; Ser. No. 902092. 14. I.D. Rubin. Polymers as lubricant viscosity modifiers. Polym Preprints, Am Chem Soc Div Poly Chem. 1991; 32: 84. 15. M.M. Kapuscinski, A. Sen, I.D. Rubin. Solution Viscosity Studies on OCP VI Improvers in Oils. Soc Automot EngTech Paper 1989; Ser. No. 892152. 16. M.J. Kucks, H.D. Ou-Yang, I.D. Rubin. Ethylene-propylene copolymer aggregation in selective hydrocarbon solvents. Macromolecules 1993; 26: 3846. 17. I.D. Rubin, A. Sen. Solution viscosities of ethylene-propylene copolymers in oils. J Appl Polym Sci 1990; 40: 523. 18. A. Sen, I.D. Rubin. Molecular structure and solution viscosities of ethylene-propylene copolymers. Macromolecules 1990; 23: 2519. 19. C.J. Carman, K.C. Baranwal. Molecular structure of elastomers determined with carbon-13 NMR. Rubber Chem Technol 1975; 48: 705. 20. Carman, C.J.; Harrington R.A.; Wilkes, C.E. Monomer sequence distribution in ethylene-propylene rubber measured by 13C NMR. 3. Use of reaction probability model. Macromolecules 1977; 10: 536. 21. C.E. Wilkes, C.J. Carman, R.A. Harrington. Monomer sequence distribution in ethylene-propylene terpolymers measured by 13C Nuclear magnetic resonance. J Polym Sci Symp 1973; 43: 237. 22. S. Di Martino, M. Kelchtermans. Determination of the composition of ethylene-propylene rubbers using 13C-NMR spectroscopy. J Appl Poly Sci 1995; 56: 1781-1787. 23. J.C. Randal. Polymer sequence determinations: Carbon-13 NMR Method. Academic Press: New York, 1977, p. 53-138. 24. M. Nekoomanesh, G,H. Zohuri, M.M. Mortazavi, R. Jamjah, S. Ahmadjo. Structural Analysis of Ethylene/Propylene Copolymer Synthesized Using High Activity Bi-supported Ziegler-Natta Catalyst. Iranian Polym J 2005; 14: 793. 25. G. Singh, A.V. Kothari, V.K. Gupta. Triad sequence determination of ethylene-propylene copolymers – application of quantitative 13C NMR. Polym Test 2009; 28: 475. 26. L.-M. Tang, Y.-G. Li, W.-P. Ye, Y.-S. Li. Ethylene–Propylene Copolymerization with Bis (-enaminoketonato) Titanium Complexes Activated with Modified Methylaluminoxane. J Polym Sci Part A Polym Chem 2006; 44: 5846. 27. Y. Feng, J.N. Hay. The characterization of random propylene-ethylene copolymer. Polymer 1997; 39: 6589.

I. Šoljić Jerbić et al. The influence of small compositional and structural...
goriva i maziva, 52, 3 : 231-251, 2013. 251
28. D.W. Marquardt. An Algorithm for the Least-Squares Estimation of Nonlinear Parameters. SIAM J Appl Math 1963; 11: 431. 29. K.A. Levenberg. Method for the Solution of Certain Non-linear Problems in Least Squares. Quarterly Appl Math 1944; 2: 164. 30. W.J.Wang, S. Zhu. Structural analysis of ethylene/ propylene copolymers synthesized with a constrained geometry catalyst. Macromolecules 2000; 33: 1157. 31. H.N. Cheng. 13C NMR Analysis of ethylene-propylene rubbers. Macromolecules 1984; 17: 1950. 32. N. Tanaka. Characteristics of glass transition in propylene/ethylene copolymers and polyethylene. Thermochim Acta 2001; 374: 1. 33. M.L. Huggins. The viscosity or dilute solutions of long-chain molecules. IV. Dependence on concentration. J Am Chem Soc 1942; 64: 2716. Authors Ivana Šoljić Jerbić, Tomislav Penović, Elvira Vidović, Ante Jukić* University of Zagreb, Faculty of Chemical Engineering and Technology, Zagreb, Croatia *Corresponding author. Tel.: 00385 1 4597125. E-mail address: [email protected] Received 04.06.2013. Accepted 26.08.2013.


