The impact of the global financial crisis on social ... impact of the global financial crisis on...
31
The impact of the global financial crisis on social services in Australia An Issues Paper prepared by Access Economics for Anglicare Australia, Catholic Social Services Australia, The Salvation Army and UnitingCare Australia November 2008 Embargoed until 1.00am Wednesday 26 November
Transcript of The impact of the global financial crisis on social ... impact of the global financial crisis on...

The impact of the global financial crisis on social
services in Australia
An Issues Paper prepared by Access Economics for Anglicare Australia, Catholic Social Services Australia,
The Salvation Army and UnitingCare Australia
November 2008
Embargoed until 1.00am Wednesday 26 November

The impact of the global financial crisis on social services
1
TABLE OF CONTENTS
EXECUTIVE SUMMARY........................................................................................................2
1. Introduction ....................................... ..........................................................................3
2. Background: an overview of the financial crisis.... ...................................................5 2.1 Origins of the global financial crisis......................................................................................5 2.2 Impacts on the real economy...............................................................................................5 2.3 Implications for the economic outlook..................................................................................6
3. Australia’s economic outlook....................... ..............................................................7 3.1 Macroeconomic overview ....................................................................................................7 3.2 Key impacts on low-income households............................................................................14
4. Implications for social services ................... ............................................................18 4.1 The social services sector..................................................................................................18 4.2 Services provided to individuals and families ....................................................................19 4.3 Capacity of the system to deliver .......................................................................................25
5. Conclusions........................................ .......................................................................28
6. References......................................... ........................................................................29
FIGURES Figure 3.1: Real GDP growth 7 Figure 3.2: Change in average equivalent gross income, 2001 to 2006 8 Figure 3.3: Unemployment and labourforce participation 10 Figure 3.4: Jobs growth and employment, 2000 to 2008 10 Figure 3.5: Annualised inflation rate (% change in headline CPI) and interest rates 12 Figure 3.6: Average vacancy rates across Australia 15 Figure 3.7: CBA/HIA Housing Affordability Index 15
TABLES Table 3.1: Summary of economic growth forecasts 9 Table 3.2: Summary of unemployment forecasts for 2009 and 2010 11 Table 3.3: Summary of inflation forecasts 13 Table 3.4: Summary of budget aggregates, 2008-09 to 2011-12 14 Table 3.5: Growth in CPI and selected components 16 Table 4.1: Number of people assisted and not assisted by service type in 2006-07 19 Table 4.2: Home ownership status 21 Table 4.3: Reason for seeking financial counselling 23 Table 4.4: Household financial stress^ 24

The impact of the global financial crisis on social services
2
EXECUTIVE SUMMARY
The current global financial crisis and its likely impact on the Australian economy will have an acute impact on the most disadvantaged members of society, as well as pushing increased numbers of low and middle income earners to seek the services of welfare agencies. Even during the recent period of buoyant economic conditions, agencies were reporting growing demand, and the emergence of a new clientele of ‘mid—stream’ wage earners facing severe financial stress. This has been mirrored by academic research into new indicators of disadvantage. Instability in the financial sector and its flow—on effects to the rest of the economy, can only exacerbate these problems, putting an even greater strain on what are already overstretched social services.
The years immediately before the crisis were characterised by a combination of easy credit conditions, low risk premiums, aggressive lending practices and less disciplined risk management and underwriting standards. The collapse of the sub—prime housing market in the United States has been followed by a global credit crunch, and falling asset prices, with serious implications for the real economy. There is reduced household wealth, Australia’s terms of trade have decreased, and business and consumer confidence has been eroded.
Economic growth will inevitably slow, the extent to which is uncertain. Unemployment will rise, if not perhaps to the levels of previous recessions. Despite declining interest rates, it is likely that housing costs will remain high, particularly for those in rental accommodation. The impact will vary across different segments of society, with the unemployed and other vulnerable groups particularly hard it.
The demand for social services is already rising and will rise substantially in the short-term. In many areas — examples include residential aged care, housing, homelessness and family relationship services — demand already outstrips the capacity of agencies to offer assistance. The services most immediately affected by deteriorating economic conditions are in employment, housing, financial and general counselling and emergency relief.
In addition to being the response of a genuinely civil society, high quality, social services are an integral part of a productive economy. Investment in such services is a benefit not just to those in such desperate need of services, but also reduces long term social costs and enhances the overall productivity of the economy. Investment in social services and social infrastructure should therefore be considered as an essential part of further fiscal stimulus measures.

The impact of the global financial crisis on social services
3
1. INTRODUCTION
The purpose of this paper is to consider the nature and magnitude of the potential impact on Australia’s social services sector of the global financial crisis and its effects on the Australian economy. It has been commissioned by four of Australia’s peak church welfare agencies:
� Anglicare Australia is the peak body for a national network of locally based and governed Anglican care organisations serving the needs of disadvantaged Australians and their communities. Anglicare Australia seeks to influence social and economic policy to advocate for a society where the contribution, dignity and participation of everyone is equally valued, and through its network provides a wide range of services to people in need and works to address issues of injustice across the nation. In 2007 Anglicare agencies served over 426,000 clients in rural, remote, regional and urban communities using the services of 12,000 staff and 20,000 volunteers.
� Catholic Social Services Australia is the Catholic Church’s principal national body for social services. It advises the Australian Catholic Bishops Conference on social policy issues as well as supporting the delivery of a wide range of social service programs and is the Church's public voice on social policy and social services issues. For 50 years, Catholic Social Services Australia has assisted and promoted better social policy for the most disadvantaged people in Australian society. It has 67 member organisations that employ over 10,000 people and provide 500 different services to over a million people each year from sites in metropolitan, regional and rural Australia.
� The Salvation Army is an international movement that is an evangelical part of the Christian Church and has provided service to the Australian community for over 125 years. Part of the Salvation Army's mission involves meeting human need wherever it occurs, without discrimination, and it provides a myriad of services throughout Australia including aged care, court and prison services, crisis and support accommodation, employment services, financial and telephone counselling and youth support through its 520 centres across Australia.
� UnitingCare Australia is a national agency of the Uniting Church in Australia and represents the nationwide network of over 400 UnitingCare community services. The UnitingCare network is one of the largest providers of community services in Australia, providing services to more than two million Australians each year, employing 35,000 staff and 24,000 volunteers nationally. It provides services to older Australians, children, young people and families, Indigenous Australians, people with disabilities, the poor and disadvantaged, people from culturally diverse backgrounds and older Australians in urban, rural and remote communities.
These networks deliver the overwhelming majority of the country’s non-government social services, dealing with more than four million Australians each year. Perhaps more importantly, in addition to delivering services, they are an integral part of thousands of local communities and play an important role in enhancing social inclusion and cohesion.
Even before the current financial crisis — during a period of strong economic growth — social welfare agencies had noted an increase in demand for their services. Most significantly, agencies began to see a new type of client: low and middle income earners facing severe financial stress. Among the contributing factors are high rent or mortgage increases; fuel and food costs; utilities bills; medical fees; and childcare costs. (See Anglicare Australia 2008: ch.1.)

The impact of the global financial crisis on social services
4
Academic research has also investigated new indicators of disadvantage, to more accurately identify those who have been marginalised in 21st century Australia. (See, for example, Saunders et al. 2007; Vinson 2007.)
The serious dislocation of the international finance system can only serve to exacerbate this problem, and potentially cause many more difficulties for not only Australia’s most disadvantaged, but certain middle income earners also. It is the task of this report to identify relevant issues and discuss possible implications, with a view to recommending a way for the Federal Government and the social services sector to deal with this significantly increased demand.
In discussing the financial crisis and Australia’s economic outlook, the paper provides forecasts for key economic variables and focuses on the resulting pressures faced by low-income households. This analysis informs the critical discussion on the potential increased demand for social services and possible government policy responses that may assist low-income households and the social services agencies that support them.
The remainder of the paper is structured as follows:
� Section 2 presents an overview of the global financial crisis, including the implications for the real economy.
� Section 3 discusses Australia’s economic outlook, with a particular focus on the major impacts on low-income households.
� Section 4 provides an overview of the current and likely future demand for social services in Australia given the economic outlook. Some implications for government policy are also canvassed.
� Section 5 concludes the report.

The impact of the global financial crisis on social services
5
2. BACKGROUND: AN OVERVIEW OF THE FINANCIAL CRISIS
2.1 ORIGINS OF THE GLOBAL FINANCIAL CRISIS
The years immediately before the credit crisis were characterised by a combination of easy credit conditions, low risk premiums, aggressive lending practices and less disciplined risk management and underwriting standards. The easy money conditions encouraged financial institutions and investors to adopt more leveraged strategies, leaving their capital bases more exposed to adverse developments.
Securitisation flourished, making possible the creation and distribution of large volumes of financial securities backed by the cash flows from, for example, residential mortgages, and tailored to better meet the risk and return preferences of investors. However, this improved risk allocation came at the cost of greater complexity and reduced transparency.
After US house prices started falling and interest rates began rising, the least creditworthy (sub-prime) borrowers began defaulting, causing losses to investors in mortgage-backed securities. Although the potential losses from defaults could be absorbed by the system, the losses for some individuals were too big for them to bear. Unfortunately, the nature of the securities made it difficult for investors, institutions and authorities to know the scale and dispersion of exposures and potential losses throughout the financial system.
As losses mounted and trust in counterparties deteriorated, credit markets ceased functioning properly. While signs of stability have started to emerge, credit conditions remain tight and asset prices volatile. Moreover, it will take time to rebuild confidence and trust between counterparties. It is too soon to rule a line under the credit crisis, and in any case, even if the most severe aspects of the crisis have passed and interbank lending markets resume operating efficiently, the impacts of the crisis will persist well into the future.
2.2 IMPACTS ON THE REAL ECONOMY
Global financial turmoil has resulted in a global financial slowdown — the biggest shock to global financial markets since the 1930s. Some sectors in the financial markets have shut down altogether and others are simply dysfunctional. The capital markets, where financial intermediaries and companies borrow money to fund their investments and, increasingly, their day-to-day running costs, are most notably affected. Risk premiums demanded by lenders have jumped and even creditworthy borrowers are having trouble obtaining sufficient funds. All companies and households are affected.
Prices for many assets have fallen a long way. In the year to October 2008 world stock markets lost 40% of their value and the Australian market fell by the same margin. The resulting loss of wealth is hurting investors and causing many companies to fail (including the likes of ABC Learning — a major social service provider) and a number of key financial intermediaries. Moreover, it is directly hurting households through significantly reducing household wealth and, by extension, household consumption levels. In its latest Quarterly Statement, the Reserve Bank of Australia (RBA) notes:

The impact of the global financial crisis on social services
6
‘Although estimates of the effect of wealth on consumption spending are subject to a high degree of uncertainty — some estimates suggest that a change in household wealth of one dollar results in a long—run change in consumption of around 4 cents — the fall in wealth that has occurred is sufficiently large to have a material effect on household spending over the coming period.’ (RBA 2008a: 66)
With the value of the ASX alone falling by more than 40%, the fall in wealth over the last twelve months is more than sufficient to have a significant effect on household consumption and hence on economic growth over the near-term.
Low income households, especially in the bottom income quintile, generally have very low levels of household wealth holding, relying heavily on wage income. If these households do have an asset it is often their family home. Increasing job losses will severely impact on income streams and spending power including the capacity of low-income households to service mortgages. The potential result could be the loss of even the modest non-income economic assets held by low-income households.
The financial crisis has also resulted in a significant fall in commodity prices, the source of much of Australia’s income growth over recent years. While most commodities are locked into short-term contracts, it is likely that as these contracts come up for renegotiation, prices will fall significantly. In the face of this, there are signs that mining-related investment in Australia is already being scaled back. Any reduction in investment spending will flow through to other related sectors of the economy, as well as reducing future employment in mining-related industries. Lower commodity prices also mean lower profits in the mining sector, which will reduce future tax revenue, with a corresponding impact on the Government’s fiscal position.
In the more immediate term, the global financial crisis has resulted in swift action by policy makers, both domestically and abroad. Governments and central banks have been forced to introduce radical and often expensive measures, including part-nationalisation of some of the world’s largest banks and insurers, while switching to expansionary monetary and fiscal positions (that is, increasing net Government spending and lowering official interest rates).
2.3 IMPLICATIONS FOR THE ECONOMIC OUTLOOK
While tentative signs are emerging that the interbank lending market is beginning to function efficiently again, it is still far from clear that the worst of the financial crisis is behind us. However even if conditions in financial markets do begin to significantly improve, the implications of events that have already occurred will take some years to work their way through the economy. How this will play out over coming years is uncertain. However, two possible scenarios warrant consideration:
� Australia could enter a sustained economic slowdown — similar to that experienced by Japan following the Asian Financial Crisis — in which the impacts of the crisis place a long-term constraint on economic growth.
� Alternatively, fundamental differences between the nature of financial markets today — particularly Australia’s — and those of the nations directly involved in past financial crisis, might allow economic growth in Australia to resume at robust levels after a relatively short slowdown.

The impact of the global financial crisis on social services
7
3. AUSTRALIA’S ECONOMIC OUTLOOK
The outlook for the Australian economy has deteriorated markedly over recent months. The global financial crisis, which is now affecting the real economy, has dampened growth prospects by diminishing the availability of credit, reducing household wealth, decreasing Australia’s terms of trade and eroding business and household confidence. While inflation is moderating and interest rates are falling, economic growth is projected to slow and, with it, unemployment is forecast to rise.
This section provides an overview of the outlook for the Australian economy, discussing forecasts for key economic variables, before focusing more directly on those aspects of the economy likely to impact most heavily on low-income households and therefore, the services on which these households depend.
3.1 MACROECONOMIC OVERVIEW
3.1.1 ECONOMIC GROWTH
The Australian economy has experienced an unprecedented period of economic growth (measured in percentage change in real gross domestic product) since the 1991 recession, growing at an average annual rate of 3.6%. Real GDP expanded by 4.2% in the year to June 2007 and 2.7% in the year to June 2008 (Figure 3.1).
FIGURE 3.1: REAL GDP GROWTH
-2%
0%
2%
4%
6%
8%
1986
1988
1990
1992
1994
1996
1998
2000
2002
2004
2006
2008
change on year earlier
However, the extent to which Australians have shared in this prosperity has varied. As Figure 3.2 shows, average incomes increased more rapidly over the period 2001 to 2006 in higher income areas than in those at the lower end of the income distribution.

The impact of the global financial crisis on social services
8
While the average incomes of the one-tenth of the population living in the poorest areas increased by 29.2%, the incomes of the middle increased by about 30%; and the incomes of the top one-tenth grew by around 36.5% — an indication of a growing divide between the richer and poorer neighbourhoods during the five years (NATSEM 2008:4). These findings are consistent with those identified in the Dropping off the Edge report commissioned by Catholic Social Services Australia and Jesuit Social Services (Vinson 2007).
FIGURE 3.2: CHANGE IN AVERAGE EQUIVALENT GROSS INCOME , 2001 TO 2006
0
5
10
15
20
25
30
35
40
Bottom10%
Decile 2 Decile 3 Decile 4 Decile 5 Decile 6 Decile 7 Decile 8 Decile 9 Decile 10
Per
cent
incr
ease
Source: NATSEM (2008:4)
Deciles refers to spatial income deciles
The outlook
Economic growth in Australia is now slowing rapidly, real GDP growing by just 0.3% in the June 2008 quarter. With household consumption and business investment falling, signs are emerging that the financial crisis is already weighing on economic growth.
The International Monetary Fund’s latest figures forecast world economic growth of around 2.2% in 2009, compared with 5% in 2006 and 2007. Output from advanced economies is expected to shrink for the first time since World War II (by ¾%). Emerging economies are still expected to expand by 5%, although the outcome is heavily dependent on China’s fortunes.
Despite a much anticipated and now extremely evident slowing, Australia looks likely to be one of the few advanced countries to avoid a recession. Coming off a base of relatively high interest rates and with strong fiscal positions at federal and in many cases state level, Australian policy makers have ample capacity to utilise the policy levers at their disposal to lessen the impacts on the economy. Further mitigating the impacts of the global slowdown has been the increased competitiveness flowing from a 25% fall in the trade-weighted exchange rate and the associated boost to the local-currency earnings of exporters (partially offsetting the considerable falls in commodity prices).

The impact of the global financial crisis on social services
9
Relative to recent years, the outlook for growth is decidedly uncertain. While there is a broad consensus that economic growth will slow, the extent of this slowing —which hinges, among other things, on the prospects of the Chinese economy — is less clear. Access Economics forecasts economic growth moderating from its 2007-08 level of 3.7% to 2.1% in 2008-09 before rebounding to 3.3% in 2009-10. This sits mid-range in the forecasts of market economists, but above that of the Federal Treasury and the RBA (Table 3.1). All forecasters caution, however, that a more rapid and/or deeper economic slowing in China will result in further downward revisions in Australia’s growth forecasts.
TABLE 3.1: SUMMARY OF ECONOMIC GROWTH FORECASTS
Source 2008-09 2009-10
Federal Treasury 2.0% 2.25%
Reserve Bank of Australia 1.5% 3.0%
Access Economics 2.1% 3.3%
Source: Access Economics, RBA (2008a:68) Federal Treasury (2008:6)
In reality, these projections present an essentially similar outlook for economic growth over the coming years — a conservative view of how the economy may be impacted by the financial crisis. However, there is a clear risk that the impacts of the crisis will be considerably greater than this and the longer these risks build, the longer it takes for a degree of confidence and trust to return to the core parts of the global financial system. Accordingly, rather than a modest economic slowdown, the Australian economy may enter a major downturn, with growth constrained to one per cent or less for several years.
3.1.2 JOBS GROWTH AND UNEMPLOYMENT
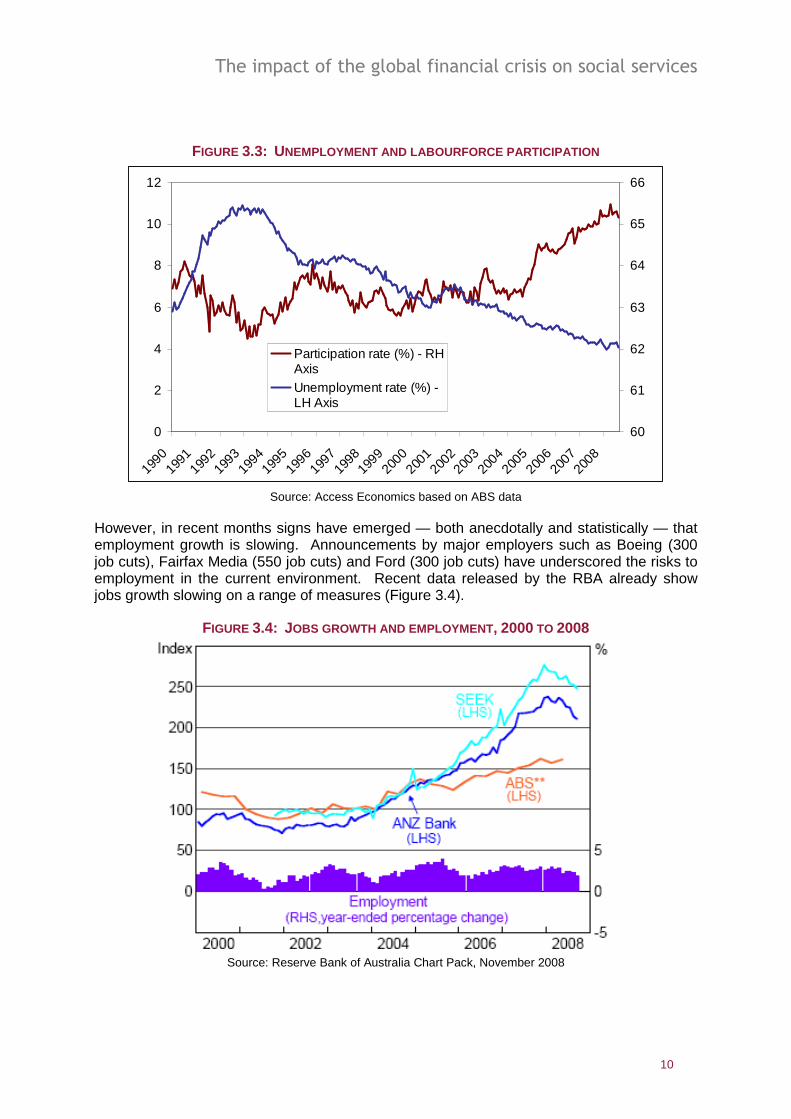
A decade and a half of sustained economic growth has seen labour force participation (the proportion of the population aged 15 and over who are working or actively seeking employment) reach historic highs and unemployment historic lows (Figure 3.3). In 2008 the participation rate peaked at 65.3%, more than two percentage points above levels of the previous decade (driven predominantly by increased participation among women). At the same time, unemployment reached its lowest level in more than 30 years — just 4.1%.
While such measures are instructive, suggesting strong prospects for jobseekers over recent years, they can mask underlying factors such as workforce withdrawal and underemployment. In the case of underemployment — individuals who are working, but would prefer to be working more — financial stress may be experienced, despite the individual being classified as employed.
The strong overall picture of employment participation is not evident in communities living with multiple and concentrated disadvantages (such as those identified by Vinson (2007)). Unemployment levels are significantly higher in these communities and existing employment support programs have not addressed the significant barriers people face when trying to get and keep a job — including accessing skills development, childcare, transport and support following placement in a job.
The impact of the global financial crisis on social services
10
FIGURE 3.3: UNEMPLOYMENT AND LABOURFORCE PARTICIPATION
0
2
4
6
8
10
12
1990
1991
1992
1993
1994
1995
1996
1997
1998
1999
2000
2001
2002
2003
2004
2005
2006
2007
2008
60
61
62
63
64
65
66
Participation rate (%) - RHAxisUnemployment rate (%) -LH Axis
Source: Access Economics based on ABS data
However, in recent months signs have emerged — both anecdotally and statistically — that employment growth is slowing. Announcements by major employers such as Boeing (300 job cuts), Fairfax Media (550 job cuts) and Ford (300 job cuts) have underscored the risks to employment in the current environment. Recent data released by the RBA already show jobs growth slowing on a range of measures (Figure 3.4).
FIGURE 3.4: JOBS GROWTH AND EMPLOYMENT , 2000 TO 2008
Source: Reserve Bank of Australia Chart Pack, November 2008

The impact of the global financial crisis on social services
11
The outlook
The outlook for employment over the period ahead suggests employment growth slowing and unemployment rising. As economic growth falls, so too will demand for labour; consumer spending will slow and businesses defer investment plans. Compared with the quarter of a million jobs created in the year to June 2008, the Treasury forecasts just 80,000 new jobs in the year to June 2009. Reflecting this, it forecasts unemployment rising to 5% by the June quarter 2009 and 5.75% by the June quarter 2010.
Access Economics’ forecast for unemployment is somewhat more adverse, although still only mid-range among Consensus Economics’ survey of market economists. In 2009 Access Economics projects unemployment rising to 5.4% (coincidently, the mean among market economists) while by 2010 this figure is forecast to reach 6%. The November 2008 Consensus Economics survey suggests the highest forecast among market economists at present is an unemployment rate of 6.3% in 2009 (Consensus Economics, 2008).
TABLE 3.2: SUMMARY OF UNEMPLOYMENT FORECASTS FOR 2009 AND 2010
Forecaster 2009 2010 Federal Treasury 5.0% 5.75%
Access Economics 5.4% 6.0%
Consensus high 6.3% n/a
Consensus mean 5.4% n/a
Consensus low 4.6% n/a
Source: Access Economics, Consensus Economics (2008) and Federal Treasury (2008:6)
Again, these forecasts present a conservative view of potential unemployment levels in coming years. However if the impacts of the financial crisis on economic growth turn out to be greater than central forecasts suggest, so too will be the impacts on unemployment. As past recessions have shown, economic slowdowns can result in significant and relatively rapid increases in both overall unemployment and the proportion who are long-term unemployed (subject to some lag). For example, during the recession of the early 1990s, unemployment rose from 6% in April 1990 to 10% in December 1991. At the same time, the proportion of those unemployed who had been without work for more than 52 weeks increased from 24.8% in June 1991 to 34.6% in June 1992 (ABS 2008).
As well as rising unemployment, there is likely to be a shift toward part-time and casual employment and away from full-time positions. As the economic outlook becomes increasingly uncertain, and with demand and output slowing, employers will look to the flexibility of casual and part-time workers to manage risk. While a part-time job is far preferable to no job at all, the pressure on certain households will be compounded by the fact that many of those who remain employed will be working fewer hours over the short term.
Less skilled workers are at higher risk of involuntary casual and part-time employment. These people will be disproportionately affected by increasing levels of casual and part-time work as employers adapt to a slowing economy. Competition for jobs may also be greater as many older workers who had been planning to retire may defer retirement to build up their superannuation assets.

The impact of the global financial crisis on social services
12
3.1.3 INFLATION AND INTEREST RATES
Sustained economic growth in Australia has seen strong demand combine with supply-side constraints (such as a skills shortages and gaps) to push inflation beyond the RBA’s medium-term target range of 2-3%. Indeed over the past year growth in the consumer price index (CPI) has accelerated well beyond this level, with the latest data release showing that inflation rose by 1.2% in the September quarter, or 5.0% in annual terms (Figure 3.5).
The emergence of rising inflation has seen the RBA respond with a series of interest rate rises aimed at dampening demand and slowing Australia’s economy to a more sustainable growth path. Between May 2002 and March 2008, official interest rates (the cash rate) rose by 2.75 percentage points, from 4.5% to 7.25% (Figure 3.5). Increases in official interest rates were reflected in rising mortgage rates, which, especially over the last 12 months, have been pushed higher by credit shortages/rationing resulting from the global financial crisis.
More recently, as the magnitude and pervasiveness of the global financial crisis has become apparent, the Bank has responded with sizeable cuts to official interest rates (not reflected in Figure 3.5), decreasing the cash rate by one percentage point in October and a further 0.75 percentage points in November.
FIGURE 3.5: ANNUALISED INFLATION RATE (% CHANGE IN HEADLINE CPI) AND INTEREST RATES
Cash rate
Standard mortgage rate
Interest rate spread
Inflation
0%
1%
2%
3%
4%
5%
6%
7%
8%
9%
10%
Sep-0
1
Mar
-02
Sep-0
2
Mar
-03
Sep-0
3
Mar
-04
Sep-0
4
Mar
-05
Sep-0
5
Mar
-06
Sep-0
6
Mar
-07
Sep-0
7
Mar
-08
Sep-0
8
Source: Access Economics based on RBA (2008c) and RBA (2008d)
The outlook
Among both market economists and major Government agencies there is a broad consensus that inflation in Australia has peaked. While it is likely to stay above-average in the near-term, over the medium-term it is widely forecast to fall back within the RBA’s target range. Though the rapid depreciation of the Australian currency has placed upward pressure on import prices, substantial falls in commodity prices, notably the price of crude oil, together with a slowing of demand and an easing of capacity constraints, is forecast to see inflation fall back below 3% by late 2009/ early 2010. Table 3.3 summarises inflation forecasts for 2008-09 and 2009-10.

The impact of the global financial crisis on social services
13
TABLE 3.3: SUMMARY OF INFLATION FORECASTS
Source 2008-09 2009-10 Federal Treasury1 3.5% 3.0%
Reserve Bank of Australia2 4.0% 2.5%
RBA survey of market economists
3.4% 2.6%
Access Economics 4.5% 2.9%
Source: Access Economics, Treasury (2008:6), RBA (2008a:68).
As the global financial crisis has unfolded, Australia’s monetary policy stance has shifted relatively rapidly from a contractionary to an expansionary one. That is, from one of constraining demand to contain inflation to one of boosting demand to stimulate economic activity and enhance the long term productive capacity of the economy. Forecasted declining economic growth and falling inflation, together with continued concerns about the strength of the global economy (in particular the strength of Australia’s major trade partners — principally China), are likely to see the RBA continue to cut official interest rates over the short term, with the cash rate forecast to fall by a further 1-2 percentage points over the coming 12 months.
3.1.4 THE FISCAL OUTLOOK
The global financial crisis and the resulting impact on the real economy have seen major revisions to government budgets, particularly that of the Federal Government. Severe falls in asset prices will reduce capital gains tax inflows, while falling commodity prices and declining demand will reduce company profits, hence corporate tax revenue. As a result, tax revenues will be considerably below levels forecast at this year’s Budget. Indeed, expected taxation receipts have been revised down by $4.9 billion in 2008-09, by $12.2 billion in 2009-10, by $12.4 billion in 2010-11 and $7.9 billion in 2011-12. At the same time, the Federal Government’s response to the crisis, which, among other things, has included a $10.2 billion economic stimulus package, is increasing government outlays. Cash payments in 2008-09 are now estimated to be $10.6 billion higher than estimated in the 2008-09 Budget.
The combined impact of reduced tax revenues and increased expenditure has been a substantial downward revision in the Federal Government’s underlying cash surplus. In the recently released Mid-Year Economic and Fiscal Outlook, Treasury now estimates a surplus of just $5.4 billion in 2008-09 (down from the Budget forecast of $21.7 billion — see Table 3.4). Similarly, forecasts for 2009-10 now suggest a budget surplus of just $3.6 million, compared with the $19.6 billion at Budget. Forward estimates for the out years have been similarly revised down.
1 Mid-Year Economic and Fiscal Outlook (November 2008). 2 Statement on Monetary Policy (November 2008).

The impact of the global financial crisis on social services
14
TABLE 3.4: SUMMARY OF BUDGET AGGREGATES , 2008-09 TO 2011-12
2008-09 (Budget
estimate)
2008-09 (Revised estimate)
2009-10 (Budget
estimate)
2009-10 (Revised estimate)
2010-11 (Revised estimate)
2011-12 (Revised estimate)
Underlying cash balance
$21.7b $5.4b $19.7b $3.6b $2.6b $6.7b
% of GPD 1.8 0.4 1.5 0.3 0.2 0.5
Fiscal balance $23.1b $5.8b $22.4b $7.1b $6.7b $10.1b
% of GDP 1.9 0.5 1.7 0.6 0.5 0.7
Source: Federal Treasury (2008:4)
3.2 KEY IMPACTS ON LOW-INCOME HOUSEHOLDS
The forecast for Australia’s economy outlined above paints a picture of slowing economic growth and rising unemployment coupled with falling inflation and declining interest rates. Invariably however, different segments of the economy and society will be affected in different ways. Some will be hit disproportionately hard, while others may benefit (primary producers, for example, who gain from increased returns associated with the depreciating Australian currency).
Drawing on the broad conclusion above, and as a precursor to the discussion of social services in Australia, this section outlines some of the key impacts facing low—income households as a result of recent economic conditions and the economic outlook.
���� Rising unemployment
As noted, slowing economic growth will see unemployment rise, and employment shift towards part-time and casual positions. Being closely correlated with household income, employment has a major bearing on welfare. As employment levels fall therefore, and as the composition of employment shifts towards part-time and casual positions, increasing numbers of households will find themselves under financial stress and socially excluded. At the same time, those who are currently unemployed will face greater competition from recently redundant workers, and therefore face greater challenges finding employment. With workers who have recently exited the workforce likely to be more attractive to employers when conditions improve, particularly relative to the long-term unemployed, the pending economic slowdown will also impact heavily on those who are already facing significant barriers to finding employment.
���� Sustained housing cost increases
Recent strong economic growth has seen the costs of housing — both house prices and rents — increase strongly in all capital cities and in many regional and rural areas. Spurred to some extent by strong performance in other asset classes, the partly investor-driven, partly demography-driven increase in house prices has seen a rise by an average of 73% since 2002.
At the same time, and reflecting the difficulties many have faced in attempting to enter the housing market, rents have also grown considerably, increasing by 27% over the same period as the average occupancy rate across the nation has fallen (Figure 3.6).

The impact of the global financial crisis on social services
15
Consequently, housing affordability — measured as the proportion of income dedicated to housing expenses — has deteriorated markedly (Figure 3.7). The average house price in capital cities is now equivalent to over seven years’ average earnings — up from three years in the period between the 1950s and the early 1980s.
FIGURE 3.6: AVERAGE VACANCY RATES ACROSS AUSTRALIA
0.0
0.5
1.0
1.5
2.0
2.5
3.0
3.5
4.0
4.5
Mar-01
Sep-01
Mar-02
Sep-02
Mar-03
Sep-03
Mar-04
Sep-04
Mar-05
Sep-05
Mar-06
Sep-06
Mar-07
Sep-07
Mar-08
Source: Access Economics based on Real Estate Institute of Victoria data
FIGURE 3.7: CBA/HIA HOUSING AFFORDABILITY INDEX
80
100
120
140
160
180
200
220
Sep-0
1
Mar-0
2
Sep-0
2
Mar-0
3
Sep-0
3
Mar-0
4
Sep-0
4
Mar-0
5
Sep-0
5
Mar-0
6
Sep-0
6
Mar-0
7
Sep-0
7
Mar-0
8
Sep-0
8
Source: Commonwealth Bank
Rising mortgage rates in recent years have placed growing pressure on indebted home-owners, increasing their level of vulnerability and the incidence of financial stress. Though most mortgages generally incorporate a ‘buffer’ of one to two percentage points, an increase in interest rates in the last few years has, for many, closed this margin. Compounding mortgage pressures has been the high level of consumer debt. In the last five years, for example, the level of credit card debt has increased by 80% (RBA 2008e). While part of this

The impact of the global financial crisis on social services
16
reflects consumer discretionary spending, it is also indicative of cash-constrained households having to resort to credit to meet rising costs of living.
The Salvation Army gave evidence at a Senate Inquiry in April this year and outlined data from a survey of over 1,250 clients using its Emergency Relief services in Southern Australia. The survey found that 10% of those interviewed were purchasing their own house and paid 48.8% of their income in housing costs. It noted that this is a group who have rarely been sighted in its Emergency Relief services in the past. The survey also found that people in the private rental housing market paid 53.5% of their income in housing costs.
Looking forward, many of these pressures are likely to abate as interest rates fall and credit markets ease. Over the short-term, the greatest source of financial stress on mortgagors is likely to be the risk of unemployment. For renters, the pressures are likely to remain more acute. The benefits from falling interest rates will be markedly less and physical constraints and high occupancy rates will continue to inflate rents with flow on impacts on low income households who drop out of the private rental market and begin seeking access to already stretched emergency and public housing.
���� Continued cost-of-living pressures
With key drivers of the recent acceleration in inflation including essential items such as education, health services, food and housing (see Table 3.5), it is evident that cost–of-living pressures on families have been mounting. While over the medium-term inflation is projected to slow, cost-of-living pressures are likely to continue in the near-term. This is a trend of particular significance to low-income households who spend a considerable proportion of their household budget (in some instances all) on essential items, leaving minimal scope to reduce expenditure in discretionary areas as conditions tighten.
TABLE 3.5: GROWTH IN CPI AND SELECTED COMPONENTS
CPI component Average annual growth (2003-2008)
Food 3.7%
Housing 4.2%
Health 5.0%
Transportation 4.2%
Education 5.6%
CPI 3.1%
Source: ABS (2008a)
Lower fuel prices resulting from falls in the international price of crude oil will flow through to a range of transport-orientated and transport-dependent industries, though this will be partially offset by the considerable depreciation of the Australian currency. Elsewhere, food prices (driven recently by growing global demand for commodities, biofuel production and climate change) are likely to ease somewhat with falls in commodity prices. Overall, it is unclear whether, relative to incomes, the cost-of-living pressures which have mounted over recent years will ease.

The impact of the global financial crisis on social services
17
���� Limited access to credit
Despite official interest rates falling two percentage points in the last three months — taking the cash rate from 7.25% to 5.25% — credit market conditions continue to constrain access to credit. The dysfunctional interbank credit market, as well as an overall shortage of credit, is reducing lenders’ willingness to lend, and continuing to push the cost of credit above levels commensurate with the current cash rate. Even as these pressures abate, banking practices will remain affected, and certain parts of society will be affected more heavily than others. As lending shifts back to banks and proceeds in a more tentative fashion, access to credit for households with relatively lower financial means will be limited. For low-income or low-asset households therefore, this suggests greater difficulty accessing credit, throughout a time when their likelihood of needing to obtain additional credit will increase significantly.
���� Impacts of the ‘two-speed economy’
The strong economic growth of recent years has been driven to a large extent by demand for commodities such as coal and iron ore, resulting in strong increases in the price of these products and hence significant increases in the incomes of producers. Those associated with mining industries have been the beneficiaries of strong growth in employment, incomes and wealth. For example over the last two years wages (earnings) growth in the mining and construction industries has averaged 7.35% p.a. and 7.21% p.a. respectively — considerably greater than the overall average of 4.2%.
However, those not directly linked with the mining industry have enjoyed significantly lower levels of prosperity, and in some instances have in fact been disadvantaged by the mining boom. Other export-orientated industries, for example, have suffered as a result of the commodity-driven appreciation of the Australian dollar. Mortgagors, among others, have felt the impact of the monetary policy tightening initiated to reign in rising inflation.
For households not associated with the boom industries of recent years, therefore, the impact has been twofold. First, their incomes have grown at a significantly slower rate and secondly, they have born the adverse impacts of monetary policy tightening (that is, higher interest rates on mortgages and other sources of debt). As noted by Vinson (2007:1) despite Australia’s recent strong economic growth, some communities have not shared in these benefits, instead remaining caught in a spiral of “low school attainment, high unemployment, poor health, high imprisonment rates and child abuse”.

The impact of the global financial crisis on social services
18
4. IMPLICATIONS FOR SOCIAL SERVICES
The Australian economy is entering a period of slower economic growth and rising unemployment. While pressures are likely to abate in parts of the economy — both inflation and interest rates are falling — it is nonetheless apparent that with higher levels of unemployment and slowing income growth, the prevalence of financial and social stress will increase. Demand for social services will therefore rise.
In addition, the nature of the demands on social services is likely to change. With a slowing economy come new challenges for service providers and policymakers alike, as measures employed effectively during a time of economic expansion become increasingly inappropriate.
This section of the paper discusses, rather than forecasts, changes in demand likely to be experienced by social services in the short-term. In addition, it will analyse how the types of services provided and the channels through which they are delivered may need to change in response to the changing nature of issues they seek to address.
4.1 THE SOCIAL SERVICES SECTOR
The social services sector in Australia is made up of agencies and organisations that support individuals and families by providing a range of financial and human services. This role sees the sector as both a direct provider of services and as a facilitator of government-financed programs.
Examples of the services provided by the social services sector include:
� mental health services
� home and community care
� family relationship services
� financial and material support
� housing and homelessness services
� information, advice and referral services
� residential aged care
� individual advocacy
� problem gambling services
� individual and family relationship counselling
� sexual assault/domestic violence services
� disability services
� legal services
� child welfare
� child care
� drug and alcohol services
� employment/training services
� youth services
� supported accommodation for people with a disability
According to ACOSS’s Australian Community Sector Survey 2008 (ACOSS, 2008), 725 respondent agencies provided services to nearly two million people in 2006-07. This was an increase of 6.3 % on the previous year. In addition, these agencies turned away 77,083 people who were eligible for services (a 24% increase on 2005-06) because of a lack of capacity. The turn-away rate in 2006-07 was 4 % —a slight increase on 2005-06 (3.4%).

The impact of the global financial crisis on social services
19
These figures indicate that the social services sector was operating substantially above capacity during 2006-07, a fact supported by the anecdotal experiences of providers. Since then, as Section 3 outlines, economic conditions have changed significantly, with the deterioration witnessed in recent months stretching the sector further beyond what it is capable of delivering with its current resources.
A number of agencies have noted that while they are operating over capacity, they necessarily focus on providing the essential services required to those with the currently most pressing needs. This means many clients with less urgent requirements cannot be served as effectively and that many preventative activities cannot be undertaken.
The strain on the social services sector is not experienced evenly across all service types. This is evidenced by figures published in the Australian Community Sector Survey 2008 (reproduced in Table 4.1). For example, services in relation to housing and homelessness had to refuse assistance to over 10,000 eligible persons (around 13%) while those relating to financial and material support were provided to over 98.5 % of those seeking assistance. These figures provide a valuable context in considering how specific elements within the overall social services sector are going to be affected by a likely deterioration in economic conditions.
TABLE 4.1: NUMBER OF PEOPLE ASSISTED AND NOT ASSISTED BY SERVICE TYPE IN 2006-07
Service Type
Number of
People
assisted
Number of eligible
people turned
away
Eligible people turned
away as % of people
assisted
Residential aged care (a) 7,252 972 13.4
Housing/homelessness service 77,416 10186 13.2
Family relationship service 98,182 10293 10.5
Legal service 43,126 4213 9.8
Child care / preschool 14,459 914 6.3
Information, advice and referral 499,859 22412 4.5
Home and Community Care service 176,171 7127 4.0
Youth services 276,745 10467 3.8
Employment/training service 37,407 699 1.9
Health Service 154,971 2373 1.5
Financial and material support 220,316 3158 1.4
Child welfare service 63,890 808 1.3
Sexual assault/ domestic violence service 37,206 409 1.1
Individual advocacy 31,269 325 1.0
Disability service 162,482 741 0.5
Other 25,233 1985 7.9
Total 1,925,984 77083 4.0
(a) low survey response, interpret number with caution.
Source: ACOSS, Australian Community Sector Survey, June 2008
4.2 SERVICES PROVIDED TO INDIVIDUALS AND FAMILIES
As the list above illustrates, Australia’s social services sector delivers a wide range of services to those in need. In this section, the impacts of the economic outlook on a selection of key services provided to individuals and families are considered.
The impact of the global financial crisis on social services
20
The discussion overviews how the likely macroeconomic trends — principally slowing economic growth and increasing unemployment — are likely to impact on the drivers of demand for these services, increasing and/or changing the nature of demand.
These services should be viewed in the context that the individuals or families seeking them may require assistance on multiple levels. Incidence of severe financial stress can leave households vulnerable in several ways, forcing people to seek assistance in a number of forms. This adds considerably to the complexity of the pertinent issues; it is also important when considering co-ordination across the sector and with levels of government (discussed in section 4.3 below).
4.2.1 EMPLOYMENT SERVICES
Employment services broadly involve acting as an intermediary between the unemployed and the labour market to facilitate both parties’ needs and/or assist the unemployed to increase their employment opportunities through training and development.
Impacts given the economic outlook
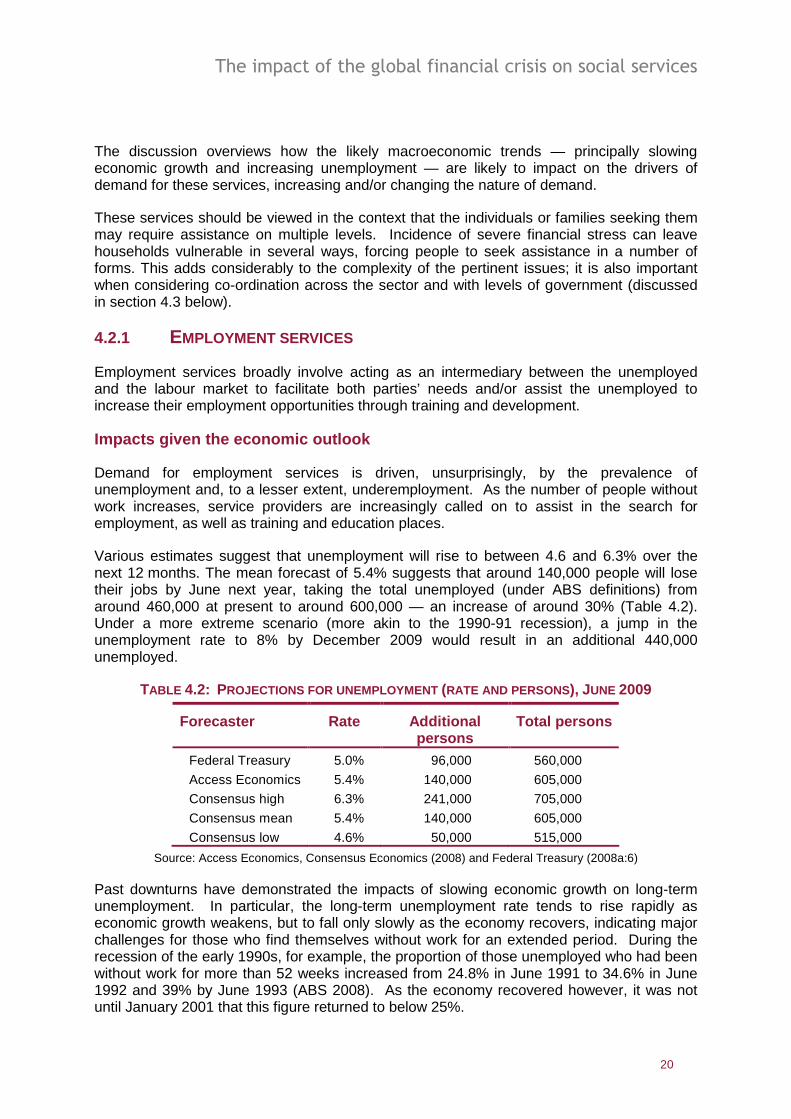
Demand for employment services is driven, unsurprisingly, by the prevalence of unemployment and, to a lesser extent, underemployment. As the number of people without work increases, service providers are increasingly called on to assist in the search for employment, as well as training and education places.
Various estimates suggest that unemployment will rise to between 4.6 and 6.3% over the next 12 months. The mean forecast of 5.4% suggests that around 140,000 people will lose their jobs by June next year, taking the total unemployed (under ABS definitions) from around 460,000 at present to around 600,000 — an increase of around 30% (Table 4.2). Under a more extreme scenario (more akin to the 1990-91 recession), a jump in the unemployment rate to 8% by December 2009 would result in an additional 440,000 unemployed.
TABLE 4.2: PROJECTIONS FOR UNEMPLOYMENT (RATE AND PERSONS), JUNE 2009
Forecaster Rate Additional persons
Total persons
Federal Treasury 5.0% 96,000 560,000
Access Economics 5.4% 140,000 605,000
Consensus high 6.3% 241,000 705,000
Consensus mean 5.4% 140,000 605,000
Consensus low 4.6% 50,000 515,000
Source: Access Economics, Consensus Economics (2008) and Federal Treasury (2008a:6)
Past downturns have demonstrated the impacts of slowing economic growth on long-term unemployment. In particular, the long-term unemployment rate tends to rise rapidly as economic growth weakens, but to fall only slowly as the economy recovers, indicating major challenges for those who find themselves without work for an extended period. During the recession of the early 1990s, for example, the proportion of those unemployed who had been without work for more than 52 weeks increased from 24.8% in June 1991 to 34.6% in June 1992 and 39% by June 1993 (ABS 2008). As the economy recovered however, it was not until January 2001 that this figure returned to below 25%.

The impact of the global financial crisis on social services
21
Given the likely increase in the long-term unemployed over the coming years, meeting the needs of those who have been without work for an extended period will be particularly relevant to social services agencies. Individuals who have experienced long-term difficulty finding work over the recent period of economic expansion will face even greater challenges as the economy slows, due to reduced opportunities and increased competition from those more recently employed. As evidenced by the range of initiatives targeted at the long-term unemployed, re-engaging these individuals in the workforce and/or providing adequate social engagement during longer periods of unemployment can be a significant challenge.
4.2.2 HOUSING SERVICES
Housing services involve the facilitation and provision of accommodation to individuals and families who would otherwise have nowhere to live. This may include a range of activities such as emergency housing, rental subsidies and assisting people with public housing. As noted above, even prior to the financial crisis, they have one of the highest turn-away rates (see Table 4.1). With an estimated 100,000 Australians homeless every night, including 14,000 who rely on emergency accommodation (Department of Families, Housing, Community Services & Indigenous Affairs 2007: passim), the pressure on these services is intense —even before any adverse impacts of the slowing economy are taken into account.
Drivers of demand
The major driver of the need for housing services is individuals or families becoming unable to remain in their current place of residence, usually for financial reasons such as mortgage default or failure to meet rental obligations. Key sources of ‘housing stress’ include rapid growth in housing costs (relative to income) and/or reduced earnings resulting from unemployment or lower working hours. The Federal Government’s Green Paper on Homelessness identified mental illness, domestic violence, family breakdown, drug and alcohol addiction, unemployment, financial stress, locational disadvantage and gambling as among the leading drivers of homelessness (Department of Families, Housing, Community Services & Indigenous Affairs 2008).
For many of the 35% of households who are repaying mortgages, rising interest rates have presented a major financial challenge over recent years. Similarly, for the 27% of households who rent, rising rents (relative to income) have added to the increased incidence of ‘housing stress’. In 2005-06, around 23% of households were spending over 30% of their income on housing — up from 16% in the previous decade. For those who most recently bought houses, the risk of housing-related financial stress is particularly acute, with 62% of households who bought their first home in the past three years spending over 30% of their income on housing (Parliament of Australia 2008:37).
TABLE 4.2: HOME OWNERSHIP STATUS
Ownership status % of households
Own home outright 34%
Repaying housing loan 35%
Renting privately 22%
Renting public housing 5%
Other* 4%
*Other includes caravan parks and employer-owned housing
Source: Parliament of Australia (2008: 15)

The impact of the global financial crisis on social services
22
On one criterion of ‘housing stress’, the Ontario Measure,3 it is estimated that in 2005-06, more than one million low-and middle-income households are in ‘housing stress’ — around 10% of the then population. Despite this, the rate of foreclosures is still relatively low despite some increase over the past few years. (especially compared with the United States). The RBA’s recent Financial Stability Review, for example, shows applications for property repossession in NSW have increased from 0.1% to 0.22% of the total dwelling stock over the last four years (RBA 2008b:48).
Nevertheless, the increases in interest rate between 2005 and early 2008 inflicted steadily greater financial pressure on many households, especially those with relatively new mortgages. Mortgages in Australia typically incorporate a buffer of between one and two percentage points in their calculations. However, mortgage rates have increased by more than two percentage points over the three years to early 2008, enough to eliminate the buffer for many borrowers. Given that cost-of-living expenses also increased rapidly over this period, the inevitable result has been an increasing incidence of financial stress among home owners with mortgages.
On the ground evidence reinforces the view that ‘housing stress’ is increasing, with a recent survey from Salvation Army Emergency Relief Services of 1,250 clients across southern Australian finding that 10% of people presenting for emergency relief had recently bought their own home. Those presenting for relief who owned their homes were paying, on average, 48.8% of their budget on housing, while for renters the equivalent figure was 53.5% (Salvation Army, unpublished research).
Impacts given the economic outlook
While the housing pressures on some households are likely to ease — mortgage holders, for example, who will benefit from lower interest rates — for others, the high cost of housing is likely to remain a major challenge, particularly for those seeking rental accommodation. With physical constraints in rental markets expected to persist over the next two to three years (that is, vacancy rates will remain at record lows), there is likely to be little easing of rent prices in the short-term. The greatest source of increased demand for housing services, however, is likely to be increased risk of unemployment, which will leave some individuals and families unable to meet their housing costs.
The rising incidence of homelessness will present particularly significant challenges to the social services sector, as the tendency for the homeless to slip through the cracks of the government social safety net makes them particularly reliant on community service providers.
The Federal Government’s forthcoming White Paper on Homelessness will be a crucial step in the development of effective policy options for addressing this critical social issue.
4.2.3 FINANCIAL COUNSELLING SERVICES
Financial counselling involves assisting individuals who have found themselves in financial difficulties. Generally, it includes creating a plan which takes into account income, total basic living costs, options for possible expenditure reductions and possible debt repayment strategies.
3 The Ontario Measure considers those households in the lowest 20% of the income distribution who are paying more than 30% of their income on housing. See, for example., Parliament of Australia 2008:37.
The impact of the global financial crisis on social services
23
Drivers of demand
It is important to look at the causes of financial stress to be able to assess the likely impacts of a slowing economy. Financial stress is often the result of exogenous events — shocks which occur outside of the financial system and economy — which can have a serious impact on individuals’ financial status. Significant indebtedness or lack of access to credit — characteristics of the current economic climate — can exacerbate the impacts of exogenous shock, increasingly the likelihood that financial counselling or assistance is needed.
In a UK study of indebtedness and stress (Kempson 2002: 32), for instance, 66% of households surveyed cited ‘changes in circumstances’ as the cause of their debt problems.
Such changes typically include: unexpected changes in income (such as resulting from redundancy); delays in payments of benefits; changes in family circumstances; unexpected expenses (for example, medical expenses); or fraud. In addition, a recent FaCHSIA/Melbourne Institute study (Marks 2005;xi) found that financial stress4 is strongly correlated with labour force status, with over 40% of the unemployed in financial stress, compared with 15% of full-time workers.
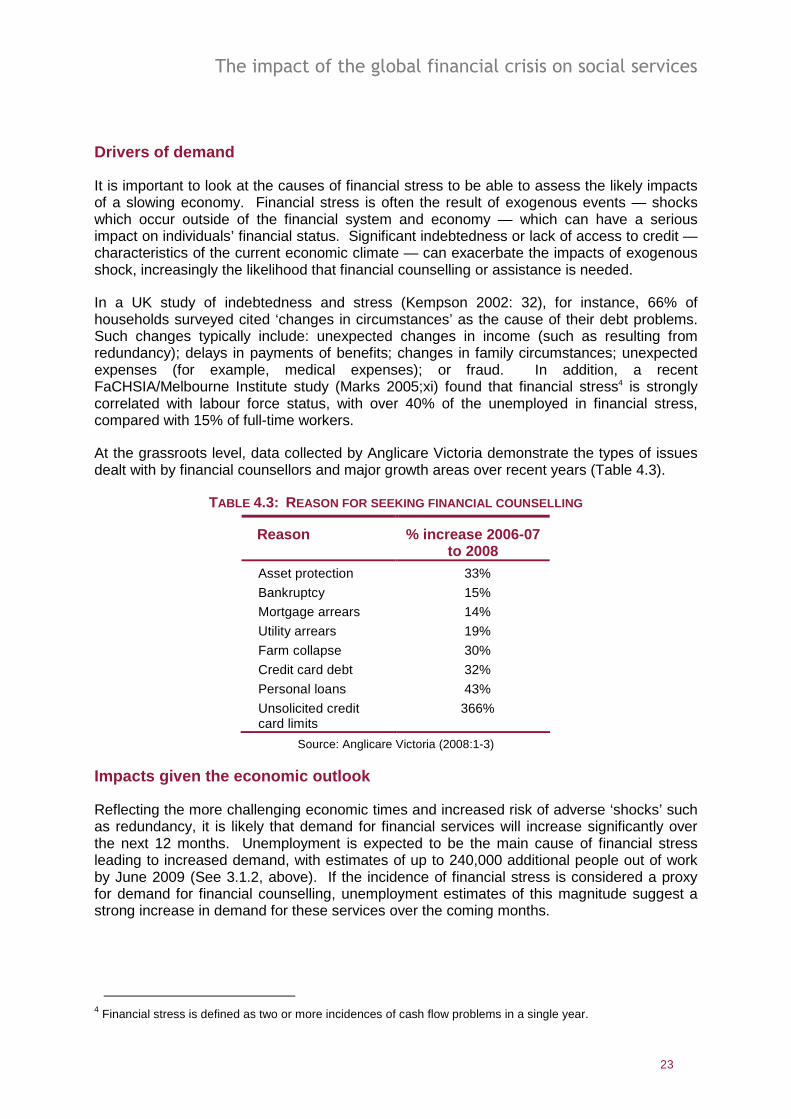
At the grassroots level, data collected by Anglicare Victoria demonstrate the types of issues dealt with by financial counsellors and major growth areas over recent years (Table 4.3).
TABLE 4.3: REASON FOR SEEKING FINANCIAL COUNSELLING
Reason % increase 2006-07 to 2008
Asset protection 33%
Bankruptcy 15%
Mortgage arrears 14%
Utility arrears 19%
Farm collapse 30%
Credit card debt 32%
Personal loans 43%
Unsolicited credit card limits
366%
Source: Anglicare Victoria (2008:1-3)
Impacts given the economic outlook
Reflecting the more challenging economic times and increased risk of adverse ‘shocks’ such as redundancy, it is likely that demand for financial services will increase significantly over the next 12 months. Unemployment is expected to be the main cause of financial stress leading to increased demand, with estimates of up to 240,000 additional people out of work by June 2009 (See 3.1.2, above). If the incidence of financial stress is considered a proxy for demand for financial counselling, unemployment estimates of this magnitude suggest a strong increase in demand for these services over the coming months.
4 Financial stress is defined as two or more incidences of cash flow problems in a single year.

The impact of the global financial crisis on social services
24
4.2.4 EMERGENCY RELIEF
Emergency relief generally involves the provision of short-term assistance through the allocation of food parcels, food and other vouchers. Such assistance is offered at times of crisis or following unforeseen events which individuals are unable to immediately cope with alone.
Drivers of demand
While the need for emergency relief is often driven by exogenous events, a major factor determining emergency relief requirements is the ability to access immediate funds. ABS data from 2006 indicate many individuals of all family structures would be unable to raise $2000 within a week for something important. Given that access to credit since 2006 has fallen, and the likelihood of reduced earnings and redundancy increased, these figures are likely to underestimate the current situation.
TABLE 4.4: HOUSEHOLD FINANCIAL STRESS ^
Couple only, one family households
One family households with dependent
children
Lone person households
Household type
Person aged under 35
Person 65 and over
Couple family
One parent family
Person aged under 35
Person aged 65 or over
Percentage 8.6% 7.1% 11.4% 37.7% 22.9% 12.7%
^ Percentage of households unable to raise $2000 within a week for something important
Source ABS (2006:47)
The other factor impacting on the demand for emergency relief is access to short-term credit. If households are able to access additional funds in the case of an emergency or unforeseen event, this significantly reduces their need to call on emergency relief services.
Impacts given the economic outlook
Rising unemployment levels associated with the economic slowdown will increase households’ financial vulnerability. Having sufficient financial resources on hand to deal with unforeseen events can be challenging for households with a reliable income stream, let alone the unemployed or underemployed. In addition, reduced access to credit will diminish the ability of low-income/low-wealth households to obtain short-term funds in times of need, increasing their reliance on emergency relief services.
4.2.5 COUNSELLING SERVICES
Counselling services encompass a broad set of approaches aimed at helping an individual with problem solving — dealing with long-standing problems in the family or at work; or sudden major problems.
Drivers and impacts given the economic outlook
The linkages between income and employment status and mental stress/illness are well established in the academic literature. Butterworth et al. (2004; 165), for example, find that

The impact of the global financial crisis on social services
25
relative to those on income support, an unemployed person is 2.22 times more likely to experience mental health problems than someone on no income support. More specifically, it has been suggested that the greatest employment-related impact on mental health is the movement between employment and non-participation in the labour force (Dockery 2005:18).
Hence, as increasing numbers of Australians will find themselves unemployed over the coming months, it is likely that demand for counselling services will rise.
4.3 CAPACITY OF THE SYSTEM TO DELIVER
Increasing and changing needs
The discussion above highlights the growing demands that are likely to be placed on Australia’s already stretched social services sector as the economy slows over the months ahead. Increased unemployment, and by extension the increased incidence of financial stress, will see more people calling on the social services sector for assistance. At the same time, a more challenging economic climate will make service delivery more difficult, As an example, job placement will be hampered by slower employment growth.
In addition, the social services sector also confronts changing needs. As noted, the nature of the circumstances individuals and families face in times of economic downturn, and the appropriate responses to these, vary notably from those prevailing in more prosperous times. The unemployed, for instance, may require more innovative and longer term initiatives during a period of higher unemployment, while those seeking financial counselling may require more highly qualified assistance to resolve more complex financial issues.
Direct impacts on capacity to deliver
The capacity of the not-for-profit sector to provide those services which it directly finances has also been impacted by the financial crisis. While there is considerable diversity in the financial structure of different service providers, many have been heavily exposed to losses on financial markets. With Australian equity markets now more than 50% below their November 2007 peak, providers who rely on investment earnings for operating revenue have been significantly affected, with their ability to deliver self-funded services considerably impeded. Balance sheet reversals also have secondary impacts on agencies’ capacity to obtain credit for social projects, limiting their ability to undertake capital-intensive projects.
Anglicare Sydney, for example, relies on self-generated income to finance around a third of their services. With approximately 10% of this being investment income, asset price falls have significantly undermined their ability to provide self-funded services.
Australia’s economic outlook suggests low-income households will face continued high costs of housing and other essentials, limited access to credit and increased risk of unemployment. The effect of these trends is likely to be a significant increase in the demand for social services — particularly those related to employment status and/or income level — and an increase in the complexity of problems being dealt with. With the number of unemployed persons rising, even on conservative assumptions, by potentially 30% over the coming year (140,000 people), the pressure placed on already stretched services will intensify.
At the same time, increasing numbers of unemployed will increase Government outlays on welfare payments and reduce tax inflows, hence net Government revenues. It is looking increasingly likely that the pending economic downturn will require the Federal Government

The impact of the global financial crisis on social services
26
to take the budget into deficit in the short-term in order to effectively meet the needs of the community — something not precluded by its stated policy objective of pursuing budget surpluses, on average, over the medium term. State governments will also be affected, with revenue forecasts being similarly revised downwards. However, these governments appear to be less willing to take their Budgets into deficit as part of the policy response.
In this regard we may note the recent comment of RBA Governor Stevens (2008b) that there was a case for government going into debt to support public projects that boost demand; and that ‘if governments are able to so order their affairs as to continue supporting worthwhile — and I emphasise worthwhile — public investment (even if that involves some prudent borrowing); then Australia will come through the present period’.
FUTURE POLICY RESPONSES
In response to the deteriorating economic climate, the Federal Government has already taken significant action, providing a $10.4 billion stimulus package in an attempt to bolster demand and give confidence in the face of the global economic slowdown. The package includes $4.8 billion for Australia's four million pensioners, $3.9 billion for middle and low-income families and $1.5 billion for first home buyers, as well as $187 million to create an extra 56,000 training places this financial year. As such, it provided a welcome boost to low-income earners, though the unemployed are excluded from the package.
While the response was a timely one and, given the circumstances, an appropriate one —that is, it was designed to ensure the money is spent rather than saved in order to maximise the stimulus generated — there will be greater opportunity in future to respond more directly to the rising needs with targeted, calculated policy measures.
Continuing support
The outlook for the Australian economy suggests at best a moderate slowdown and at worst, a more severe, drawn-out economic downturn. Regardless of which scenario eventuates, active policy responses will be needed by governments — at all levels, but particularly the federal — as part of a rational, counter-cyclical fiscal policy response. The appropriate magnitude of these responses, however, is not yet clear. In addition, greater coordination will be needed among different levels of government, and between government and service providers, to ensure that the policy initiatives introduced are facilitated in the most optimal and effective way.
With low-income households and society’s most disadvantaged likely to be disproportionately affected, initiatives aimed at strengthening the social safety net, and directly addressing the cost-of-living pressures these households face (such as continuing high rental costs) will be a high priority from an economic and social welfare perspective. As the financial pressures on the unemployed grow, the adequacy of unemployment benefits — which are designed more to reflect the short- rather than the long-term needs of the unemployed — will need to be reconsidered.
Addressing changing needs
The discussion throughout this paper highlights the fact that the demands facing the social services sector as the economy slows are changing as well as increasing. In particular, reduced availability of jobs will require different approaches to policies targeted at the

The impact of the global financial crisis on social services
27
unemployed. The emphasis of policy will need to at least partially shift from compliance and encouragement of workers into employment, to increasing individuals’ opportunity and capacity.
Current employment policies rely on moving disadvantaged job seekers into 'stepping stone' jobs as a way of preparing them for ongoing employment. These jobs are generally casual, part-time or temporary. They allow job seekers to develop skills and establish a work history. In a tight labour market employers are often prepared to consider applicants they would not be prepared to employ on a full-time permanent basis.
However, if unemployment increases sharply, job seekers at the end of the queue will be far less likely to receive offers of employment. If, as many policy analysts believe, work experience is more effective than training programs for highly disadvantaged adults, there are two options. The first is to use targeted wage subsidies to encourage employers to make job offers to disadvantaged job seekers while the second is to create suitable jobs directly using an Intermediate Labour Market (ILM) approach.
Experience with wage subsidies under the Working Nation initiative of the early 1990s suggests that employers do not always respond strongly to these incentives. For the most disadvantaged job seekers, the most effective way to provide work experience opportunities may involve creating ILM jobs designed around the needs of job seekers and local labour markets. In order to minimise stigma effects, recruitment into these positions should be voluntary and competitive.
ILM programs may be particularly effective as part of a place-based strategy targeted at areas of concentrated disadvantage such as those identified in the Dropping Off The Edge report commissioned by Catholic Social Services Australia and Jesuit Social Services (Vinson 2007).
Effective service delivery
Social services are delivered both directly by government and through agencies such as those represented at the Summit. As the growing demands on the social services sector demonstrate, the sector has increasingly been called on in recent years to meet the needs of the community in this area — a trend that has in many instances pushed these services beyond capacity.
From a policy perspective, there are good reasons to suggest that this model of service delivery is, in many cases, the most effective one. Service agencies tend to be more aware of the characteristics of local communities, better positioned to identify and address specific needs, and better placed to respond quickly to emerging issues. Going forward, in light of the growing and changing demands identified in this paper, a continued emphasis on non-government service delivery will require governments at all levels to work collaboratively with the sector to ensure that agencies have sufficient capacity and appropriate resources to meet the challenges that now inevitably lie ahead.

The impact of the global financial crisis on social services
28
5. CONCLUSIONS
Despite a period of sustained economic growth in Australia, acute pressures have mounted on certain parts of the community. Australia’s two-speed economy has seen divergences in incomes across sectors, across states and across different parts of the income distribution. Evidently, Australians have not shared equally in the nation’s recent economic prosperity.
The impacts of the global financial crisis on the Australian economy are already being witnessed and the outlook for the domestic economy is one of slowing economic growth and rising unemployment. While central forecasts suggest only a moderate economic slowdown, the risks of a more significant downturn are real.
Low-income households and Australia’s disadvantaged will be directly impacted by slowing economic growth as rising unemployment together with continued pressure on housing costs — and the cost of living more generally — increase the incidence of financial and social stress. As a consequence, the demands on the nation’s already overstretched social services sector will significantly increase.
Meeting these challenges will require coordinated, collaborative responses involving all levels of government as well as the social services sector. Growing and changing needs will require increasing and innovative policy responses that address the core origins of the mounting pressures. The social services sector’s close ties with the community and acute awareness of the diverse needs of society, suggest the most effective channel for reaching those in need will be through these community-based organisations. A fundamental part of what Glenn Stevens calls ‘worthwhile’ public investment is investment in human capital — the very thing the sector does so well.
In addition to being the response of a genuinely civil society, high quality, social services are an integral part of a productive economy. Investment in such services is a benefit not just to those in such desperate need of services, but also reduces long term social costs and enhances the overall productivity of the economy. Investment in social services, and social infrastructure, should therefore be considered as an essential part of further fiscal stimulus measures.
The impact of the global financial crisis on social services
29
6. REFERENCES
Anglicare Australia (2008), State of the Family 2008: Australia’s social inclusion agenda, Canberra.
Anglicare Victoria (2008) ‘Anglicare Victoria Financial Counselling Services’, Research Report, October.
Australian Bureau of Statistics (ABS) (2006) General Social Survey: Summary Results, Australia, ABS Cat. No. 4159.0.
_____ (2008) Labour Force, Australia, Detailed, ABS Cat. No. 6291.0.55.001.
_____ (2008a) Consumer Price Index, Australia, September 2008, ABS Cat. No. 6401.0.
Butterworth P, Crosier T, Rodges B (2004) ‘Mental Health Problems, Disability and Income Support Receipt: A Replication and Extension Using the HILDA Survey’, Australian Journal of Labour Economics, 7(2); 151-174.
Commonwealth Bank of Australia (various) ‘HIA-Commonwealth Bank Affordability Report’, at http://www.research.commbank.com.au/cbaresearch_display/0,2209,CH3350%
255FTS17347,00.html.
Consensus Economics (2008) ‘Asia Pacific Consensus Forecasts’ November.
Department of Families, Housing, Community Services & Indigenous Affairs (2008), Which Way Home? A new approach to homelessness, Canberra.
Dockery, A.M. (2005) ‘Mental health and labour force status in Australia’, Paper presented to HILDA conference, at www.melbourneinstitute.com/hilda/conf/conf2005/confpapers/Session%207C_Mental%20Health/Dockery,%20Mike.pdf.
Marks (2005) ‘Income poverty, subjective poverty and financial stress’ Report by the Melbourne Institute of Applied Economic and Social Research for the Department of Family and Community Services.
NATSEM (2008) ’Advance Australia Fair? Trends in small areas socio-economic inequality 2001 to 2006’, AMP.NATSEM Income and wealth report, Issue 20: July.
Parliament of Australia (2008) The Senate, Select Committee on Housing Affordability in Australia, ‘A good house is hard to find: Housing Affordability in Australia’, 2693, June, at www.aph.gov.au/senate/committee/hsaf_ctte/report/report.pdf.
Reserve Bank of Australia (2008a) Statement on Monetary Policy, 5 November, at www.rba.gov.au/PublicationsAndResearch/StatementsOnMonetaryPolicy/Statements/statement_on_monetary_1108.pdf.
_____ (2008b) Financial Stability Review, September, at www.rba.gov.au/PublicationsAndResearch/FinancialStabilityReview/Sep2008/Pdf/financial_stability_review_0908.pdf

The impact of the global financial crisis on social services
30
_____ (2008c) Monetary Policy Changes, RBA Data Series A02.
_____ (2008d) Consumer Price Inflation, RBA Data Series G2.
_____ (2008e) Credit and charge card statistics, RBA Data Series C01.
Salvation Army (2008) Submission to the Senate Selected Committee on Housing Affordability, at www.aph.gov.au/Senate/committee/hsaf_ctte/submissions/sub34b.pdf
Vinson, T. (2007) Dropping off the edge — the distribution of disadvantage in Australia, Report for Catholic Social Services Australia and Jesuit Social Services.