The impact of multinational enterprises on employment ...\Documents and Settings\bouchet\Local...
80
Multinational Enterprises Programme Working Paper No. 84 The impact of multinational enterprises on employment, training and regional development in Namibia and Zimbabwe: A preliminary assessment by Olukunle Iyanda Faculty of Management and Administration Africa University Mutare, Zimbabwe International Labour Office Geneva
Transcript of The impact of multinational enterprises on employment ...\Documents and Settings\bouchet\Local...

Multinational EnterprisesProgramme
Working Paper No. 84 The impact of multinational enterpriseson employment, training and regionaldevelopment in Namibia and Zimbabwe:A preliminary assessment
by Olukunle IyandaFaculty of Management and AdministrationAfrica UniversityMutare, Zimbabwe
International Labour OfficeGeneva

C:\Documents and Settings\bouchet\Local Settings\Temp\WP84 Zimbabwe\v.3 iii
ContentsAbbreviations . . . . . . . . . . . . . . . . . . . . . . . . . . . . . . . . . . . . . . . . . . . . . . . . . . . . . . vii
Introduction . . . . . . . . . . . . . . . . . . . . . . . . . . . . . . . . . . . . . . . . . . . . . . . . . . . . . . . 1
Part 1. Namibia . . . . . . . . . . . . . . . . . . . . . . . . . . . . . . . . . . . . . . . . . . . . . . . . . . . . . 3
1. Country background . . . . . . . . . . . . . . . . . . . . . . . . . . . . . . . . . . . . . . . . . . . . . . 5
1.1. Political . . . . . . . . . . . . . . . . . . . . . . . . . . . . . . . . . . . . . . . . . . . . . . . . . . . 5
1.2. The economy . . . . . . . . . . . . . . . . . . . . . . . . . . . . . . . . . . . . . . . . . . . . . . . 5
1.3. Government policy on foreign direct investment . . . . . . . . . . . . . . . . . . . . . . . . . 5
2. Foreign direct investment in Namibia . . . . . . . . . . . . . . . . . . . . . . . . . . . . . . . . . . 7
2.1. Size . . . . . . . . . . . . . . . . . . . . . . . . . . . . . . . . . . . . . . . . . . . . . . . . . . . . . 7
2.2. Sectoral and geographical distribution of FDI . . . . . . . . . . . . . . . . . . . . . . . . . . 7
2.3. Origin and geographical distribution of FDI . . . . . . . . . . . . . . . . . . . . . . . . . . . 7
2.4. Comparative distribution pattern . . . . . . . . . . . . . . . . . . . . . . . . . . . . . . . . . . . 8
2.5. FDI in EPZs . . . . . . . . . . . . . . . . . . . . . . . . . . . . . . . . . . . . . . . . . . . . . . . 8
3. Impact of MNEs . . . . . . . . . . . . . . . . . . . . . . . . . . . . . . . . . . . . . . . . . . . . . . . . 9
3.1. Introduction . . . . . . . . . . . . . . . . . . . . . . . . . . . . . . . . . . . . . . . . . . . . . . . . 9
3.2. Capital inflows . . . . . . . . . . . . . . . . . . . . . . . . . . . . . . . . . . . . . . . . . . . . . . 9
3.3. Direct employment creation . . . . . . . . . . . . . . . . . . . . . . . . . . . . . . . . . . . . . . 10
3.4. Indirect employment . . . . . . . . . . . . . . . . . . . . . . . . . . . . . . . . . . . . . . . . . . 12
3.5. Gender distribution of employment . . . . . . . . . . . . . . . . . . . . . . . . . . . . . . . . . 12
3.6. Conditions of service and industrial relations . . . . . . . . . . . . . . . . . . . . . . . . . . . 15
3.7. Skills development . . . . . . . . . . . . . . . . . . . . . . . . . . . . . . . . . . . . . . . . . . . . 17
3.8. Contribution to national/regional and economic development . . . . . . . . . . . . . . . . . 19
4. Conclusions and prognosis . . . . . . . . . . . . . . . . . . . . . . . . . . . . . . . . . . . . . . . . . . 21
4.1. Introduction . . . . . . . . . . . . . . . . . . . . . . . . . . . . . . . . . . . . . . . . . . . . . . . . 21
4.2. Conclusions . . . . . . . . . . . . . . . . . . . . . . . . . . . . . . . . . . . . . . . . . . . . . . . . 21
4.3. Prognosis . . . . . . . . . . . . . . . . . . . . . . . . . . . . . . . . . . . . . . . . . . . . . . . . . . 22
Notes . . . . . . . . . . . . . . . . . . . . . . . . . . . . . . . . . . . . . . . . . . . . . . . . . . . . . . . . 23
Bibliography . . . . . . . . . . . . . . . . . . . . . . . . . . . . . . . . . . . . . . . . . . . . . . . . . . . . . . 24
Appendix: Names of organizations that provided informationand officials interviewed . . . . . . . . . . . . . . . . . . . . . . . . . . . . . . . . . . . . . . . . 27

iv C:\Documents and Settings\bouchet\Local Settings\Temp\WP84 Zimbabwe\v.3
Part 2. Zimbabwe . . . . . . . . . . . . . . . . . . . . . . . . . . . . . . . . . . . . . . . . . . . . . . . . . . . . 29
1. Country background . . . . . . . . . . . . . . . . . . . . . . . . . . . . . . . . . . . . . . . . . . . . . . 31
1.1. Political . . . . . . . . . . . . . . . . . . . . . . . . . . . . . . . . . . . . . . . . . . . . . . . . . . . 31
1.2. The economy . . . . . . . . . . . . . . . . . . . . . . . . . . . . . . . . . . . . . . . . . . . . . . . 31
1.3. Government economic policy . . . . . . . . . . . . . . . . . . . . . . . . . . . . . . . . . . . . . 31
2. Foreign direct investment in Zimbabwe . . . . . . . . . . . . . . . . . . . . . . . . . . . . . . . . . . 36
2.1. Introduction . . . . . . . . . . . . . . . . . . . . . . . . . . . . . . . . . . . . . . . . . . . . . . . . 36
2.2. Size of FDI . . . . . . . . . . . . . . . . . . . . . . . . . . . . . . . . . . . . . . . . . . . . . . . . 36
2.3. Sectoral distribution . . . . . . . . . . . . . . . . . . . . . . . . . . . . . . . . . . . . . . . . . . . 38
2.4. Ownership of investment projects . . . . . . . . . . . . . . . . . . . . . . . . . . . . . . . . . . 40
2.5. Sources of FDI . . . . . . . . . . . . . . . . . . . . . . . . . . . . . . . . . . . . . . . . . . . . . . 41
2.6. Geographical location . . . . . . . . . . . . . . . . . . . . . . . . . . . . . . . . . . . . . . . . . . 41
3. Impact of FDI on the Zimbabwe economy . . . . . . . . . . . . . . . . . . . . . . . . . . . . . . . . . 44
3.1. Introduction . . . . . . . . . . . . . . . . . . . . . . . . . . . . . . . . . . . . . . . . . . . . . . . . 44
3.2. Capital inflow . . . . . . . . . . . . . . . . . . . . . . . . . . . . . . . . . . . . . . . . . . . . . . . 44
3.3. Employment creation . . . . . . . . . . . . . . . . . . . . . . . . . . . . . . . . . . . . . . . . . . 44
3.4. Labour productivity . . . . . . . . . . . . . . . . . . . . . . . . . . . . . . . . . . . . . . . . . . . 48
3.5. Industrial relations and conditions of work . . . . . . . . . . . . . . . . . . . . . . . . . . . . 50
3.6. Contributions to national and regional economic development . . . . . . . . . . . . . . . . 55
4. Summary and conclusions . . . . . . . . . . . . . . . . . . . . . . . . . . . . . . . . . . . . . . . . . . . . 58
4.1 Introduction . . . . . . . . . . . . . . . . . . . . . . . . . . . . . . . . . . . . . . . . . . . . . . . . . 58
4.2. Summary . . . . . . . . . . . . . . . . . . . . . . . . . . . . . . . . . . . . . . . . . . . . . . . . . . 58
4.3. FDI prognosis . . . . . . . . . . . . . . . . . . . . . . . . . . . . . . . . . . . . . . . . . . . . . . . . 59
Note . . . . . . . . . . . . . . . . . . . . . . . . . . . . . . . . . . . . . . . . . . . . . . . . . . . . . . . . 60
Bibliography . . . . . . . . . . . . . . . . . . . . . . . . . . . . . . . . . . . . . . . . . . . . . . . . . . . . . . 61
Appendix I: List of organizations and officials interviewed . . . . . . . . . . . . . . . . . . . . . . . . . 63
Appendix II: List of publications on specific industries or sectors,under ILO's Programme on Multinational Enterprises . . . . . . . . . . . . . . . . . . . 64

C:\Documents and Settings\bouchet\Local Settings\Temp\WP84 Zimbabwe\v.3 v
List of tables
Part 1.Namibia
Table 1.1. Gross domestic product (at current prices) . . . . . . . . . . . . . . . . . . . . . . . . . 5
Table 2.1. Direct investment in Namibia . . . . . . . . . . . . . . . . . . . . . . . . . . . . . . . . . . 7
Table 3.1. Flow of foreign direct investment: 1990-96 (N$ million) . . . . . . . . . . . . . . . . 10
Table 3.2. Namibia: Employment and remuneration in mining . . . . . . . . . . . . . . . . . . . . 11
Table 3.3. Namibia: Employment and wages in manufacturing (1994-95) . . . . . . . . . . . . . 11
Table 3.4. Employed regular workers by industry and gender (percentage) . . . . . . . . . . . . 13
Table 3.5. Employment in manufacturing by industry and sex . . . . . . . . . . . . . . . . . . . . 14
Table 3.6. Influence of MNEs on productivity and employment . . . . . . . . . . . . . . . . . . . 14
Table 3.7. Industrial actions: April 1995-March 1996 . . . . . . . . . . . . . . . . . . . . . . . . . 16
Table 3.8. Reported injuries in selected industries . . . . . . . . . . . . . . . . . . . . . . . . . . . . 18
Table 3.9. Regional imbalance in development . . . . . . . . . . . . . . . . . . . . . . . . . . . . . . 20
Part 2. Zimbabwe
Table 1.1. Gross domestic product 1980-94 (1980 prices) . . . . . . . . . . . . . . . . . . . . . . . 33
Table 2.1. Net FDI in 1980 and 1987-96 (US$ million) . . . . . . . . . . . . . . . . . . . . . . . . 36
Table 2.2. Projects and FDI in Zimbabwe, 1991-97 (Z$ million) . . . . . . . . . . . . . . . . . . 37
Table 2.3. Geographical distribution of EPZ projects and investment as at October 1997 . . . . . . . . . . . . . . . . . . . . . . . . . . . . . . . . . 38
Table 2.4. Sectoral distribution of ZIC approved projects and investment 1993-97 (Z$million) . . . . . . . . . . . . . . . . . . . . . . . . . . . . . 39
Table 2.5. Ownership of ZIC approved projects and investment (Z$ million) 1993-97 . . . . 40
Table 2.6(a). Zimbabwe: Approved foreign investment by major sources and sector (Z$ million) (1994) . . . . . . . . . . . . . . . . . . . . . . . . . . . . . . . . 42
Table 2.6(b). Zimbabwe: Approved foreign investment by major sources and sector (Z$ million) (1996) . . . . . . . . . . . . . . . . . . . . . . . . . . . . . . . . 43
Table 3.1. Paid employment (in ‘000) by industrial sector: 1981 and 1985-95 . . . . . . . . . . 46
Table 3.2. Total investment, foreign exchange outlay and jobs createdby ownership category: 1993-97 . . . . . . . . . . . . . . . . . . . . . . . . . . . . . . . . 47
Table 3.3. Paid employment (in ‘000) by gender . . . . . . . . . . . . . . . . . . . . . . . . . . . . 48
Table 3.4. Capital intensity of projects by ownership category . . . . . . . . . . . . . . . . . . . . 49
Table 3.5. Average earnings (Z$'000) in paid employment by industrial sector: 1991-95 . . . 52
Table 3.6. Occupational injuries by economic activity (selected years) . . . . . . . . . . . . . . 53
Table 3.7. Employees and earnings in selected urban areas . . . . . . . . . . . . . . . . . . . . . . 57

vi C:\Documents and Settings\bouchet\Local Settings\Temp\WP84 Zimbabwe\v.3

C:\Documents and Settings\bouchet\Local Settings\Temp\WP84 Zimbabwe\v.3 vii
AbbreviationsBSAC British Southern African CompanyCFU Commercial Farmers UnionCZI Confederation of Zimbabwe IndustriesEIU Economic Intelligence UnitEMCOZ Employers’ Confederation of ZimbabweEPZ Export Processing ZoneFDI foreign direct investmentFIAS Foreign Investment Advisory ServicesGAPWUZ General Agricultural and Plantation Workers Union of ZimbabweGDP gross domestic productGOZ Government of ZimbabweISI Import Substitution Industrialization PolicyMNE(s) multinational enterprise(s)MUN Mineworkers Union of NamibiaNABWU Namibia Building Workers UnionNAFAU Namibia Food and Allied Workers UnionNUNW National Union of Namibian WorkersNOSA National Occupational Safety AssociationSACU South African Customs UnionSMEs small and medium-sized enterprisesUDI Unilateral Declaration of IndependenceUK United Kingdom of Great Britain and Northern IrelandUN United NationsUSA United States of AmericaZABO Zimbabwe Association of Business OrganizationsZCTU Zimbabwe Congress of Trade UnionsZEDP Zimbabwe Enterprise Development ProgrammeZIC Zimbabwe Investment CentreZIMASCO Zimbabwe Mining and Smelting CompanyZIMPREST Zimbabwe Programme for Economic and Social TransformationZNCC Zimbabwe National Chamber of Commerce

C:\Documents and Settings\bouchet\Local Settings\Temp\WP84 Zimbabwe\v.3 1
IntroductionCompared to the other countries in Africa, the countries of southern Africa (Namibia, South
Africa, Zimbabwe, etc.) are relatively young democracies, which have recently overcome bitterinternecine domestic struggle for democracy and racial equality. The immediate post-independence economic policy in many such countries was characterized by a socialist tendencywhich encouraged state capitalism and discouraged private enterprise. The disappointingeconomic results of this policy and the need for assistance from multilateral agencies encouragedthe adoption of more liberal economic policies which promoted private domestic and foreigninvestment in economies largely guided by market forces. This liberalization occurred in the late1980s and was embraced by Namibia at its independence in 1990. Although countries in thesouthern African region had played host to a significantly large volume of foreign capital, it wasnot until such a liberalization of their economies that one could talk of multinational enterprisesoperating in sectors other than mining and agriculture.
This working paper analyses the economic contributions of multinational enterprises(MNEs) to the Namibian and Zimbabwean economies, looks at certain social aspects andcompares the volume, distribution and contributions of MNE capital to the two countries’economies before and after economic liberalization. Namibia’s case is presented in Part I whileZimbabwe’s forms Part II of the paper.

2 C:\Documents and Settings\bouchet\Local Settings\Temp\WP84 Zimbabwe\v.3

C:\Documents and Settings\bouchet\Local Settings\Temp\WP84 Zimbabwe\v.3 3
Part 1
Namibia

4 C:\Documents and Settings\bouchet\Local Settings\Temp\WP84 Zimbabwe\v.3

C:\Documents and Settings\bouchet\Local Settings\Temp\WP84 Zimbabwe\v.3 5
1. Country background
1.1. PoliticalNamibia, a country of 1.4 million people inhabiting a land area of 824,269 sq. km, is the
world’s third most sparsely populated country after Botswana and the territory of WesternSahara. A German colony until 1915, it became a UN protectorate administered by South Africauntil 1990 when it became independent.
1.2. The economyThe Namibian economy is regarded as “one of the most productive in sub-Saharan Africa,
with an exceptionally high level of resources per head of population”. 1 Outside the desert area,the country is suitable for pastoral farming, and has “the richest source of alluvial diamonds inthe world”. 2 It also has a large deposit of copper and uranium. The coast carries huge shoals offish which form the basis of a major fishing industry.
The gross domestic product has recorded an average real growth rate of 3.3 per centbetween 1989 and 1994 with the highest growth rates in 1991 and 1992, and the only decline in1993. The main sources of growth are agriculture, mining, fishing and fish processing, andelectricity and water. The impressive growth rate however increased per capita income by only0.4 per cent during the aforementioned period (EIU, 1993-94). The accelerated growth rate sinceindependence can be attributed to the prevalence of peace and the creation of an enablingenvironment by the Government, both of which have opened up opportunities for investors,domestic and foreign, to exploit the enormous resources of the country.
Table 1.1. Gross domestic product (at current prices)
1989 1990 1991 1992 1993 1994 1995
GDP (N$ million) 5 659 5 956 6 643 7 894 8 372 10 243 11 672
Real growth % 2.1 0.3 6.6 7.5 !1.9 5.4 3.5
GDP per head (N$) 4 481 4 358 4 563 4 697 4 464 4 563 6 670
Source: Central Statistics Office, National Accounts, 1987-94; 1995 estimates by Economist Intelligence Unit.
1.3. Government policy on foreign direct investment
Pre-independenceThere is not much information available on the policy of the Germans in the period before
1915 when Namibia, then South West Africa, became a mandated territory of South Africa. Ofcourse, as the metropolitan country, German investments then would hardly be regarded asforeign. Perhaps the same could be said of South African investments during the mandate years.Indeed South Africa, in 1945, attempted to integrate Namibia into the republic. Although theattempt failed, South Africa operated in Namibia as if it were just a part of the country,dominating the economy and exploiting its land and enormous mineral resources to its ownadvantage.
Post-independenceAfter independence in 1990, the Government moved quickly to create a favourable
environment for foreign investment by enacting the “Foreign Investment Act, 1990”. The Act,among other things, provides for the following:

6 C:\Documents and Settings\bouchet\Local Settings\Temp\WP84 Zimbabwe\v.3
(a) empowers any foreign national to invest in or engage in any business activity which anyNamibian may undertake;
(b) does not discriminate against foreign nationals as regards taxation;(c) permits 100 per cent foreign ownership except in the granting of rights over natural
resources;(d) grants Certificate of Status Investment, which entitles the recipient to several incentives:
investments of N$2 million or any amount of profit reinvestment provided such investmentconstitutes 10 per cent of the equity, provides employment and training, particularly forwomen, earns foreign exchange, locates in less developed areas and/or utilizes localresources;
(e) ensures availability of foreign exchange for payment of dividends and repatriation of profit,fees, etc.; and
(f) provides for compensation in case of expropriation and for arbitration in case of disputes.The provisions of the Act have been largely faithfully implemented, notwithstanding the
forcing of the Iron and Steel Company to share ownership of Rosh Pinah lead-zinc mine with alocal company. This incident has neither deterred the Iron and Steel Company from newinvestment commitments in copper nor has it weakened the enthusiasm of the Government fromsupporting such foreign investment in mining. 3
In 1995 the Government established an EPZ in Namibia with the aim of:• attracting, promoting or increasing the manufacture of export goods;• creating or increasing industrial employment;• creating or expanding export earnings;• creating or expanding industrial investment, including foreign investment; and• encouraging technology transfer and the development of management and labour skills. 4
The EPZ offers incentives to industries which export most (70 per cent) of their output withpreferences given to companies using locally sourced raw materials or employing Namibians.
The EPZ Act was preceded by a set of incentives in 1993. The incentives offered tomanufacturing companies included a 50 per cent tax abatement for five years, accelerateddepreciation of building, exemption from sales duty on import of machinery and equipment, cashgrant for export activities and a 25 per cent deduction of training costs and production wages.
In general, although Namibia is found to offer “the most friendly bureaucratic environmentfor private investment in southern Africa”, its administrative procedure was regarded ascumbersome. 5 To improve the environment still further, the FIAS recommended, among otherthings, a simplification of the incentive system, a reduction of the delay in project approval andtrademark registration and the abolition of racial discrimination in land ownership. Some of theseproblems are being addressed through the establishment of the Investment Centre, a kind of“one-stop-shop” for investors.
These favourable measures and policies as well as the peace and stability existing inNamibia have created a climate conducive to foreign investment. The response of foreigninvestors to this favourable environment is analysed in the next chapter.

C:\Documents and Settings\bouchet\Local Settings\Temp\WP84 Zimbabwe\v.3 7
2. Foreign direct investment in Namibia
2.1. SizeThe paucity of information available on the size and sectoral or geographical distribution
of foreign direct investment (FDI) in Namibia is understandable in view of the fact that a separateNamibian economy can be said to exist only since 1990.
Table 2.1. Direct investment in Namibia
1990 1991 1992 1993 1994 1995 1996
Net FDI flow (US$ million) 28 114 117 49 60 51 52
Net direct investment (N$ million) ! 315 342 152 369 429 584*
Direct investment (N$ million) 5 245 5 801 6 539 5 065 5 674 6 229 6 987
* = Provisional; ! = Figures not available.
Source: Net FDI flow: World Bank: African Development Indicators, 1997; Direct investments: Bank of Namibia Annual Report,1996, pp. 44, 50.
The stock of direct investment increased by over 33 per cent between 1990 and 1996although a decline occurred between 1992 and 1993. This decline resulted from theGovernment’s acquisition of 50 per cent of the equity of a major mining company, the NamibiaDiamond Corporation (Pty.) Ltd. Between 1993 and 1996 the stock of FDI grew at an averageof over 11 per cent annually.
The net direct investment consists of new equity capital and reinvestment of profits. In 1996these sources accounted for 97 per cent of total inflow. Reinvestment of profit by foreigninvestors is a good sign of investors’ confidence in the economy and its prospects.
2.2. Sectoral and geographical distribution of FDINo statistical data are available on the distribution of FDI sectorally or geographically.
However, information obtained through interviews and an analysis of the structure of theNamibian economy suggest that the mining, finance and banking, and food-processing sectorsare the dominant recipients. Mining is mainstay of the Namibian economy, contributing over50 per cent of export earnings in 1994 (74 per cent in 1989), and accounting for over N$5,100million (82 per cent) of FDI stock. Food processing (mainly meat and fish) contributes about9 per cent of GDP, with fish processing accounting for more than 50 per cent. Since 1991,investment in on-shore fish processing plants and fishing vessels has exceeded N$400 million.The largest of such plants is Spain’s Pescanova with an investment of N$170 million.
2.3. Origin and geographical distribution of FDIAbout 75 per cent of foreign investment in Namibia is from South Africa. Other major
investors include Germany, the Scandinavian countries, Spain, Australia and China.Information on the regional distribution of inward FDI was not available. Inferences could
however be made from the sectoral distribution outlined above. The dominance of investment inmining suggests a diffusion of location through the country, depending on the distribution ofmineral resources. Thus, many mines have, through their operations, brought development tootherwise undeveloped areas. The creation of the EPZ regime which grants EPZ status to stand-alone factories in any part of the country may help to spread the location of industry to severalprovinces of the country.

8 C:\Documents and Settings\bouchet\Local Settings\Temp\WP84 Zimbabwe\v.3
2.4. Comparative distribution patternThe pattern of sectoral distribution of FDI in Namibia contrasts with the general trend in
the world. FDI is increasingly shifting from the primary sector, (agriculture, fishing, and mining)into secondary (manufacturing) and tertiary (services) sectors. For example, Canadian outwardFDI in raw materials declined from 32 per cent in 1980 to 15 per cent in 1989 while the shareof services increased from 22 to 38 per cent. Similarly, Japanese outward FDI in raw materialswas only 6 per cent in 1990 compared with 24 per cent in 1980. On the other hand, Japaneseoutward FDI in services increased from 39 to 65 per cent between 1980 and 1990. 6 In Namibia,FDI is concentrated in the primary extractive sectors of mining and fishing. This distributionpattern is changing in many developing countries as FDI finds the manufacturing and servicessectors increasingly attractive. For example, the manufacturing and services sectors dominateJapanese, US and German investment in developing countries (Bailey, 1993, page 25).
2.5. FDI in EPZsThe divergence of the sectoral distribution of inward FDI from the global pattern may be
attributed partly to the small size of the Namibian economy and the erstwhile absence of anindependent Namibia-focused macroeconomic policy. The small size of the domestic marketdetracts from the country’s attractiveness to market-based FDI. Macroeconomic policies such asEPZs or export incentives could be used to overcome the disadvantages of a small market.However, prior to independence in 1990, Namibia was not in a position to formulate such amacroeconomic policy. As such, market-induced FDI was located in South Africa leavingresource-based investments unavoidably in Namibia.
The introduction of the EPZ may increase the share of the manufacturing sector in FDI. Sofar, 35 projects with a planned investment totalling N$377.4 million and potential employmentof over 2,600 have been approved. These projects cover a wide range of companies includingthose involved in the manufacture of motor vehicle components and refurbishment, bathroomaccessories, paints, textiles, etc. Eleven projects are to be located in Walvis Bay with a totalemployment potential of about 900. Currently, four companies are in operation at Walvis Bayemploying about 300 workers, 60 per cent of whom are men and 40 per cent women. The EPZhas thus succeeded in attracting manufacturing industries which may increase the impact offoreign investment on the Namibian economy. The contribution of FDI is analysed in the nextchapter.

C:\Documents and Settings\bouchet\Local Settings\Temp\WP84 Zimbabwe\v.3 9
3. Impact of MNEs
3.1. IntroductionThis chapter examines the impact of the operations of MNEs on the Namibian economy.
Five areas of contribution are analysed: capital inflows, employment creation; skillsdevelopment; industrial relations practices; and national and regional development.
In the absence or paucity of aggregate national statistics in many of the aforementionedareas, the analysis points to emerging trends and relies heavily on information obtained fromindividual companies, sectoral organizations such as the Chamber of Mines, and nationalinstitutions such as the Investment Centre and the Bank of Namibia.
3.2. Capital inflowsThe data in tables 3.1(a) and (b) demonstrate a positive reaction by foreign investors to the
post-independence policy and environment in Namibia. Immediately after independence, the netinflow was low as foreign investors repatriated rather than reinvested their earnings. Insubsequent years, inflows of FDI increased steadily, reaching a peak of N$591 million in 1996from a low of N$76 million in 1990. This consisted of new equity capital as well as retainedearnings, with the latter constituting the major component in more recent years. The confidencedemonstrated by current investors in the economy through reinvestment of their earning oftenencourages the inflow of new equity capital. The figures in section (a) of table 3.1 show thatincreased reinvested earnings is inducing higher new equity capital inflow.
In 1996 the stock of foreign direct investment in Namibia rose to N$6,987 million fromN$5,245 million in 1990, that represented an overall increase of over 33 per cent or an annualaverage of over 6 per cent. On average, equity and reinvested earnings accounted for just under90 per cent of total FDI stock, with debt due to affiliated companies contributing the balance.
Although the sectoral distribution of the stock is not known, the evidence suggests that it ismost likely dominated by investment in mining. In 1993, the stock of capital in the miningindustry was valued at N$5.1 billion, thus accounting for practically the total investment in thecountry. The three major foreign companies, Namdeb (De Beers), Tsumeb and Rossing togetherinvested over N$302 million between 1996 and 1997. The mining sector is the biggest privateemployer and the major source of foreign exchange earnings and tax revenues.
Besides mining, fish processing and manufacturing (particularly in the EPZ), are alsoattracting considerable inward foreign investment. As mentioned above, the EPZ has recorded35 new projects worth about N$380 million in investment as of 1997. In addition, between 1991and 1995, local and foreign private firms invested over N$400 million in new on-shore fishingprocessing plants and vessels. Spain’s Pescanova made the largest investment of N$170 million.

10 C:\Documents and Settings\bouchet\Local Settings\Temp\WP84 Zimbabwe\v.3
Table 3.1. Flow of foreign direct investment: 1990-96 (N$ million)
(a) Annual flow
Equitycapital
Reinvestedearnings
Othercapital
Total
1990 94 (113) 95 76
1991 79 63 191 333
1992 35 191 111 337
1993 58 82 41 181
1994 96 182 70 348
1995 113 363 (43) 433
1996* 290 276 25 591
(b) Stock
Equity or re-invested earnings
Debt dueto affiliates
Total
1990 4 856 389 5 245
1991 5 225 576 5 801
1992 5 933 606 6 539
1993 4 372 693 5 065
1994 4 880 794 5 674
1995 5 495 734 6 229
1996* 6 243 744 6 987
* = Provisional figures. Figures in brackets denote capital outflow or a decrease in foreign financial liabilities.Source: Bank of Namibia.
3.3. Direct employment creationOf the estimated labour force of 494,000 in 1995, about 80 per cent, 395,000, was
“employed”. This number included wage-earners, self-employed persons and informal sectorworkers. Unemployment was thus about 20 per cent of the labour force.
The major employer of salaried workers is the Government — 39 per cent of the salariedemployees. In the private sector, manufacturing has replaced mining as the largest employer. In1994, employment in manufacturing was about 21,000 as opposed to about 9,700 in the miningindustry.
Tables 3.2 and 3.3 present employment statistics in the two major sectors of the economyin which foreign direct investment is dominant. Until 1995 when the Government acquired partof Namdeb’s equity, mining was mainly the preserve of foreign investors whose technology wasneeded to exploit and process the natural minerals. As a result, employment in mining could beattributed to foreign direct investment. Table 3.2, however, shows that while employment inmining has declined, it is still significant not only in terms of numbers but also incomegeneration. In 1981, mining employed over 19,000 persons. By 1996, the number had declinedto 8,540, just under 45 per cent of the 1981 figure. This decline has been attributed to thesimilarly declining fortunes of the mining industries, with the prices of key minerals such asgold, falling below US$300 up to the time of writing. Such declines led to cuts in production andencouraged the use of labour substitution production technologies.
C:\Documents and Settings\bouchet\Local Settings\Temp\WP84 Zimbabwe\v.3 11
Table 3.2. Namibia: Employment and remuneration in mining
Year No. of employeesas at 31 December
Totalremuneration
Averageremuneration
Percentagechange
1981 19 240 120 805 6 279
1982 17 300 132 158 7 639 22
1983 16 595 139 706 8 419 10
1984 15 624 139 441 8 925 6
1985 14 869 152 825 10 278 15
1986 14 428 165 442 11 467 12
1987 12 905 184 034 14 261 24
1988 13 073 241 553 18 477 30
1989 12 776 283 522 22 192 20
1990 13 605 349 018 25 654 16
1991 12 265 387 860 31 623 23
1992 11 441 385 464 33 691 7
1993 9 854 381 156 38 680 15
1994 9 693 397 790 41 039 6
1995 9 775 458 887 46 945 14
1996 8 540 457 009 53 514 14
Source: The Chamber of Mines in Namibia: 1996 Annual Report.
Table 3.3. Namibia: Employment and wages in manufacturing (1994-95)
Industry No. ofestablish-
ments
Number of employees Wages andsalaries
(N$ million)
Averagewage
Namibians Non-Namibians
Total
Food and beverage 116 14 268 363 14 631 326.89 22 342.0
Textile, wearing apparel andleather
18 704 29 733 6.15 8 390.1
Wood and wood products 23 951 4 955 12.44 13 026.0
Paper and paper products 20 929 8 937 24.69 6 350.0
Chemical and chemicalproducts
24 881 14 895 23.05 25 754.0
Non-metallic mineralproducts
28 1 159 11 1 170 15.41 13 171.0
Metal products, machineryand equipment
41 1 591 18 1 609 46.04 28 614.0
Other 8 104 17 121 1.81 14 959.0
Total 278 20 587 464 21 052 456.48 21 683.4
Source: Ministry of Trade and Industry: Report of census of manufacturing establishments, 1994-95, pp. 20 and 24.
In comparison to the decline in employment, remuneration in mining has improvedconsiderably and the average remuneration is very much above the national average. The totalremuneration in 1996 was almost four times that of 1981 in spite of the more than 55 per centreduction in employment. Consequently, average remuneration in 1996 was almost nine timesthat of 1981.
A census of the manufacturing sector in 1994 estimated total direct employment to be21,052. About 98 per cent of that workforce was of Namibian nationality. Employment inmanufacturing has increased more rapidly since 1992, mostly as a result of the success of the

12 C:\Documents and Settings\bouchet\Local Settings\Temp\WP84 Zimbabwe\v.3
EPZ and a favourable government policy to promote higher value added activities in localindustry. The dominant subsector is the food and beverage industry which constitutes about41 per cent of all establishments in the manufacturing sector and employs more than 69 per centof employees.
The census established that only 15 per cent of the 278 manufacturing establishments wereowned by “national and foreign” nationals while the Government and private Namibians ownedthe remaining 85 per cent. It is plausible to assume that the joint-venture companies are muchlarger than their local counterparts. It could therefore be estimated that employment created bymultinational enterprises in the manufacturing sector will range from 3,180 to 5,263, 15 to 25 percent of the total employment.
3.4. Indirect employmentIn the absence of detailed sectoral employment data, it is not possible to estimate the indirect
employment effects of multinational corporation using the method adopted by Miranda (1994,pages 20-21). The method involves the application of an “implied multiplier” [which is the ratioof the total (direct and indirect) labour coefficient to the direct labour coefficient for MNEs], tothe number of direct employees of MNEs, to obtain the number of total direct and indirectemployees. From the total figure obtained, the figure of direct employment by MNEs is deductedto obtain the number of indirect employment.
Respondents of interviews conducted were then requested to estimate the ratio of direct toindirect employment. The estimates ranged from two to four indirect jobs to a single direct job.Indirect employment will include employment created by suppliers of input materials, contractsuppliers, distributors of the output of direct employees as well as personal service providers todirect employees. Using the midpoint of the estimated indirect employment creation, between9,540 and 15,789 jobs could have been created in the manufacturing sector, while about 25,620similar indirect employment opportunities would have been created in mining giving a total ofbetween 35,000 and 41,000 employees.
3.5. Gender distribution of employmentThe gender breakdown of employment by multinational enterprises is not available. The
gender breakdown of total employment by sector (EIU, 1996) and the detailed analysis ofemployment in the manufacturing sector by industry, are indicative of the employment practicesin the country. These analyses are presented in tables 3.4 and 3.5.
Female employment in general constitutes about 38 per cent of total employment.Considerable differences occur among sectors. Women dominate employment in services suchas hotel (71 per cent), public administration (64 per cent), education (59 per cent) and commerceand trade (51 per cent). They also constitute almost half of the employees in health and municipalservices as well as private services. It seems the dominance of women is in relatively low-skilled,non-technical jobs and low-physically exerting jobs. Their share of employment is low in highlyphysically exerting jobs such as those in construction (8 per cent), transport (7 per cent),agriculture (13 per cent) and mining (15 per cent). Similarly, low participation occurs in highlyskilled or technical jobs in electricity and gas and manufacturing activities. Table 3.5 shows thatin the manufacturing sector, although the overall share of female employment is 21 per cent, itis much below that average in relatively higher-skilled industries such as the manufacture ofmachinery and equipment (6 per cent) non-metallic mineral products (8.3 per cent) and chemicaland chemical products (16.5 per cent). On the other hand, women dominate employment in thetextile and garment industries and those that manufacture paper and paper products. These areindustries that utilize relatively mature technologies. This pattern of employment distribution isalso observed in the EPZ in Namibia where women make up 60 per cent of the workforce in the

C:\Documents and Settings\bouchet\Local Settings\Temp\WP84 Zimbabwe\v.3 13
textile and garment industries. This is much higher than the 40 per cent share of femaleemployment in general in the EPZ.
The two major sectors of the economy in which multinational enterprises have been veryactive are mining and manufacturing. Tables 3.4 and 3.5 show that female employment in thesetwo sectors is below the national average. Employment in these two sectors requires training andskills which are less available to the female population particularly in a country just emergingfrom a long history of armed struggle for independence. Moreover, culturally, men are expectedto perform more physically exerting activities, to be the sole or at least major breadwinner forthe family and are therefore often given priority in training, education and employmentopportunities.
Table 3.4. Employed regular workers by industry and gender (percentage)
Sector Male Female
Agriculture 87 13
Mining 85 15
Manufacturing 75 25
Construction 92 8
Commerce and trade 49 51
Transport 93 7
Electricity and gas 100 !
Public administration 36 64
Education 41 59
Health and municipal 53 47
Services — private 53 47
Hotels 29 71
Financial services 62 38
Others 42 58
Political parties 78 22
Don’t know 62 38
Total 62 38
Source: Calculated from EIU, Country profile, 1996, pp. 47-48.

14 C:\Documents and Settings\bouchet\Local Settings\Temp\WP84 Zimbabwe\v.3
Table 3.5. Employment in manufacturing by industry and sex
Industry Total Male Female
No. % No. %
Food and beverages 14 783 11 658 78.90 3 125 21.10
Textiles, wearing apparel 757 330 43.60 427 56.40
Wood and wood products 968 884 91.30 84 8.70
Paper and paper products 944 476 50.40 468 49.60
Chemicals and chemical products 902 753 83.50 149 16.50
Non-metallic mineral products 1 185 1 087 91.70 98 8.30
Metal products — machinery andequipment
1 627 1 529 94.00 98 6.00
Other 139 119 85.70 20 14.30
Total 21 305 16 836 79.02 4 469 20.98
Source: Ministry of Trade and Industry, National Industrial Statistics: Report of census of manufacturing establishments, 1994-95.
Multinational enterprises use more modern capital-intensive technology than localenterprises. As a result, their employment generating capacity for a given level of investment islower than that of indigenous companies. For example, an analysis of investment in the EPZshows that while foreign-owned companies create seven jobs per N$1 million invested, thecorresponding figure for local companies is 18. An analysis of the statistics of the survey ofmanufacturing confirms this pattern. In industries where foreign companies have a relatively highprofile, the amount of fixed assets per employee was much higher than in the case of thoseindustries with only a few foreign companies. As shown in table 3.6, in the former (e.g.chemicals and chemical products), the average size of fixed assets for each establishment and theaverage fixed assets to create each job are much higher than in the case of industries withrelatively less foreign participation. Similar differences as regards labour and capital productivitywere found to exist. Foreign direct investment therefore helps to raise productivity in industryeven though foreign enterprises create fewer employment opportunities than indigenouscompanies.
Table 3.6. Influence of MNEs on productivity and employment
Industry % of costwith FDI
Employee perestablishment
Fixed assets/establishment
N$’000
Output/labour ratio
N$’000
Fixed assets/employee
N$’000
Food and beverages 15 127 10 563 192.6 83.2
Textile, wearing apparel, leather 22 42 525 48 48.1
Wood and wood products 0 42 1 274 61.8 30.3
Paper and paper products 10 47 1 843 96.8 39.2
Chemical and chemical products 29 38 3 701 258.8 97.4
Non-metallic mineral products 18 42 2 145 84.2 51.1
Metal products, machinery andequipment
12 40 2 600 136.4 65.0
Others 25 17 305 21.7 17.9
Manufacturing total ! 77 5 607 168.7 72.8
! = Not available.
Source: Ministry of Trade and Industry: Report of census of manufacturing establishments, 1994-95.

C:\Documents and Settings\bouchet\Local Settings\Temp\WP84 Zimbabwe\v.3 15
3.6. Conditions of service and industrial relationsThere is no minimum wage law in Namibia. In spite of the absence of such a law,
companies pay above-average wages. In the mining sector, wages were said to be “extremelyattractive, competitive remuneration packages inclusive of pension and medical schemes,generous annual and sick leave and generally some form of housing benefits”. 7 As shown in table3.2, wages increased between 1981 and 1996 at an annual average rate of almost 16 per cent.The rate of increase was much higher between 1987 and 1991 than during the earlier or laterperiods. The lower rates of increase in 1981-86 and 1992-96 were due to the drought, the declinein mineral prices and early macroeconomic policies which discouraged foreign investment andmade replacement of productive capital difficult. Wages in the major mines were much higherthan the average and also higher than in the manufacturing and public sectors. The higher wagesin the mining sector are attributable to the dominance of foreign investment in this sector. It isknown that smaller indigenous mining establishments paid much lower wages. The recentincreased inflow of foreign direct investment in the manufacturing sector, particularly the food,and metal products industries, has also improved the level of remuneration in manufacturing. Ingeneral, as claimed by the National Union of Namibian Workers (NUNW), multinationalenterprises pay better wages, offer better conditions of service and employment stability, whileindigenous companies were said to hire and fire at will and avoid paying a fair wage. Manymultinational enterprises were, however, alleged to be paying higher wages for similar jobs inSouth Africa.
Industrial relations practices have improved considerably, particularly since the passage ofthe Labour Act, 1992. The Act abolished racial discrimination, provided for the registration ofworkers’ and employers’ organizations, stipulated the procedure for calling strikes and set uplabour courts to resolve disputes.
Workers are free to join industrial unions which are affiliated to the NUNW. Seven suchunions are affiliated to the NUNW which has a total of 90,000 members.
Relations between the industrial unions and employers, particularly the multinationalcompanies, are cordial. In addition to periodic collective bargaining, mining companies holdregular meetings with the mine workers union during which negotiations on various issues(wages, safety, job grading procedure, etc.) are held. In particular, Namdeb in 1997, concludeda “historic two-year wage agreement with the Mineworkers’ Union of Namibia (MUN)”, andlater engaged in a “comprehensive and independently facilitated ... labour-managementrelationship building exercise”, the first of its kind in Namibia. The exercise led to the“formation of a coordinating forum designed to increase labour-management decision-making”and information sharing. Several other committees were established to deal with such issues asmigrant labour, hostel system, merit, training and audit, food and catering, safety, andlocalization and succession plans (MUN and Namdeb communiqué, 1997).
Companies support union activities by agreeing to deduct union membership dues and bypaying the salaries of shop stewards.
Another evidence of good industrial relations practice is the relatively few cases of industrialaction. As shown in table 3.7, between April 1995 and March 1996, only ten cases of industrialaction were reported. Six were considered illegal while four were legal. A total of 6,613workdays were lost in the eight companies involved. They were relatively small local companies.The largest was a retail company, employing only 244 persons. However, from 22 August to 5October 1996 a major strike requiring the intervention of the Prime Minister, occurred at theTsumeb Corporation, the oldest and largest copper mining company. All the strikes mentionedwere for salary increases. As observed earlier, the big companies, largely MNEs, and the publicsector pay, better than small companies. The strikes were the efforts of small companyemployees to narrow the gap in wages and salaries, at a time when there was a general fall inmineral prices.

16 C:\Documents and Settings\bouchet\Local Settings\Temp\WP84 Zimbabwe\v.3
The low incidence of injuries at the workplace also testifies to the commitment of MNEs,particularly the big mining companies, to observe high standards of occupational safety andtraining. The commitment to maintaining those standards is fostered through competition andawards at both the national and international levels.
Table 3.7. Industrial actions: April 1995-March 1996
Industry No. ofstrikes
Companies involved Work-days lost
Union Legalstatus
Outcome
Mining 3 Nava Chab Gold MineKaribib Min. & Const.
1 786 MUN 1 Illegal2 Legal
1 Unknown1 Wage increase 1 Compromise
Retail and trade 2 Erundu ButcheryHartlief
2 706 NAFAU 1 Legal1 Illegal
1 Increase with 7 employees dismissed1 No increase
Building andconstruction
2 Herma BrothersChina Complant
870 NABWUUnknown
Illegal 2 Compromise
Manufacturing 1 Paralin 348 MUN Legal Unknown
Agriculture 1 Golden Sun Poultry 875 Unknown Illegal 12 employees dismissed
Hotel 1 Oropoko Lodge 28 Unknown Illegal Unknown
Source: Data obtained from the Office of the Labour Commissioner, Windhoek.
Namibian firms have generally maintained a high standard of safety at the workplace. Themining industry in particular has promoted safety awareness in all mines by establishing aNational Occupational Safety Association (NOSA) five-star safety grading system. The highestgrade is attained if there is less than one disabling injury for every 1,000 employees. In 1995 and1996, the disabling injury incidence was 0.59 and 0.50, respectively, per 1,000 employees. In1994, three mines maintained their NOSCAR five-star awards (in one case it was eleventhconsecutive year), and one new member gained it. Tsumeb Corporation, one of the leadingmining companies, gained between two and four stars in Mine Safety Management Systems,while the Rossing Uranium Mines was awarded the British Safety Council “Sword of Honour”for the fifth consecutive time and the “Gold Award” of the UK Royal Society for the Preventionof Accidents.
According to table 3.8, the number of accidents declined by over 22 per cent from 5,015in 1990 to 3,902 in 1995. The rate of decrease in mining is over 46 per cent, even inmanufacturing where there was a large number of injuries, a decrease of almost 5 per cent wasnonetheless registered.
Most injuries in the mining sector occurred in the small mining companies which are notmembers of the Chamber of Mines. While Chamber members dominated employment in thesector, they accounted for less than 10 per cent of all injuries. A comparison of the figures formining and fishery on the one hand, with those of construction and transport on the other, takinginto consideration the relative sizes of their workforces or their contribution to GDP, shows thatthe rate of injuries is lower in the former. It could therefore be inferred that the presence ofmultinational enterprises in the economy has exerted a positive effect on occupational safetystandards.

C:\Documents and Settings\bouchet\Local Settings\Temp\WP84 Zimbabwe\v.3 17
3.7. Skills developmentFaced with the shortage of skilled labour required for the use of modern production
technologies in mining and manufacturing, most of the MNEs in Namibia have placed emphasison training and the development of skills. Most of the companies visited have a trainingdepartment which provides basic training to operatives and supervisory and management trainingto senior employees. Higher technical training is often provided for a few employees in theoverseas parent companies or other affiliates (e.g. Tata, De Beers).
Many large companies have apprenticeship schemes in which trainees acquire theoreticaltraining in the training school and practical experience in the factory. In Namibian breweries, theapprenticeship school prepares students for the Trade Tests, to become artisans. Training inbrewing is also provided for about two-and-a-half years locally, and abroad, for another sixmonths, after which trainees qualify as brewers. Other types of training include basic businessskills, clerical and supervisory, and quality control. In 1996 about 250 employees of the brewerywere trained at a cost of about N$1.5 million.
In the mining sector, Namdeb runs an extensive training programme. Technical trainingincludes mining operations, equipment mechanic, fitter and turner trades and an apprenticeshipscheme for 25 trainees. The apprenticeship scheme comprises a modular training which combinestheory with practice. In 1996, 169 employees were trained abroad and 300 received in-housetraining. In addition, 141 employees benefited from the company’s in-service bursary awardswhich aim to “offer its own employees the opportunity to obtain an undergraduate tertiaryqualification”. The aim is to increase the number of locals employed in higher-level positions.Under the scheme, employees get a full sponsorship and receive a percentage of their salarieswhile they study full time. Namdeb, in 1995, also established a “basic education and skills foradults” scheme to meet the needs of the company for workers with literacy and numeracy skills.The scheme recorded a 73 per cent success among the 415 persons who participated.
Rossing Uranium has also made a major contribution to skills development in Namibia.Rossing with a N$6 million gift to Namibia at independence, established the Namibian Instituteof Mining and Technology in Arandis. The Institute provides training for all industries includingfishing, manufacturing, agriculture, oil exploration and the motor assembly industries. Rossing’straining focuses on company-specific practical management development aimed at all front-linesupervisory staff. It offers bursary awards, and adult education in addition to the vocational skillstraining in electrical and mechanical engineering (Reviewing Rossing, 1996).
Tsumeb’s contribution to training in Namibia consists of the establishment of an AdultEducation Centre, the Teacher’s Centre and the Young Scientist Programme to stimulate interestin the study of Science and Mathematics (Chamber of Mines).
Multinational enterprises have demonstrated a sensitivity to the local milieu in which theyhave their operations and have developed programmes and activities which have improvedconditions in that environment. The MNEs’ contribution to the development of skills in Namibiahas not been limited to the traditional vocational and management training, but has alsoencompassed basic education and numeracy skills.

18 C:\Documents and Settings\bouchet\Local Settings\Temp\WP84 Zimbabwe\v.3

C:\Documents and Settings\bouchet\Local Settings\Temp\WP84 Zimbabwe\v.3 19
3.8. Contribution to national/regionaland economic development
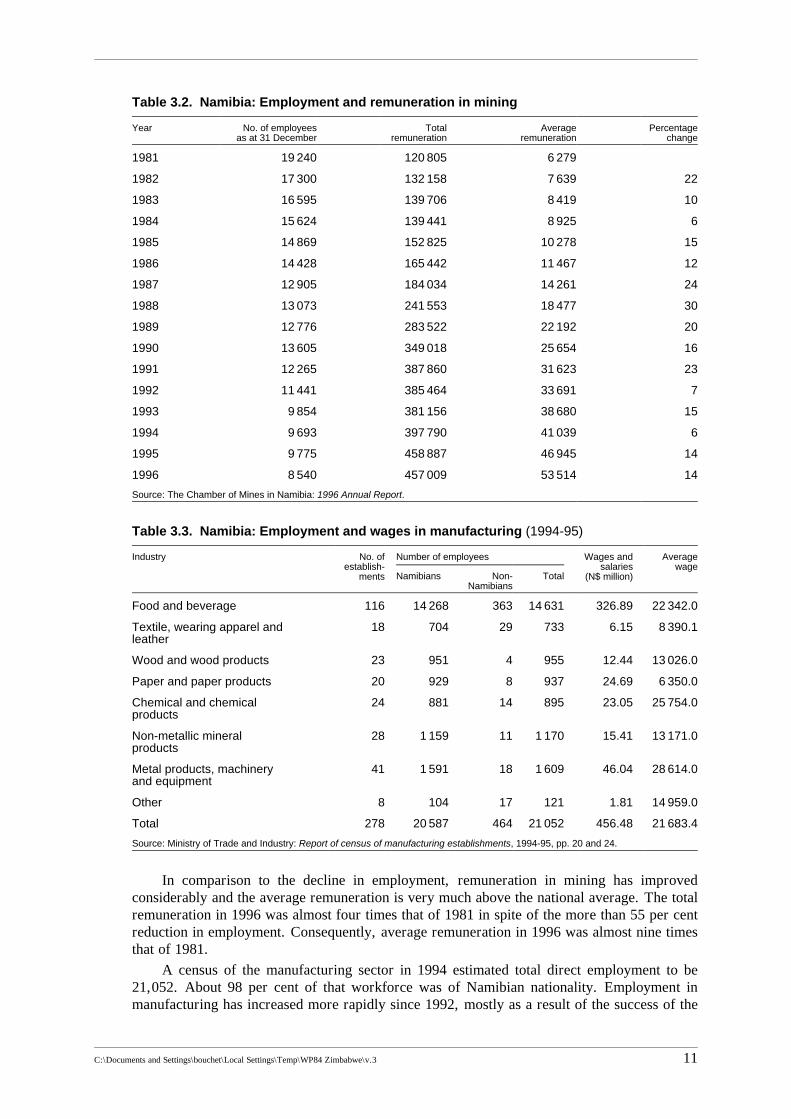
In Africa, development in terms of the availability of infrastructural facilities (roads,telecommunications, electricity, hospitals, potable water, etc.) and in terms of employmentopportunities and the location of industries and government institutions, is often biased towardsurban sectors. Consequently, there is usually an imbalance of infrastructure and job opportunitiesbetween rural and urban areas — that regional imbalance exists in Namibia. Windhoek in theKhomas region is the only large urban centre. In 1993-94, the average regional income wasN$11,359 (three times the national average of N$3,608), and its 84 per cent literacy rate was,and is, the highest in the country. Of Namibia’s 13 regions, six have an average income belowN$2,000, while in seven of them incomes are below the national average (Hanson andMurpotola-Sibongo, page 3).
Inequality also characterizes the geographical distribution of industries. They tend to beconcentrated in the three central regions of Khomas, Erongo and Otjozondjupa which accountfor more than 90 per cent of the national total value added in manufacturing. If the southern stateof Karas is added to these three regions, that raises the percentage to 98 leaving only 2 per centto the remaining nine regions, of which two contribute nothing at all to value added inmanufacturing.
The contribution of multinational enterprises to a more balanced regional developmentvaries, depending on the nature of the investment. MNEs in manufacturing tend to exacerbateregional imbalances as they tend to locate in the relatively more developed regions with goodinfrastructure. The introduction of the EPZ is likely to reinforce this pattern as EPZ investmentseems to be concentrated in towns such as Walvis Bay, Swakopmund, Tsumeb, Keetmanshoopand Otjiwarongo. All these preferred locations, with the exception of Tsumeb, are in the fourregions which account for 98 per cent of value added in manufacturing.
Table 3.9 shows the disparity between the most developed and least developed regions ofNamibia. The former four regions account for just about a quarter of the population butdisproportionately high percentages of total employment, manufacturing establishments and valueadded activities. The latter, consisting of five regions, has more than half of the population butonly 5 per cent of manufacturing establishments and 1.1 and 0.7 per cent of employment andvalue added respectively.
In the mining sector which is dominated by multinationals, location is inevitably determinedby the presence of natural resources. Mining establishments have played a positive role in thedevelopment of rural areas which they have transformed into towns or modern villages.
Towns like Oranjemund, Gobabis, Karibib, Arandis, Luderitz and Tsumeb owe theirexistence and development largely to the development of the mines. The first railway line inNamibia from Tsumeb to Swakopmund was constructed in early 1903 by Tsumeb Corporation.Mine employees provide a ready market for food vendors, clothing merchants and artisans whoare attracted to the mining settlements. The resulting population concentration makes theprovision of schools, hospitals, and other facilities, necessary and viable. This cumulativeprocess turns the rural mining locations into booming towns.
20 C:\Documents and Settings\bouchet\Local Settings\Temp\WP84 Zimbabwe\v.3
Table 3.9. Regional imbalance in development
Region Population Percentage distribution Valueadded
N$ income1993-94
Literacy(%)
No. ofmanufacturing
establishments
No. of personsengaged
Developed 27.5 85.4 96.3 98.2 ! !
Erongo 4.0 23.4 41.5 37.1 5 423 81
Otjozondjupa 7.3 19.7 11.6 12.9 3 659 58
Khomas 11.8 37.2 26 40.4 11 359 84
Karas 4.4 5.1 17.2 7.8 6 655 82
Undeveloped 53.2 5.1 1.1 0.7 ! !
Omusati 13.5 0 0 0 1 452 68
Ohangwena 12.7 0 0 0 1 070 51
Oshana 9.6 1.5 0.4 0.1 1 922 70
Oshikoto 9.1 2.9 0.6 0.5 1 680 61
Okavango 8.3 0.7 0.1 0.1 1 763 55
! = Figures not available.
Sources: (i) National Planning Commission, Namibia: Population and development planning (1994); (ii) Ministry of Trade and Industry:Report of census of manufacturing establishment (1994-95) p. 14; (iii) D. Hansohm and M. Murpotola-Sibongo: Overview of theNamibian economy, Sep. 1997, p. 3.
The mining companies play the role of municipal authorities in the mining towns. Namdeb,for example, provided all the infrastructure for Oranjemund, including schools, hospitals, watersupply and sewage disposal. The town of Luderitz benefits from its nearness to Namdeb’sElizabeth Bay Mines which, through its employees and direct business relations with otherenterprises and the council, contributes about N$11 million to the community. It sponsors localathletes, organizes and supports sports activities and subsidizes housing for its staff.
Mining has contributed to the development of Karibib which is 10 km away from theNavachab mines. Navachab’s demand for water necessitated and made economically viable theconstruction of an 85 km water pipeline from Swakopmund Dam. The company also built 84 newhouses and provided roads, water and electricity, thereby bringing new life and employmentopportunities.
The growth of Arandis was similarly helped by the establishment of the Namibian Instituteof Mining and Technology, which was made possible by a donation of N$6 million by theRossing Uranium Ltd.
The practice of subcontracting non-core business activities has promoted a more balancedregional development. Many mining companies have contracted out ancillary services such assecurity, cleaning, transport of personnel and the operations of various shops. The contractorsare usually indigenous businessmen, some of whom were former employees of the miningcompanies. Even the Mine Workers’ Union has established an investment company to undertakesome of the services that are contracted out.

C:\Documents and Settings\bouchet\Local Settings\Temp\WP84 Zimbabwe\v.3 21
4. Conclusions and prognosis
4.1. IntroductionThe study of multinational enterprises in Namibia is faced with the problem of lack of
quantitative and up-to-date information. Given the recency of Namibia’s nationhood, and the all-prevailing influence of South Africa which administered Namibia until 1990, there was not muchdistinction between domestic and foreign investment. Official statistics on foreign directinvestment are aggregated in terms of inflow and outflow and their impact on the balance-of-payment. There is hardly any information on the sectoral or regional distribution of suchinvestment. This study has therefore depended largely on information from individual companies,employer associations, labour union officials and government institutions and officials.
4.2. ConclusionsThe Namibian economy is quite dynamic. Its enormous mineral and marine resources have
been the main attraction to foreign investment. The existence of an environment conducive toforeign investment, particularly the Foreign Investment Act, enhance the attractiveness ofNamibia as a host-country to multinational enterprises. As a result, as at the end of 1996,Namibia was host to about N$7 billion in foreign investment which grew steadily since 1990.Most of the investment has been in mining, fishing and the emerging fish and food processingindustries. It could therefore be concluded that foreign investment in Namibia follows thetraditional pattern, being predominantly in the primary extractive sector. However, the decliningprices of minerals and the establishment of the EPZ may soon result in a shift in investment fromthe primary to the secondary sector of the economy. This will be in line with global trends inforeign direct investment flows to developing economies.
Multinational enterprises contribute significantly to the national economy of Namibia bycreating employment, producing for export and contributing to government revenues. They alsohelp to transfer managerial skills, develop infrastructural services and promote entrepreneurshipthrough the subcontracting of ancillary services. However, there is doubt as to whether theoperations of MNEs promote a more even regional development. In a study of FDI in Viet Nam,Khan found that although FDI may increase regional income, output and employment, “there isalso a tendency to exacerbate existing inter- and intraregional inequalities as well” (1997,page 6). This study of FDI in Namibia corroborates Khan’s finding. As shown in table 3.9,considerable inequalities still exist among the regions in Namibia. Some regions are not beingtouched by MNEs’ operations in manufacturing. On the other hand, regions with mineral depositshave benefited significantly in terms of employment, as well as the growth and development oftowns, infrastructure and communications. Overall, MNEs have had a positive influence onnational and regional economic development. Their contribution is greater in relatively developedareas or areas with mineral deposits. The effect is, as pointed out earlier, an exacerbation of interand intraregional inequalities.
The development and improvement of managerial, technical and entrepreneurial skills andknow-how are major benefits expected of MNEs. Faced with a shortage of skilled labour, mostMNEs have had to offer basic on-the-job training to their staff. Many have establishedapprenticeship schemes, adult literacy classes, higher technical educational institutions as wellas financial assistance to their employees for university education. The MNEs can claim partialcredit for the high level of literacy (77 per cent) in Namibia, a level much higher than those inmost other sub-Saharan African countries.
The practice of subcontracting may also be seen as a means of stimulating the developmentand upgrading of skills. In Oranjemund, former employees of Namdeb now own and manage thebakery, the butchery and many other services formerly provided by the Company. Theentrepreneurial, technical and managerial skills gained in such enterprises can be transferred to

22 C:\Documents and Settings\bouchet\Local Settings\Temp\WP84 Zimbabwe\v.3
other sectors with such entrepreneurs becoming the nucleus of an indigenous class ofindustrialists.
The National Union of Namibian Workers, in a comparison of local companies and MNEs,considered the latter to offer better wages, conditions of employment and training. They are alsomajor contributors to government revenues. It is plausible to conclude that their impact ontraining, skills development and working conditions in Namibia has been positive.
The evidence suggests that the activities of MNEs are more capital — rather than labourintensive. Apart from the decline in mineral prices which necessitated the reduction in mineraloutput and consequently in employment, the substitution of capital for labour has contributed toa decrease in employment in mining. The two factors are related. As prices of minerals decline,there is need for greater efficiency and lower costs, which is more easily achieved by utilizingcapital-intensive technologies.
The census of the manufacturing sector showed a higher output/labour ratio than theoutput/fixed assets ratio in practically all industries. In manufacturing, it generally takesN$72,800 in fixed assets to create one job. This figure may be as high as N$97,400 in thechemical and chemical products industry and as low as N$30,300 in the wood and wood productsindustry. Thus capital intensity is partly a function of the nature of the particular industry and thelevel of technology used. MNEs tend to adopt more modern and less labour-intensive technologythan domestic enterprises. This practice has occasionally created industrial relations problems inthe industries and the private sector has even been criticized for having “dismally failed increating jobs”. 8
4.3. PrognosisWhat is the future of FDI in Namibia? Two factors augur well for the growth of FDI in
Namibia: the natural wealth of the country and the existence of an environment which isconducive to attracting FDI. The wealth of the country was discussed briefly in Chapter 1. FDIwill be needed to activate these latent resources — land for pastoral farming, the fish-rich coastand the exceptionally rich mineral deposits (e.g. diamond, uranium, copper).The need for FDIfor the development of the manufacturing sector was also recognized. The census reportconcluded that “in the absence of any significant and substantial direct foreign investments in thissector, growth will remain stagnant for some time. It considered it imperative that theGovernment encourage joint ventures between Namibian and foreign investors in order “toincrease the level of gross fixed investment and capital formation in the sector.
The Government, recognizing that FDI is indispensable for developing the country, hascreated an “enabling” environment for such investment. The country enjoys political stability,has one of the most developed infrastructural services in Africa and has adopted a liberal foreigninvestment policy.
The establishment of the EPZ all over the country, and particularly at Walvis Bay, and thesetting up of the Namibian Investment Centre, have served as catalysts for FDI. They havefacilitated the entry of foreign investors by minimizing the bureaucratic processes in approvinginvestment applications, providing information, support services such as labour recruitmentservices and building facilities.
The location of Namibia on the west coast is an added advantage. The port of Walvis Bayseems more accessible and closer to Europe than ports in South Africa. However, Namibia facesa formidable competition in attracting foreign investment because of its proximity to South Africawhich virtually dominates its economy. Namibia’s membership in SACU is said to inhibit thedevelopment of high-level expertise and national competencies. Another argument is thatmembership in this organization is being used by South Africa to divert investment from Namibiaand other neighbouring countries into South African conurbations.

C:\Documents and Settings\bouchet\Local Settings\Temp\WP84 Zimbabwe\v.3 23
1 Economic Intelligence Unit (EIU), 1993-94, p. 17.2 J.D. Omer-Cooper: History of southern Africa (2nd edition) (London, James Currey Publishers), 1994, pp. 278-
294.3 EIU: Country profile, 1st quarter, 1996.4 L. Ayoade: “Why export processing zones”, in Namibia Business Journal, Sep. 1997, p. 13.5 Foreign Investment Advisory Services: Namibia: Administrative barriers to investment: The red tape analysis
(1996). 6 P. Bailey, A. Parisotto and G. Renshaw (eds.): Multinationals and employment (Geneva, ILO, 1993), p. 23.7 The Chamber of Mines of Namibia: Mining in Namibia.8 R. Moorson: The private sector and employment, Windhoek: The Namibian Economic and Policy Research
Unit, 1993.
Notes

24 C:\Documents and Settings\bouchet\Local Settings\Temp\WP84 Zimbabwe\v.3
BibliographyAyoade, O. 1997. “Why export processing zone”, in Namibia Business Journal (Windhoek,
Namibia National Chamber of Commerce and Industry), Sep. Bailey, P., Parisotho, A., and Renshaw, G. (eds.). Multinationals and employment: The global
economy of the 1990s (Geneva, ILO).Ballat, J., Frank, I., Shen, X. 1996. Suppliers to multinationals (Foreign Investment Advisory
Services [a joint service of the International Finance Corporation and the World Bank]).Bank of Namibia. 1996. Annual Report, 1996.Belot, T. and Weigel, D. 1992. Programs in industrial countries to promote FDI in developing
countries (Foreign Investment Advisory Services).Bertil, O. (ed.) 1993. Southern Africa after apartheid (Uppsala: The Scandinavian Institute of
African Studies).Economic Intelligence Unit. 1994. Country profile: Botswana, Namibia and Swaziland, 1993-94.—. 1996a. Country Profile: Botswana, Namibia and Swaziland,1995-96.—. 1996b. Country Profile: Botswana, Namibia and Swaziland, 1996, 1st quarter.Foreign Investment Act, 1990.Foreign Investment Advisory Service. 1996. Namibia: Administrative barriers to investment:
The red tape analysis.Halbach, A.J. 1989. Multinational enterprises and subcontracting in the Third World: A study
of international linkages (Geneva, ILO, Multinational Enterprises Programme, WorkingPaper No. 58).
Hansohm, D. and Murpotola-Sibongo, M. 1997. Overview of the Namibian economy(Windhoek).
ILO. 1981. Employment effects of multinational enterprises in developing countries (Geneva).—. 1996. Year Book of Labour Statistics.International Monetary Fund. 1996. International financial statistics (Washington, DC).Investment Centre. Ministry of Trade and Industry. 1997. The Namibian investor (Windhoek).Khan, H. 1997. “The impact of foreign direct investment on regional and human development
in transitional economics”, in Regional development dialogue, Vol. 18, No. 1, Spring.Mineworkers’ Union of Namibia. Namdeb MDEB Diamond Corporation. 1997. Communiqué
issued after their Luderitz Bosberaad, Aug.Ministry of Labour and Manpower Development. 1991. The status of economically active
population of Namibia: Report of a labour force sample survey (Windhoek).Moorson, R. 1993. The private sector and employment (Windhoek, the Namibian Economic and
Policy Research Unit).Namdeb Diamond Corporation (Pty.) Ltd. 1996. EWI Namdeb, 2nd quarter, Windhoek.Namibia Chamber of Commerce and Industry. 1997. Namibia Business Journal, Vol. 7. Feb.National Planning Commission, Central Statistics Office. 1994. Namibia population and
development planning (Windhoek).—. 1997. National accounts, 1981-96 (Windhoek), May.Omer-Cooper, J.D. 1994. History of southern Africa, 2nd edition (London, James Curry).Rossing Uranium Ltd. 1996. Reviewing Rossing.The Chamber of Mines of Namibia. 1996. 18th Annual Report (Windhoek).—. Mining in Namibia.Wells, L.T. and Wint, A.G. 1990. Marketing a country (Foreign Investment Advisory Service,
Occasional Paper 1).

C:\Documents and Settings\bouchet\Local Settings\Temp\WP84 Zimbabwe\v.3 25
Yaldwyn, R., Hanekon, W., Moroff, W. and Murray, A. 1996. Namibia: Emerging marketopportunity, Nov.

26 C:\Documents and Settings\bouchet\Local Settings\Temp\WP84 Zimbabwe\v.3

C:\Documents and Settings\bouchet\Local Settings\Temp\WP84 Zimbabwe\v.3 27
Appendix
Names of organizations that providedinformation and officials interviewed
A. Government organizations1. Bank of Namibia
— W. I. Shiimi, Manager, Economics— Hendrie Scheun, Manager, Balance of Payments— Sylvia N. Shikongo, Senior Exchange Control Officer— Mrs. Kamundu
2. Central Bureau of Statistics— F.S.M. Hangula, Government Statistician
3. Namibia Investment Centre— Freddie U. Gaoseb, Deputy Director, Projects and Evaluation— Ndeshi Hangula-Shikwambi, Manager, Investments
B. Employers1. Chamber of Mines
— John Rogers, General Manager2. Companies
— Markus J. Lubber, Financial Manager, De Beers Services Proprietary, Ltd. (De Beers)— L.G. Murray, Group Secretary, De Beers— Hilifa Mbako, Manager, Corporate and Public Affairs, Namdebt diamond Corporation (Pty.)
Ltd.— Bernd Masche, Managing Director, Namibia Breweries Ltd.— Gerhard Van Biljon, Human Resources Manager, Namibia Breweries Ltd.— R. McG. Miller, Technical Manager, National Petroleum Corporation of Namibia (Pty.) Ltd.
(NAMCOR)— John D. Mandy, General Manager, Stocks and Stocks Properties (Pty.) Ltd. (Namibia)— A. Kannan, General Manager, Tata Namibia (Pty.) Ltd.— Alex Paremore, Vice-President, the Indigenous Peoples’ Business Council of Namibia— Shikongo E. Pandeni, Administration Manager, NAMCOR— Stoffberg, Managing Director, Meat Company of Namibia— B. Masche, Managing Director, Iron and Steel Company (ISCOR)— Van Bilton, ISCOR
C. Workers— C.R. Haikali, Ag., Secretary General, National Union of Namibian Workers

28 C:\Documents and Settings\bouchet\Local Settings\Temp\WP84 Zimbabwe\v.3
C:\Documents and Settings\bouchet\Local Settings\Temp\WP84 Zimbabwe\v.3 29
Part 2
Zimbabwe

30 C:\Documents and Settings\bouchet\Local Settings\Temp\WP84 Zimbabwe\v.3

C:\Documents and Settings\bouchet\Local Settings\Temp\WP84 Zimbabwe\v.3 31
1. Country background
1.1. PoliticalZimbabwe, with a population of about 12 million people, was under settler governance until
1980 when it became independent after a war of liberation lasting over a decade. Formerlyknown as Southern Rhodesia, Zimbabwe came under the rule of British settlers in the nineteenthcentury when, in 1889, the British Southern Africa Company (BSAC) was granted a charterwhich conferred on it the rights to “all metals, and minerals” in the country (Sylvester, 1991,page 18). The British settlers invested in mining and agriculture and established a system ofgovernance that discriminated against the indigenous people of the land. Discrimination took theform of denial of equal opportunity and the forced acquisition of fertile agricultural land.
1.2. The economyZimbabwe’s economy is one of the most developed in Africa, second to that of South
Africa. It has a “well-developed manufacturing sector, prosperous commercial farming, variedmineral resources and relatively dense infrastructure” (EIU, 1996-97, page 9). Unlike manyother African countries, the GDP of US$5 billion in 1995 was spread over various sectors, withmanufacturing contributing 25 per cent, agriculture 12 per cent and mining 7 per cent, whileservices contributed 50 per cent. (Mushiri, 1995, page 23).
In the first two years of independence, the economy recorded a high growth rate of 11 percent but this declined in 1982 and 1983 as a result of foreign exchange shortages, lack of skilledmanpower, drought, poor transport and slow growth of exports. Overall, the economy grew atan average of 3.5 per cent per year between 1965 and 1996 (World Bank, 1998, page 26), andat 8.1 per cent in 1996 (Murerwa, 1997, page 4) but declined by 3 per cent in 1997(Zizhou, 1998).
Diversification in manufacturing was an inadvertent result of the minority government’sUnilateral Declaration of Independence (UDI) which led to economic sanctions against thecountry. Local manufacture was then encouraged to fill the gaps, thus producing a domesticeconomy with a high degree of self-reliance. At its peak, manufacturing produced over 6,000products and provided 47 per cent of inputs for the mining industry and 66 per cent of those foragriculture (EIU, 1996-97). That structure created a conflict among the three business sectoralinterests of agriculture, industry and mining, in the post-independence years. The conflict arosebecause of a change in the pattern of protection provided to the manufacturing sector. Economicsanctions on Rhodesia were lifted after independence in 1980. The new Government removedimport licences and imposed tariffs on imported inputs while removing them from capital goods.Agriculture and mining welcomed the removal of duty on imported capital while themanufacturing sector opposed it. Manufacturers also opposed the higher duties imposed on inputsthan on finished goods, a policy which put them at a competitive disadvantage with imports.
1.3. Government economic policy
1.3.1. The colonial periodThe foundation of the modern Zimbabwean economy was laid by foreign capital, mainly
British and South African. The BSAC made large investments in order to exploit the deposits ofgold, coal, iron, asbestos and other minerals. With initially disappointing finds in gold, the settlergovernment encouraged the inflow of foreign capital, mainly from De Beers and Gold Fields,both of South Africa, in order to promote more rapid development of resources in the territory(Sylvester, 1991, page 18).

32 C:\Documents and Settings\bouchet\Local Settings\Temp\WP84 Zimbabwe\v.3
Settlers’ capital also developed commercial agriculture as a substitute for the disappointingyield from gold mines. By 1904, there were 2,040 white farmers cultivating 74,251 hectares ofmaize and tobacco. Between 1904 and 1911, the number of black workers rose from 7,000 toover 37,000 and white workers from 949 to 2,255 (Sylvester, 1991, pages 22 and 23). Currently,about 6,000 commercial farmers produce 90 per cent of maize and cotton, and practically all thetobacco, tea and coffee while about 700,000 household farmers cultivate around 18 millionhectares of land.
The entire industrial sector was also dominated by local whites and to a certain extent byforeign capital while blacks historically have been excluded from urban-based business activities(Rasmussen, 1992, page 22). They suffered discrimination in prices, land ownership and rightsof association.
Economic policy in the pre-UDI years was liberal and open, characterized by export andtrade orientation, government concentration on infrastructure development, fiscal discipline andflexibility. The reverse was true of the post-UDI years. Faced with increased internationalisolation and domestic pressure, the settler government adopted a more restrictive and closedeconomic policy, and also relaxed fiscal discipline. As a result, private investment declined andproduction technology became obsolete. An attempt to prevent the total loss of export marketsled to a trade agreement with South Africa, whereby both countries accorded preferentialtreatment to the other’s exports.
UDI proved to be a blessing to local manufacturing. Forced to be largely self-reliant, thecountry encouraged local producers, who responded by increasing the range of products from600 in 1965 to over 6,000 by the 1980s. The ban on profit remittance and the adoption of animport substitution industrialization (ISI) policy increased the size of foreign capital as it forcedinvestment into new ventures (EIU, 1996-97). In summary, the early colonial period was one of“very rapid overall growth, fuelled by a heavy reliance upon exports, massive governmentinvestment particularly in infrastructure, larger-scale infusions of foreign capital andimmigration” (Skalnes, 1995, page 40). On the other hand the post-UDI colonial years sawrestrictions and a “nationalistic” closed, protective economic policy.
The colonial economic policy illustrates the two faces of foreign direct investment (FDI).FDI helps accelerate the pace of development and the exploitation of resources, even if itincreases the economic dependence of the host country. On the other hand, the absence of FDImay slow down the pace of development but it makes countries more self-reliant. Proponents andopponents of FDI in host countries often discuss this dilemma.
1.3.2. Post-independenceAlthough independence is only 18 years old, it can be divided into two periods, 1980-89 and
1989-97 for the purpose of economic policy analysis. Paradoxically, economic policy change isa reversal of that during the colonial period, moving from a controlled to a liberalized policy.
1.3.2.1. 1980-89The first ten years of independence were years of a controlled Marxist-oriented economy.
The newly independent Government wished to exercise sovereignty over the economy. Ittherefore controlled foreign exchange rates, prices, investments, wages and employment. TheGovernment was also committed to the expansion of social services — health, education,housing — as a means of redressing the inequities of the past. Financing such expansion throughfiscal policies resulted in high budget deficits, which rose to 7.7 per cent in 1984 and 10 per centin 1987. Exports were encouraged through export loans by the Reserve Bank of Zimbabwe.
The Government pursued a policy of state capitalism as a means of countering the“unacceptably high” level of foreign ownership. This policy produced state-owned companiessuch as the Zimbabwe Steel and Coal Authority and the Zimbabwe Mining Development

C:\Documents and Settings\bouchet\Local Settings\Temp\WP84 Zimbabwe\v.3 33
Corporation through which the Government acquired major share ownership of erstwhile privatecompanies largely owned by white settlers.
As might be expected, the policy on FDI was hostile. Foreign investors were regarded as“foreign capitalist exploiters”. The Government tried to maximize self-sufficiency and controlwhile keeping existing capital within the country (Skalnes, 1995, page 122). In 1982, governmentguidelines welcomed FDI “if it would make a contribution to the economy, including the trainingof Zimbabweans, enter into joint ventures with domestic and state concerns, avoid dilutingexisting domestic participation in enterprises, undertake intensive use of local raw materials andprocessed input, and enter areas in which labour-intensive technology and technology appropriateand easily adaptable is promoted and generate exports within a reasonable period” (Sylvester,1991, page 113). These expectations of FDI were practically impossible. However, evidence ofgovernment realism and flexibility in implementing the policy is demonstrated in its approval ofHeinz’s acquisition of a 51 per cent controlling interest in the “ailing local firm of Olivine”(Sylvester, 1991, page 114).
The results of nationalistic economic policies are reflected in table 1.1. GDP grew at anaverage of 4 per cent per annum during the period 1980-94. Growth in the first three years was“propelled by growth in wages, good rains, international legitimacy and peace” (EIU, 1996-97).Poor growth in 1982-84 resulted from shortage of foreign exchange, lack of skilled manpower,drought, a fall in mining prices, slow growth in exports and transport bottlenecks. After thedrought of 1987, there was a recovery which resulted from a loosening of government controlof the economy in response to agitation from the business sector for economic liberalization. In1988, private sector organizations (the Confederation of Zimbabwe Industries (CZI), theCommercial Farmers Union (CFU), the Chamber of Mines, the Zimbabwe National Chamberof Commerce (ZNCC) and the Zimbabwe Tobacco Association) acting under the umbrella of theZimbabwe Association of Business Organisations (ZABO) called for “a phased programme oftrade liberalization coupled with relaxation of controls on prices, wages, investment and hiringand firing, as well as supportive policies of public expenditure reductions and the like” (Skalnes,1995, page 128). In addition the failure of existing policies to achieve desired goals set the stagefor economic liberalization.
Table 1.1. Gross domestic product 1980-94 (1980 prices)
Year GDP (Z$ million) % Change
1980 3 224 10.7
1981 3.537 9.7
1982 3 589 1.5
1983 3 461 -3.6
1984 3 450 2.3
1985 3 803 7.4
1986 3 881 2.1
1987 3 861 -0.5
1988 4 143 7.3
1989 4 332 4.6
1990 4 428 2.2
1991 4 568 3.2
1992 4 301 -5.8
1993 4 341 0.9
1994 4 661 7.4Note: 1992-94 figures are provisional.

34 C:\Documents and Settings\bouchet\Local Settings\Temp\WP84 Zimbabwe\v.3
1.3.2.2. 1989-98In a policy statement of April 1989, the Government of Zimbabwe (GOZ) set out its new
policies and regulations for the promotion of investment. The main objectives of the neweconomic policy were “rapid growth, full employment, price stability, efficiency in resourceallocation and the equitable distribution of benefits” (GOZ, 1989, page 3). These objectives wereto be achieved through investment in the key sectors of agriculture, industry, commerce andmining as well as in infrastructure and the social sector. For once, government explicitly“recognises the important developmental contribution that the private sector, both local andforeign, can make by increasing investment in Zimbabwe” and enunciated a “policy to encouragean active and viable private sector alongside a strong public sector” (GOZ, 1989, page 4).
This policy sets out explicit guidelines for FDI. Specifically, it:(i) defines a foreign investor;(ii) accords preference for majority Zimbabwean participation in new foreign investment
projects;(iii) discourages foreign investment in commercial farming, services and services-related sectors
such as banking, retail and wholesale trading and consultancy services;(iv) encourages foreign investment in priority sectors of agriculture, industry, commerce and
mining which have high local value added through the use of local resources,labour-intensive technology, research and development activities;
(v) generates substantial employment opportunities;(vi) enables the transfer of advanced technology, provides training opportunities to
Zimbabweans and brings substantial socio-economic benefits to rural areas;(vii) establishes the Zimbabwe Investment Centre (ZIC) which provides a “single-window”
facility for investment information and approval (GOZ, 1989, pages 4 and 5).The Promotion and Investment Policy statement was followed in 1990 by another policy
paper on economic reform titled “Zimbabwe: A framework for economic reform (1991-95)”.The paper sets out strategies for stimulating investment which are based on “reliance on marketforces, trust in the private sector and enthusiasm for foreign investment” (ZIC, page 6). Theframework contained a review of fiscal and monetary policies aimed at reducing the Governmentdeficit through cutting down the public sector and reducing subsidies to parastatals through theirrationalization, commercialization and privatization. It also decontrolled and liberalized trade,investment and employment policies.
Another major institutional measure to promote FDI was the establishment of an ExportProcessing Zone (EPZ) by an Act of Parliament in 1994. The EPZ is to promote local andforeign investment, to grant EPZ licences to producers and issue permits to industrial parkdevelopers. Five such parks are being planned, three in Harare, and one each in Beitbridge andMutare. The EPZ Act offers approved investors several incentives which include:(i) duty-free importation of all raw materials, intermediate goods, capital equipment and
machinery used in EPZ operations;(ii) permission for up to 100 per cent foreign ownership;(iii) a five-year tax holiday and a low (15 per cent) corporate tax thereafter;(iv) full repatriation of profits and dividends;(v) exemption from various taxes — e.g. capital gains, fringe benefits, dividends, branch profit,
fees, remittances and royalties; (vi) refund of sales tax on local purchases (ZIC, page 66).
The Government commitment to a liberalized, private sector-led economy is underlined byits recently adopted Zimbabwe Programme for Economic and Social Transformation(ZIMPREST). ZIMPREST is to last for ten years, 1996-2006. It reaffirms governmentcommitment to fiscal “reform, trade and exchange rate liberalisation, domestic deregulation andsocial safety nets to protect the poor sectors of society”. The policy also emphasizes commitment

C:\Documents and Settings\bouchet\Local Settings\Temp\WP84 Zimbabwe\v.3 35
to the tripartite system, the development of small and medium-scale enterprises, and promises“concerted efforts ... to attract foreign direct investment as a source of scarce capital resourcesand a vehicle for technology transfer as well as an opportunity for strategic partnerships and theintroduction of new skills” (Ministry of Industry and Commerce, 1997, page 4).
Zimbabwe can be said to have turned full circle, from suspicion and hostility towards FDIto enthusiastic encouragement and welcome. The 1990s therefore represent a watershed for FDIin Zimbabwe. The period presents an opportunity to study the relationship between economicpolicy, particularly on FDI, and the response in terms of foreign investment flow andcontributions to the economy. Chapter 2 of this paper analyses the volume of inflow whileChapter 3 studies the impact of FDI on the Zimbabwe economy.

36 C:\Documents and Settings\bouchet\Local Settings\Temp\WP84 Zimbabwe\v.3
2. Foreign direct investment in Zimbabwe
2.1. IntroductionModern industry in Zimbabwe owes its existence to the introduction of FDI, mainly through
the BSAC and white settlers. They opened up the mines and established commercial farms,bringing in perhaps the first non-transient foreign capital and thereby laying the foundation forFDI in manufacturing in later years.
2.2. Size of FDIIt appears to have been the general practice of the colonial governments in Africa not to
keep statistics on foreign investment: statistics on FDI in Zimbabwe were hardly available until1980, after independence. And during the first decade, interest in FDI focused mainly on thebalance of payments effect. Thus statistics were kept in terms of “net” inflow. There was littlerecorded information on the size of inflow, the source or the sectoral/geographical location inthe host country. Table 2.1 presents the net inflow of FDI to Zimbabwe for 1980, and for1987-96.
Table 2.1. Net FDI in 1980 and 1987-96 (US$ million)
1980 1987 1988 1989 1990 1991 1992 1993 1994 1995 1996
10 -86 -57 -47 -34 10 6 27 80 168 32
Annual Average
1975-84 1985-89 1990-96
1 -43 41.3
As % of GDP As % of gross domestic investment
1980
1995 1980 1995
0.0 0.6 0.2 2.2
Source: (1) World Bank: African Development Indicators, 1997, page 82.(2) World Development Indicators, 1997, page 234.
Table 2.1 illustrates the nature of FDI. The net inflow in 1980 could be explained by thesame factors which accounted for the growth of GDP in that year, as discussed above. After aninitial response to the new Government and the prospect of an open, liberal economy, FDIdeclined because of the unfavourable economic policy of controls and restrictions. The averagenet inflow of FDI of US$1 million between 1975 and 1984 deteriorated severely to an averagenet outflow of US$43 million between 1985 and 1989. The return to a liberal economic policyand the enthusiastic promotion of FDI in the 1990s have paid off in terms of a surge in the annualaverage net inflow of FDI to US$41.3 million between 1990 and 1996. FDI is thus becoming anincreasingly significant component of the gross domestic investment in Zimbabwe.
Since 1991, when the Zimbabwe Investment Centre (ZIC) was established, more detailedinformation on FDI has become available. The ZIC, the sole agency for approving newbusinesses or introducing or increasing FDI in existing businesses, keeps a record of the amount,sectoral and geographical location, jobs created and exports arising from approved projects.
Table 2.2 presents the statistics on FDI in Zimbabwe from 1991 to 1997. The table showsan almost fourfold increase in the number of projects between 1991 and 1996. The 1997 figures

C:\Documents and Settings\bouchet\Local Settings\Temp\WP84 Zimbabwe\v.3 37
do not include local investment projects, as was the case in earlier years. In the same period,total investment as well as the foreign exchange component increased elevenfold. Table 2.2 alsoshows evidence of a change in the size of projects, level of ownership and type of technology.Projects have become more capital-intensive. In 1991, for example, the average investment perproject was Z$7.4 million. In 1996 and 1997 the average investment was Z$23.1 and Z$21.4million respectively. The average number of employees per project declined from 58 in 1992 to29 in 1996 although in 1997 it rose back to the 1992 figure of 58. Capital intensity is alsoreflected in the declining number of jobs created per Z$1 million investment from 10.3 in 1992to only 1.3 in 1996 and 2.7 in 1997. This raises the problem of appropriate technology, an issuethat will be discussed in Chapter 3.
Table 2.2. Projects and FDI in Zimbabwe, 1991-97 (Z$ million)
Year No. ofprojects
Total investment Forex component No. of jobs
Export earnings Importsavings
Jobs created per
$ mill. inv. Project
1991 117 867.0 – – – – – –
1992 290 1 628.3 – 16 850 – – 10.3 58
1993 271 1 919.8 738.5(38.5)
14 396 1 765.7 43.2 7.5 53
1994 365 5 491.3 4 105.6(74.8)
9 939 1 859.3 234.7 1.8 27
1995 448 3 801.1 2 687.7(70.7)
12 442 1 866.0 – 3.3 28
1996 415 9 574.3 8 339.5(87.7)
12 147 2 264.1 – 1.3 29
1997 380 8 126.7 6 124.3(75)
21 924 24 636.0 – 2.7 58
Notes: (i) – = Figures not available. (ii) Figures in parentheses are % of total investment.
Source: Zimbabwe Investment Centre.
FDI is also becoming dominant in project investment. In 1993, the FDI component of totalinvestment was only 38.5 per cent. This almost doubled the following year, and in 1996, FDIaccounted for 88 per cent of total investment. These statistics confirm the importance of afavourable government policy in attracting foreign investment. The increasingly liberal economicpolicy, including permission for 100 per cent foreign ownership, has attracted a massive inflowof FDI.
Apart from the ZIC, FDI also enters Zimbabwe through the newly created EPZ. Table 2.3presents data on EPZ projects and investment as at October 1997. The table shows that a sumof Z$1,094.8 million has been invested in 56 projects and created 10,620 jobs, an average ofZ$19.6 million investment and 190 jobs per project. The average number of jobs created byZ$1 million investment in the EPZ, 9.7, is higher than in non-EPZ projects: EPZ projects aremuch larger but paradoxically less capital-intensive than their conventional counterparts. Theother features of EPZ projects and investment shown in table 2.3 will be discussed later in thischapter as well as in the next.

38 C:\Documents and Settings\bouchet\Local Settings\Temp\WP84 Zimbabwe\v.3
Table 2.3. Geographical distribution of EPZ projects and investment as at October 1997
Province No. ofprojects
Investment (Z$m) Jobs created Expt. value
Z$m
Inv.(Z$)
Total Perproject
Perjob
Total Perproject
PerZ$m.inv.
Harare 19(34)
279.5(26)
14.7 45 566 6 134(58)
323.0 22 3 580.4(49)
12.8
Manicaland 12(21)
459.5(42)
38.3 267 618 1 717(16)
143.0 37 1 767.9(24)
3.8
Mashonaland(East)
2(4)
17.3(2)
8.7 117 587 147(1)
73.5 8 179.3(2.4)
10.4
Mashonaland(West)
13(23)
248.1(23)
19.1 195 663 1 268(12)
97.5 5 1 331.4(17.6)
5.2
Mashonaland(Central)
2(4)
28.0(3)
14.0 48 696 575(5)
287.5 21 163.2(2.2)
5.8
Matabeleland 7(13)
59.6(5)
8.5 84 659 704(7)
100.6 12 326.7(4.4)
5.5
Masvingo 1(2)
2.8(0.2)
2.8 37 333 75(1)
75.0 27 21.9(0.3)
7.8
Midlands 0 0 0 0 0 0 0 0 0
Total(Zimbabwe)
56 1 094.8 19.6 103 088.5 10 620 189.6 10 7 370.8 6.7
Note: Figures in brackets are percentages and may not add to 100 exactly because of rounding.
Source: Calculated from statistics from the EPZ Authority.
2.3. Sectoral distributionThe high diversification of the Zimbabwean economy observed earlier is reflected in the
sectoral distribution of FDI which is shown in table 2.4. The diversification is increasing withtime. In 1993, two sectors, mining and manufacturing, accounted for over 90 per cent of theforeign exchange component of investment with two other sectors, commerce and agriculture,sharing the remaining 9.6 per cent at 5 and 4.6 per cent respectively. By 1995, other sectorswere attracting FDI. While manufacturing was the major attraction in 1995 with about 42 percent of both total investment and foreign exchange outlay, mining was more important in 1996,with about 37 per cent of total investment and 39 per cent of foreign exchange investment. Theother sectors that have emerged as major attractions are tourism, commerce, construction andagriculture. In 1995, tourism and commerce accounted for about 20 per cent each of investment,with agriculture accounting for less than 1 per cent of foreign exchange outlay. The share oftourism increased to over 25 per cent in 1996 while construction and commerce shared about10 per cent each. Manufacturing, construction and commerce dominated investment in 1997.
The sectoral distribution of FDI in Zimbabwe exhibits a high degree of dynamism anddiversification that is not often found in other developing countries of Africa. The share ofmanufacturing is likely to increase with the EPZ, which usually attracts more FDI tomanufacturing. The increased flow of capital into tourism is mainly in massive refurbishingprojects and investments by new entrants such as the Hilton and Marriott tourism groups.

C:\Documents and Settings\bouchet\Local Settings\Temp\WP84 Zimbabwe\v.3 39

40 C:\Documents and Settings\bouchet\Local Settings\Temp\WP84 Zimbabwe\v.3
2.4. Ownership of investment projectsUntil 1996, the ZIC kept records on three categories of ownership of investment: local,
foreign, and joint. A project is classified “local” if it is 100 per cent owned by Zimbabweans,“foreign” if 100 per cent owned by foreign nationals while “joint” could be majority owned byeither Zimbabweans or foreign nationals, depending on the industry. For example, foreignownership predominates in mining, tourism, and agriculture while Zimbabwean ownerspredominate in commerce: manufacturing is about 50:50.
Table 2.5, which presents statistics on ownership of projects and investment for 1993-97,shows that joint ventures between Zimbabweans and foreign investors are the preferred form ofownership. In the five years 1993-97, joint ventures accounted for an average of over 63 per centof projects, 53 per cent of total investment and about 50 per cent of foreign exchange outlay.
However, in terms of average investment, foreign-owned projects were more than twice aslarge as joint ventures. In terms of foreign exchange outlay they were on average three timeslarger. Compared with locally-owned projects, foreign-owned projects were at least seven timeslarger in terms of investment and 13 times larger in terms of foreign exchange outlay.
With the opening up of the economy, the number of local projects has declined drasticallyfrom 155 (57.2 per cent) in 1993 to a meagre three (0.7 per cent) in 1996. The decreasingnumber of local projects and the increasing number of joint ventures indicate that both local andforeign investors prefer the latter. This preference suggests that both partners are aware of themutual benefit of combining the technological, managerial and capital superiority of the foreignpartner with the political and environmental knowledge advantage of the local investor. It alsohelps achieve the Government’s desire for increased indigenous participation in economic activityin the country.
Table 2.5. Ownership of ZIC approved projects and investment (Z$ million) 1993-97
Year Ownership No. of projects Total investment Forex outlay
1993 LocalForeign
JointTotal
1554769
271
(57.2)(17.3)(25.5)
381.51 240.4
297.91 919.8
(19.9)(64.6)(15.5)
193428.11 17.4738.5
(26.1)(58.0)(15.9)
1994 LocalForeign
JointTotal
1286
267365
(3.3)(23.6)(73.2)
136.72 563.12 791.55 491.3
(2.5)(46.7)(50.8)
121.42 350.41 633.84 105.6
(3.0)(57.2)(39.8)
1995 LocalForeign
JointTotal
2109337448
(0.4)(24.3)(75.2)
9.11 675.62 116.43 801.1
(0.2)(44.1)(55.7)
3.71 379.61 295.42 678.7
(0.1)(51.5)(48.3)
1996 LocalForeign
JointTotal
365
347415
(0.7)(15.7)(83.6)
17.24 246.25 311.49 574.8
(0.2)(44.3)(55.5)
03 975.94 423.68 399.5
(0)(47.3)(52.7)
1997 ForeignJointTotal
61319380
(16.1)(83.9)
1 003.37 123.48 126.7
(12.3)(87.7)
630.65 493.7
61 243.0
(10.3)(89.7)
AnnualAverage
Local (up to 1996)Foreign
Joint
4374
268
(15.4)(19.4)(63.3)
136.12 145.73 528.1
(5.7)(42.4)(53.0)
79.51 752.92 592.8
(7.3)(44.9)(49.3)
Note: Figures in parentheses are in percentages.
Source: Zimbabwe Investment Centre.
C:\Documents and Settings\bouchet\Local Settings\Temp\WP84 Zimbabwe\v.3 41
2.5. Sources of FDIWith the exception of Japan, all the major sources of FDI — Australia, Canada, Germany,
Switzerland, UK and USA — are active in Zimbabwe. In addition, there is a significant presenceof newly industrializing countries such as India, Malaysia, and South Africa. Other Africancountries accounted for only 0.7 per cent (Z$21.6 million) in 1994 and 1 per cent Z$95.6 millionin 1996. While the 1994 investment was in only two sectors, manufacturing (Z$5.2 million) andcommerce (Z$16.4 million), the 1996 investment was spread over six sectors with more than 62per cent going to manufacturing (see table 2.6).
In 1994 and 1996 Australia dominated investment in mining while the UK, South Africa,and Switzerland dominated manufacturing, commerce and agriculture. FDI is attracted to newsectors such as tourism, construction and services. Germany and South Africa are the majorinvestors in tourism, Malaysia in construction and the USA, UK and the British Virgin Islandsin the services sector.
Zimbabwe confirms Sanjaya Lall’s conclusion that “MNCs from developing countries arevaried and evolving rapidly” (Lall, 1983, page 267). The wide sectoral participation of thirdworld countries, the number of such countries and the increasing volume of their investmentsdemonstrate a potential for future growth.
2.6. Geographical locationInformation on the geographical distribution of ZIC-approved projects is not available, but in general, in 1985, over 72per cent of gross output of manufacturing industries was concentrated in the two major cities of Harare (46.7 per cent)and Bulawayo (25.4 per cent). The other major concentrations of manufacturing output were Redcliff and Kwekwe (7.4per cent), Gweru (4.1 per cent), Mutare (3.7 per cent), Kadoma (2.4 per cent), Masvingo (1.1 per cent) and others (9.1per cent) (Quarterly Digest of Statistics).
This pattern may be modified by FDI response to opportunities created by the establishmentof an EPZ. As shown in table 2.3, Mashonaland West and Manicaland are more attractive toEPZ projects. Although Harare maintained its position as the preferred location, Matabeleland(Bulawayo) was displaced to the fourth position with only seven EPZ projects as compared with13 and 12 for Mashonaland East and Manicaland respectively. As FDI spreads to other sectorsbesides the traditional ones of mining, manufacturing and commerce, it is most likely that thegeographical distribution will be less concentrated.
In this chapter, we have shown that Zimbabwe has succeeded in attracting FDI. In the nextchapter, we examine the impact of the increased inflow of FDI on the economy in terms ofemployment opportunities created, skill transfer through training, economic development andimproved industrial relations practice.

42 C:\Documents and Settings\bouchet\Local Settings\Temp\WP84 Zimbabwe\v.3

C:\Documents and Settings\bouchet\Local Settings\Temp\WP84 Zimbabwe\v.3 43

44 C:\Documents and Settings\bouchet\Local Settings\Temp\WP84 Zimbabwe\v.3
3. Impact of FDI on the Zimbabwe economy
3.1. IntroductionFDI is attractive to developing countries because of the benefits it bestows on them. Perhaps
the most important benefit is the transfer of technology which enables developing countries toexploit their natural resources and transform them into useful products. This process requiresproduction resources such as capital and labour, thus creating employment with all the attendantbenefits. The need to improve operational efficiency makes it necessary to train the labour force,and more highly skilled workers receive higher wages. This increases the demand for goods andservices. A cycle of interacting benefits promotes economic development, raises the standard ofliving and improves the well-being of the people. This chapter examines the extent to which FDIin Zimbabwe has fulfilled these expectations.
3.2. Capital inflow3.2.1. The importance of FDI in Zimbabwe has varied considerably with time. In the late
nineteenth century British investors dominated the economy, indeed they created the moderneconomy of the country. Until 1965, the country was open to FDI, though figures for inflow arenot available. After UDI in 1965, the country was “closed” to FDI. Table 2.1 shows that FDIinflow during this period and immediately after independence averaged only US$1 million peryear. The years after independence were in fact years of capital outflow rather than inflow as therestrictive economic policies of the Government led to capital flight. Between 1985 and 1989,capital outflow averaged US$43 million annually.
The opening up of the country in the early 1990s produced a massive inflow of foreigncapital at an average of US$41.3 million a year constituting, in 1995, 0.6 per cent of GDP and2.2 per cent of GDI. Between 1993 and 1996, total FDI inflow into Zimbabwe was Z$15,930.8million out of a total investment of Z$24,376.6 million.
3.2.2. In addition to the direct inflow of foreign capital, FDI has also served as a catalystfor domestic investment. As shown in table 2.4, between 1993 and 1996, an annual average ofZ$1,216.1 million in domestic capital was invested in fully-owned indigenous enterprises or injoint ventures with foreign capital. FDI therefore helps mobilize and activate local investment bycreating opportunities for local capital.
3.3. Employment creation3.3.1. Statistics on employment created directly by foreign investment are not often
available because it is difficult to separate employment in joint ventures on this basis. Whileemployment in wholly foreign-owned enterprises can be attributed to FDI, it might be difficultto determine what proportion of employment in “local” or “joint venture” projects can beattributed to the presence of FDI in such ventures.
3.3.2. An assessment of the impact of FDI on employment can be made by comparing thegrowth in employment with the growth in investment, including FDI. Table 3.1 shows thestatistics on paid employment in 1981 and from 1985 to 1995. From 1981 to 1994, the numberof persons in paid employment increased by over 46 per cent or at an annual average of about3.6 per cent. Between 1993 and 1994, however, the increase was less than 2 per cent. Duringthe same period, total investment increased almost threefold while the amount of foreignexchange invested increased almost sixfold (see table 3.2). The rates of growth of total andforeign exchange investment therefore far outstrip the corresponding rate of growth in
C:\Documents and Settings\bouchet\Local Settings\Temp\WP84 Zimbabwe\v.3 45
employment, with the ratio being twice as high for foreign exchange investment growth as fortotal investment. The conclusion which can be drawn from these relationships is that while FDIcertainly creates employment opportunities, it does so at a much lower rate than indigenouscapital.
3.3.3. The conclusion drawn above is supported by the data in table 3.2 which shows FDIand employment creation by category of ownership. On the whole, it shows that local investmentis a better creator of employment opportunities than wholly foreign-owned investment. Forexample, between 1993 and 1996, local investment constituted on average 5.7 per cent of totalinvestment and 7.3 per cent of foreign exchange outlay, but it created 13.4 per cent ofemployment. On the other hand, between 1993 and 1997, enterprises fully owned by foreignersaccounted for 42.4 per cent of total investment and 44.9 per cent of foreign exchange outlay butcreated only 24.5 per cent of employment opportunities. This pattern is reflected in the statisticsfor individual years.
3.3.4. During the five years covered by the table, given the definitions of the categoriesof ownership (see Chapter 2), it could be estimated that FDI created 100 per cent of theemployment in wholly foreign-owned projects and 60 per cent of those in joint ventures. In thefive years therefore, FDI could be said to have created 44,640 new jobs.
(4,516+2,493+3,743+2,804+2,847) + .6(3,301+6,843+8,677+9,163+19,077)= 16,403 + 28,237 = 44,640FDI therefore accounted for 63 per cent of the 70,848 employment opportunities created
between 1993 and 1997. Applying this percentage to the total employment figures presented intable 3.1, the estimated direct and indirect employment created by FDI is shown in the lastcolumn of the table. This rose from 543.2 in 1981 to 759.9 in 1994, representing an averageannual growth rate of 3.1 per cent. This estimate is credible given the fact that until 1980, mostof the existing businesses were the preserve of the white population, the majority of whom wereforeign. In fact, the significant contribution of local enterprises to paid employment was a resultof the labour intensity of such enterprises, which was discussed earlier. In general, estimates ofthe ratio of indirect to direct employment is 4:1. Thus 80 per cent of the total employment of FDIcould be attributed to indirect employment.
3.3.1 Gender distribution of employmentAlthough women constitute about 44 per cent of Zimbabwe’s labour force, they only
account for about 19 per cent of total employment with the highest point (22.5 per cent)occurring in 1991 and the lowest (17.7 per cent) in 1986 (see table 3.3). It is difficult todetermine the impact of FDI on female employment. A survey of three multinational companies,which was carried out by the author, shows that the level of female employment depends moreon the nature of the industry than the nationality of ownership. In mining, female employmentis confined to administration. No women are employed in underground mining and three femaletrainees at the School of Mines withdrew from the course, two of them due to pregnancy. On theother hand, about 40 per cent of employees in the tourism industry are women working inaccountancy, marketing and management. And in PG Industries, only about 10 per cent of the3,500 employees are female (5 per cent of unskilled workers, 10-15 per cent of skilled workersand 10 per cent of management and professional workers).
This gender imbalance in employment is similar to findings in Namibia and supports theconclusion that the nature of the industry influences the level of female employment rather thanthe nationality of ownership.

46 C:\Documents and Settings\bouchet\Local Settings\Temp\WP84 Zimbabwe\v.3

C:\Documents and Settings\bouchet\Local Settings\Temp\WP84 Zimbabwe\v.3 47

48 C:\Documents and Settings\bouchet\Local Settings\Temp\WP84 Zimbabwe\v.3
In spite of the relatively small share of women in paid employment, the annual averagegrowth rate (3.6 per cent) between 1986 and 1994 was more than twice that of male(1.5 per cent) or total (1.6 per cent) employment. This might be the result of women’s increasingaccess to education and their consequent higher employability as well as of increasing culturalacceptance of women in paid employment.
Table 3.3. Paid employment (in ‘000) by gender
Year Men (%) Women (%) Total % Growth
1986 889.8 82.3 191.2 17.7 1 081.0 –
1987 889.6 82.0 195.5 18.0 1 085.4 0.4
1988 929.5 82.2 201.6 17.8 1 131.1 4.2
1989 957.0 82.0 210.1 18.0 1 167.1 3.2
1990 977.6 82.0 214.5 18.0 1 192.2 2.2
1991 1 015.8 77.5 228.2 22.5 1 244.0 4.3
1992 1 012.5 77.7 223.8 22.3 1 236.2 -0.6
1993 997.6 80.4 242.7 19.6 1 240.3 0.3
1994 1 018.0 80.0 252.2 20.0 1 270.2 2.4
Source: ILO Yearbook of Labour Statistics, 1996.
3.4. Labour productivityThe major determinants of labour productivity are technology/capital and labour skills. The
FDI contribution to labour productivity can thus be measured by the technology content of itsproduction facilities, approximated by capital intensity and the extent of training activities.
3.4.1. Capital intensityThe capital intensity of FDI projects was discussed earlier. Table 3.4 below shows this
through two related statistics: employment by Z$1 million investment and amount of investmentneeded to create a single job. While, nationally, it takes an average of about Z$424,000 to createa single job, only about Z$73,000 (17 per cent) is needed by a locally owned company. Aforeign-owned company requires about Z$717,000, which is almost twice the national averageand nearly ten times the locally owned company requirement to create a job. Thus, a locallyowned company generates about 14 jobs for a Z$1 million investment while a foreign-ownedcompany generates less than two jobs. Joint ventures are less capital-intensive than whollyforeign-owned enterprises but more so than locally owned ones.
This characteristic of FDI creates a conflict between multinational enterprises (MNEs) anddeveloping host-countries. However, such a conflict is paradoxical. On the one hand, developingcountries expect MNEs to transfer new technology which is usually capital — rather thanlabour-intensive. On the other hand, given the high level of unemployment in most developingcountries, MNEs are expected to create jobs in large numbers by using “appropriate” technologyi.e. technology which absorbs some of the abundant labour supply of the host countries. Thisscenario is further complicated if the MNEs are expected to export, which requires modern andusually capital-intensive technology.

C:\Documents and Settings\bouchet\Local Settings\Temp\WP84 Zimbabwe\v.3 49
Table 3.4. Capital intensity of projects by ownership category
Year Ownership Investmentper job
Employment perZ$1 million
1993 LocalForeign
JointTotal
57 987.5274 667.8
90 245.3133 356.4
17.203.64
11.107.50
1994 LocalForeign
JointTotal
226 699.81 028 118.7
407 935.1552 500.2
4.400.972.501.80
1995 Local Foreign
JointTotal
413 636.3447 662.3243 909.1305 505.5
2.402.204.103.20
1996 LocalForeign
JointTotal
95 555.51 514 336.6
579 657.3788 244.0
10.500.661.701.30
Annual average LocalForeign
JointTotal
73 740.5717 416.6375 829.0424 883.4
13.601.302.702.40
Source: Calculated from table 3.2.
The use of labour-intensive technology could be economically disadvantageous to bothFDI/MNEs and the host countries in the long run. For example, in Zimbabwe, three major minesclosed down in 1998: Rio Tinto’s Brompton Gold Mine in Kadoma, River Ranch Diamond Mineat Beitbridge and the Dalny Gold Mine in Chakari (Sunday Mail, 1998, pages 1 and 4). Theyclosed because of high operational costs and low prices. A recent article suggested that some ofthese mines might be profitably operated if a more mechanized process was adopted. Such aprocess is considered as “appropriate technology”, redefined as “the technology that will yielda product which meets the specifications and needs of a customer at a competitive price” (Miningand Business in Southern Africa, 1997, page 7).
By employing more modern technology, FDI increases labour productivity and transformspreviously idle resources into useful products.
3.4.2. Skills developmentThe second factor determining productivity is skills development. A well-trained labour
force is likely to be more productive in both quantity and quality of output. In the threecompanies interviewed, training is provided through formal education, training programmes,apprenticeship schemes and on-the-job experience through industrial attachment programmes forstudents at institutions of higher education.
Commercial farmers, through their union, the Commercial Farmers Union (CFU) trainabout 3,600 workers annually in horticulture, livestock, agronomy, seedbed and financialmanagement. CFU founded the Agriculture Institute with a contribution of Z$22 million out ofthe total cost of Z$45 million. In addition, the CFU pays about half of the Z$6.5 million annualexpenses of the institute, which has an enrolment of about 90 students.
PG Industries aims to train all its staff in a five-year cycle. It thus trains about 700 of its3,500 employees annually, spending about Z$3 million each year. Training includes leadershipskills, management, operations, computing, marketing and sales, ethics and good governance.

50 C:\Documents and Settings\bouchet\Local Settings\Temp\WP84 Zimbabwe\v.3
Anglo American Corporation Services (Anglo) offers training to its own staff and also toother companies and institutions on a commercial basis. In 1988, Anglo established theOrganisation Training and Development (Pvt.) Ltd. as a separate company offering training inmining technology, administration, technology and finance, to its staff and to the general public.
In mining, the Zimbabwe Mining and Smelting Company (ZIMASCO) (formerly UnionCarbide) built the Kwekwe Technical College and donated it to the Government. The miningcompanies, through their Chamber, pay half the annual expenses of the School of Mines inBulawayo. In 1996 and 1997, such contributions amounted to Z$600,000 and Z$824,000respectively. The Government, through the Zimbabwe Development Fund, to which the Chamberof Mines contributes about Z$8 million, provides the capital expenditure as well as the balanceof recurrent expenditure. The school enrols about 60 students annually including some fromBotswana and Malawi, studying for a diploma in extractive metallurgy and mineral processing,geology, mining and mine survey. In addition, mining companies provide industrial experiencefor students in polytechnics and universities while their officials serve on the councils or advisorycommittees of various institutions including the University of Zimbabwe and the NationalUniversity of Science and Technology.
In the financial sector, the two largest banks, Barclays Bank (a British subsidiary) and theStandard Chartered Bank (South Africa) run extensive training programmes. Barclays Bank iscurrently organizing a business management course to train young graduates to establish small-scale industries with the bank providing venture capital. The training offered by StandardChartered Bank has developed many Zimbabweans to such a level of competence that three ofthem are now managing bank subsidiaries in Ethiopia, Ghana and the United Republic ofTanzania.
MNEs have thus improved productivity in Zimbabwe through the application of moderntechnology and the introduction of active training programmes which transfer valuable skills totheir workers. Training activities have intensified for black Zimbabweans since 1975 when, asa result of the liberation war, it became necessary to train blacks for middle management.Training schools were set up in companies, mines and plantations: companies also contributedto the establishment and funding of institutions of higher education and provided financial supportfor students.
3.5. Industrial relations and conditions of work3.5.1. Unstructured interviews were held with two union leaders to obtain their opinions
on MNE activities with respect to conditions of service, industrial relations practice training, skilltransfer and contribution to national economic development. The union leaders (MorganTsvangirai of the Zimbabwe Congress of Trade Unions (ZCTU) and Philip Munyayi of theGeneral Agricultural and Plantation Workers Union of Zimbabwe (GAPWUZ)), both ratedMNEs very highly in terms of industrial relations practice. Mr. Tsvangirai, as General Secretaryof the ZCTU which embraces almost all economic sectors, is the most important union leaderin the country. He has a wide knowledge of both MNE and indigenous company policies andpractices on industrial relations, conditions of service, training, etc. Mr. Munyayi wasinterviewed in order to gather information on the agricultural sector, particularly to balance theinterview with the powerful Commercial Farmers’ Union.
Wages are higher in MNEs and are paid promptly, unions are recognized, workers exercisetheir freedom to form or join unions of their choice and the unions enjoy managementcooperation. Most companies accept the “check-off” system thereby enabling the union tooperate smoothly. (This is a system whereby employers agree to deduct, on behalf of the union,membership dues from their employees’ salaries. The system ensures an effective low-costcollection of union dues, which enhances the union’s financial viability.)
3.5.2. MNEs in Zimbabwe enjoy a very good reputation for better conditions of serviceand higher wages. Most interview respondents (listed in the appendix) attribute the better

C:\Documents and Settings\bouchet\Local Settings\Temp\WP84 Zimbabwe\v.3 51
conditions of service in MNEs to such factors as the size of such enterprises, competitionbetween them, and the influence of international or parent-company practices and standards.Table 3.5 shows that average earnings in most industries, except agriculture, are much higherthan the GNP per capita of US$610 (about Z$10,370) (UN, 1998, page 14). The table refers toall employees in those sectors, including MNEs and indigenous companies.
Intersectoral and even intra-sectoral comparisons also show evidence of a positive effect ofMNEs on wages. Average earnings are highest in the finance, insurance and real estate businesswhich is usually a high-paying sector, and in utilities such as electricity and water which oftenrequire high skills. In general, earnings in industries where foreign investment dominates or issignificant (mining, manufacturing, commerce, restaurants and hotels) are at least twice as highas national per capita income. The trend for average earnings also shows a growth patternreflecting the increased inflow of FDI consequent on the opening of the economy since 1991.Average earnings at least doubled between 1991 and 1995 in practically all industries. Within agiven industry, MNEs pay much more than their local counterparts. In agriculture, for example,CFU members, many of whom are foreign nationals, were reported by the GAPWUZ to paybetter and more regularly than indigenous farmers. In the service sector, expatriate employersof private domestic workers pay much more than their national counterparts. MNEs thus havea positive impact on wages and, in general, on other conditions of service.
3.5.3. Health and safety statistics are presented in table 3.6. It is difficult to isolate thecontribution of MNEs to safety practice and records. However, it seems that in most of theindustries where FDI is dominant injury rates are higher than the annual average rate. Forexample, while on average only about 1.5 per cent of employees were injured, the rates inmining/quarrying and manufacturing were 4.9 and 3.1 per cent respectively, more than twice thenational average.
No clear pattern of severity of occupational injuries has emerged. The probability of anaccident being fatal is highest in those sectors where a very low percentage of employees wereinjured. In only two industries (manufacturing and electricity/gas) were the fatality rates lowerthan the overall average. Yet these industries had very high rates of injuries. On the other hand,the fatality rates were highest in agriculture, transport, public administration, andmining/quarrying, many of which also had high rates of injuries.

52 C:\Documents and Settings\bouchet\Local Settings\Temp\WP84 Zimbabwe\v.3

C:\Documents and Settings\bouchet\Local Settings\Temp\WP84 Zimbabwe\v.3 53

54 C:\Documents and Settings\bouchet\Local Settings\Temp\WP84 Zimbabwe\v.3
While the trend between 1986 and 1995 seems to be stable, the rates are rather high. Themining industry itself describes the fatality rates as “unacceptably high” and “estimated that88 per cent of all types of work-related accidents are a result of unsafe acts” even though over12 mines have achieved the distinction of completing 1 million shifts without a fatality (TheChamber of Mines, page 10).
The nature of economic activity rather than the nationality of ownership seems to be a majordeterminant of the rate or severity of injuries. Workers using heavy machinery and equipment,particularly powered by electricity, those working underground, and those using motorizedequipment seem more exposed to injuries. Increased mechanization seems to increase exposureto injuries and therefore requires greater focus on worker training, particularly in the use ofelectrically powered machinery and equipment. Another factor in the high rate of injuries seemsto be the use of relatively obsolete machinery and equipment. As mentioned earlier, during theera of control, the shortage of new, particularly foreign capital, hindered the maintenance andreplacement of machinery and equipment.
Efforts are being made to reduce the rate of injuries. In the mines, for example, theChamber organizes safety competitions for both surface and underground operations, and givesprizes. In addition, the Chamber awards prizes for the best mine environment maintenance basedon the inspection report of the Natural Resources Board which covers mining villages, miningoperation areas, dumps and vegetation.
3.5.4. MNEs have maintained very cordial labour relations in Zimbabwe. NationalEmployment Councils with tripartite memberships constituted the main instrument for promotinggood relationships. These councils provide the forum for discussion and negotiation, disputeresolution and collective bargaining.
Employer organizations, such as the Employers’ Confederation of Zimbabwe (EMCOZ),the Chamber of Mines, the Chamber of Commerce, the CZI and the CFU, maintain close contactthrough formal and informal meetings, dialogues and social contacts, with the various industrialunions and the ZCTU. Such meetings discuss matters of interest to the parties such as strikes,stay-aways and disputes.
At the enterprise level, management maintains good social integration, supports the workers’freedom of association and provides funds for the union through the check-off system.
The annual collective bargaining between employers and workers is often preceded by anational seminar designed to facilitate negotiations at association level. Occasionally, bipartiteor tripartite meetings are held to review government proposals. In 1996 and 1997, such meetingswere held to review the Government’s economic and social transformation programme and theland reform policy respectively. At the former, all three parties agreed to uphold and pursue theprinciples of tripartism as embodied in ILO Convention No. 144 of 1976, “with the ZCTUsuggesting that strategic issues relating to the national budget, taxation, privatisation economicreforms, the budget deficit and others should be incorporated” (The Chamber of Mines ofZimbabwe, 1997, page 32).
One indication of a good industrial relations environment in Zimbabwe is that until 1997,strikes and stay-aways, and other work stoppages were almost unknown. Even the strikes andstay-aways of 1997 and 1998 were more against macro economic policies (increased taxation,high budget deficits and the consequent inflation) rather than against employers’ decisions andpolicies. Such policies affect both employers and employees adversely and have provided acommon interest against the Government, a bipartite solidarity which resulted in a governmentthreat not to “assist in cases of disputes” between the employers and the unions during the annualcollective bargaining process (Business Herald, 1998, page 6). This threat was reversed as theGovernment has now sought to continue dialogue with the ZCTU (Financial Gazette, 1998,page 1). Restoration of the tripartite process may be the key to a peaceful industrial relationsfuture in Zimbabwe.

C:\Documents and Settings\bouchet\Local Settings\Temp\WP84 Zimbabwe\v.3 55
3.6. Contributions to national and regionaleconomic development
3.6.1. Host countries expect the operations of multinationals to serve as a catalyst fornational economic development as well as for spreading development over the variousgeographical regions of the country. In earlier sections of this paper we have discussed thecontribution of MNEs to national development through the growth and diversification of GDP,the creation of employment opportunities, the generation of foreign exchange resources throughexports and foreign capital inflow, and the enhancement of productivity through skillsdevelopment and the introduction of modern technology. Two other contributions will bediscussed in this section: entrepreneurial development and balanced geographical development.
3.6.2. Developing entrepreneurship is not generally a deliberate policy of MNEs but couldbe described as a by-product of their operations. Indigenous entrepreneurs are usually formeremployees of MNEs who later found their own business using the knowledge and experiencegained in the multinationals (Iyanda, 1975, pages 157-159). Many indigenous small-scale minerswere previously employees of the major MNE mining companies. Founders of many othercompanies such as Prime Net (a computer company), Eastimber Enterprises Ltd, manyindigenous commercial farmers and industrialists, and even mining consultants are formeremployees of MNEs, mostly in the same sector in which they now operate as competitors,satellites or service providers.
Apart from employment, MNEs foster entrepreneurship through linkage programmes andsubcontracting. In the tourism industry, linkages are quite strong as almost 90 per cent ofmaterials are sourced locally through subcontracting. Perhaps the most successful linkageprogramme is the initiative led by the CZI through the Zimbabwe Enterprise DevelopmentProgramme (ZEDP) with funds from USAID and the Norwegian Development Corporation(NORAD). The ZEDP liaises between large and small businesses, identifies linkage opportunitiesand helps match service providers (small companies) with purchasers (large companies). By May1998 the local ZEDP office had established 101 linkages in Manicaland province, generatingabout Z$43 million and creating over 2,000 jobs.
Further evidence of entrepreneurial development is the establishment, by Anglo American,of Hawk Ventures, a venture capital company intended to assist small enterprises with start-upcapital with its equity participation of between 25 and 40 per cent. Anglo American has alsofostered linkages with smaller businesses. It sets targets for subcontracting to small and medium-scale enterprises (SMEs) and ensures that linkage partners are paid promptly to avoid cash flowproblems for the SMEs involved (The Zimbabwe Chartered Accountant, page 11).
PG Industries assists indigenous entrepreneurs through its Carpenter Supplies Programmeand Project Hands-On. Both programmes supply on credit, materials needed by carpenters orcontractors who reimburse PG after they receive payment from their clients. By April 1998, over50 carpenters and 100 contractors had benefited from the schemes. Such programmes removethe financial obstacles often encountered by SMEs and independent artisans.
3.6.3. In spite of the argument that a foreign investor is not a “benevolent philanthropist”whose objective is to provide social infrastructure (Horn, 1995, page 16), it is interesting toobserve that MNEs have been major providers of facilities such as roads, railways, water andelectricity supplies. In most cases, such infrastructure is provided in rural areas in order topromote MNE operations. Nevertheless, the facilities constitute public goods which improve thequality of life and reduce imbalances in regional development. The presence of such facilities ina location makes that location more attractive to human settlement and creates an opportunity forincreased economic activities.
Agriculture and mining have made the biggest contribution to regional development, morea result of their nature than of deliberate policy. Agriculture is a rural activity, but it requirespublic utilities such as electricity and water, and services which are often found only in the city.Large farms and plantations have therefore had to provide these facilities by themselves. Mining

56 C:\Documents and Settings\bouchet\Local Settings\Temp\WP84 Zimbabwe\v.3
is a similar case and mining companies have also had to build roads, schools and hospitals tocater for their workers. The result of these efforts is the establishment of many towns and theprovision of services. Towns like Wankie (Wankie Gold Colliery), Zvishavane (AfricaAssociation Mines), Shamva and Redcliff, Bindura, Hwange and Shurugwi (Anglo American)owe their existence and development largely to the activities of mining and agricultural MNEs.Members of the Chamber of Mines provide “38 doctors, 9 hospitals, 51 clinics, 43 junior and11 senior schools for over 40,000 children, a quarter of whom are children of non-employees,housing for all mine workers and family (330,000 persons), sporting and recreational facilities”(The Chamber of Mines, page 1). The mines also establish and support sports clubs. ZISCO,Mhangura, and Eiffel Flats are well-known soccer clubs financed by mining companies whichalso organize some of the most popular athletic and cycling competitions in the country.
Tourism serves to promote development in areas which would have been considered remote.For example, Victoria Falls, one of the world’s best known tourist attractions, Vumba, andNyanga owe their fame and development largely to the tourist industry.
Many companies have contributed funds and materials to specific projects. Anglo AmericanCorporation (then known as Anglo American Rhodesian Development Corporation) purchased3,700 railway trucks at a price of £7.9 million and subsequently hired them out to the FederalRailways which delivered coal to consumers and copper to the coast (Kanganga, 1994, page 12).
The relatively even spread of employment, earnings and average earnings across Zimbabweshown in table 3.7 can be attributed largely, if not exclusively, to the activities of MNEsparticularly in mining, agriculture and tourism. The same can be said of the industrial,infrastructural and urban development that the country has enjoyed in the past 100 years (TheChamber of Mines, Zimbabwe, page 4).

C:\Documents and Settings\bouchet\Local Settings\Temp\WP84 Zimbabwe\v.3 57

58 C:\Documents and Settings\bouchet\Local Settings\Temp\WP84 Zimbabwe\v.3
4. Summary and conclusions
4.1. IntroductionFDI in Zimbabwe has operated in a very dynamic environment which has turned full circle
from hostility and restrictions to enthusiasm and liberalization. This study illustrates therelationship between policy and the general economic environment on the one hand and theinflow of FDI on the other. It shows that large markets and abundant resources may be necessaryfor attracting FDI to a country, but that they are not sufficient. The political and economicenvironment are just as important. The other main conclusions of the study are highlightedbelow.
4.2. Summary4.2.1. FDI in Zimbabwe is well-diffused geographically and across economic sectors.
Although FDI dominates certain industries such as mining, tourism and manufacturing, it issignificant in most other sectors. Its impact is also widely spread over the geographical regionsof the country.
4.2.2. Zimbabwe confirms that third world countries, usually recipients of FDI, areemerging as investors in other developing countries. Such investments are currently concentratedin the commercial, tourism and service sectors of the Zimbabwean economy.
4.2.3. The establishment of institutions such as the ZIC and EPZ authorities simplified theentry process for investors and made Zimbabwe more attractive to them. The result is anaccelerated rate of growth of FDI in Zimbabwe.
4.2.4. The preferred form of entry is through partnership between foreign and Zimbabweaninvestors. This combines the advantages of local knowledge and political acceptability with thoseof technological know-how and access to capital.
4.2.5. MNEs employ about 63 per cent of salaried workers in Zimbabwe. In spite of thisdominance in creating employment opportunities, MNEs create fewer jobs for a given level ofinvestment than local companies. This finding suggests that developing countries need alternativemeans, besides FDI, of solving their employment problems.
4.2.6. FDI-dominated industries are more productive and capital-intensive than their localcounterparts. This is the result of using more modern technology and greater emphasis on humanresources development and motivation.
4.2.7. The gender distribution of employment varies from industry to industry irrespectiveof the nationality of management or ownership of capital. Thus women are poorly representedin mining but constitute a significant proportion of workers (40 per cent) in tourism. In somemanufacturing establishments, women workers seem to be more concentrated in office work thanin production or technical work. While MNEs are generally equal opportunity employers, it ismore the nature of work which determines the level of women’s employment.
4.2.8. MNEs have a good industrial relations practice in Zimbabwe. They offer betterconditions of service, provide better staff training and maintain cordial and cooperativerelationships with the industrial and national workers’ unions. However, safety records,particularly in mining, construction, transport and manufacturing, are rather poor and need tobe improved through training and high standards of maintenance.
4.2.9. Lastly, MNEs have contributed immensely to the development and growth ofZimbabwe through capital inflow, employment, technology and the development of localentrepreneurial skills. In addition, Zimbabwe owes most of its industrial and social infrastructure(schools, roads, electricity supply, health, sports, railways, etc.) and the establishment andgrowth of many towns to the activities of MNEs. Such involvement not only helped the

C:\Documents and Settings\bouchet\Local Settings\Temp\WP84 Zimbabwe\v.3 59
Government to meet its obligations to the citizenry but also helped spread developmentthroughout the country.
MNEs have been beneficial to Zimbabwe’s economic growth and development. Theirtechnology has helped transform natural resources into useful modern products and in the processthey have created employment, generated income and provided essential services to the nation.This contribution has varied from time to time in response to or as a consequence of governmentpolicies. A legitimate question is the extent to which such contributions to national economicdevelopment are likely to continue. In the last section of this paper, an attempt is made to analysethe prospects for FDI in Zimbabwe.
4.3. FDI prognosis4.3.1. Zimbabwe has enjoyed peaceful democratic rule since it became independent in
1980. Peace and political stability, adherence to the rule of law and to democratic principles aremajor factors which influence foreign investment decisions. Although there have been somestrident criticisms of the current Government, and some rumblings within the governing party,all these seem to be within the democratic framework.
As such, the prospects of remaining a democratic, peaceful state and a free market economyare quite bright. This augurs well for continued inflow of foreign capital.
4.3.2. The excellent infrastructural facilities of the country need to be maintained.Currently telephone services are being improved and modernized and the railway track extended.But recent interruptions in the electricity supply suggest a need to expand capacity as well as toensure efficient maintenance.
4.3.3. Zimbabwe has one of the highest literacy levels in Africa. It therefore has a well-educated and highly trained labour force which is equipped, through experience in industrialwork, with the skills usually required by MNEs for their efficient operation. With thedepreciation of the Zimbabwe dollar, such labour can be hired at competitive rates, therebyreducing production costs and making the country more attractive to foreign investors.
4.3.4. The commitment of the Government to a free enterprise, private-sector-led economicpolicy also augurs well for continued FDI inflow. In the newly launched economic policy,ZIMPREST 1996-2006, the Government reiterated its commitment to tripartism, free enterprise,privatization and commercialization of parastatals, promotion and encouragement of FDI, greatergovernment fiscal discipline, research and development, and human resources development.Faithful implementation of such a policy will create an environment conducive to FDI.
4.3.5. On the negative side is the deteriorating macroeconomic environment. In a recentnews item, the Financial Gazette (1997, page 5) reported that foreign investors were happy withreturns on local stock markets but were concerned “about the Government’s fiscal and monetarypolicies which they fear could be inflationary ... a possible drought in Southern Africa ... [and]apprehensive about how Government planned to fund the huge gratuity payments for an estimated70,000 ex-freedom fighters who are demanding a one-off compensation of about $3.6 billion andmonthly pension payments costing $140 million annually from 1998”.
Echoing the same sentiments, Eric Bloch (1998, pages 9 and 10) produced a catalogue of“shattering blows” to the economy. He wrote:The combined effects of the total and unduly hasty fiscally ill-considered submission to the demands of ex-combatantsand war veterans, of the grossly mishandled land acquisition exercise couched in endless racially vitriolic rhetoric, ofa devastatingly great depreciation of the Zimbabwean Dollar which was seriously mismanaged by Government and theReserve Bank, of further punitive taxes, of demonstrations and food riots accompanied by violence, vandalism, lootingand excessively oppressive responses by the Authorities, of labour unrest and industrial action, and of confrontational,unfounded allegations by Government against the business community, all understandably repercussed upon businessconfidence.
There is little doubt that Zimbabwe has to improve its macroeconomic environment if it is tocontinue to enjoy the kind of relative political and industrial peace which has made it a preferred

60 C:\Documents and Settings\bouchet\Local Settings\Temp\WP84 Zimbabwe\v.3
1 See “Telecel shrugs off High Court ruling”, Financial Gazette, 12 Feb. 1998, p. 7; and “Judge clarifies roleand function of courts”, Financial Gazette, 26 Feb. 1998, p. 7.
location for FDI. The factors causing apprehension among foreign investors and the “shatteringblows” listed by Bloch are creating a militant labour force, which had two violent general workstoppages and demonstrations within four months, and a hostile collective bargainingenvironment, all of which are threatening the tripartite cooperation essential for development.
4.3.6. The Government also needs to assure investors, both local and foreign, of impartialtreatment and an even playing field for all. After the recent Enhanced Communications Networks(Pvt.) Ltd (ECONET) saga where a local investor had to go through a long and costly legal battleto procure a licence to provide cellular phone services, investors need to be reassured that theGovernment is committed to a free market economy and to its role as an unbiased regulator andadjudicator. Yet that same saga reassures investors of the existence of an independent andfearless judiciary in cases where it becomes necessary to resort to the law courts for thesettlement of disputes even with the Government. To reassure investors that independence willnot be tampered with, the Government needs to react to unfounded attacks 1 by various pressuregroups on the role and function of the courts. Just as important is the need to protect MNE staffand executives against threats and harassment by pressure groups as happened to the managingdirectors of Mashonaland Holdings and the Standard Chartered Bank.
Lastly, there is a need to reduce restrictive regulations and burdensome taxes in order torelease the latent entrepreneurial skills and abilities of Zimbabweans. This represents theunfinished task of transforming the economy from state to market control. A World Bank study(1989, pages 135-147) emphasized the importance of African entrepreneurs in meeting the needsof their economies for massive job creation through creation of small and medium-scaleenterprises. In addition to attracting FDI, the Zimbabwean Government must also adopt policieswhich promote indigenous initiative and the establishment of SMEs, since they are better creatorsof employment than the MNEs.
Note

C:\Documents and Settings\bouchet\Local Settings\Temp\WP84 Zimbabwe\v.3 61
BibliographyBloch, E. 1998. “Shattering blows to the Zimbabwean economy”, in The Zimbabwe Chartered
Accountant, Vol. 4, No. 2, Mar./Apr.Business Herald. 1998. “Several factors point to tough collective bargaining process”, 16 Apr.Central Office of Statistics. 1997. Quarterly Digest of Statistics, Mar. p. 44.Economic Intelligence Unit. Country profile, 1996-97.Government of the Republic of Zimbabwe (GOZ). 1989. The promotion of investment: Policy
and regulations, Apr.Horn, M.P.M. 1995. “African investment — Is this the final frontier?”, in Trade and Investment
Southern Africa.Iyanda, O. 1975. “Impact of foreign direct investment in manufacturing on the Nigerian
economy” (an unpublished doctoral dissertation submitted to New York University).Kanganga, E. 1994. “Anglo American Corporation in Zimbabwe: The first 40 years” in
Optimum, Nov.Khan, H. 1997. “The impact of foreign direct investment on regional and human development
in transitional economics”, in Regional Development Dialogue, Vol. 18, No. 1, Spring.Lall, S. 1983. The new multinationals: The spread of third world enterprises (John Wiley and
Sons).Mining and Business in Southern Africa. 1997. “Is SADC ready for mechanization and
automation?” Vol. 6, No. 1, June.Ministry of Industry and Commerce. 1997. Industrial policy and strategy from 1998-2006.Murerwa, H.M. 1997. Budget statement, presented to Parliament, Thursday, 24 July 1997.Mushiri, S. 1995. “Winds of change stir the Zimbabwean economy”, in Trade and Investment
in Southern Africa.Rasmussen, J. 1992. “The small enterprise environment in Zimbabwe: Growing in the shadow
of large enterprises”, in Institute of Development Studies Bulletin.Skalnes, T. 1995. The politics of economic reform in Zimbabwe: Continuity and change in
development (London, Macmillan).Sunday Mail. 1998. “Call for a team to deal with mine crisis”, 15 Apr.Sylvester, C. 1991. Zimababwe: The terrain of contradictory development (Westview Press).The Chamber of Mines, Zimbabwe. 1997. Fifty-eighth Annual General Meeting, 8-9 May.Financial Gazette. 1997. “Foreign investors happy with returns on local stock market”, 25 Sep.—. 1998. “Government now seeks dialogue with ZCTU”, 14 May.The Zimbabwe Chartered Accountant. 1998. “CZI linking businesses”, Feb.United Nations. 1998. World development indicators (Washington, DC).United Nations Development Programme (UNDP). 1996. Country human development indicators
(New York, Human Development Office).World Bank. 1989. “Fostering African entrepreneurship” in Sub-Saharan Africa: From crisis to
sustainable growth (Washington, DC).—. 1997. African Development indicators (Washington, DC).Zimbabwe Congress of Trade Unions (ZCTU). 1996. Beyond ESAP.Zimbabwe Investment Centre (ZIC) (undated). A guide to industrial investment in Zimbabwe.Zizhou, F. 1998. A public leture presented to the Manicaland Chamber of Business, Feb.

62 C:\Documents and Settings\bouchet\Local Settings\Temp\WP84 Zimbabwe\v.3

C:\Documents and Settings\bouchet\Local Settings\Temp\WP84 Zimbabwe\v.3 63
Appendix I
List of organizations and officials interviewed
A. Government organizations1. Ministry of Finance
Edgar Nyoni, Senior Economist
2. Zimbabwe Investment CentreSolomon D. Cheure, Investor Services ExecutiveBlessing Huchu, Investor Services Executive
3. Export Processing Zone AuthorityEugenia Masvikeni (Miss)
4. Zimbabwe Tourism AuthorityJoseph F. Chigwedere, Chief Executive
B. Employers and employer organizations1. The Chamber of Mines, Zimbabwe
D. Robinson, Mining Affairs ManagerBarry C. Stanley, Senior Executive
2. Commercial Farmers’ Union of ZimbabweDavid W. Hasluck, DirectorWill Gillies, Labour Relations Consultant
3. Zimbabwe Farmers UnionShadreck Hunge, Economist
4. Employers’ Confederation of ZimbabwePeter F. Kunjeku, Executive Director
5. Confederation of Zimbabwe IndustriesF. Zizhou, Chief EconomistEd Kakora, Project Manager, Zimbabwe Enterprise Development Programme, Manicaland
6. CompaniesGenius Maphosa, Director, Human Resources, PG Industries Ltd.Khaled Joosab, Director, Eastimber Enterprises (Pvt.) Ltd.Taurai Murapa, Sales Representative, T.T.C. Products Sales Enterprises (Pvt.) Ltd.
C. LabourMorgan Tsvangirai, General Secretary, Zimbabwe Congress of Trade UnionsPhilip Munyayi, General Secretary, General Agriculture and Plantation Workers Union

1 All working papers published between 1980 and 1986 are available on microfiche. Price: Sw.frs.500 or US$450(including a special binder with wallets permitting quick retrieval and systematic filing of microfiches). Working papersthat are out of stock are not included in the lists that follow.
2 The studies carried out in the 1970s are included since they may be useful to those persons wishing to examinedevelopments in a given industry or sector over the decades. They are listed in the language(s) for which there are stillstocks.
64 C:\Documents and Settings\bouchet\Local Settings\Temp\WP84 Zimbabwe\v.3
Appendix II
The monographs and working papers are published under the ILO's Programme on MultinationalEnterprises in response to requests made by the ILO's constituents at meetings of the Governing BodySubcommittee on Multinational Enterprises and sectoral meetings held under the ILO's Sectoral ActivitiesProgramme. The working papers, which are signed by their authors, are intended to stimulate discussionand critical comment. 1
List of publications on specific industriesor sectors, under ILO's Programmeon Multinational Enterprises
Monographs 2
Social and labour practices of some European-based multinationals in the metal trades (Geneva, ILO, 1976),143 pp.ISBN 92-2-101474-6
Social and labour practices of some US-based multinationals in the metal trades (Geneva, ILO, 1977),172 pp.ISBN 92-2-101840-7
Social and labour practices of multinational enterprises in the petroleum industry (Geneva, ILO, 1977),100 pp.ISBN 92-2-101806-7
Social and labour practices of multinational enterprises in the textiles, clothing and footwear industries(Geneva, ILO, 1984), 184 pp.ISBN 92-2-103882-3
Social and labour practices of multinationals in the food and drink industries (Geneva, ILO, 1989), 182 pp.ISBN 92-2-106431-X
Pratiques sociales des entreprises multinationales opérant dans le secteur des plantations (Geneva, ILO,1989), 118 pp.ISBN 92-2-206519-0
Multinational banks and their social and labour practices (Geneva, ILO, 1991), 160 pp.ISBN 92-2-107285-1ISBN 84-7434-726-2 (Spanish version published by the Ministry of Labour and Social Security, Madrid,Spain)

1 This updates the two earlier studies: Employment effects of multinational enterprises in industrialised countriesand Employment effects of multinational enterprises in developing countries (published in 1981, 2nd impr. 1985).
C:\Documents and Settings\bouchet\Local Settings\Temp\WP84 Zimbabwe\v.3 65
Other monographs (listed by theme)Multinationals' training practices and development (Geneva, ILO, 1981), 138 pp.ISBN 92-2-102569-1ISBN 92-2-202569-5 (French version)ISBN 92-2-302569-9 (Spanish version)
Technology choice and employment generation in multinational enterprises in developing countries (Geneva,ILO, 1984), 77 pp.ISBN 92-2-103718-5ISBN 92-2-203718-9 (French version)ISBN 92-2-303718-2 (Spanish version)
Multinational enterprises: Information and consultation concerning their manpower plans (Geneva, ILO,1985), 193 pp.ISBN 92-2-105094-7ISBN 92-2-205094-1 (French version)ISBN 92-2-305094-4 (Spanish version)
Women workers in multinational enterprises in developing countries. A joint UNCTC/ILO contribution tothe United Nations Decade for Women (Geneva, ILO, 1985), 119 pp.ISBN 92-2-100532-1ISBN 92-2-200532-5 (French version)ISBN 92-2-300532-9 (Spanish version)
Safety and health practices of multinational enterprises (Geneva, ILO, 1984, 2nd impr. 1986), 90 pp.ISBN 92-2-103742-8ISBN 99-2-203742-1 (French version)ISBN 92-2-303742-5 (Spanish version)
Multinationals and employment: The global economy of the 1990s, edited by Paul Bailey, Aurelio Parisottoand Geoffrey Renshaw (Geneva, ILO, 1993), 325 pp. 1
ISBN 92-2-107105-7ISBN 84-7434-906-0 (Spanish version published by the Ministry of Labour and Social Security, Madrid,Spain)
Working papers focusing on specific industries or sectorsLes effets des entreprises multinationales agro-alimentaires sur l'emploi en Amérique latine (Document dutravail no 4, 1982) 42 pp.by G. Arroyo, S. Gomes de Almeida and J.M. von Der WeidISBN 92-2-202268-8ISBN 92-2-302268-1 (Spanish version)
International divestment and restructuring decisions (with special reference to the motor industry) (WorkingPaper No. 40, 1986), 46 pp.by Mark CassonISBN 92-2-105428-2

66 C:\Documents and Settings\bouchet\Local Settings\Temp\WP84 Zimbabwe\v.3
Decision-making structure in United States and Japanese manufacturing affiliates in the United Kingdom:Some similarities and contrasts (Working Paper No. 41, 1986), 28 pp.by John H. DunningISBN 92-2-105429-2
Employment in multinational banking: Recent trends and future prospects (Working Paper No. 50, 1987),69 pp.by Amin RajanISBN 92-2-105915-4
Las empresas multinacionales en la ocupación industrial en Argentina, 1973-83 (Documento de trabajo núm.51, 1988), 105 pp.by Eduardo BasualdoISBN 92-2-306214-4
The employment effects of manufacturing multinational enterprises in Thailand (Working Paper No. 54,1988), 63 pp.by Atchaka Sibunruang and Peter BrimbleISBN 92-2-106738-6
Social and labour issues relating to construction activities: The cases of international contractors from Italy,the Republic of Korea and the United Kingdom (Working Paper No. 65, 1994), 90 pp.by Aldo Norsa (with contribution by Claudio Sangiorgi) Young-bum Park and Roger FlanaganISBN 92-2-107538-9
The emergence of global multi-media conglomerates (Working Paper No. 70, 1990), 54 pp.by Greg MacDonaldISBN 92-2-107669-5
Technological and regulatory changes affecting multinational enterprises in telecommunications: Aspectsof the impact on the workforce (Working Paper No. 78, 1996), 93 pp.by Robin Mansell and Puay TangISBN 92-2-110138-X
Women workers and working conditions in retailing: A comparative study of the situation in a foreign-controlled retail enterprise and a nationally owned retailer in Canada (Working Paper No. 79, 1997,forthcoming)by IÕik Urla Zeytino—lu, principal researcher, and Mikaela Crook, research assistantISBN 92-2-110693-4
Multinational enterprises in the courier service industry: Aspects of employment and working conditionsin selected enterprises (Working Paper No. 81, 1997), 58 pp.by Stanley C. WisniewskiISBN 92-2-110730-2
Les entreprises multinationales dans l’industrie du textile-habillement en Tunisie: l’impact économique etsocial (Document de travail no 82), 46 pp.par Riad MeddebISBN 92-2-211092-7

C:\Documents and Settings\bouchet\Local Settings\Temp\WP84 Zimbabwe\v.3 67
Employment effects of MNEs in industrialized countriesEmployment effects of multinational enterprises: A Belgian case-study (Working Paper No. 1, 1979) 88 pp.by D. Van Den Bulcke and E. HalsbergheISBN 92-2-102265-XISBN 92-2-202265-3 (French version)
Employment effects of multinational enterprises: A survey of relevant studies relating to the FederalRepublic of Germany (Working Paper No. 2, 1979) 34 pp.by Paul J. BaileyISBN 92-2-102266-8
Employment effects of multinational enterprises: The case of the United States (Working Paper No. 12,1980), 57 pp.by D. KujawaISBN 92-2-102276-5
Domestic employment effects of direct investment abroad by two Swedish multinationals (Working PaperNo. 13, 1981), 58 pp.by Gary L. Jordan and Jan-Erik VahlneISBN 92-2-102267-6
Employment effects of multinational enterprises: The case of the Republic of Ireland (Working PaperNo. 22, 1982), 45 pp.by Mícheál O SúlleabháinISBN 92-2-103249-3
Les effets des entreprises multinationales sur l'emploi: le cas de la France (Document de travail no 24,1980), 84 pp.by Julian SavaryISBN 92-2-203385-X
The development of employment in multinational enterprises in the Federal Republic of Germany — Resultsof a new survey (1974-82) (Working Paper No. 33, 1985), 68 pp.by Werner OlleISBN 92-2-103847-5ISBN 92-2-703847-7 (German version)
Employment impact of foreign investment in Greece, Spain and Portugal (Working Paper No. 44, 1987),83 pp.by Peter J. Buckley and Patrick ArtisienISBN 92-2-105680-5
Multinational enterprises and employment (Working Paper No. 55, 1988), 46 pp.by Otto Kreye, Jürgen Heinrichs and Folker FröbelISBN 92-2-106803-X
The Nordic countries and multinational enterprises: Employment effects and foreign direct investment(Working Paper No. 57, 1989), 96 pp.by Greg MacDonaldISBN 92-2-107136-7

68 C:\Documents and Settings\bouchet\Local Settings\Temp\WP84 Zimbabwe\v.3
Multinational enterprises and employment: The Canadian experience (Working Paper No. 61, 1990), 64 pp.by M. Bradley Dow and Pradeep KumarISBN 92-2-107512-5
The employment growth of foreign multinationals: From shift-share to multi-factor partitioning (WorkingPaper No. 62, 1990), 87 pp.by Michael RayISBN 92-2-107513-3
The employment effects of multinationals in the United States (Working Paper No. 64, 1990), 117 pp.by Duncan C. Campbell and Roger McElrathISBN 92-2-107537-0
Study on the employment effects of multinational enterprises in Australia (Working Paper No. 68, 1994),31 pp.by Greg McDonaldISBN 92-2-107541-9
Employment effects of MNEs in developing countriesEmployment effects of foreign direct investments in ASEAN countries (Working Paper No. 6, 1979),118 pp.by Yasuo Kuwahara, Teruo Harada and Yoshihiro MizunoISBN 92-2-102270-6
Employment effects of multinational enterprises in Brazil (Working Paper No. 7, 1982), 110 pp.by Mario Luiz PossasISBN 92-2-102271-4ISBN 92-2-302271-1 (Spanish version)
The effects of multinational enterprises on employment in India (Working Paper No. 9, 1979), 32 pp.by Usha DarISBN 92-2-102277-3
Employment effects of multinational enterprises in Nigeria (Working Paper No. 10, 1979), 19 pp.by Olukunle Iyanda and Joseph A. BelloISBN 92-2-102274-9
Multinational enterprises and employment in the Caribbean with special reference to Trinidad and Tobago(Working Paper No. 20, 1982), pagination by chapterby Terisa TurnerISBN 92-2-103030-X
Multinationals and employment in a West African subregion: Liberia and Sierra Leone (Working PaperNo. 29, 1984), 49 pp.by Olukunle IyandaISBN 92-2-103623-5
Employment effects of multinational enterprises in Malaysia (Working Paper No. 53, 1988), 99 pp.by Yew Siew YongISBN 92-2-106730-0
The employment effects of manufacturing multinational enterprises in Thailand (Working Paper No. 54,1988), 63 pp.by Atchaka Sibunruang and Peter Brimble

C:\Documents and Settings\bouchet\Local Settings\Temp\WP84 Zimbabwe\v.3 69
ISBN 92-2-106738-6
Efectos de las empresas multinacionales sobre el empleo en el Perú (Documento de trabajo núm. 59, 1989),72 pp.by Arturo Vásquez, P., Luis Aparicio Valdez and Jorge Bernedo, A.ISBN 92-2-307221-2
Employment effects of multinational enterprises in Indonesia (Working Paper No. 67, 1991), 66 pp.by Hal HillISBN 92-2-107540-0
Employment effects of multinational enterprises in twin plants in the Caribbean with special reference toPuerto Rico (Working Paper No. 63, 1990), 23 pp.by Frank LongISBN 92-2-107536-2
The impact of multinational enterprises on employment, training and regional development in Namibia andZimbabwe: A preliminary assessment (Working Paper No. 84, 1998), 74 pp.by Olukunle IyandaISBN 92-2-111443-0
Indirect employment effects of MNEsThe indirect employment effects of multinational enterprises in developing countries (Working Paper No. 3,1979), 61 pp.by Sanjaya LallISBN 92-2-102280-3
Measuring the indirect employment effects of multinational enterprises: Some suggestions for a researchframework (Working Paper No. 56, 1989), 44 pp.by Nicolas JéquierISBN 92-2-106846-3
Multinational enterprises and subcontracting industries in the Third World: A study of inter-industriallinkages (Working Paper No. 58, 1989), 90 pp.by Axel HalbachISBN 92-2-107183-9
A study of the employment effects and other benefits of collaboration between multinational enterprises andsmall-scale enterprises (Working Paper No. 60, 1990), 37 pp.by David L. WrightISBN 92-2-107483-8
Multinationales et effets indirects sur l'emploi dans les pays d'accueil: un cadre d'analyse (document detravail no 72, 1993), 161 pp.by Claude Dupuy and Julien SavaryISBN 92-2-206414-3
Technology choice: Effects on employmentMultinational enterprises and employment-oriented “appropriate” technologies in developing countries(Working Paper No. 14, 1980), 26 pp.by Susumu WatanabeISBN 92-2-102573-X

70 C:\Documents and Settings\bouchet\Local Settings\Temp\WP84 Zimbabwe\v.3
Technology choice and employment creation: A case-study of three multinational enterprises in Singapore(Working Paper No. 16, 1981), 66 pp.by Linda Lim and Pang Eng FongISBN 92-2-102838-0
Appropriate technology choice and employment creation by two multinational enterprises in Nigeria(Working Paper No. 17, 1981), 37 pp.by Joseph A. Bello and Olukunle IyandaISBN 92-2-102898-4
Technology and Third World multinationals (Working Paper No. 19, 1984), 22 pp.by Louis T. Wells, Jr.ISBN 92-2-103021-0ISBN 92-2-203021-4 (French version)ISBN 92-2-303021-8 (Spanish version)
Employment and technological choice of multinational enterprises in developing countries (A literaturereview and a case-study) (Working Paper No. 23, 1983), 37 pp.by Lawrence Marsh, Richard Newfarmer and Lino MoreiraISBN 92-2-103353-8
Third World multinationals: Technology choice and employment generation in Nigeria (Working PaperNo. 25, 1983), 41 pp.by C.N.S. NambudiriISBN 92-2-103386-4
Technological change, employment generation and multinationals: A case-study of a foreign firm and a localmultinational in India (Working Paper No. 27, 1983), 72 pp.by Sanjaya LallISBN 92-2-103425-9
Multinational enterprises, transfer of managerial know-how, technology choice and employment effects:A case-study of Kenya (Working Paper No. 28, 1983), 33 pp.by Irving GershenbergISBN 92-2-103508-5
Decision-making in MNEsDecision-making in multinational enterprises: Concepts and research approaches (Working Paper No. 31,1984), 62 pp.by Michel GhertmanISBN 92-2-103831-9
Employment decision-making in multinational enterprises: Survey results from Belgium (Working PaperNo. 32, 1984), 102 pp.by Daniel van den Bulcke and Eric HalsbergheISBN 92-2-103832-7
Public multinational enterprises and strategic decision-making (Working Paper No. 34, 1986), 56 pp.by Lucien RappISBN 92-2-103946-3ISBN 92-2-203946-7 (French version)

1 The case-studies on Latin American and Caribbean countries published before 1990 were undertaken togetherwith the former UNCTC.
C:\Documents and Settings\bouchet\Local Settings\Temp\WP84 Zimbabwe\v.3 71
Decision-making in foreign-owned multinational subsidiaries in the United Kingdom (Working PaperNo. 35, 1985), 66 pp.by Stephen Young, Neil Hood and James HamillISBN 92-2-105016-6
Decision-making structures and processes in multinationals in Japan (Working Paper No. 36, 1985), 37 pp.by Yasuo KuwaharaISBN 92-2-105119-6
Access to decision-makers in multinational and multi-plant enterprises: A review of labour law and practice(Working Paper No. 37, 1985), 62 pp.by Roger BlanpainISBN 92-2-105120-X
A case-study on decision-making in selected multinational enterprises in India (Working Paper No. 38,1985), 44 pp.by P.N. AgarwalaISBN 92-2-105121-8
Decision-making regarding restructuring in multinational enterprises (Working Paper No. 39, 1986), 69 pp.by Michel GhertmanISBN 92-2-105430-6ISBN 92-2-205430-X (French version)
Decision-making in joint ventures (Working Paper No. 45, 1986), 43 pp.by Yaram Zeira and Oded ShenkarISBN 92-2-105691-0
European Works Councils in multinational enterprises: Background, working experience (Working PaperNo. 83, 1998).by Roger BlanpainISBN 92-2-111434-1
Publications on export processing zones
MonographsThe economic and social effects of multinational enterprises in export processing zones. A jointILO/UNCTC study (Geneva, ILO, 1988), 169 pp.ISBN 92-2-106194-9ISBN 92-2-306194-6 (Spanish version)
Working papers 1
Employment and multinationals in Asian export processing zones (Working Paper No. 26, 1983), 82 pp.by Rudy MaexISBN 92-2-103404-6 (2nd impr. 1985)ISBN 92-2-203404-X (French version)ISBN 92-2-303404-3 (Spanish version)ISBN 0285-9653 (Japanese version)

72 C:\Documents and Settings\bouchet\Local Settings\Temp\WP84 Zimbabwe\v.3
Employment and multinational enterprises in export processing zones: The cases of Liberia and Ghana(Working Paper No. 30, 1984), 74 pp.by George BotchieISBN 92-2-103770-3
Employment effects of multinational enterprises in export processing zones in the Caribbean (WorkingPaper No. 42, 1986), 82 pp.by Frank LongISBN 92-2-105520-5
Export processing zones in developing countries: Results of a new survey (Working Paper No. 43, 1987),33 pp.by Otto Kreye, Jürgen Heinrichs, Folker FröbelISBN 92-2-105642-2
Las zonas francas industriales y las empresas multinacionales: Efectos económicos e impacto sobre elempleo en la República Dominicana (Documento de trabajo núm. 46, 1986), 51 pp.by Francisco de Moya EspinalISBN 92-2-305725-6
Employment effects of exports by multinationals and of export processing zones in Brazil (Working PaperNo. 47, 1987), vi + 75 pp.by Mario L. Possas, Joao E.P. Furtado and Enéas G. CarvalhoISBN 92-2-105801-8
Industrias de maquila, zonas procesadoras de exportación y empresas multinacionales en Costa Rica yEl Salvador (Documento de trabajo núm. 48, 1987), x + 94 pp.by Guillermo Pavez HermosillaISBN 92-2-305841-4
La industria maquiladora en México (Documento de trabajo núm. 49, 1987), vii + 98 pp.by Mercedes Pedrero Nieto and Norma SaavedraISBN 92-2-305845-7
Multinational enterprises and employment in the Mauritian export processing zone (Working Paper No. 52,1988), 75 pp.by Catherine HeinISBN 92-2-106281-3
The economic and social impact of export processing zones: The case of Malaysia (Working Paper No. 66,1994), v + 62 pp.by G. SivalingamISBN 92-2-107539-7
Export processing zones in Sri Lanka: Economic impact and social issues (Working Paper No. 69, 1994),vii + 63 pp.by Janaki Abeywardene, Romayne de Alwis, Asoka Jayasena, Swarna Jayaweera and Thana SanmugamISBN 92-2-107542-7
Zonas francas industriales en la República Dominicana: Su impacto económico y social (Documento detrabajo núm 73, 1993), vi + 65 pp.by Fernando Reyes Castro and Atahualpa Domínguez U.ISBN 92-2-306417-1

C:\Documents and Settings\bouchet\Local Settings\Temp\WP84 Zimbabwe\v.3 73
Export processing zones in the Republic of Korea: Economic impact and social issues (Working PaperNo. 75, 1993), 45 pp.by Won Sun OhISBN 92-2-109096-5
Export processing zones in the Philippines: A review of employment, working conditions and labourrelations (Working Paper No. 77, 1996), vii and 44 pp.by Elizabeth M. RemedioISBN 92-2-110056-1
Export processing zones in Bangladesh: Economic impact and social issues (Working Paper No. 80, 1998),72 pp.by Debapriya BhattacharyaISBN 92-9-110715-5
Other
Reports of meetingsProceedings of the UNCTC/ILO Training Workshop on Export Processing Zones for Government Officialsin Latin America and the Caribbean, 25-28 October 1988, Bridgetown, Barbados (Geneva, ILO, 1992), 72pp.ISBN 92-2-108379-9
Proceedings of the China/ILO National Workshop on Social and Labour Practices for MultinationalEnterprises Operating in China and its Special Economic Zones, Shenzhen, 12-17 December 1988 (Geneva,ILO, 1989), 147 pp.ISBN 92-2-107242-8
The Tripartite Declaration and publicationson this instrument and the ILO's Programmeon Multinational EnterprisesTripartite Declaration of Principles concerning Multinational Enterprises and Social Policy (Geneva, ILO,1977, second edition 1991), 16 pp.ISBN 92-2-107100-6(Also available in French, Spanish, Arabic, Chinese, Russian, Amharic, Bahasa, Bulgarian, Czech, Danish,Dutch, Farsi, Finnish, German, Greek, Italian, Japanese, Korean, Mongolian, Norwegian, Polish,Portuguese, Romanian, Thai, Turkish and Vietnamese.)First Edition (revision in progress): Brazilian, Hungarian and Swedish.
ILO research on multinational enterprises and social policy: An overview (Working Paper No. 15)(Rev. 1982), 33 pp.by Hans GünterISBN 92-2-102918-2ISBN 92-2-202918-6 (French version)ISBN 92-2-302918-X (Spanish version)
The Tripartite Declaration of Principles concerning Multinational Enterprises and Social Policy (history,contents, follow-up and relationship with relevant instruments of other organizations) (Working PaperNo. 18, 1981, second impr. 1983) 29 pp.by Hans GünterISBN 92-2-102909-3ISBN 92-2-202909-7 (French version)ISBN 92-2-302909-0 (Spanish version)

74 C:\Documents and Settings\bouchet\Local Settings\Temp\WP84 Zimbabwe\v.3
The ILO Tripartite Declaration of Principles concerning Multinational Enterprises and Social Policy — Tenyears after (Geneva, ILO, 1989), 21 pp.(No ISBN). Also available in French and Spanish.