The Impact of Microinsurance on Consumption Smoothing and ... · The Impact of Microinsurance on...
36
The Impact of Microinsurance on Consumption Smoothing and Asset Protection: Evidence from a Drought in Kenya Sarah A. Janzen University of California Davis [email protected] Michael R. Carter University of California Davis [email protected] Selected paper prepared for presentation at the Agricultural & Applied Economics Association’s 2013 AAEA & CAES Joint Annual Meeting, Washington, DC, August 4-6, 2013. Copyright 2013 by Sarah A. Janzen and Michael R. Carter. All rights reserved. Readers may make verbatim copies of this document for non-commercial purposes by any means, provided that this copyright notice appears on all such copies.
-
Upload
truongngoc -
Category
Documents
-
view
215 -
download
2
Transcript of The Impact of Microinsurance on Consumption Smoothing and ... · The Impact of Microinsurance on...
The Impact of Microinsurance onConsumption Smoothing and Asset Protection:
Evidence from a Drought in Kenya
Sarah A. JanzenUniversity of California Davis
Michael R. CarterUniversity of California Davis
Selected paper prepared for presentation at the Agricultural & AppliedEconomics Association’s 2013 AAEA & CAES Joint Annual Meeting,
Washington, DC, August 4-6, 2013.
Copyright 2013 by Sarah A. Janzen and Michael R. Carter. All rights reserved. Readersmay make verbatim copies of this document for non-commercial purposes by any means,
provided that this copyright notice appears on all such copies.
The Impact of Microinsurance onConsumption Smoothing and Asset Protection:
Evidence from a Drought in Kenya
Sarah A. Janzen and Michael R. Carter
May 2013
Abstract:
When natural disasters strike in developing countries, households are often forced to choose betweenpreserving assets or consumption: either can result in permanent consequences. In this paper weask: can insurance transfer risk in a way that reduces the need for households to rely on costlycoping strategies that undermine their future productivity? Since 2010, pastoralists in northernKenya have had access to a novel index-based drought insurance product. We analyze the impactof a drought-induced insurance payout on consumption smoothing and asset protection in thissetting. Our results show that insured households are on average 36 percentage points less likely toanticipate drawing down assets, and 25 percentage points less likely to anticipate reducing mealsupon receipt of a payout. Empirical evidence of a poverty trap in this setting suggests that theseaverage impacts may mask a heterogeneous behavioral response and subsequent heterogeneousimpacts of insurance. For this reason we use Hansen’s (2000) threshold estimator to estimate acritical asset threshold around which optimal coping strategies bifurcate. Using this approach wefind that that households holding assets above a critical asset threshold, who are also most likelyto sell assets, are 64 percentage points less likely to anticipate doing so when an insurance payoutis available. Households holding assets below the estimated threshold, who are likely to destabilizeconsumption, are 43 percentage points less likely to anticipate doing so with insurance. Together,these results suggest that insurance can help households to protect assets during crises, withouthaving the deleterious effect on human capital investments.
Sarah Janzen is a Ph.D. candidate in the Department of Agricultural and Resource Economics at theUniversity of California, Davis. Michael Carter is a Professor in the Department of Agricultural and ResourceEconomics at the University of California, Davis. This publication was made possible using data collectedby a collaborative project of the International Livestock Research Institute, Cornell University, SyracuseUniversity and the BASIS Research Program at the University of California at Davis. This project was madepossible by the generous funding of the UK Department for International Development through FSD TrustGrant SWD/Weather/43/2009, the United States Agency for International Development grants No: EDH-A-00-06-0003-00 and the World Bank’s Trust Fund for Environmentally and Socially Sustainable DevelopmentGrant No: 7156906. The authors wish to thank the following individuals for the critical contributions theymade to this research project: Chris Barrett, Sommarat Chantarat, Munenobu Ikegami, John McPeak andAndrew Mude. All errors are our own.

Whenever extreme drought strikes northern Kenya, the effects can be devastating. Live-
stock, the primary asset and source of livelihood, weaken and often die. Distressed sales of
livestock flood the market, causing downward pressure on livestock prices. The combination
of livestock loss and destocking herds debilitates the household’s main productive resource,
making recovery after the drought all the more challenging. In an effort to maintain assets,
households may instead choose to cut back on meals. Yet by reducing consumption, house-
holds undercut critical investments in human capital, inhibiting both current and future
productivity. In these ways a single negative shock can lead to chronic poverty by restrict-
ing the ability of a multi-generational family to generate current and future income. In
this paper we assess whether insurance offers an effective alternative to these costly coping
strategies which make recovery so difficult.
Insurance has been widely heralded in the past decade as a market-based risk transfer
mechanism that has the potential to act as a safety net, preventing against catastrophic
collapse. Although development of insurance pilot projects have been widespread, little
is known about their impact. In this paper we ask: Can microinsurance designed for poor
households transfer risk in such a way that it reduces the need for households to rely on costly
coping strategies that undermine future productivity? In particular, are insured households
less likely to sell livestock or reduce consumption?
A growing evidence base suggests that microinsurance designed for poor households can
influence households’ ex ante risk management decisions. This analysis offers one of the
first empirical assessments of the impact of a market-based index insurance contract on a
household’s ability to cope with shocks ex post. We report the impact results from the
index-based livestock insurance (IBLI) pilot in Marsabit district of northern Kenya. Since
2010, pastoralists in northern Kenya have had the opportunity to purchase a novel index-
based insurance contract to protect against livestock mortality losses due to drought. A
harsh drought swept the Horn of Africa in 2011 activating the first IBLI payout. We use
households’ reported intentions at the time of the payout to empirically study the impact
1

of the index-based livestock insurance on pastoralist households’ consumption decisions and
their ability to protect key productive assets, namely livestock.
Our results reveal that, relative to uninsured households, insured households expect to
radically reduce their dependence on costly coping strategies which impair their future pro-
ductivity. 1) Insured households are on average 36 percentage points less likely to anticipate
selling livestock in the wake of the 2011 drought (overall a 50% reduction), improving their
ability to generate income after drought. 2) Insured households are on average 25 percentage
points less likely to reduce meals than their uninsured counterpart (an overall reduction of
about one third). This behavioral change implies a reduction in the number of undernour-
ished and malnourished individuals, including women and children, in this food insecure
region.
This paper also makes a contribution to the literature of poverty traps. This literature
suggests that in certain environments, there exists a critical asset threshold at which we
observe a bifurcation in optimal behavior. Households with asset stocks safely above the
threshold will be more willing to forfeit assets in order to smooth consumption when an
adverse shock hits. Alternatively, households with small asset stocks will optimally choose
to destabilize consumption in order to smooth assets. Empirical evidence of a poverty trap
in our research setting suggests that simply estimating the average impact of insurance may
mask a heterogeneous behavioral response and subsequent heterogeneous insurance impact.
For this reason, we use Hansen’s (2000) threshold estimation method, and provide evidence
that a behavioral threshold does indeed exist in this setting: consumption smoothing is
more common above an estimated threshold, and asset smoothing is more common below
an estimated threshold. This finding implies that simply estimating the average effect of
insurance may lead to biased estimates. The results of this threshold-based approach suggest:
1) Households holding assets above the estimated threshold, who are most likely to sell
assets, are 64 percentage points less likely to anticipate doing so when an insurance payout
is available. 2) Households holding assets below the estimated critical threshold, who are
2

prone to destabilizing consumption, are 43 percentage points less likely to anticipate doing so
with insurance. Together, these results suggest that insurance can help households to protect
assets during crises, without having a deleterious effect on human capital investments.
The rest of the paper is organized as follows: We begin with a discussion of the relevant
literature. Section 1 reviews some of the related literature on risk in developing countries
and its permanent consequences. Section 2 then provides an overview of the literature
studying how insurance might help households to cope with uninsured risk and vulnerability,
particularly in developing countries. In Section 3, we provide background information on
the research setting, and discuss the available data. Our estimation strategy is outlined
in Section 4. We use an instrumental variables approach to control for endogeneity in the
decision to insure, combined with Hansen’s (2000) threshold estimator to produce expected
heterogeneous impacts of livestock insurance payouts in northern Kenya. In Section 5, we
present and discuss our main finding: that insurance, and specifically an insurance payout
in the midst of a shock, dramatically reduces the need for a household to depend on costly
coping strategies which undermine its future productivity. In Section 6 we take advantage
of data regarding pre-payout drought coping strategies to analyze the impact of insurance
on consumption and asset smoothing behaviors prior to receipt of an insurance payout.
These findings are inconclusive, and reflect the idea that people may have some distrust or
incomplete understanding about how insurance works. Section 7 concludes, and an appendix
provides additional ex post impact results using alternative approaches.
1 Shocks and their Permanent Consequences
Uninsured risk and vulnerability can be an unavoidable part of daily life for households in
developing countries. Not only can shocks give rise to temporary consequences, but there is
growing evidence to suggest that shocks can result in permanent consequences. This finding
has developed into a wide literature of poverty traps. A poverty trap has been defined as
3

“any self-reinforcing mechanism which causes poverty to persist.” (Azariadis and Stachurski,
2005). This literature has often focused on multiple equilibrium poverty traps, which are
characterized by at least one equilibrium associated with a poor standard of living, and
another associated with a high standard of living. The existence of multiple equilibria also
implies the existence of a “threshold” or “tipping point” at the boundary between the two
regions.
If a threshold exists, at which we observe a bifurcation of equilibrium outcomes, then
a shock will result in permanent consequences whenever it propels a household across the
threshold. Building on this concept, Carter and Barrett (2006) develop an asset-based
approach in which they distinguish transitory poverty from chronic structural poverty by
using a dynamic asset poverty line. In this framework, if assets fall below a critical threshold
in any period, then households will find it difficult to accumulate assets; they become trapped
in poverty.
The asset-based approach to understanding persistent poverty suggests an important
behavioral response to critical thresholds. Zimmerman and Carter (2003) use stochastic
dynamic programming techniques to show that households above the threshold will opti-
mally choose to smooth consumption, whereas poorer households around the threshold will
choose to smooth assets instead, because asset preservation is crucial to future consump-
tion. Hoddinott (2006) provides evidence that in the wake of the 1994-1995 drought in
Zimbabwe, richer households sold livestock in order to maintain consumption. In contrast,
poor households with one or two oxen or cows were much less likely to sell livestock, mas-
sively destabilizing consumption instead. In Ethiopia, Carter et al. (2007) also find evidence
of asset smoothing by the poor, as households coping with a drought attempted to hold onto
their livestock at the cost of consumption. Carter and Lybbert (2012) find similar evidence
in Burkina Faso. They empirically estimate an asset threshold, and show that households
above the estimated dynamic asset threshold almost completely insulate their consumption
from weather shocks by drawing down assets, whereas households below the threshold do
4
not.
The dilemma, as Hoddinott (2006) points out, is that even though asset smoothing is an
attempt to preserve assets, consumption is an input into the formation and maintenance of
human capital. Hoddinott poignantly argues that, “The true distinction lies in households’
choices regarding what type of capital - physical, financial, social or human (and which hu-
man) - that they should draw down given an income shock.” While asset protection strategies
are designed to avoid a poverty trap, they likely come at a very high cost of immediately re-
duced consumption, with potentially irreversible losses in child health and nutrition (Carter
et al., 2007).
The outcomes of undernutrition and malnutrition are widely known. In children, these
conditions can lead to muscle wastage, stunting, increased susceptibility to illness, lower
motor and cognitive skills, slowed behavioral development, and increased morbidity and
mortality (Ray, 1998; Martorell, 1999). Those that do survive suffer functional disadvan-
tages as adults, including diminished intellectual performance, work capacity and strength.
In women, undernourishment during childhood can be the cause of lower adult body mass,
which means increased risk of delivery complications and lower birthweights for the next
generation (Martorell, 1999). These outcomes set the stage for a pernicious intergenera-
tional cycle of undernutrition and its destructive effects. Moreover, undernourishment during
adulthood further diminishes muscular strength and increases susceptibility to disease. Such
undernourishment in adults can also lead to a nutrition-based poverty trap if it decreases
the capacity to do productive work (Dasgupta and Ray, 1986).
This dilemma points to a need for a productive safety net that protects vulnerable house-
holds from 1) losing productive assets, and 2) engaging in costly coping strategies which
impair the human capital of current and future generations. Insurance is a market-based
product which has the potential to act as a safety net (Barrett et al., 2007; Skees and Collier,
2008). It offers an alternative means of coping with negative shocks, allowing smoothing of
consumption and nutrition, as well as avoidance of costly asset depletion (Dercon et al.,
5

2008).
2 The Ex Ante and Ex Post Impacts of Microinsurance
A growing literature has been devoted to studying the benefits of insurance for poor house-
holds in low income countries. This type of insurance (targeted to poor households, and
available at low cost) has become known as microinsurance. Barnett, Barrett, and Skees
(2008), Dercon et al. (2008) and Cole et al. (2012) provide summaries of the literature.
The literature highlights two primary avenues through which insurance might bring about
positive impacts. These avenues reflect the fact that households make both ex ante risk
management decisions and ex post risk coping decisions.
Section 1 suggests that poor households are limited in their ability to cope with risk ex
post. Often such households are forced to choose between destabilizing critical consumption
and depleting productive asset shocks, and either decision can result in permanent conse-
quences. In the absence of insurance, there are several potential avenues for ex ante risk
management, though all similarly involve tradeoffs. One option is to simply allocate resources
toward activities with lower risk. However, these lower-risk activities generally produce a
lower return. Another option is to build up precautionary savings, but such savings must
come at the cost of (often critical) investment or consumption today. Households may also
choose to reduce their risk exposure by diversifying crop choice, assets or activities, but such
diversification is not always possible, and can only be beneficial if the risk involved is not
perfectly correlated across the various activities (Dercon et al., 2008).
Insurance provides an alternative risk management tool that may reduce the use of these
and other ex ante risk management strategies. By altering the ability of households to cope
with risk ex post, insurance may change optimal behavior before a shock is actually observed.
To demonstrate this effect, de Nicola (2011) estimates a dynamic stochastic model of weather
insurance. The model predicts that insurance will increase the adoption of riskier but more
6

productive seeds, and also stimulate decreased investment, as households shift towards higher
levels of consumption. This may reflect the idea that investment is a form of precautionary
savings in her model. Janzen, Carter, and Ikegami (2013) use similar methods to show that
when you account for a critical asset threshold, around which optimal behavior and equi-
librium outcomes bifurcate, increased investment occurs around the threshold as households
assume greater risk in order to attain higher productivity and a higher equilibrium. The
same model shows that households above the threshold follow de Nicola’s prescription: de-
creased investment and increased consumption as households move away from holding assets
as precautionary savings.
Cole et al. (2012) conduct a systematic review of the effectiveness of microinsurance, and
specifically index-based insurance, in helping smallholders manage weather-related risks.
Their review identifies a substantial evidence gap in the literature on the impact of index-
based microinsurance. Several papers have attempted to bridge this gap empirically, but
all papers known to the authors focus on the impact of insurance on household’s ex ante
risk management strategies. These papers all show that insurance encourages investment in
higher risk activities with higher expected profits. Mobarak and Rosenzweig (2012) provide
evidence that farmers in India with access to insurance shift into riskier, but higher-yielding
rice production. Cai et al. (2012) find that insurance for sows significantly increases farm-
ers’ tendency to raise sows in southwestern China, where sow production is considered a
risky production activity with potentially large returns. Karlan et al. (2012) show that
farmers who purchase rainfall index insurance in Ghana increase agricultural investment.
Bellemare et al. (2013) find that cooperatives with access to area-yield index insurance for
cotton increased risky cotton production (and subsequent cotton inputs) in Mali. Cai (2012)
demonstrates that tobacco insurance increases the land tobacco farmers devoted to risky to-
bacco production by 20% in China. This last finding implies reduced diversification among
tobacco farmers. The same paper also finds that insurance causes households to decrease
savings by more than 30%, suggesting that households were building up extra savings in
7

order to better smooth consumption in the case of a shock. Hill and Viceisza (2010) use
experimental methods to show that in a game setting, insurance induces farmers in rural
Ethiopia to take greater, yet profitable risks, by increasing (theoretical) purchase of fertilizer.
While the impacts of insurance on ex ante risk management decisions are important,
none of these papers is able to assess how an insurance payout directly influences the ability
of poor households to recover after a shock. This paper represents one of the first attempts
to fill this gap by studying the impact of insurance on ex post risk coping decisions. We do
so by empirically analyzing whether the index-based livestock insurance contract in northern
Kenya successfully functioned as a safety net by preventing costly coping strategies which
might otherwise have crippled future productivity.
3 Research Setting and Data
This impact evaluation utilizes data from the index-based livestock insurance (IBLI) pilot
project in northern Kenya’s arid and semi-arid lands. This section provides background
information about the research setting, the insurance pilot, and the available data including
some summary statistics.
3.1 Drought Risk Among Pastoralists in Northern Kenya
More than 3 million pastoralist households live in northern Kenya’s arid and semi arid
lands. The vast majority of these households rely on livestock for their primary livelihood.
This setting is unique, because previous analyses of this livestock-dependent economy have
provided strong empirical evidence of a poverty trap. Lybbert et al. (2004) and Barrett et al.
(2006) use different data and methods to demonstrate nonlinear asset dynamics, such that
when livestock herds fall below a critical threshold, recovery becomes difficult, and herds
tend to move toward a low level equilibrium. Toth (2012) hypothesizes that these nonlinear
asset dynamics are due to a critical herd size necessary to support mobility. Small herds are
8

restricted to degraded rangelands near the town centers, where growth becomes challenging.
This problem is compounded by an absence of formal credit markets: households can’t take
out a loan to reach the dynamic asset threshold, thereby moving onto a higher welfare path.
Furthermore, Santos and Barrett (2011) show that access to informal credit is concentrated
at the observed critical threshold. Thus, the persistently poor are consistently excluded from
informal credit arrangements, further exacerbating the poverty trap mechanism.
When drought hits this region, households dependent on livestock must cope with large
livestock losses. According to the data used for this paper, in the recent drought that
devastated the Horn of Africa in 2011, families lost on average more than one third of their
animals. As we have already highlighted, during and after a drought, cash-strapped food-
insecure households often have limited options for coping with the harsh effects of drought,
and the options available often undercut future productivity.
In January 2010 the index-based livestock insurance (IBLI) pilot project was launched in
Marsabit District of northern Kenya as a collaborative project of the International Livestock
Research Institute, Cornell University, Syracuse University and the BASIS Research Pro-
gram at the University of California Davis in an effort to help pastoralists manage drought
risk. The IBLI index insurance contract uses satellite-based NDVI (normalized difference
vegetation index) measures of available vegetative cover to predict average livestock mortal-
ity experienced by local communities. The IBLI index has been shown to be highly correlated
with actual livestock mortality losses experienced by pastoralists in the region (see Chan-
tarat et al., 2010, 2012 for details). Households choose the number of livestock they wish
to insure, with the contract expressed in tropical livestock units (TLU), so that a single
annual contract accommodates the various livestock species common in the region: goats,
sheep, cattle, and camels.1 The premium households pay depends on the risk associated
with the geographic region in which they live (Upper Marsabit is more susceptible to ex-
treme drought, so households insuring in this region are required to pay a higher premium).
1In the IBLI contract, a goat or sheep is equal to .1 TLU, cattle are equal to a single TLU, and a camelis equal to 1.4 TLU.
9

Figure 1: Timeline of IBLI Sales, Payouts, Normal Rainy Seasons and Area NDVI
2009 2010 2011 2012
IBLI Sale
IBLI Sale
IBLI Sale
IBLI Sale
IBLI Sale
-2
-1.5
-1
-0.5
0
0.5
1
1.5
2
2.5 Maikona North Horr Central/ Gadamoji Laisamis Loiyangalani
Household Survey and
Index Triggered: IBLI Payouts Made
Standardized NDVI
Insured households receive a payout at the end of each dry season, at the beginning of Octo-
ber and again early in March, if the predicted average livestock mortality rate reaches 15%,
with the payout equal to the value of all predicted losses greater than 15%.
Figure 1 depicts the NDVI over time for each index area, where points above zero suggest
above average vegetation, and points below zero indicate poor vegetative conditions. The
rain clouds depict periods of normal rainfall, with the smaller cloud an indicator of the short
rainy season, and the bigger rain cloud an indicator of the long rainy season. In late 2010,
the long rains failed and the vegetative conditions on the ground fell below average. The
situation deteriorated throughout much of 2011 as a harsh drought swept across the Horn
of Africa. The cumulative effect of these below average conditions triggered the first IBLI
payouts in October-November 2011, as the predicted livestock mortality rose above 15% in
all five regions. These payouts were made to households who had purchased insurance earlier
in the year. Households in our study received an average payout of about 10,000 Kenyan
Shillings (or roughly $150).
10
3.2 Data
The data available includes household-level information collected annually (beginning in
2009) for 924 randomly selected households living in various sublocations across Marsabit
district, all with access to IBLI. In each round of the survey, households were asked to answer
questions about health, education, livestock holdings, herd migration, livelihood activities,
income, consumption, assets, and access to credit. Each household also participated in an
experiment to elicit their risk preferences. In the surveys following the baseline, households
were also asked questions about insurance purchases, access to information about insurance,
and tested on their level of insurance understanding.
Two levels of randomization occurred at the household-level. First, as part of an en-
couragement design, in each period 60% of surveyed households were randomly selected to
receive coupons offering a 10-60% discount on the first 15 TLU insured. Second, some house-
holds were randomly selected to participate in experimental games, which were used as a
means of communicating the complex concepts of index insurance. The games were designed
to demonstrate the inter-temporal benefits of insurance by simulating herd dynamics over
multiple seasons. They demonstrated that insurance would have to be purchased before
the season began, and for each subsequent season that coverage was desired. In addition,
the games conveyed that indemnity payments were triggered by droughts, that IBLI would
not cover non-drought-induced losses, and that if a drought did not trigger payments, the
premium would not be returned (see McPeak, Chantarat, and Mude, 2010 for details). Non-
participants heard about IBLI from other participants, through village assemblies, by word
of mouth or through local village insurance promoters.
Most of the data used for this analysis comes from the third round of the panel sur-
vey, completed in October-November 2011. The only exception are a few control variables
which were assumed to have remained constant between the survey rounds. Included in this
category are ethnicity, years of education of the household head, and risk aversion. Table
1 reports summary statistics on key variables disaggregated by whether a household was
11

insured during 2011. All households had the opportunity to insure, but only 24% actually
purchased insurance. Variables reported include the level of education of the household head,
a dummy variable for whether a household is risk-taking or risk-moderate (as determined
from an experiment eliciting risk preferences), the number of livestock owned, livestock losses
in the past year, expected livestock losses in the next year and whether households indicated
that it is difficult to acquire a loan. We also report summary statistics for a non-livestock
asset index constructed from the first principle component using factor analysis. Variables
used to generate the asset index include housing characteristics (such as materials used in
the wall or for flooring in the house), cooking appliances, access to water, and possession of
large assets such as a motorbike, boat, sewing machine, grinding mill or television. In addi-
tion, we show summary information on IBLI-specific variables of interest: dummy variables
indicating that they participated in an experimental insurance game, and whether or not
they received a discount coupon as well as its value. Because the discount coupon will be an
important part of our identification strategy, we also report summary statistics for the same
variables disaggregated by whether households received a discount coupon.
As we can see, the insured population appears relatively similar to the uninsured pop-
ulation with few observable statistically significant differences between the treatment and
control. The encouragement design appears to have been effective, with the treated popula-
tion being more likely to have received a coupon (and one of larger size). The game, on the
contrary, is not strongly correlated with insurance adoption.
3.3 Strategies for Coping with Drought in Marsabit
The third round of the panel survey occurred around the same time as the October-November
2011 IBLI payout. At that time every household was asked about the ways in which they had
been coping with the drought over the prior three months. Households were asked if they
had engaged in specific behaviors, including selling livestock or reducing meals. They were
then asked how they anticipated coping with the drought in the upcoming three months.
12
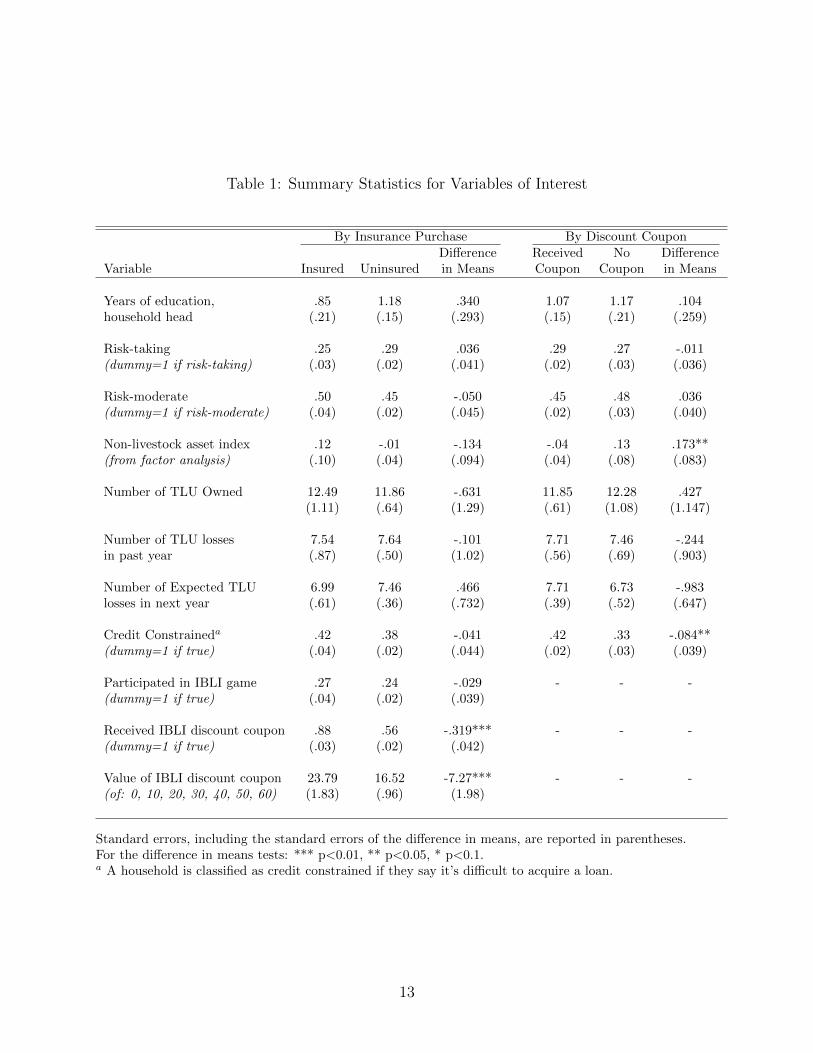
Table 1: Summary Statistics for Variables of Interest
By Insurance Purchase By Discount CouponDifference Received No Difference
Variable Insured Uninsured in Means Coupon Coupon in Means
Years of education, .85 1.18 .340 1.07 1.17 .104household head (.21) (.15) (.293) (.15) (.21) (.259)
Risk-taking .25 .29 .036 .29 .27 -.011(dummy=1 if risk-taking) (.03) (.02) (.041) (.02) (.03) (.036)
Risk-moderate .50 .45 -.050 .45 .48 .036(dummy=1 if risk-moderate) (.04) (.02) (.045) (.02) (.03) (.040)
Non-livestock asset index .12 -.01 -.134 -.04 .13 .173**(from factor analysis) (.10) (.04) (.094) (.04) (.08) (.083)
Number of TLU Owned 12.49 11.86 -.631 11.85 12.28 .427(1.11) (.64) (1.29) (.61) (1.08) (1.147)
Number of TLU losses 7.54 7.64 -.101 7.71 7.46 -.244in past year (.87) (.50) (1.02) (.56) (.69) (.903)
Number of Expected TLU 6.99 7.46 .466 7.71 6.73 -.983losses in next year (.61) (.36) (.732) (.39) (.52) (.647)
Credit Constraineda .42 .38 -.041 .42 .33 -.084**(dummy=1 if true) (.04) (.02) (.044) (.02) (.03) (.039)
Participated in IBLI game .27 .24 -.029 - - -(dummy=1 if true) (.04) (.02) (.039)
Received IBLI discount coupon .88 .56 -.319*** - - -(dummy=1 if true) (.03) (.02) (.042)
Value of IBLI discount coupon 23.79 16.52 -7.27*** - - -(of: 0, 10, 20, 30, 40, 50, 60) (1.83) (.96) (1.98)
Standard errors, including the standard errors of the difference in means, are reported in parentheses.For the difference in means tests: *** p<0.01, ** p<0.05, * p<0.1.a A household is classified as credit constrained if they say it’s difficult to acquire a loan.
13

Insured households were asked this second question after being told exactly how much they
should expect to receive as an insurance payment if they hadn’t already received one. Most
payouts were received within days or weeks of the survey, but a few households had already
received the payout.
As discussed in Section 1, the literature on poverty traps predicts that poor households
near and below a critical asset threshold will hold onto their main productive assets (live-
stock), forgoing critical consumption. Wealthier households will instead destabilize assets in
order to better smooth consumption. As a first step to understanding whether this theo-
retical prediction is observed in our sample, we arbitrarily split the sample into asset poor
households with livestock holdings below the median herd size (7.3 TLU), and asset rich
households with livestock holdings greater than the median herd. Using this loosely con-
structed definition of asset rich and asset poor households, which we later refine, we compare
the proportion of both asset poor and asset rich households that indicated they had, or ex-
pected to soon 1) sell livestock or 2) cut back on the number of daily meals eaten, in order
to cope with the drought. Figure 2 shows that asset poor households were less likely to
have sold (or expect to sell) livestock and much more likely to have reduced (or anticipate
reducing) the number of meals eaten each day. Asset rich households, on the other hand,
were less likely to cut back (or expect to reduce) on consumption, and more likely to have
sold (or anticipate selling) livestock. A difference in means test reveals that in both periods
and for both behaviors, the difference in behaviors between asset poor and asset rich house-
holds is statistically significantly different from zero at the 1% level. These findings provide
strong evidence of asset smoothing by those with small livestock holdings and consumption
smoothing by those with large herds.
Our main results are based on these anticipated behavioral changes after receipt of the
October 2011 insurance payouts. By comparing the immediately anticipated behavioral
changes made by insured households with those of their uninsured peers, we can measure
the immediate impact of drought insurance on household well-being. Figure 2 also shows the
14

proportion of both insured and uninsured households that indicated they had, or expected to
soon sell livestock or cut back on the number of daily meals eaten, in order to cope with the
drought. Substantial majorities of both insured and uninsured households cut back on meals
to deal with the drought. Roughly a third in each group sold livestock from their already
diminished herds. A coarse assessment suggests that many insured households drastically
anticipate reducing their reliance on both of these costly coping strategies.
The data also supports comparison of insured and uninsured households’ coping strate-
gies in the 3rd quarter of 2011, prior to receiving an insurance payout, to the uninsured
population. A difference between the two is most likely to reflect an intrinsic difference
between insured and uninsured households, indicating the potential for endogeneity bias in
our estimation of impacts. We find that there is a statistically significant difference: insured
households are less likely to have reduced the number of meals eaten each day in the 3rd
quarter of 2011. These differences (and economic intuition) force us to think critically about
the endogeneity of the insurance purchase.2
2A difference in 3rd quarter strategies may also reflect the fact that insured households are coping dif-ferently in anticipation of a payout, as we would expect if insurance stimulates ex ante behavioral changes).We analyze these potential impacts of insurance in Section 6.
15

Figure 2: Summary of Coping Strategies during the 2011 Drought in Marsabit
0 0.1 0.2 0.3 0.4 0.5 0.6 0.7 0.8 0.9
1
Qtr 3 Qtr 4 Qtr 3 Qtr 4
Insured
Uninsured
Asset Poor (<Median Herd)
Asset Rich (>Median Herd)
Sell Livestock Reduce Number Of Daily Meals
4 Estimation Strategy
Our empirical strategy for estimating the impact of insurance in northern Kenya accounts
for two key issues highlighted in the previous section: endogeneity of the decision to insure,
and the potential existence of a threshold around which coping strategies bifurcate. Each of
these issues are discussed below.
4.1 Estimating the Average Impact of Insurance
Ideally, we would like to compare a cohort of households randomly assigned to an insurance
“treatment” with a control group without access to insurance. Although IBLI was imple-
mented in connection with an integrated impact evaluation which includes a treatment and
control region (with and without access to IBLI, respectively), the nature and timing of
surveys varies across these two different regimes. This difference limits our ability to use
the pure control group to assess the immediate impacts of the 2011 insurance payout on the
ability of households to cope with the shock ex post. Instead, for this analysis we are limited
16
only to a population in which all households had the opportunity to insure their livestock,
though not all households chose to do so. Since households must self-select into purchasing
insurance, we must account for selection bias in the analysis.
In the absence of randomized treatment assignment, a variety of techniques exist to
control for selection bias. These methods vary according to the underlying assumptions that
must be made to use them. Because the endogenous decision to insure is likely to depend on
unobservables, our preferred estimates are based on an instrumental variables (IV) approach.
Using IV, selection bias on unobservable characteristics is corrected through the use of an
appropriate instrument.
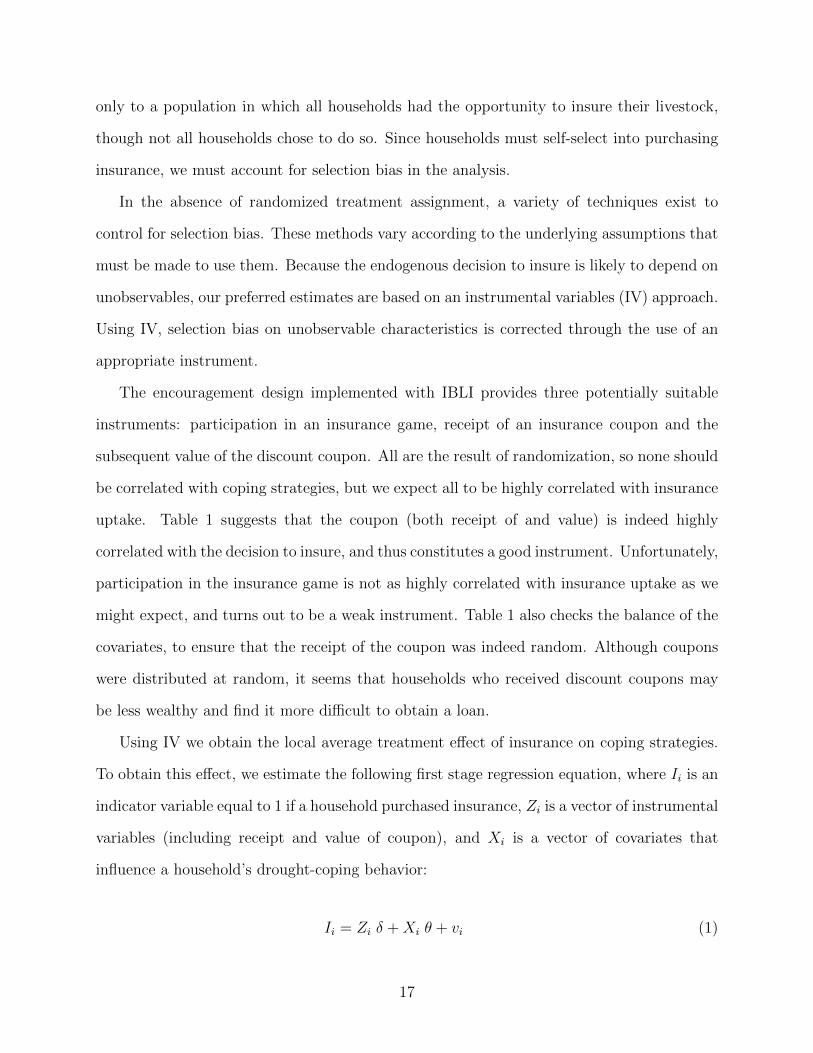
The encouragement design implemented with IBLI provides three potentially suitable
instruments: participation in an insurance game, receipt of an insurance coupon and the
subsequent value of the discount coupon. All are the result of randomization, so none should
be correlated with coping strategies, but we expect all to be highly correlated with insurance
uptake. Table 1 suggests that the coupon (both receipt of and value) is indeed highly
correlated with the decision to insure, and thus constitutes a good instrument. Unfortunately,
participation in the insurance game is not as highly correlated with insurance uptake as we
might expect, and turns out to be a weak instrument. Table 1 also checks the balance of the
covariates, to ensure that the receipt of the coupon was indeed random. Although coupons
were distributed at random, it seems that households who received discount coupons may
be less wealthy and find it more difficult to obtain a loan.
Using IV we obtain the local average treatment effect of insurance on coping strategies.
To obtain this effect, we estimate the following first stage regression equation, where Ii is an
indicator variable equal to 1 if a household purchased insurance, Zi is a vector of instrumental
variables (including receipt and value of coupon), and Xi is a vector of covariates that
influence a household’s drought-coping behavior:
Ii = Zi δ +Xi θ + vi (1)
17

We then estimate the impact of insurance (β) on household coping strategies in the following
second stage regression where predicted insurance uptake (Ii) was obtained from the first
stage equation.
yQi = β Ii +Xi φ+ εi (2)
The superscript Q for the dependent variable yQi distinguishes between coping strategies in
the 3rd and 4th quarter. Our main results consider the impact of insurance on 4th quarter
coping strategies, but Section 6 also estimates the impacts on pre-payout behaviors.
Because the assumptions necessary for IV are minimal given the available data, this is
our preferred approach. However, several alternatives to IV exist. The appendix considers
the use of both a Heckman Selection Model and Matching methods. The results do not
change substantially if we use either of these approaches.
4.2 A Threshold-based Approach
Figure 2 provides observational evidence of a potential threshold-differentiated behavioral
response in our sample. If a household’s response to the drought depends on a critical thresh-
old, it seems likely that the impact of insurance, at least for livestock sales and consumption,
will also vary depending on whether a household is above or below the threshold. Moreover,
ignoring the threshold may actually produce a weighted average of the true impacts. Our
hypotheses regarding the threshold-disaggregated impacts of insurance are as follows: asset
rich households are more likely to smooth consumption, and thus more likely to actually
destabilize their asset stocks during a shock. Hence, we expect insurance will help asset rich
households to better protect their assets. Asset poor households, on the other hand, are
typically unwilling to part with their productive assets because they rely so heavily on them
in meeting future needs. These households instead choose to forgo food consumption. We
thus expect that insurance will help asset poor households to better smooth consumption
18

during a shock.
Following Carter and Lybbert (2012), we explore these differential impacts of insurance
on behavior by using Hansen’s threshold estimation technique (Hansen, 2000) to test for the
presence of a critical asset (livestock) threshold that splits our sample into two meaningfully
different behavioral regimes based on a household’s recent coping strategies. If a threshold is
determined to exist, its location, A∗, is estimated and used to separate the sample into two
regimes: asset poor households with fewer than A∗ assets, and asset rich households who
own A∗ or greater assets. The threshold disaggregated impacts of insurance (βlow and βhigh)
are then estimated as follows:
yQi =
βlow Ii +Xi φlow + εi,low if Ai ≤ A∗
βhigh Ii +Xi φhigh + εi,high if Ai > A∗(3)
where Ii is the same as before and Ai is within vector Xi.
5 Ex Post Impacts of Insurance
In this section we present the results of the impact analysis using IV. We present both
population average impacts and threshold-disaggregated impacts. The details of the first
stage probit selection equation used to obtain IV estimates are provided in Table 2. Because
we use probit for the first stage regression, we report the Wald test for joint significance of
the two instruments: receipt and value of the IBLI discount coupon. Each of these were
the result of randomization, so we can be reasonably certain that they do not influence a
household’s response to the drought, except through the purchase of insurance. Although
participation in the IBLI game was a potential instrument, if included it is not statistically
significant from zero, and is not jointly significant with the other two instruments. For this
reason it has been excluded.
We focus on the impact of insurance on two primary outcomes of interest: expected
19

Table 2: Demand for Insurance: First Stage Probit Selection Regression
(1)
Received IBLI discount coupon (instrument #1) 1.466***(0.203)
Value of IBLI discount coupon (instrument #2) -0.004(0.004)
Years of education (head) -0.040(0.025)
Risk-taking 0.175(0.159)
Risk-moderate 0.205*(0.124)
Non-livestock asset index 0.221**(0.086)
TLU Owned 0.007(0.005)
TLU losses in past year -0.000(0.005)
Expected TLU losses -0.005(0.009)
Credit Constrained 0.041(0.119)
Ethnicity fixed effects yesLocation fixed effects yes
Observations 662Pseudo R2 0.261Wald test for joint significance of instruments 84.18
Robust standard errors in parentheses
*** p<0.01, ** p<0.05, * p<0.1
20

livestock sales and expected reduction in the number of daily meals consumed. The results
are presented for both outcomes in Table 3. Columns (1) and (4) show the population
average impacts for livestock sales and meal reductions, respectively. Columns (2)-(3) and
(5)-(6) present the threshold-disaggregated impacts.
Hansen’s threshold estimator applied to anticipated livestock sales and meal reduction
in quarter 4 yields a threshold estimate near the median herd size (which is 7.3 TLU) of
A∗ = 8.4 TLU using livestock sales or A∗ = 5.5 TLU using daily meal reduction. Figures 3a
and 3b demonstrate the confidence intervals around the estimated threshold estimates. Both
estimates are significant at the 1% level, so we are very confident that households above and
below this threshold responded differently to the drought experienced in 2011. This finding
adds to a growing body of evidence that pastoralist households in northern Kenya are indeed
responding to a critical threshold.
5.1 Impact on Livestock Sales
This section considers the impact of insurance on curbing the sale of productive assets. The
results presented in Table 3 suggest that the expectation of an insurance payout substantially
reduces the probability that a household intends to sell livestock. The average impact results
presented in Column (1) imply a 36 percentage point reduction in the number of households
who anticipated selling further livestock to cope with the 2011 drought. This represents an
overall reduction of about one half, relative to previous behavior.
The threshold-disaggregated results suggest that the benefits of insurance on asset pro-
tection are largely driven by the behavior of asset rich households. Column (2) suggests
a small statistically insignificant impact of insurance for poor households who are already
smoothing assets to the best of their ability. However, Column (3) shows that asset rich
households are 64 percentage points less likely to plan on selling livestock. These results
suggest that insurance helps stop the households prone to give up productive assets from
engaging in that costly coping strategy which would otherwise damage their productive asset
21

Figure 3: Threshold Estimation
(a) Post-Payout Asset Smoothing (b) Post-Payout Consumption Smoothin
(c) Pre-Payout Asset Smoothing (d) Pre-Payout Consumption Smoothing
22

base, harming the household’s future income-earning potential.
5.2 Impact on Consumption
When poor households endeavor to maintain scarce productive assets during a shock, it often
imposes a high cost on consumption. Here, we consider the impact of an insurance payout
on daily household consumption. The results can be found in Table 3. Focusing on the
local average treatment effect in Column (4), insurance (and receiving an insurance payout)
results in a 25 percentage point drop in the number of households that anticipate decreasing
the number of meals eaten each day when under stress from a drought. Overall, this is a
reduction of about one third. This result suggests that insurance improves food security;
insured households are much less likely to be malnourished or undernourished during a
drought.
Columns (5)-(6) show that the magnitude of the insurance impact is larger for asset poor
households when we consider anticipated consumption destabilization. That is, poor house-
holds, who are most likely to destabilize critical consumption, are 43 percentage points less
likely to reduce the meals eaten in their household when an insurance payout is received.
The impact of insurance on expected consumption destabilization for richer households is
much smaller, and not statistically significantly different from zero. But that’s not surpris-
ing because richer households are less likely to cut back on meals in the first place. Instead,
insurance helps protect the most vulnerable households from undernutrition and malnutri-
tion, and their harmful long-term consequences. In this way it seems that insurance does
indeed provide a valuable alternative to coping with negative shocks, allowing smoothing of
consumption and nutrition, while preserving productive assets.
5.3 Multiple Hypotheses Test
In this section we have tested multiple hypotheses. Intuitively, the more hypotheses we check,
the higher the probability of making a Type I error. The Bonferroni-Holm method is one way
23

Table 3: Threshold-Disaggregated Ex Post Behavioral Impacts of Insurance
Impact #1 Impact #2Sell Livestock Reduce Meals
(1) (2) (3) (4) (5) (6)
Asset Asset Asset AssetAverage Poor Rich Average Poor Rich
< 8.4 TLU > 8.4 TLU < 5.5 TLU > 5.5 TLU
insured -0.359*** -0.211 -0.644*** -0.247** -0.430** -0.167(0.114) (0.133) (0.190) (0.121) (0.166) (0.181)
Years of education (head) -0.001 -0.008 0.011 0.000 0.001 -0.001(0.005) (0.006) (0.009) (0.007) (0.010) (0.010)
Risk-taking 0.036 0.048 0.015 -0.075 -0.060 -0.120*(0.045) (0.056) (0.068) (0.049) (0.074) (0.061)
Risk-moderate -0.013 -0.003 -0.036 -0.011 -0.034 -0.036(0.040) (0.051) 0.062 (0.046) (0.074) (0.057)
Non-livestock asset index 0.0123 0.041 -0.027 -0.059** -0.044 -0.071*(0.023) (0.027) (0.043) (0.024) (0.037) (0.033)
TLU Owned 0.006*** 0.029*** 0.004** 0.000 0.011 -0.001(0.001) (0.009) (0.002) (0.001) (0.015) (0.001)
TLU losses in past year 0.003 -0.001 .0004** -0.003 -0.012*** -0.001(0.002) (0.003) (0.002) (0.002) (0.004) (0.002)
Expected TLU losses -0.004* 0.002 -0.008*** 0.003 -0.012*** 0.007***(0.002) (0.003) (0.003) (0.002) (0.004) (0.002)
Credit Constrained 0.027 0.087** -0.006 0.055 0.058 0.048(0.034) (0.041) (0.055) (0.037) (0.053) (0.051)
Ethnicity fixed effects yes yes yes yes yes yesLocation fixed effects yes yes yes yes yes yes
Observations 662 359 303 662 286 376R2 0.164 0.121 0.263 0.172 0.200 0.260
Robust standard errors in parentheses*** p<0.01, ** p<0.05, * p<0.1
24

to address this issue of a familywise error rate. We conduct the Bonferroni-Holm test using
the calculated p-values for each of the threshold-disaggregated insurance impact coefficients.
Using this method, we fail to reject the null hypothesis of joint significance for the key ex
post impacts of insurance: insurance improves the ability of asset rich households to smooth
assets, and strengthens the capacity of asset poor households to smooth consumption.
6 Semi Ex Ante Behavioral Impacts
In addition to the ex post behavioral adjustments made upon receipt of a payout, we are able
to measure a semi ex ante impact of insurance as households alter behaviors in anticipation
of a payout. Unlike previous analyses of ex ante impacts which have focused on ex ante risk
management behaviors, these ex ante impacts consider ex post risk coping strategies, but
are semi ex ante in the sense that we now consider the impact of insurance on consumption
and asset smoothing behaviors prior to receipt of a payout.
For example, we might expect an insured asset poor optimizing pastoralist household to
cut back on meals less than his uninsured counterpart if he expects a payout to help him
smooth consumption in the near future. However, this ex ante behavioral adjustment will be
made only if households fully expect a payout to be made in a timely manner. In focus group
interviews researchers were told over and over again that households were “waiting to see
what happens,” indicating a lack of trust in the product until a payout was actually observed.
It therefore seems likely that many households would be unwilling to adjust behaviors until
a payout was actually received. If households do adjust their behaviors, the impact should
be smaller than the ex post impact presented in Table 3.
We estimate the impact of insurance on consumption and asset smoothing behaviors
prior to receipt of the payout. The threshold estimates are once again statistically significant
and relatively similar to previous estimates: A∗ = 9.7 TLU with respect to livestock sales
or A∗ = 9.6 TLU with respect to meal reduction. Because these threshold estimates are
25

based on actual behavior (rather than stated intentions) we are even more confident that
a household’s response to drought depends on their livestock holdings and a critical asset
threshold.
The results are presented in Table 4. The estimated impacts on livestock sales are
not significantly different from zero. This is true whether we consider average impacts or
threshold-disaggregated impacts. These findings suggest that households are not currently
altering their optimal livestock marketing strategies on account of insurance prior to receipt
of a payout. Rather, behavioral adjustments are only made once a payout has been received.
This may reflect a lack of trust in the product, and supports the idea that people truly are
“waiting to see what happens.”
On the contrary, Table 4 provides some evidence of ex ante consumption smoothing in
anticipation of a payout. Not surprisingly, these ex ante impacts on consumption smoothing
are smaller than the ex post impacts presented earlier. On average, the impact is significant
at the 10% level, and the evidence suggests that these ex ante behavioral adjustments are
being made primarily by asset poor households.
However, using the Bonferroni-Holm method, we reject the null hypothesis of joint sig-
nificance, revealing that the ex ante impact on consumption smoothing may suffer from a
Type I error. Although theory suggests that households will make behavioral adjustments,
we would also not be surprised to know that households are simply “waiting to see what
happens,” due to a lack of trust. In this way, our findings regarding ex ante behavioral
changes are inconclusive. In fact, if we truly believe that households are “waiting to see
what happens,” then the semi ex ante impacts presented in this section provide a useful
placebo test. By rejecting the null of join significance here, the estimated ex post impact
results presented in Section 5 become even more believable.
26

Table 4: Threshold-Disaggregated Ex Ante Behavioral Impacts of Insurance
Impact #1 Impact #2Sell Livestock Reduce Meals
(1) (2) (3) (4) (5) (6)
Asset Asset Asset AssetAverage Poor Rich Average Poor Rich
< 9.7 TLU > 9.7 TLU < 9.6 TLU > 9.6 TLU
insured -0.063 -0.043 -0.076 -0.197* -0.295** -0.155(0.109) (0.128) (0.184) (0.111) (0.128) (0.207)
Years of education (head) -0.000 -0.003 0.005 -0.003 -0.000 -0.010(0.005) (0.007) (0.008) (0.006) (0.006) (0.012)
Risk-taking 0.003 0.068 -0.067 -0.042 0.048 -0.190***(0.046) (0.053) (0.072) (0.046) (0.057) (0.069)
Risk-moderate -0.043 0.006 -0.126* -0.000 0.051 -0.085(0.041) (0.048) (0.064) (0.042) (0.053) (0.066)
Non-livestock asset index 0.036 0.056* -0.031 0.001 0.006 0.036(0.024) (0.029) (0.045) (0.024) (0.028) (0.049)
TLU Owned 0.004*** 0.014* 0.005** -0.001 0.010 0.001(0.001) (0.007) (0.002) (0.001) (0.007) (0.002)
TLU losses in past year 0.001 0.006 0.002 -0.003 -0.006 -0.003(0.002) (0.003) (0.002) (0.002) (0.004) (0.002)
Expected TLU losses -0.004* 0.010*** -0.012*** 0.003 -0.010*** 0.014***(0.002) (0.003) (0.003) (0.002) (0.003) (0.003)
Credit Constrained -0.050 0.056 -0.189*** 0.127*** 0.094** 0.124**(0.035) (0.043) (0.058) (0.034) (0.040) (0.059)
Ethnicity fixed effects yes yes yes yes yes yesLocation fixed effects yes yes yes yes yes yes
Observations 662 392 270 662 389 273R2 0.200 0.189 0.353 0.165 0.189 0.256
Robust standard errors in parentheses*** p<0.01, ** p<0.05, * p<0.1
27

7 Conclusion
When adverse shocks strike in developing countries, poor households are often forced to
choose between drawing down productive assets or human capital. Either way, uninsured
risk can result in permanent consequences if the household’s choice undermines its future pro-
ductivity. In this paper we assess whether insurance can function as a safety net, preventing
household asset depletion and improving the human capital of future generations.
Our findings suggest that IBLI payouts in Marsabit district of northern Kenya during the
drought of 2011 provided substantial immediate benefits to insured households. On average,
insured households who receive a payout are much less likely to sell livestock, improving their
chances of recovery. Insured households on average also expect to maintain their current food
consumption, rather than reduce meals like their uninsured neighbors.
We also show that households in our sample do indeed behave differently depending on
their asset holdings and a critical asset threshold. Livestock-poor households were more likely
to smooth assets, whereas livestock-rich households were more likely to smooth consumption
during the drought experienced in 2011. This finding adds to a body of empirical evidence
which suggests the presence of a poverty trap in this setting. It also indicates that simply
estimating the average effect of insurance may mask an interesting heterogenous impact of
insurance. Recognizing that a household’s response to drought depends on a critical asset
threshold, we show that the impact of insurance also depends on the critical behavioral
threshold. Our results suggest that insurance helps stop the households most likely to give
up productive assets from reducing their asset base, otherwise harming the household’s future
income-earning potential. In addition, insurance helps prevent those households most likely
to reduce consumption from doing so, thereby protecting vulnerable household members from
undernutrition and malnutrition, and improving the human capital of future generations.
Considered jointly, these impacts imply that insurance functions as a safety net, allowing
smoothing of consumption and nutrition, while preserving productive assets. In this way,
insurance promotes asset smoothing without having the deleterious long term consequences
28

of destabilized consumption.
These results come at a critical time for policymakers. There has recently been a grand
push from development agencies to scale up microinsurance pilots with the goal of reaching
a larger number of households. This push has transpired in spite of an incomplete under-
standing of microinsurance impacts. This results presented here provide some of the first
empirical evidence that insurance can improve outcomes when negative strikes occur. We
recognize that our main results are based on immediate expectations regarding a specific
insurance pilot project, and are therefore not immediately generalizable. Indeed, further
impact analyses will help to generalize the results more broadly. However, this research
provides an important first step. If the declared intentions of pastoralists in northern Kenya
closely follow their true behavior, which we believe they will, then the highly anticipated
long term positive welfare impacts of IBLI and other similar microinsurance projects are
likely to be observed in the near future.
29

References
Azariadis, C., and J. Stachurski. 2005. “Poverty Traps.” In P. Aghion and S. N. Durlauf,eds. Handbook of Economic Growth. Elsevier, vol. 1, Part A, chap. 5, pp. 295 – 384.
Barnett, B.J., C.B. Barrett, and J.R. Skees. 2008. “Poverty Traps and Index-Based RiskTransfer Products.” World Development 36:1766 – 1785.
Barrett, C.B., B.J. Barnett, M.R. Carter, S. Chantarat, J.W. Hansen, A.G. Mude, D. Os-good, J.R. Skees, C.G. Turvey, and M.N. Ward. 2007. “Poverty Traps and Climate Risk:Limitations and Opportunities of Index-Based Risk Financing.” Technical Report No.07-02, IRI, September.
Barrett, C.B., P.P. Marenya, J. McPeak, B. Minten, F. Place, J.C. Randrianarisoa, J. Rasam-bainarivo, and J. Wangila. 2006. “Welfare dynamics in rural Kenya and Madagascar.”Journal of Development Studies 42:248–277.
Bellemare, M.F., G. Elabed, M.R. Carter, and C. Guirkinge. 2013. “Impact Evaluation ofan Area-yield Index Insurance Contract for Cotton Farmers in Mali.” Unpublished.
Cai, H., Y. Chen, H. Fang, and L.A. Zhou. 2012. “The Effect of Microinsurance on EconomicActivities: Evidence from a Randomized Field Experiment.” Unpublished.
Cai, J. 2012. “The Impact of Insurance Provision on Households’ Production and FinancialDecisions The Impact of Insurance Provision on Households’ Production and FinancialDecisions.” Unpublished.
Carter, M.R., and C.B. Barrett. 2006. “The Economics of Poverty Traps and PersistentPoverty: An Asset-Based Approach.” Journal of Development Studies 42:178–199.
Carter, M.R., P.D. Little, T. Mogues, and W. Negatu. 2007. “Poverty Traps and NaturalDisasters in Ethiopia and Honduras.” World Development 35:835 – 856.
Carter, M.R., and T.J. Lybbert. 2012. “Consumption versus asset smoothing: testing theimplications of poverty trap theory in Burkina Faso.” Journal of Development Economics99:255 – 264.
Chantarat, S., A. Mude, C. Barrett, and C. Turvey. 2010. “The Performance of Index BasedLivestock Insurance in the Presence of a Poverty Trap.” Unpublished.
Chantarat, S., A.G. Mude, C.B. Barrett, and M.R. Carter. 2012. “Designing Index-BasedLivestock Insurance for Managing Asset Risk in Northern Kenya.” Journal of Risk andInsurance, pp. no–no.
Cole, S., G.G. Bastian, S. Vyas, C. Wendel, and D. Stein. 2012. “The effectiveness of index-based micro-insurance in helping smallholders manage weather-related risks.” Workingpaper, EPPI-Centre, Social Science Research Unit, Institute of Education, University ofLondon.
30

Dasgupta, P., and D. Ray. 1986. “Inequality as a Determinant of Malnutrition and Unem-ployment: Theory.” The Economic Journal 96:1011–34.
de Nicola, F. 2011. “The Impact of Weather Insurance on Consumption, Investment, andWelfare.” Unpublished.
Dercon, S., M. Kirchberger, J. Willem, and J.P. Platteau. 2008. “Literature review on mi-croinsurance.” Working paper No. 1, International Labour Office, Geneva.
Hansen, B.E. 2000. “Sample Splitting and Threshold Estimation.” Econometrica 68:575–603.
Hill, R.V., and A. Viceisza. 2010. “An Experiment on the Impact of Weather Shocks andInsurance on Risky Investment.” Discussion Paper No. 00974, IFPRI, May.
Hoddinott, J. 2006. “Shocks and their consequences across and within households in RuralZimbabwe.” Journal of Development Studies 42:301–321.
Janzen, S.A., M.R. Carter, and M. Ikegami. 2013. “Valuing Asset Insurance in the Presenceof Poverty Traps.” Unpublished.
Karlan, D., R.D. Osei, I. Osei-Akoto, and C. Udry. 2012. “Agricultural Decisions after Re-laxing Credit and Risk Constraints.” NBER Working Papers No. 18463, National Bureauof Economic Research, Inc, Oct.
Lybbert, T.J., C.B. Barrett, S. Desta, and D. Layne Coppock. 2004. “Stochastic wealth dy-namics and risk management among a poor population.” The Economic Journal 114:750–777.
Martorell, R. 1999. “The nature of child malnutrition and its long-term implications.” Food& Nutrition Bulletin 20:288–292.
McPeak, J., S. Chantarat, and A. Mude. 2010. “Explaining index-based livestock insruanceto pastoralists.” Agricultural Finance Review 70:333–352.
Mobarak, A.M., and M. Rosenzweig. 2012. “Selling Formal Insurance to the InformallyInsured.” Working Paper No. 97, Yale University, Department of Economics, February.
Ray, D. 1998. Development Economics . Princeton University Press.
Santos, P., and C.B. Barrett. 2011. “Persistent poverty and informal credit.” Journal ofDevelopment Economics 96:337–347.
Skees, J.R., and B. Collier. 2008. “The Potential of Weather Index Insurance for Spurring aGreen Revolution in Africa.” Working paper, GlobalAgRisk, Inc.
Toth, R. 2012. “Traps and Thresholds in Pastoralist Mobility.” Unpublished.
Zimmerman, F.J., and M.R. Carter. 2003. “Asset smoothing, consumption smoothing andthe reproduction of inequality under risk and subsistence constraints.” Journal of Devel-opment Economics 71:233–260.
31

Appendix: Alternative Estimation Approaches
In addition to using instrumental variables, a variety of techniques can be used to control
for selection bias. Empiricists often begin with a Heckman selection model, which controls
for selection bias and can also inform our beliefs about the importance of selection bias.
For this approach we calculate an inverse Mills ratio using the estimated parameters of
the first stage probit regression of the insurance decision. This ratio captures the part of
the unexplained variation vi that is correlated with sample selectivity. We then include
the inverse Mills ratio as an additional explanatory variable in a second stage regression
estimating the average impact of insurance on consumption and asset smoothing. If the
estimated coefficient for the inverse Mills ratio is different from zero, then we should be
concerned about selection bias. Columns (1) and (4) of Table 5 show the average impacts
using the Heckman correction method. The results are similar to our earlier findings, and
remain highly statistically significant. The inverse Mills ratio is not statistically significant,
indicating that selection bias may be less of a problem than we might otherwise worry about.
Another potentially useful approach is to use matching methods. This approach requires
an assumption that unobserved factors do not affect participation. If we can control for
all the factors that affect participation, then matching provides consistent estimates of the
impact of insurance. Matching estimates are obtained by finding a pair of households who
appear similar (based on observed characteristics), with one household purchasing insurance
while the other did not. The estimated impact of insurance is obtained by taking the average
difference in outcomes between pairs. A number of matching methods exist. Columns (2)
and (5) of Table 5 present the results for nearest neighbor matching in which households
are matched based on wealth, livestock holdings, ethnicity and location. This is a practical
approach since ethnicity and location are important in defining a household’s identity in this
region. The results are similar and remain highly statistically significant.
A primary limitation of our study is that it relies on household expectations about the
future. There is no way we can improve upon this limitation in the data. Nonetheless, expec-
32

tations could be largely dependent on how an enumerator framed the questions. For example,
we might be concerned about the following: Did some enumerators ask the questions about
coping strategies in a way that encouraged a dramatic response by insured households? In
many instances, the enumerator was the person who informed the insured household that
a payout was to be made, and the amount the household should expect to receive. For
this reason we test whether our results, based on expectations, are sensitive to enumerator
effects. This method isn’t perfect: there is a strong correlation between the enumerator
and the household’s location and ethnicity, mainly due to language and cultural barriers.3
For this reason, we are only able to estimate the average impact on ex post consumption
and asset smoothing behaviors using enumerator fixed effects in place of location and ethnic
fixed effects, and even so the model appears to suffer from multicollinearity such that the
coefficients should be treated with caution. Nonetheless, these estimates are reported in
Table 5 as well. We find that including enumerator fixed effects does not substantially alter
our results regarding the impact of insurance on asset protection, but it does substantially
increase the explanatory power. However, the estimate of the insurance impact on household
consumption (Impact #2) is much smaller and becomes insignificant when enumerator fixed
effects replace location and ethnicity fixed effects.
However, if we are worried that the expectations are in some way invalid because they
are driven by framing effects, then our best robustness check is actually presented as part of
our main results. It is very unlikely that we would observe distinct threshold-disaggregated
behavioral responses if the responses were truly driven by framing effects. Because these
empirical results match our expectations from theory, we have great confidence that the
anticipated behaviors are informative.
3Enumerators, who could usually speak only 1 or 2 local dialects, were divided into 5 teams for the surveyimplementation. Each team was sent to a different region with certain cultural and language characteristics.
33

Table 5: Estimated Ex Post Impacts Using Alternative Methods
Impact #1 Impact #2Sell Livestock Reduce Meals
(1) (2) (3) (4) (5) (6)
Heckman Nearest Enumerator Heckman Nearest Enumerator
Correction Neighbor Fixed Correction Neighbor Fixed
Method Matching Effects Method Matching Effects
insured -0.268*** -0.374***(0.063) (0.064)
Inverse Mills Ratio 0.229 -0.187(0.325) (0.228)
ATE (Matching) -0.306*** -0.371***(0.052) (0.064)
insured -0.395*** -0.094(0.139) (0.097)
Years of education (head) -0.001 -0.003 0.000 0.008(0.007) (0.006) (0.008) (0.007)
Risk-taking 0.036 0.050* -0.075** -0.043(0.036) (0.026) (0.034) (0.040)
Risk-moderate -0.013 0.027 -0.012 -0.026(0.029) (0.038) (0.050) (0.052)
Non-livestock asset index 0.014 0.011 -0.058* -0.075**(0.018) (0.018) (0.027) (0.031)
TLU Owned 0.006*** 0.006*** 0.000 -0.001(0.001) (0.002) (0.001) (0.001)
TLU losses in past year 0.003 0.004* -0.003** -0.003(0.002) (0.002) (0.001) (0.002)
Expected TLU losses -0.004* 0.003 0.003 0.001(0.002) (0.003) (0.003) (0.004)
Credit Constrained 0.029 -0.010 0.057 0.016(0.074) (0.038) (0.063) (0.050)
Ethnicity fixed effects yes - no yes - noLocation fixed effects yes - no yes - noEnumerator fixed effects no - yes no - yes
Observations 662 673 642 662 673 642R2 0.215 - 0.360 0.251 - 0.368
Robust standard errors in parentheses
*** p<0.01, ** p<0.05, * p<0.1
34


![Consumption Smoothing among Wor [PFP#691868222]Title: Consumption Smoothing among Wor [PFP#691868222] Created Date: 6/29/1999 4:54:00 PM](https://static.fdocuments.net/doc/165x107/6106948eba8c157f0556264c/consumption-smoothing-among-wor-pfp691868222-title-consumption-smoothing-among.jpg)