The Impact of ICT on Economic Sectors - EconStor
12
econstor Make Your Publications Visible. A Service of zbw Leibniz-Informationszentrum Wirtschaft Leibniz Information Centre for Economics Sasvari, Peter Article The Impact of ICT on Economic Sectors International Journal of Computer Information Systems Suggested Citation: Sasvari, Peter (2011) : The Impact of ICT on Economic Sectors, International Journal of Computer Information Systems, Silicon Valley Publishing, s.l., Vol. 3, Iss. 4, pp. 7-17, http://www.svpublishers.co.uk/ijcis-oct-2011/4557969965 This Version is available at: http://hdl.handle.net/10419/76702 Standard-Nutzungsbedingungen: Die Dokumente auf EconStor dürfen zu eigenen wissenschaftlichen Zwecken und zum Privatgebrauch gespeichert und kopiert werden. Sie dürfen die Dokumente nicht für öffentliche oder kommerzielle Zwecke vervielfältigen, öffentlich ausstellen, öffentlich zugänglich machen, vertreiben oder anderweitig nutzen. Sofern die Verfasser die Dokumente unter Open-Content-Lizenzen (insbesondere CC-Lizenzen) zur Verfügung gestellt haben sollten, gelten abweichend von diesen Nutzungsbedingungen die in der dort genannten Lizenz gewährten Nutzungsrechte. Terms of use: Documents in EconStor may be saved and copied for your personal and scholarly purposes. You are not to copy documents for public or commercial purposes, to exhibit the documents publicly, to make them publicly available on the internet, or to distribute or otherwise use the documents in public. If the documents have been made available under an Open Content Licence (especially Creative Commons Licences), you may exercise further usage rights as specified in the indicated licence. www.econstor.eu
Transcript of The Impact of ICT on Economic Sectors - EconStor

econstorMake Your Publications Visible.
A Service of
zbwLeibniz-InformationszentrumWirtschaftLeibniz Information Centrefor Economics
Sasvari, Peter
Article
The Impact of ICT on Economic Sectors
International Journal of Computer Information Systems
Suggested Citation: Sasvari, Peter (2011) : The Impact of ICT on Economic Sectors,International Journal of Computer Information Systems, Silicon Valley Publishing, s.l., Vol. 3,Iss. 4, pp. 7-17,http://www.svpublishers.co.uk/ijcis-oct-2011/4557969965
This Version is available at:http://hdl.handle.net/10419/76702
Standard-Nutzungsbedingungen:
Die Dokumente auf EconStor dürfen zu eigenen wissenschaftlichenZwecken und zum Privatgebrauch gespeichert und kopiert werden.
Sie dürfen die Dokumente nicht für öffentliche oder kommerzielleZwecke vervielfältigen, öffentlich ausstellen, öffentlich zugänglichmachen, vertreiben oder anderweitig nutzen.
Sofern die Verfasser die Dokumente unter Open-Content-Lizenzen(insbesondere CC-Lizenzen) zur Verfügung gestellt haben sollten,gelten abweichend von diesen Nutzungsbedingungen die in der dortgenannten Lizenz gewährten Nutzungsrechte.
Terms of use:
Documents in EconStor may be saved and copied for yourpersonal and scholarly purposes.
You are not to copy documents for public or commercialpurposes, to exhibit the documents publicly, to make thempublicly available on the internet, or to distribute or otherwiseuse the documents in public.
If the documents have been made available under an OpenContent Licence (especially Creative Commons Licences), youmay exercise further usage rights as specified in the indicatedlicence.
www.econstor.eu

International Journal of Computer Information Systems,
Vol. 3, No. 4, 2011
The Impact of ICT on Economic Sectors
Peter Sasvari
Institute of Business Sciences, Faculty of Economics
University of Miskolc
Miskolc, Hungary
Abstract— As the author could not find a reassuring
mathematical and statistical method in the literature for
studying the effect of information communication technology
on enterprises, the author suggested a new research and
analysis method that he also used to study the Hungarian
economic sectors. The question of what factors have an effect
on their net income is vital for enterprises. The highest
increment of specific Gross Value Added was produced by the
fields of ‘Manufacturing’, ‘Electricity, gas and water supply’,
‘Transport, storage and communication’ and ‘Financial
intermediation’. With the exception of ‘Electricity, gas and
water supply’, the other economic sectors belong to the group
of underdeveloped branches (below 50%).
On the other hand, ‘Construction’, ‘Health and social work’
and ‘Hotels and restaurants’ can be seen as laggards, so they
got into the lower left part of the coordinate system.
‘Agriculture, hunting and forestry’ can also be classified as a
laggard economic sector, but as the effect of the compound
indicator on the increment of Gross Value Added was less
significant, it can be found in the upper left part of the
coordinate system. Drawing a trend line on the points, it can be
made clear that it shows a positive gradient, that is, the higher
the usage of ICT devices, the higher improvement can be
detected in the specific Gross Value Added.
Keywords- Information society, ICT, Economic sector, Electronic
marketplace.
I. INTRODUCTION
The current age is often referred to as the Information Age. This concept was first introduced by Manuel Castells, the best-known theoretician of the information society [1]. The information society is a new, special variant of the existing societies in which producing, processing and distributing information can be regarded as a fundamental source in the economy.
Several theories can be found in the literature on the definition of the information society.
The approach of civilization theory [12] [13] [14] [15] examines the whole social history, so the information society is the result of a thinking process in this context and not the actual subject of it.
In the evolution theory context [16], questions of the transformation of social subsystems, the new economic, social and community phenomena, the recognition of the
new generation of the digital era, the peculiarities of the media environment, the power and communication patterns of the new world order and the rise of cyber science are dealt with in a highly abstract manner. The vast majority of studies on the information society was published by authors [17] [18] [19] [20] who examine small pieces of reality for practical reasons while they search for answers to the challenges in their own discipline.
Based on the neoclassical model of economic growth [21], it is understandable how the accumulation of capital and technological change affects the economy. The model has a fundamental role in understanding growth in the developed countries and it also can be used for the empirical study of resources of the current economic growth. The theory of economic growth examines those factors that generate the growth of potential output in the long term. Reviewing the temporal and spatial experiences of different countries show that this can be examined by four factors:
• the quantity and quality of labour force;
• the abundance of land and other natural resources;
• the accumulated capital;
• technological change and innovation.
In the case of examining growth as a process, researchers put an emphasis on the necessity of increasing capital intensity. This is supported by the computerization or the introduction of ICT devices in the banking sector.
Endogenous growth theory [22] tries to focus on the sources of technological change in its studies on economic growth.
Technological determinism [23] sees technology as the main motivating force in society, which decisively determines the values, the structure, the history and the changes of the society.
The theory of social construction of technology (it is also referred as SCOT) evolved in the 1980s argues that technology does not determine human action, but that rather, human action shapes technology. It also argues that the ways in which a technology is used cannot be understood without understanding how that technology is embedded in its social context.
Another important and more widely used theory is actor-network theory (ANT). It tries to explain how material-
The described work was carried out as part of the TÁMOP-4.2.1.B-
10/2/KONV-2010-0001 project in the framework of the New Hungarian
Development Plan. The realization of this project is supported by the
European Union, co-financed by the European Social Fund. October Issue Page 7 of 89 ISSN 2229 5208

International Journal of Computer Information Systems,
Vol. 3, No. 4, 2011 semiotic networks come together to act as a whole. As a part of this it may look at explicit strategies for relating different elements together into a network so that they form an apparently coherent whole. According to this theory, such actor-networks are potentially transient, existing in a constant making and re-making. This means that relations need to be repeatedly 'performed' or the network will dissolve. The elements of networks can be human and non-human as well: objects, techniques, institutions, organizational solutions or cognitive structures.
ICT can be regarded as a universal technological system, which is closely linked to all of the previous systems and creates new, more complex technological systems. ICT’s characterizing function is to assure acquiring, storing, processing, delivering, distributing, handling, controlling, transforming, retrieving and using information.
Based on the considerations presented above, it is not the subject of my examination to answer whether there is a need for ICT or creating the necessary conditions for the information society. The real subject is to measure what economic, social, cultural and environmental effects it has on the society. The rich literature of the information society discusses these aspects in detail. During my work, I take the information society as a normative future plan for Hungary, and I am looking for the answer of what progress has been made in building the information society in the Hungarian economic sectors. I examine the following issues:
• to what extent we can speak about the information society in Hungary nowadays,
• what is the development level of the information society in several economic sectors and company sizes compared to each other and to the member states of the European Union,
• how this development level can be measured and calculated,
• how the development level of information and communication technology increases at certain company sizes,
• what trends can be observed in the development process in the individual economic sectors and company sizes.
My examination extends to the static, momentary state (1) of the development level of ICT devices used in the economic sectors as well as to their dynamic analysis, (2) expected pace of growth (3) and their qualification. As far as I know, such comprehensive analytical study on the information society has not been written neither in Hungary, nor in the European Union.
I determined the priorities of my research while I was studying the literature about the subject, as I had to decide whether the theoretical components or the practical realization of my study based on that theoretical background should be more emphatic. In the end, the letter proved to be more important. On the one hand, the reason for this is because I was able to get a satisfactory starting point from
the literature to connect the theoretical background with a practice-oriented problem handling. On the other hand, my subject choice also contributed to the practical side, as the question of the information society is raised from a very practical aspect in reality. It is supported by the vast amount of documents in the literature urging to create the information society.
When establishing the aims of the research, there is always the question of how to position the individual parts of the subject. Should they be positioned in a broader subject or should they be selected for further and deeper examination? The former possibility means that we aim to make suggestions by putting the practical analysis into a broader structure. The aim of my research is exactly this, as the information society means a stage representing a new quality, and the changes of the information and communication technology can be observed in every part of our life nowadays. My study may give help to the structural reform as well.
The other cause of handling the problem in a comprehensive way is that I perform my research work in a framework provided by a university where there is an increased need for thinking in more complex structures. This approach may be helpful in handling the subject in a broader context. Such a comprehensive structure makes it possible to examine the problems of the development of the information society and analyse them from the desired aspects.
II. THE METHOD OF THE RESEARCH
The examination of the subject is interdisciplinary as it has social and scientific references, so a complex approach was needed when I started processing the literature. I needed to study literature on economics, law, sociology and technology connected to the information society.
In consideration of the complexity of the studied subject, I selected several analytical methods and approaches. During the data collection, I reclined upon the Hungarian and the international literature on the subject, thus I was able to process a large quantity of information (nearly 6000 figures). I also extended my literature research to printed and electronic publications on the Internet. As part of my research, I conducted an empirical survey among Hungarian companies and enterprises. The questionnaire was mainly answered by senior directors of the related companies (executive directors, Human Resources managers etc.), in the case of sole proprietorship, sole proprietors themselves as self-employed persons gave the answers to the questions. The questionnaire was filled in by 536 respondents altogether. Sampling unit: Hungarian enterprises operating in several economic sectors. Sampling method: accidental sampling. Applied methods: I used the functions, the cross tables and the chart wizard of Microsoft Excel as well as the cluster analysis, correlation and regression calculation, multiple regression models, discrimination analysis and a customized indicator system in SPSS 16.0.
October Issue Page 8 of 89 ISSN 2229 5208

International Journal of Computer Information Systems,
Vol. 3, No. 4, 2011
A. The chapters of the questionnaire
My primary research – which is actually a cross section survey – deals with the amount and the utilization of ICT devices of different enterprises in several economic sectors in 2008 and 2009.
As Fig. 1 shows, I observed those economic organizations operating in 2008 that were chosen by the method of accidental sampling. I analysed the rate of using ICT devices quantitatively, by using a questionnaire comprising 7 blocks. Part of the questions were easily answerable, aiming at such qualititative indicators as utilization, the other part of them contains quantitative indicators linked to balance sheets.
5th blokk
Backgound
information6th block
Costs and assets of
using information
services in 2006
7th block
Data on the employed
Technical dataData on human
resourcesOther dataLayer-making data
4th block
Demand for IT expertise
And qualifications
1st block
Using information
technologies
2nd block
Internet usage
3rd block
E-commerce on the
internet
4th block
Demand for IT expertise
and qualifications
2006
Year
1st block
Using information
technologies
2nd block
Internet usage
3rd block
E-commerce on the
internet
2007
Figure 1. The structural synthesis of the primary questionnaire used in the
research
B. Study model
I did not study the information and communication sector separately, which gives the foundation of the information society, I examined its diffusional effects instead. I assumed that the adoptation of ICT devices was taking place in a different way in different economic sectors.
As Fig. 3 shows, the literature on the development of ICT distinguishes five development stages. These stages are built upon each other. With the help of the elaborated model, I measured the individual development stages. By averaging the data of the first three development stages, I examined the enterprises’ willingness for adoptation.
With the help of an own model, which comprises nine elements, I analysed the development and growth of the size categories and economic sectors.
Its steps are as follows:
1) Processing the data of the primary and secondary
research Processing research data in this case means the
calculation of the value of single indicators. For instance, the rate of using emails belongs to them. At first, I calculated the value of single indicators correlated to the year 2006. When it was possible, I used secondary data, otherwise I reclined upon primary data. Then, I calculated the rate of growth in accordance with the base year.
2) Assigning single indicators to individual development I grouped the part of the processed single indicators –
there were 80 single indicators per questionnaire – and I assigned them to the individual development stages. The table below shows the single indicators belonging to the development stages:
TABLE I. GROUPING OF SIMPLE INDICATORS USED FOR THE
CALCULATION OF POTENTIAL INDICATORS
Development stage
(Potential indicator) Simple indicators
0. EDI network, closed
and cannot be scaled
(rate of EDI)
Rate of using EDI.
1. Electronic presence
(rate of electronic
presence)
Rate of enterprises having websites, rate of
displaying information on products and services
(product catalogues, price and service lists).
2. Interaction/dialogue
(rate of
interaction/dialogue)
Rate of using e-mail services, rate of finding
information on the Internet, rate of using internet
banking and financial services, rate of using electronic
taxation, rate of placing advertisements and using
marketing on the Internet, rate of using market
observation on the internet, rate of providing
information on products and services (product
catalogues, service and price lists), rate of using
education and/or training (access to interactive training
materials), rate of access to internet-based after-sales
services, rate of purchasing digital products.
3. Transaction
(rate of transaction)
Rate of purchasing products and services (on the
Internet), rate of selling products and services (on
the Internet), rate of providing tailor-made services
for regular customers, rate of providing online
digital services and products, rate of providing an
opportunity for making online payments, rate of
providing mobile internet access, rate of providing
opportunities for performing security transactions.
4. Electronic markets
(indirect research)
(rate of electronic
markets)
Rate of follow-up orders, rate of invoicing and
payment systems, rate of production, logistics and/or
service systems, rate of purchasing systems, rate of
selling systems, rate of other computer systems, rate
of digital signatures.
5. Compound nodes
(rate of compound
nodes)
-
3) Calculating the values of potential indicators from
single indicators I used the single indicators to calculate the value of the
potential indicators. I determined the values of these indicators by arithmetic averaging. The potential indicator shows the permeation and the pace of growth of a given development stage in the studied economic sectors between 2008 and 2009.
4) Studying potential indicators I listed the potential indicators into quality categories in
each economic sector.
TABLE II. THE QUALITATIVE CATEGORIES OF ANALYSING POTENTIAL
INDICATORS
Growth (in percentage)
below 6% below 6%
Penetration
(in
percentage)
below
50%
Underdeveloped,
slow
Underdeveloped,
fast
above
50%
Developed, slow Developed, slow
October Issue Page 9 of 89 ISSN 2229 5208

International Journal of Computer Information Systems,
Vol. 3, No. 4, 2011
5) Determining potential indicators at the individual
development stages Using the method shown above, I perfomed the quality
categorization of all development stages in each and every economic sector, then I illustrated the given results with the help of a bubble diagram.
6) Calculating the values of compound indicators by
using potential indicators I created a new compound indicator by the arithmetic
averaging of the values of the potential indicators (1. the rate of electronic presence, 2. the rate of interaction or dialogue, 3. the rate of transaction)
7) Studying compound indicators I calculated the values of the compound indicators for all
economic sectors. I assumed that the integrated indicators determined more paces of adoptation with various speed. Based on this assumption, I defined three different paces of adoptation:
• Fast adoptation (fast pace of growth – 6%-12% -, annual rate of growth may reach 12%);
• Average adoptation (average pace of growth –3%-6% -, maximum annual rate of growth is 6%);
• Slow adoptation (slow pace of growth – 0%-3%-, maximum annual rate of growth is 3%).
I showed the values of the compound indicators in accordance with the pace of growth and the extent of the pace of adoptation.
8) Defining the categories of adoptation In order to evaluate the newly joined enterprises, I
borrowed quality categories from the literature.
TABLE III. JUDGEMENT OF FRESHLY JOINING ENTERPRISES BASED ON
THE INDICATORS
Adaptation
category
Inno-
vator
Early
adapters
Early
majority
Late
majority
Lag-
gards
Compound
indicator
value in
percentage
0-2.5 2.5-16 16-50 50-84 84-
9) Conclusions on the pace of growth and the general
state of an economic sector Some conclusions can be drawn from the pace of
adoptation of the examined economic sectors – provided that the environmental conditions were constant – on how fast they can reach the category of developed (above 50%) sectors and on what category the newly-joined enterprises are in.
4. Research
data
1. Area
2. Dimension
Levels of
researchMeasures
4. Simple
indicators
1. Pace of
adaptation
2.
Compound
indicators
Qualitive categories
2. Fast, average, slow
pace of adaptation
4. Developed/
underdeveloped
1. Innovators, early adapters, early
majority, late majority, laggards
Displaying methods
2. Adaptation curves
4. -
1. -
3. Subdimension3. Potential
indicators
3. Developed/
underdeveloped and fast/
slow growth categories
3. Bubble diagrams
Figure 2. Levels of research methods
This also helps to draw conclusions on the state, the development level, the growth of ICT usage in the studied economic sectors as well as the information society of the country.
III. THE NEW AND UNCONVENTIONAL RESULTS OF THE
RESEARCH
The use of ICT has its own role in every economic sector and in every company regardless of its size, but it has a diverse influence in various sectors. That’s why an application method is needed for the economy and its participants. For example, the manufacturing industry is highly dependent on information on the procurement and sales side, so this economic sector is most likely to create values here with the help of ICT at the initial stage. ICT, however, can be used to create values in almost every part of the value chain for companies dealing with financial intermediation, since information flow is always present in the value chain.
Although the most frequent functions for the average users of the Internet are still searching for information and e-mailing, new solutions benefiting from the advantages of the cyberspace have started spreading recently. These can help small and medium-sized enterprises in more efficient administration, production, management, cooperation, selling and purchasing, marketing communication, keeping clients and realizing higher profits.
The use of technology hasn’t been really unusual for commercial companies. It is quite natural that mobile phones and personal computers have become parts of any commercial activities. At the outset, they performed simpler and limited tasks but later computer manufacturers and software developers, together with telecommunication companies hammered out more complex systems such as product turnover tracking and storage systems in the hope of new business opportunities. A new, essential element, the network was needed for the operation and development of these systems.
The simple indicators of e-commerce are defined in different ways in various studies and surveys but they have some common denominators that appear in almost every definition. These are the data related to personal computers, mobile phones, wired and wireless telecommunication systems. Irrespectively to the size of companies, the penetration of mobile phones is above 90%. The single
October Issue Page 10 of 89 ISSN 2229 5208

International Journal of Computer Information Systems,
Vol. 3, No. 4, 2011 indicator of microenterprises is 12% lower (86%) in the case of personal computers than that of the medium-sized companies. Based on the data from sector distribution, it can be found that the penetration of mobile phones reached 100% in the field of ‘Electricity, gas and water supply’, ‘Mining and quarrying’, ‘Manufacturing’, Real estate, renting and business activities. It is around 83% in the ‘Health and social work’ sector, in the other sectors it reached an average level. In six sectors of the surveyed 15 – namely ‘Electricity, gas and water supply’, ‘Mining and quarrying’, ‘Hotels and restaurants’, ‘Real estate, renting and business activities’, ‘Public administration and defence’, ‘Compulsory social security’, ‘Health and social work’ – the penetration reached its fullest. The lowest penetration was observed in the ‘Hotels and restaurants’ sector, reaching only 68%, the remaining economic sectors were around the average.
The infrastructural background of e-commerce is established for Hungarian corporations, small and medium-sized companies but the same cannot be said in the case of microenterprises. 48% of the Hungarian microenterprises have local wired network which is 20% lower than the national average. The penetration of the same network is 70% among small and medium-sized companies, while 94% of bigger companies and institutions have local wired networks. If we study the penetration of wired communication in various economic sectors, we can find that it is 100% in the case of Electricity, gas and water supply, which is higher above the average by 30%. ‘Mining and quarrying’, ‘Public administration and defence’, ‘Compulsory social security’ are also above the national average by 85 and 81%, ‘Agriculture, hunting and forestry’ and ‘Other community, social and personal service activities’ are below the average (44 and 57%) the rest of the sectors shows signs of average penetration. In an international comparison, corporations and ‘Electricity, gas and water supply’ were around the average but the remaining studied sectors were below the average, ranked only in the 24th place in the European Union.
Studying the following single indicators can give an answer to the question of what existing information and communication technology is used by enterprises:
reordering systems (stockpiling);
invoicing and payment systems;
production, logistics and/or service systems;
purchasing systems;
sales systems;
other computer systems.
Using electronic invoicing systems showed the greatest penetration among companies, reaching the average of 46%. All single indicators showed higher levels above the average in the case of large companies and public institutions (17-25% higher than the average). Microenterprises weren’t able to reach the average levels: four indicators showed a level around 10% (reordering systems 9%, purchasing systems
8%, production, logistics and/or service systems 12%, other computer systems10.5%.), one indicator was lower than the average by 5% (sales systems 3.5%), and the remaining indicator was higher than the average with 25% (invoicing systems 27.5%). Transport, storage and communication, Electricity, gas and water supply were above the average, Agriculture, hunting and forestry; Public administration and defence, Compulsory social security; and Education were below the average regarding all indicators.
Electronic markets, trade links between business partners need a completely new way of thinking and organizations, while changing and putting the customary production, sales, ordering, purchasing, financial and administration processes on new grounds. The automatization of supply chain processes makes commerce cheaper, faster, simpler and more efficient. Using ICT solutions, savings can be achieved in transaction costs. Thus, the accumulation of capital and tangible assets can be avoided so companies are able to optimize their inventories and they can reduce the time needed for supplying the market. Taking everything into consideration, a new question can arises: what steps or stages are followed by companies to acquire more developed business models, electronic markets, for instance? In the table below, I present five development stages that can be observed in the relationship between the Internet and several enterprises.
I
E
E
EE
I
I
I
M
E
E
E
I
I
I
M
I
E
I
M
EI E
M
I
E
E
timeline
EIM
enterpriseindividualelectronic
marketplace
EDI network, closed and
cannot be scaled
1. Electronic
presence
2. Stage of
Interaction/dialogue
3. Stage of
transaction
4. Electronic
marketplaces
5. Compound
nodes
Figure 3. The development stages of information and communication
technology [2]
The individual stages don’t only show a development in the timeline but also the extent of exploiting the opportunities provided by the Internet.
The first stage can be defined as „electronic presence”, when companies solely use the Internet for reaching their marketing goals. They make their own websites where visitors can find some important information on the company, its products and services (product catalogues, services and price lists). They put job offers and product advertisements onto their own sites and onto the banners of other websites as well, thus expoiting the Internet as a new channel of advertisement and reducing the time being spent by users searching for information on a given product.
Companies tend to use this electronic channel for a one-way communication. Studying by company size categories and economic activities, it can be observed that corporations and small and medium-sized companies as well as the fields
October Issue Page 11 of 89 ISSN 2229 5208

International Journal of Computer Information Systems,
Vol. 3, No. 4, 2011 of ‘Transport, storage and communication’; ‘Financial intermediation’; ‘Electricity, gas and water supply’, ‘Manufacturing’, ‘Wholesale and retail trade’ and ‘Real estate, renting and business activities’ are well-developed. Construction proved to be an underdeveloped but rapidly expanding sector. ‘Agriculture, hunting and forestry’; ‘Education’, and ‘Other community, social and personal service activities’ are definitely underdeveloped and their expansion is considerably slow.
A
C
DE
F
G
H
I
J
M
N
O
Avg
0%
2%
4%
6%
8%
10%
12%
0% 10% 20% 30% 40% 50% 60% 70% 80% 90% 100%
Gro
wth
of t
he
po
ten
tial
ind
icat
ors
of e
lect
roni
c p
rese
nce
in H
un
gary
fro
m 2
008
to 2
009
Values of the potential indicators of electronic presence in Hungary in 2008
Underdeveloped, slow
Underdeveloped, fast
Developed, slow
Developed, fast
Figure 4. The potential indicators of electronic presence in economic
sectors1
In the second stage – which is called the stage of interaction or dialogue – electronic channels are used for cooperation by companies as a means of a two-way communication. The company maintains a two-way communication with its clients, suppliers and partners: receiving and sending e-mails, searching or asking for information, using banking services, conducting electronic taxation, interactive education and training, advertising or performing other marketing tasks, interactive market appraisal, requesting and sending information on products and services, providing after-sales services, purchasing digital products. Microenterprises belong to the category of underdeveloped and fast companies, while corporations, small and medium-sized companies belong to the category of developed and slow. If we investigate the fields divided by activities, we can see that only Agriculture, hunting and forestry belongs to the category of underdeveloped and slow sectors. (True, the penetration is also high even in this category.) In the category of underdeveloped, rapidly
1 A=Agriculture, hunting and forestry, C=Mining and
quarrying, D=Manufacturing, E=Electricity, gas and water supply, F=Construction, G=Wholesale and retail trade; repair work, H=Hotels and restaurants, I= Transport, storage and communication, J=Financial intermediation, K=Real estate, renting and business activities, M=Education, N=Health and social work, O=Other community, social and personal service activities.
expanding sectors ‘Health and social work’; ‘Construction’; and ‘Hotels and restaurants’ are present. ‘Real estate, renting and business activities’ produces high scores both at the level of its expansion and its penetration.
In the next step, companies start using and advertising their web pages as a sales and trading channel. Products and services marketed on the Internet can also be ordered online, the company has the chance of latching on to the e-commerce system by purchasing and selling products and services, customizing its web page for its frequent or regular customers, purchasing online digital products, making it possible to pay online, providing internet connection through mobile phones, providing platforms for safe financial transactions etc. Because at this level of business applications no third party can be found in the trading process, this is the stage of transaction or partnership. With the exception of ‘Health and social work’, and the category of microenterprises, the expansion of all the other sectors is low, only ‘Financial intermediation’ and ‘Transport, storage and communication’ showed a 20% higher penetration, along with the category of corporations.
The fourth stage of e-commerce between companies is evolving nowadays. At this stage, partners are linked to each other and organized into communities (Community Commerce) by a third party or mediator. This mediators is called e-marketplace, which eliminates the majority of traditional middlemen and brokers from the transaction and plays a huge role in coordinating and serving business partners as well as supporting several business processes. The advantage of this form of transaction is the ability to integrate a large number of potential business partners. Enterprises head for acquiring a trading model based on cooperation and partnership. System approach is inevitable for cooperation, therefore those companies are ready to accept this new technology that introduced reordering systems (stockpiling), invoicing and payment systems, production, logistics and/or service systems, purchasing systems, sales systems, other computer systems and digital signature. Nevertheless, we need to emphasize that – as it is a new, evolving technology – it was only possible to measure the existence of the necessary conditions for introducing and using it. In this regard, all studied sectors proved to be underdeveloped. The penetration of this new technology was below 40% in the field of ‘Electricity, gas and water supply’, ‘Transportation, storage and communication’ and ‘Mining and quarrying’. Regarding the company size, corporations reached a remarkable 49%. More rapid growth could only be established in the case of ‘Agriculture, hunting and forestry’, ‘Health and social work’, ‘Real estate, renting and business activities’ and ‘Other community, social and personal service activities’.
The diffusion of innovations theory defines the spread of innovations basically as a communication process, where the piece of information related to innovations spreads through certain communication channels in a given social network at a certain time. The spread of innovations, just as the spread of new information and communication technologies, happens in the so-called ’diffusion networks’. The
October Issue Page 12 of 89 ISSN 2229 5208

International Journal of Computer Information Systems,
Vol. 3, No. 4, 2011 willingness of a company to adopt a new technology depends on the cohesion of the network – or the homogeneity of the network –, and the structural equivalence which shows what position is occupied by a company in the network, and, finally, it also depends on the threshold from where it is worth starting to use a new technology.
During the analysis of the diffusion of ICT devices, the category of rejectors should also be introduced because there are some companies that deliberately stand against using new technologies. This means that the spread of a certain new technology doesn’t reach 100% in a given society, in order to reach that level, society and technology have to be transformed simultaneously.
Based on the size categories, rapid adoptation pace can be observed in the case of microenterprises. The compound indicator of microenterprises send them to the category of early majority (the same applies to small and medium-sized enterprises with a penetration half as big again and with an average adoptation pace). Corporations can be regarded as developed from the aspect of using information and communication technology. Their compound indicator is above 50%, which means that newcomers get into the category of late majority. The growth of the compound indicator is 1%, which shows a slow adoptation pace.
If we take the penetration and growth of the development stages in the economic sectors into consideration, rapid adaptation pace could be established in four of them. The compound indicator of these four sectors is higher than 16% and lower than 50%, so every newcomer belongs to the category of early adapters. The growth measured in the ‘Health and social work’ sector was the fastest with 7.4% but its range was the smallest – with only 26.3% – among the studied sectors. It is followed by the sectors ‘Construction’ (27.1%), ‘Hotels and restaurants’ (32.8%), ‘Real estate, renting and business activities’ (37.2%).
Five economic sectors can be found in the average adaptation category compared to the national average. Every one of them is at an underdeveloped stage. The compound indicator of the 'Transport, storage and communication' sector is the highest with 49.7%. If its pace of growth remains at 3.7%, it will get into the category of developed sectors in the following year. The sectors ‘Agriculture, hunting and forestry’ (25.9%), ‘Other community, social and personal service activities’ (31.6%), ‘Wholesale and retail trade’ (36.3%) and ‘Manufacturing’ (42.2%) all belong to the average adoptation category.
Me
asu
re o
f co
mp
ou
nd
in
dic
ato
rs
2,5%
16%
84%
100%
50%
C
J
time
innovators
early adapters
early majority
late majority
laggards
K
F
N
H
I
D
Avg
G
O
A
E
M
Figure 5. Grouping economic activities based on development stages
Five economic sectors can be categorized as slow adapters. The compound indicator of the ‘Electricty, gas and water supply’ sector exceeds 46.9%. The smallest penetration rate was produced by the ‘Education’ sector with 35.2%. The sectors ‘Financial intermediation’ (44.4%) and ‘Mining and quarrying’ (43%) can be seen as definitely underdeveloped. The lowest growth of penetration was shown by ‘Electricity, gas and water supply’ with 0.3%.
The larger number of corporations in the sectors of ‘Electricity, gas and water supply’, ‘Transport, storage and communication’ and ‘Financial intermediation’ may help to accelerate modernization and improve the quality of service provided to other economic organizations, as these relatively powerful companies have all the conditions necessary to introduce cutting-edge information and communication technology. This unique resource, namely technology may provide stable protection to its holder, which can get competitive edge over its competitors, in extreme cases – as it is seen in the case of ‘Electricity, gas and water supply’ – the companies may find themselves in a monopolistic state.
‘Transport, storage and communication’; ‘Financial intermediation’ are characterized by dinamically changing processes, the value created by ICT devices may evaporate quckly. Stable competitive edge can only be gained by the ability of continuous development and renewal.
The availability of personal computers and mobile phones reached the highest level in the field of ‘Electricity, gas and water supply’ among the studied sectors (the second highest level was shown by ‘Financial intermediation’ and the third was ‘Transport, storage and communication’.)
The penetration of local area networks was the most significant in the field of ‘Financial intermediation’ with 84% (the second most frequent usage was detected in ‘Electricity, gas and water supply’, the third was ‘Transportation, storage and communication’).
The frequency of Internet access is 97% in the field of ‘Financial intermediation’, which is followed by ‘Electricity, gas and water supply’ with 94%. ‘Transportation, storage and communication’ is only in the fourth place with 83%, right after ‘Mining and quarrying’.
October Issue Page 13 of 89 ISSN 2229 5208

International Journal of Computer Information Systems,
Vol. 3, No. 4, 2011 The aim of using ICT is searching for information and
sending and receiving e-mails in all three sectors.
Banking and financial services are most frequently used in ‘Transportation, storage and communication’, while they are converged to the national average in the field of ‘Electricity, gas and water supply’. The penetration of banking and financial services are well below the average in ‘Financial intermediation’.
The ICT is most frequently used for market observation in the field of ‘Financial intermediation’, in the field of ‘Transport, storage and communication’ this service is used at an average frequency, while this technique is only used only by the quarter of enterprises in the ‘Electricity, gas and water supply’ sector.
Advertisements and marketing services were used by almost half of the enterprises in ‘Financial intermediation’, by 40% of enterprises in ‘Transportation, storage and communication’ and barely 30% in ‘Electricity, gas and water supply’.
ICT was used for purchasing and selling products and services by less than 30% of the companies studied in several economic sectors. 20% of the enterprises in the ‘Electricity, gas and water supply’ sector used the Internet to purchase and sell products and services.
The frequency rate of using the Internet for education and training was 30% in ‘Electricity, gas and water supply’, 29% in the field of ‘Financial intermediation’. The Internet was used for this purpose by one-fifth of the companies in the ‘Transport, storage and communication’ sector.
Using and maintaining websites was most frequently used in the field of ‘Electricity, gas and water supply’ with 59%, which is the highest rate among the studied economic sectors. This rate is higher than the national average and the penetration rate of the Transport, storage and communication sector by 12% but 6% lower than the average of the European Union. ‘Financial intermediation’ reached a rate 2% lower than Transport, storage and communication.
Companies usually publish information on their products and services on their websites. Enterprises in the field of ‘Financial intermediation’ presented the highest rate of frequency among the studied economic sectors with 97%. The second highest rate was shown by ‘Transport, storage and communication’. ‘Electricity, gas and water supply’ produced a rate below the national average.
Placing job advertisements on the Internet was used by 40% of the companies in the ‘Financial intermediation’ sector (with the highest rate among the Hungarian economic sectors). Using this function ‘Electricity, gas and water supply’ and ‘Transport, storage and communication’ also presented higher rates than the national average.
Online customer services were maintained and operated most frequently by companies in the ‘Electricity, gas and water supply’ sector. The rate of frequency was also higher than the national average in the fields of ‘Financial intermediation’ and ‘Transport, storage and communication’.
The rate of providing after-sales services was twice as high in the field of ‘Financial intermediation’ as the national average. It was higher than the national average by one and a half in ‘Transport, storage and communication’, but it wasn’t significant in the field of ‘Electricity, gas and water supply’.
The rate of providing online services, internet access by mobile phones, the availability of online payment and performing safe transactions was the highest in the field of ‘Financial intermediation’. ‘Electricity, gas and water supply’ and ‘Transport, storage and communication’ were not characterized by these services. The only exception was the possibility of performing safe transactions in the field of ‘Transport, storage and communication’.
The most important step of the cluster analysis is to determine the number of clusters. The data and the dendogram show that it is expedient to form two clusters based on the potential indicators. The first cluster comprises eight, while the second comprises five economic activities. As a consequence, those economic sectors belong to the first cluster that use ICT devices less frequently than the national average, while the second cluster contains those economic sectors that can be seen as developed ICT-users.
1) The development stages of the economic sectors All three studied economic sectors have a higher
penetration rate than the national average in the stage of electronic presence. The highest penetration rate was measured in the field of ‘Electricity, gas and water supply’. ‘Transport, storage and communication’ and ‘Financial intermediation’ also showed a high penetration rate at this stage. At the stage of interaction and dialogue ‘Financial intermediation’ is the most developed sector among the studied economic sectors. The second highest penetration rate was produced by ‘Electricity, gas and water supply’, ‘Transport, storage and communication’ is in the third place in this regard. All these three economic sectors can be seen as developed at this development stage. At the stage of transaction or partnership none of the studied Hungarian economic sectors are developed. Comparing these sectors to each-other, it is clear that the highest rate is shown by ‘Transport, storage and communication’ and ‘Financial intermediation’. ‘Electricity, gas and water supply’ has quite an average rate. At the stage of e-commerce, the best conditions are shown by the fields of ‘Transport, storage and communication’ and ‘Electricity, gas and water supply’. In this regard, ‘Financial intermediation’ has a penetration rate around the national average.
2) The adoptation of information and communication
technology From the aspect of the adoptation of ICT, the highest
compound indicator could be observed in the field of Transport, storage and communication. ‘Electricity, gas and water supply’ and ‘Financial intermediation’ produced relatively high rates but they still can be regarded as underdeveloped economic sectors.
October Issue Page 14 of 89 ISSN 2229 5208
International Journal of Computer Information Systems,
Vol. 3, No. 4, 2011
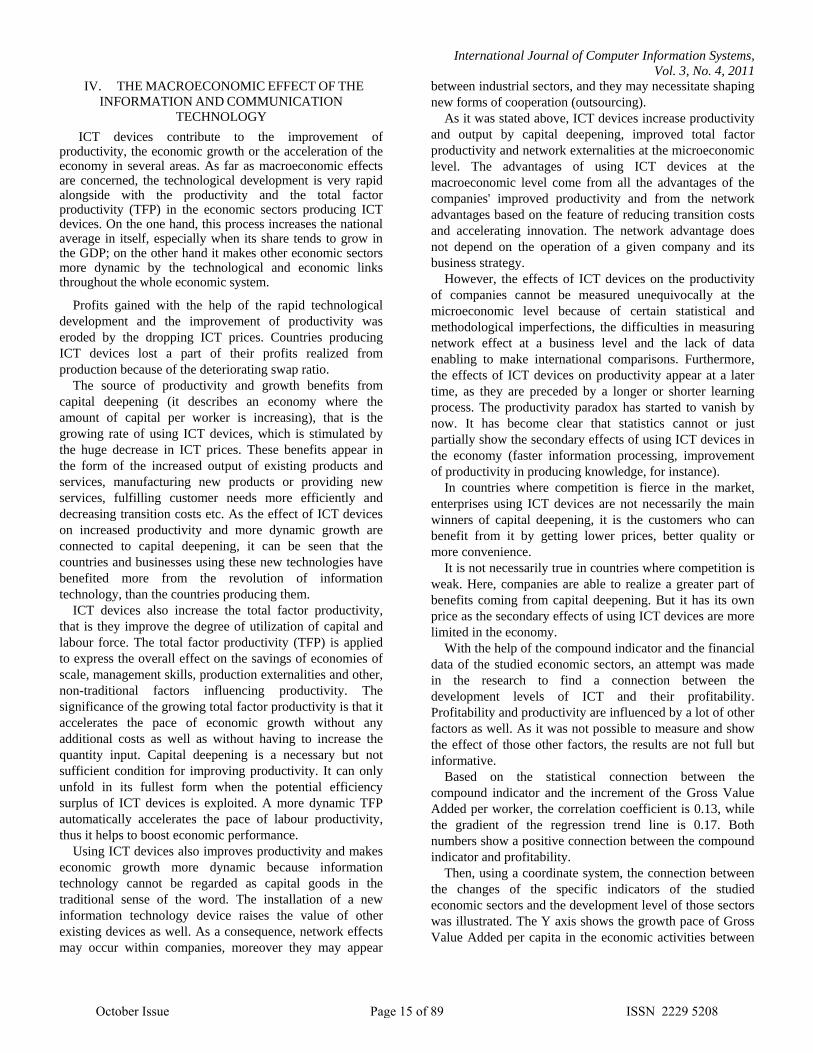
IV. THE MACROECONOMIC EFFECT OF THE
INFORMATION AND COMMUNICATION
TECHNOLOGY
ICT devices contribute to the improvement of productivity, the economic growth or the acceleration of the economy in several areas. As far as macroeconomic effects are concerned, the technological development is very rapid alongside with the productivity and the total factor productivity (TFP) in the economic sectors producing ICT devices. On the one hand, this process increases the national average in itself, especially when its share tends to grow in the GDP; on the other hand it makes other economic sectors more dynamic by the technological and economic links throughout the whole economic system.
Profits gained with the help of the rapid technological
development and the improvement of productivity was
eroded by the dropping ICT prices. Countries producing
ICT devices lost a part of their profits realized from
production because of the deteriorating swap ratio.
The source of productivity and growth benefits from
capital deepening (it describes an economy where the
amount of capital per worker is increasing), that is the
growing rate of using ICT devices, which is stimulated by
the huge decrease in ICT prices. These benefits appear in
the form of the increased output of existing products and
services, manufacturing new products or providing new
services, fulfilling customer needs more efficiently and
decreasing transition costs etc. As the effect of ICT devices
on increased productivity and more dynamic growth are
connected to capital deepening, it can be seen that the
countries and businesses using these new technologies have
benefited more from the revolution of information
technology, than the countries producing them.
ICT devices also increase the total factor productivity,
that is they improve the degree of utilization of capital and
labour force. The total factor productivity (TFP) is applied
to express the overall effect on the savings of economies of
scale, management skills, production externalities and other,
non-traditional factors influencing productivity. The
significance of the growing total factor productivity is that it
accelerates the pace of economic growth without any
additional costs as well as without having to increase the
quantity input. Capital deepening is a necessary but not
sufficient condition for improving productivity. It can only
unfold in its fullest form when the potential efficiency
surplus of ICT devices is exploited. A more dynamic TFP
automatically accelerates the pace of labour productivity,
thus it helps to boost economic performance.
Using ICT devices also improves productivity and makes
economic growth more dynamic because information
technology cannot be regarded as capital goods in the
traditional sense of the word. The installation of a new
information technology device raises the value of other
existing devices as well. As a consequence, network effects
may occur within companies, moreover they may appear
between industrial sectors, and they may necessitate shaping
new forms of cooperation (outsourcing).
As it was stated above, ICT devices increase productivity
and output by capital deepening, improved total factor
productivity and network externalities at the microeconomic
level. The advantages of using ICT devices at the
macroeconomic level come from all the advantages of the
companies' improved productivity and from the network
advantages based on the feature of reducing transition costs
and accelerating innovation. The network advantage does
not depend on the operation of a given company and its
business strategy.
However, the effects of ICT devices on the productivity
of companies cannot be measured unequivocally at the
microeconomic level because of certain statistical and
methodological imperfections, the difficulties in measuring
network effect at a business level and the lack of data
enabling to make international comparisons. Furthermore,
the effects of ICT devices on productivity appear at a later
time, as they are preceded by a longer or shorter learning
process. The productivity paradox has started to vanish by
now. It has become clear that statistics cannot or just
partially show the secondary effects of using ICT devices in
the economy (faster information processing, improvement
of productivity in producing knowledge, for instance).
In countries where competition is fierce in the market,
enterprises using ICT devices are not necessarily the main
winners of capital deepening, it is the customers who can
benefit from it by getting lower prices, better quality or
more convenience.
It is not necessarily true in countries where competition is
weak. Here, companies are able to realize a greater part of
benefits coming from capital deepening. But it has its own
price as the secondary effects of using ICT devices are more
limited in the economy.
With the help of the compound indicator and the financial
data of the studied economic sectors, an attempt was made
in the research to find a connection between the
development levels of ICT and their profitability.
Profitability and productivity are influenced by a lot of other
factors as well. As it was not possible to measure and show
the effect of those other factors, the results are not full but
informative.
Based on the statistical connection between the
compound indicator and the increment of the Gross Value
Added per worker, the correlation coefficient is 0.13, while
the gradient of the regression trend line is 0.17. Both
numbers show a positive connection between the compound
indicator and profitability.
Then, using a coordinate system, the connection between
the changes of the specific indicators of the studied
economic sectors and the development level of those sectors
was illustrated. The Y axis shows the growth pace of Gross
Value Added per capita in the economic activities between
October Issue Page 15 of 89 ISSN 2229 5208

International Journal of Computer Information Systems,
Vol. 3, No. 4, 2011
2003 and 2006. The X axis shows the compound indicator
that was created for measurement purposes. The points
defined by the two values show clearly where a given
economic sector can be found in the coordinate system,
what groups can be constituted, and what tendency can be
observed.
The highest increment of specific Gross Value Added
was produced by the sectors ‘Manufacturing’, ‘Electricity,
gas and water supply’, ‘Transport, storage and
communication’ and ‘Financial intermediation’. With the
exception of ‘Electricity, gas and water supply’, all of these
economic activities belong to the group of underdeveloped
sectors (below 50%).
High (but still not reaching the developed status)
compound indicators were shown by the sectors ‘Mining
and quarrying’ and ‘Wholesale and retail trade; repair
work’, as they produced an increment of Gross Value Added
below the average, these economic sectors can be found in
the lower right part of the coordinate system.
The sectors ‘Construction’, ‘Health and social work’ and
‘Hotels and restaurants’ can be seen as laggards, so they got
into the lower left part of the coordinate system.
The ‘Agriculture, hunting and forestry’ sector can also be
classified as a laggard economic activity, but as the effect of
the compound indicator on the increment of Gross Value
Added was less significant, it can be found in the upper left
part of the coordinate system.
Drawing a trend line on the points, it is clear that the line
shows a positive gradient, that is, the higher the usage of
ICT devices, the higher improvement can be detected in the
specific Gross Value Added.
A
C
D
E
F
G
H
I
J
K
M
N
O
Avg
95%
100%
105%
110%
115%
120%
125%
130%
135%
20% 25% 30% 35% 40% 45% 50% 55% 60%
Gro
ss v
alu
e a
dd
ed
/gro
wth
of t
he
nu
mb
er
of
em
plo
yee
s (2
00
3=
100%
)
The measure of compound indicators based on sectors
Figure 6. Connection between the growth of gross value added and the
development level of information and communication technology in several
economic activities
V. CONCLUSIONS AND SUGGESTIONS FOR THE
PRACTICAL USE OF RESEARCH FINDINGS
I could not find a reassuring mathematical and statistical method for studying the effect of the information communication technology on businesses in the literature, that is why I proposed a new research and analysis method that I also used to study the Hungarian economic sectors.
The primary possibility of utilizing the proposed method appears in situation report. I managed to measure the relative (economic sectors correlated to each other) and the absolute (economic sectors correlated to the same ones in a different country) development level of the information communication technology with the help of creating development stages, quality categories and the adoptation willingness belonging to the given development stages.
The secondary possibility for utilization lies in following patterns. The development of ICT is different in several countries, regions and economic sectors. The European Union proposed a strategic framework for its member countries. The main aims of establishing a strategic framework are:
a single European information space;
boosting investment and innovation in ICT researches;
establishing a receptive European information society.
The economy of the United States is regarded as a model economy where two-third of the employees were dealing with information process during working hours in 2000. One of the causes of the massive economic performance in the United States is the highly-developed information processing. If we manage to measure this level of development, a strategy can be formulated in the European Union and in the individual member states in order to catch up with the most developed countries.
The object of the study is generally the national economy of a given country. With the help of the method I have worked out, it is possible to analyse and assess the sections, subsections, divisions, groups and classes of a given national economy. Beside the economic sectors, company sizes and organization forms can also be studied.
REFERENCES
[1] M. Castells, The Information Age, Gondolat- Infonia, 2000.
[2] A. Kápolnai, A. Nemeslaki, R. Pataki, eBusiness stratégia vállalati felsővezetőknek, (E-business strategies for senior management), Aula, 2002.
[3] Z. L. Karvalics, Információ, társadalom, történelem, Válogatott írások, (Information, society, history, Selected works), Typotex Kiadó, 2003.
[4] Z. L. Karvalics, Információs társadalom – mi az? Egy kifejezés jelentése, története és fogalomkörnyezete, (Information Society – what is it exactly? The meaning, history and conceptual framework of an expression), Az információs társadalom, Az elmélettől a politikai gyakorlatig (The Information Society, From theory to political practice), Gondolat – Új Mandátum, Budapest, 2007, pp. 29-47
October Issue Page 16 of 89 ISSN 2229 5208

International Journal of Computer Information Systems,
Vol. 3, No. 4, 2011 [5] Deborah L. Duarte, Nancy Tennant Snyder, Mastering virtual teams:
strategies, tools, and techniques that succeed, Jossey Bass, San Francisco, 2006.
[6] Everitt, B. S., & Dunn, G., Applied multivariate data analysis, London, Edward Arnold, 1991.
[7] L. Sajtos, A. Mitev, SPSS kutatási és adatelemzési kézikönyv, (The handbook of SPSS research and data analysis), Alinea Kiadó, Budapest, 2007.
[8] P. A. Samuelson, W. D. Nordhaus, Közgazdaságtan, (Economics), Akadémiai Kiadó, 1998.
[9] K. Szabó, B. Hámori, Információgazdaság, (Information Economy) Akadémiai Kiadó, Budapest, 2006.
[10] Eurostat, Your key to European statistics, Available: http://epp.eurostat.ec.europa.eu/portal/page/portal/eurostat/home
[11] Hungarian Central Statistical Office, Available: http://www.ksh.hu
[12] S. Kumon, Japan Faces Its Future, The Political-Economics of Administrative Reform; Journal of Japanese Studies 10, 1. 1984
[13] T. Umesao, Japanese Civilization in the Modern World, JAPAN: National Museum Of Etamology, 2003.
[14] M. McLuhan, The Gutenberg Galaxy: The Making of Typographic Man, University of Toronto Press, Scholarly Publishing Division, 2001.
[15] A. Toffler, The Third Wave, Bantam (May 1, 1984)
[16] M. Castells, The Power of Identity (The Information Age: Economy, Society and Culture, Volume II), Wiley; 1st edition (August 11, 1997)
[17] F. Machlup, The Production and Distribution of Knowledge in the United States, Princeton University Press,1972.
[18] M. Porat, Communication Policy in an Information Society, 1977.
[19] D. Bell, The Coming of the Post-Industrial Society, Basic Books, 1st Printing edition (July 21, 1976)
[20] Y. Masuda, The Information Society as Post-Industrial Society, Transaction Publishers, 1988.
[21] R. Solow, A Contribution to the Theory of Economic Growth, Oxford University Press, 1956. (In 1987, he won the Nobel Prize in Economic Sciences for his analysis of economic growth.)
[22] P. Romer, Endogeneous Technical Change, University of Chicago Press, 1994.
[23] J. Cutcliffe, Essential Concepts of Nursing, Churchill Livingstone, 1999.
AUTHOR PROFILE
Dr. Peter Sasvari received his MSc in Mechanical Engineering, MSc in Economics and his PhD in Business and Organisation Sciences at the University of Miskolc. Now he is an associate professor at the Institute of Business Science, Faculty of Economics, University of Miskolc, Hungary. His current research interests include different aspects of
Economics, ICT and the information society.
Your photo
Comes
here
October Issue Page 17 of 89 ISSN 2229 5208