
The Impact of Executive Compensation and R&D Expenses Web viewThe Impact of Executive Compensation...
85
Nikolas Karakatsanis |ERASMUS SCHOOL OF ECONOMICS The Impact of Executive Compensation and R&D Expenses on Firm Performance: A Comparison between Manufacturing and Services Companies in the United States
Transcript of The Impact of Executive Compensation and R&D Expenses Web viewThe Impact of Executive Compensation...

The Impact of Executive Compensation and R&D Expenses on Firm Performance: A Comparison between Manufacturing and Services Companies in the United States
Nikolas Karakatsanis|ERASMUS SCHOOL OF ECONOMICS

The Impact of Executive Compensation and R&D Expenses on Firm Performance: A Comparison between Manufacturing and Services Companies in the United States
Master Thesis
The Impact of Executive Compensation and R&D Expenses on Firm Performance: A Comparison between Manufacturing and Services Companies in the United States
December 2015
Author: Nikolaos Karakatsanis
Student Number: 409742
Supervisor: Drs. Fytraki, A.T.
Second Reader: Dr. Keusch, T.
Accounting Auditing and Control
1

The Impact of Executive Compensation and R&D Expenses on Firm Performance: A Comparison between Manufacturing and Services Companies in the United States
Abstract
Using a panel of U.S. manufacturing and services companies over the 2000-2014 period, this
study explores the relationships between executive compensation and firm performance, as
well as, the relationship between R&D (research and development) expenses and firm
performance. Moreover, this study presents a comparison of these relations between
manufacturing and services companies. An Ordinary Least Squares (OLS) regression model
was employed to estimate these relations, with control variables of size, total executive
compensation and R&D expenses. My analysis revealed that executive compensation has a
significant positive impact on the performance of manufacturing companies, but do not have
an effect on the performance of services companies. Additionally, R&D expenses positively
affect the performance of manufacturing firms, whereas they have a negative impact on the
performance of services companies.
Keywords: Executive Compensation, R&D Expenses, Firm Performance, Firm Size,
Manufacturing Firms, Services Firms
2

The Impact of Executive Compensation and R&D Expenses on Firm Performance: A Comparison between Manufacturing and Services Companies in the United States
Contents1. Introduction.....................................................................................................................- 4 -
1.1 Research Problem & Motivation..................................................................................- 4 -
1.2 Research Objectives.....................................................................................................- 5 -
1.3 Research Methodology.................................................................................................- 7 -
2. Literature Review-Hypothesis Development..................................................................- 8 -
2.1 Executive Compensation and Firm Performance.........................................................- 9 -
2.2 R&D Expenses and Firm Performance......................................................................- 14 -
2.3 Interaction Effects.......................................................................................................- 17 -
3. Research Design............................................................................................................- 21 -
3.1 Variables.....................................................................................................................- 21 -
3.1.1 Independent Variables.........................................................................................- 21 -
3.1.2 Dependent Variable.............................................................................................- 24 -
3.1.3 Control Variables.................................................................................................- 25 -
3.2 Data Collection...........................................................................................................- 25 -
3.3 Methodology...............................................................................................................- 26 -
4. Empirical Results..........................................................................................................- 26 -
4.1 Descriptive Statistics..................................................................................................- 27 -
4.2 Pearson Correlation Matrix........................................................................................- 29 -
4.3 Main Findings.............................................................................................................- 30 -
4.4 Interaction Effects.......................................................................................................- 32 -
5. Conclusion....................................................................................................................- 34 -
5.1 Limitations and Future Research................................................................................- 36 -
References...........................................................................................................................- 37 -
Appendix.............................................................................................................................- 45 -
3

The Impact of Executive Compensation and R&D Expenses on Firm Performance: A Comparison between Manufacturing and Services Companies in the United States
1. Introduction One of the most debated issues regarding executive compensation is the one examining the
relationship between CEO compensation and firm performance. For more than seven decades
this particular topic continues to concern the experts in the field of management control, while
the related literature consists of more than three hundred studies (Barkema and Gomez-Mejia,
1998). Many authors have identified in their works a variety of factors that regulate the pay-
performance relationship. In particular, such factors are recorded firm size, firm risk,
ownership structure, socio-cultural factors and demographic factors like executives’ age,
tenure, education and gender. However, something that previous studies have in common and
which operates as a limitation to further testing on the pay-performance sensitivity is that they
focus on notable factors, whereas they ignore other unquantifiable, socio-cultural factors such
as the type of services the firm provides. Therefore, this paper attempts to explain the nature
of the relationship between executive pay and firm performance based on the diversity of
businesses.
Furthermore, research and development expenses are an issue with great importance for the
economic development of companies, hence for the development of national economies. This
importance may stem from the fact that for at least a century economic growth was driven by
increasingly sophisticated technologies, which were developed to a great extent through R&D
expenses (Greenstone, 2011). This importance, at least for the United States, also stem from
the fact that a large proportion of R&D expenses are covered by governmental funds
(Greenstone, 2011).
1.1 Research Problem & MotivationThis modern era corporations have changed the way they pay their employees. Specifically,
companies use more often incentives to motivate their executives and their employees than
they did in the past. The reason for that is to induce them, so as to try harder in order to
achieve a better performance. The basic fact that differentiates CEO and the other executives
from the non-executives employees is the high of their compensation (including basic salary,
bonuses and other compensation). This is happening because of the different responsibilities
they have. Moreover, firms invest in innovation through R&D expenses in order to obtain an
advantage over their competitors. The current study is quite relevant to the content of finance
and specifically to management control which examines the numerous official mechanisms to
influence the decision making process within organizations. Executive’s compensation and
4
The Impact of Executive Compensation and R&D Expenses on Firm Performance: A Comparison between Manufacturing and Services Companies in the United States
the decision of the amount of investments in research and development are part of such
mechanisms.
It is observed by Murphy (1999) that CEOs in all countries and especially in the United States
increase continuously their compensations, while worldwide economy faced many recessions
and financial crisis during the second half of the past century. In many cases the performance
of both services and manufacturing companies does not justify these payments. In their work,
Friedman and Friedman (2010) state that the way of CEOs compensation and the conflicts of
interest are the reasons of the catastrophic financial crisis after the Lehman Brothers collapse
in 2008. Moreover, based on a Watson Wyatt survey, Kirkland (2006) found out that
approximately 90% of institutional investors consider top executives to be dramatically
overpaid for what they do. Therefore, it is praiseworthy to wonder if compensation systems
work as they supposed to or not. Additionally, it would beneficiary to examine if executive
compensation affects differently companies that belong in different industries. The last one
could show that manufacturing and services companies might have better performance if they
embrace different compensation packages for their executives.
1.2 Research ObjectivesThere is a plethora of past papers that state the impact of executives’ compensation and R&D
expenses on firms’ performance, which are referred in details in the literature review segment.
The main objective of this study is to investigate the relations between the compensation of
senior business executives (such as CEOs, CFOs and COOs) and firms’ performance on the
one hand and R&D expenses and firms’ performance on the other hand. This investigation
focuses on firms in the United States depending on the type of services they provide. More
specifically, this thesis is going to observe if there is a different impact of executive
compensation and R&D expenses on the total outcome of service enterprises (including banks
and other financial firms) and manufacturing companies in the United States. All these are
incorporated in the following main research question:
RQ: Does executive compensation and R&D expenses have a stronger impact
on the output of services firms than on manufacturing companies in the United
States?
As I will elaborate below, there are past researches that show the impact of executives’
compensation and R&D expenses on the performance of both services firms and
5

The Impact of Executive Compensation and R&D Expenses on Firm Performance: A Comparison between Manufacturing and Services Companies in the United States
manufacturing companies in different countries. What makes my research question unique, is
that aims to gather all of these information in a single work, so as to allow the comparison
between these two different industries by focusing only in the United States economy.
Providing an answer to this research question is very significant. More specifically, it could
modernize compensation systems, especially for the executives based in which industry each
company belongs. Additionally, this could improve companies’ operations; hence it could
reduce costs and increase profitability. Last but not least, the results of this paper will give
American shareholders a better insight about executive compensation and R&D investments.
In details, it will be a helpful tool for the policy makers regarding the design of executive
compensation systems on the one hand and the release of funds in favor of research and
development on the other hand.
The originality of my study lies in the fact that investigates an issue on which there is little or
no relevant existing literature. Additionally, what is special about this paper is that it
compares the compensation systems and R&D investments in different economic sectors to
find the best possible financial mixtures that will maximize firms’ final performance.
Since the purpose of this study is to examine the impact of executives’ compensation and
R&D expenses on American firms’ performance based on the type of services they provide, I
split the companies into two main categories: services companies and manufacturing
companies. At this point, before I continue with my research, there is an imperative need to
clarify some definitions.
Firstly, by the term total output of a company I mean all goods and services that a company
produces for a specific period of time. All the above contribute to form the firms’ profit.
Subsequently, services companies are those companies comprising a wide variety of
industries that do not produce anything but provide services and instead. Such companies are
financial services firms (banks, credit card companies, insurance companies, accountancy
companies, investment funds, real estate funds, etc.), retailers, accommodation industry, etc.
Finally, manufacturing companies are those businesses that use raw materials to make a final
product, which can be sold directly to consumers or to other manufacturing firms to make a
different product, or to provide a certain service. Examples of such companies are vehicle
manufacturers, construction developers, clothing companies, mining and oil-production
companies, large conglomerate, etc.
6
The Impact of Executive Compensation and R&D Expenses on Firm Performance: A Comparison between Manufacturing and Services Companies in the United States
Moreover, as stated previously, companies use incentives to compensate their executives.
These incentives can be both monetary when they are based in equity-based compensation
and non-monetary when they are based on behavioral characteristics. Examples of equity-
based incentives are the total number of stock options granted, the total number of restricted
shares granted, long-term incentive payouts, bonuses etc. On the other hand, examples of non-
financial incentives could be the praise and commendation from immediate manager, the
attention receiving from leaders and opportunities to lead projects.
Finally, some things that need to be clarified are some of my choices regarding this project.
My study focuses on firms in the United States for two main reasons: firstly, because of the
size of US economy and secondly, because of the role of the United States as a leading figure-
country-economy of the developed world. Regarding my choice for these particular business
sectors of the United States economy, is because the services and the manufacturing industry
in their broader sense comprise the largest part of the largest economy in the world. In
particular, the industrial sector made up 19.1 percent, while services constituted 79.7 percent
of the United States GDP in 2012 (World Economy Team, 2013).
1.3 Research MethodologyAs a first step towards answering my research question, a thorough existing review of the
relevant literature is conducted. Firstly, I have to present the past theoretical and empirical
findings about executive compensation in general and the way executives are compensated in
the United States in particular. Subsequently, I will focus on the structure of this
compensation; that is the basic components based on which executives are getting paid and
their development through the decades. After that I will make a distinction of the previously
referred subjects between different business sectors and more precisely between the services
sector (including banks and other financial institutions) and the manufacturing sector,
comprising mainly of companies belonging in the automotive industry, mining and aerospace
companies, etc. Secondly, I have to present the existing literature that is relevant to research
and development (R&D) expenses in general, their use from U.S. companies and their impact
on both manufacturing and services companies. Finally, another stream of literature that I will
examine is which specific metrics could act as control variables that affect the examined
relations.
After that, I will collect my data which I will extract from the Wharton Research Data
Services system. For my research, I will need annual data for executive compensation for
7

The Impact of Executive Compensation and R&D Expenses on Firm Performance: A Comparison between Manufacturing and Services Companies in the United States
companies in the United States that are available through the COMPUSTAT ExecuComp
Annual Compensation database. Moreover, for the annual data about R&D expenses and
ROA (firm performance) I will use the COMPUSTAT Fundamentals Annual database. The
same database I will use to extract data about sales turnover which I will use to measure the
control variable of firm size. Lastly, I will compare the impact of executive compensation and
R&D expenses on firm performance for all the U.S. manufacturing and services companies.
My sample period is from 2000 until 2014.
The main findings of my research reveal a significant positive association between executive
payments and the performance of manufacturing companies. On the contrary, there is not an
association between executive payments and the performance of services companies.
Moreover, the analysis showed that research and development expenses have a positive
impact on the performance of companies belonging to manufacturing sector. In contrast, the
impact of R&D expenses on the performance of services companies is negative. Also, the
impact of executive compensation on firm performance is more intense in manufacturing than
in services companies. In addition, the impact of R&D expenses on firm performance is
bigger in manufacturing than in services companies. Finally, the results show that the
interaction effects between executive compensation and firm size and R&D expenses and firm
size is positive for both manufacturing and services firms (except for the interaction of
executive payments and firm size in services companies, which does not apply at all).
The paper is organized as follows. In the next section, there is a thorough presentation of the
literature that is related to both the executive compensation-firm performance relation and the
R&D expenses-firm performance relation. In the same section, the construction of the
research hypotheses is made. This is followed by the research design that includes data
collection and methodology. Then, my findings and the basic conclusions are presented,
followed by the research limitations and some recommendation for further research.
2. Literature Review-Hypothesis DevelopmentIn this section there is an attempt to collect and present all the past theoretical and empirical
studies which are relevant to the relationship between executive compensation and firm
performance on the one hand and R&D (research and development) expenses and firm
performance on the other hand. For this purpose, there has been an overview of published,
working and research papers and an endeavor to be used both the market and accounting ways
8

The Impact of Executive Compensation and R&D Expenses on Firm Performance: A Comparison between Manufacturing and Services Companies in the United States
to measure firm performance. To choose which papers should be discussed, I used mainly
those that are included in the top ten accounting journals as they ranked in both the British
and the Australasian rankings. I did that because I consider it as the best way to support the
ideas that my thesis promotes. Additionally, there has been an extensive use of Google
Scholar, so as to find other relevant papers. Also, I choose to use papers that on average cover
chronologically a period of two decades, so as to observe the changes in both practice and
theory of the pay-performance sensitivity and the performance-R&D expenses relationship
throughout the years.
2.1 Executive Compensation and Firm PerformanceTo begin with, my dissertation is connected to the literature that gives information about the
association between executive compensation and firm performance. But before investigating
the above relation it is crucial to observe the importance of executive compensation as it is an
issue that gathered a lot of attention for over five decades around the globe and in the United
States in particular. Several factors triggered this extensive interest, factors that are
undoubtedly associated with the change of executive compensation.
In their study, Frydman and Saks (2010) examined the profound change in the level of
executive payments during a long period of time from 1936 to 2005. More precisely, after a
sharp drop during WWII, the level of payments increased slowly from the mid-1940s to the
mid-1970s, but they increased rapidly from the 1970s to the present. But which reasons lead
to this change? Murphy (1999) tries to answer this question by citing some factors that cause
the previously referred fact. Firstly, chief executive officers (CEOs) obtained more power in
the board of directors which lead to the continuous rise of their compensation. Secondly,
during 1980s, it was believed widely that the high payments of CEOs lead to plant closures
and proliferation of layoffs which in turn lead to a corporate downsizing. Finally, during
1990s it was observed a tight bond between the payments of CEOs and the stock price
performance of the companies.
Furthermore, the importance of executive compensation is illustrated also by the unbreakable
link to firm performance. At this point, it is of great importance to observe if there is an
interaction between these two components. More precisely, it is crucial to be examined if
executive compensation affects firm’s performance and parallel it is affected by this.
9

The Impact of Executive Compensation and R&D Expenses on Firm Performance: A Comparison between Manufacturing and Services Companies in the United States
To begin with, Doucouliagos et al. (2007) showed in their paper that executive compensation
and performance of Australian banks are not related when the period is one lag. However, this
relation seems to exist when there is a period of two lags and more. Zhou et al. (2011) showed
that neither, there is a relation between managers’ compensation and bank’s performance, nor
compensation changes influence firm performance. However, the pay-performance sensitivity
that is examined in this study is lowered by the state control ownership of Chinese banks.
Similarly, in their work, Firth et al. (2006) found that in firms in which the state holds the
majority of shares, pay-performance sensitivity does not exist, whereas firms in which private
equity holders or SOEs represent the major shareholders appear to have a stronger pay-
performance link. Wei (2000) tested 765 listed companies and found no significant positive
association between firm performance and executive compensation. In Japan during the
period from 1977 to 2000, Kubo and Saito (2008) examined the pay-performance sensitivity
and they found that it decreased substantially after 1990 due to bureaucracy.
Relevant to this, is the agency theory which describes the association between two parties: the
principal (shareholders) and the agent (executives). This relationship happens when
shareholders hire managers to do the day-to-day business in the company. For example, the
chief executive officer (CEO) possesses the highest position among executives in a company
and is the one who makes all the important decisions. These decisions may be about policy
and strategy, expansion, acquisitions, etc. The chief operating officer (COO) is responsible for
the day-to-day operation of the company. Finally, the chief financial officer (CFO) of a firm
is responsible for the financial planning and other similar staff. According to this theory there
is not an alignment of shareholders’ interest with those of executives. Specifically, executives
regardless whether they are working in the services or the manufacturing industry, desire to
maximize their wealth whether firm performance is good or bad. This, in most cases, contrast
shareholders’ interests.
On the other hand, there is past literature that points out the effect of executive compensation
on the firm performance based on several factors. Specifically, Wallsten (1999) in his
empirical work found that executive compensation is linked to firm’s performance and in fact
this link is growing stronger based mainly on the executive’s rank in the company. On the
contrary, firm’s performance seems to have no effect on executive payments, as executives
are rewarded in profitable years but are not punished in non-profitable years. Similarly, Gaver
and Gaver (1998), Iyengar (2000) and Shaw and Zhang (2010) stated that executives are not
10

The Impact of Executive Compensation and R&D Expenses on Firm Performance: A Comparison between Manufacturing and Services Companies in the United States
punished in poorly performing years because the board of directors is reluctant to that,
showing that pay-performance sensitivity does not apply in poorly performing years.
Coughlan and Schmidt (1985) in their work focused among others on the significant relation
between rates of change in pay and firm performance as it is depicted by the stock price
performance. Likewise, Frydman and Jenter (2010) pointed out that this relation between
executive pay and stock price performance increased more intensively in the 90’s. Brick et al.
(2006) were more precise on this subject as they evidenced that overcompensation of directors
and CEOs has a negative impact on firm performance and lead to underperformance.
Moreover, there is further past literature that points out the existence of relation between
executive’s compensation and firm performance. According to previous researches, this
relation might be either positive or negative. The majority of the researchers in one way or
another found a positive effect of executives’ payments on firm’s performance. Among them
are Mehran (1995) and Hubbard and Palia (1995) who both in their work found that
executive’s compensation influences firm’s performance; the former by examining the
executive compensation structure of 153 randomly-selected manufacturing companies
between 1979-1980 , whereas the latter by testing 147 banks during 1980. The option
valuation model as being modified by Merton (1973) to include also firm dividends was used
by Black and Scholes (1973), Core and Guay (2002) and Daniel et al. (2013). According to
Manmohan and Mukund (1988) the relationship between executive compensation and firm
performance is characterized by complexity, but they found that there is a positive relation by
examining the changes in CEOs’ compensation in 1985 and 1986.
In addition, Sun et al. (2013) stated that firm performance and CEOs’ compensation are
associated, when performance is measured in terms of revenue efficacy. To test their
hypothesis, they used a sample of United States property-liability companies from the
insurance industry. Moreover, Zajac (1990) stressed that there is a strong connection between
executive compensation and firm performance, as companies in which CEOs align their
personal wealth to the wealth of the shareholders, hence their firms, tend to be more
profitable. To extract his findings, the author used data for CEOs from the Forbes 500, the
Fortune 500 largest industrial firms and large firms with annual sales of one billion dollars
that are not listed in Forbes 500 in 1987. In their work, Canarella and Gasparyan (2008) found
a positive relation between executive compensation and firm performance. They used a
sample of computer and software companies from 1996 to 2002.
11

The Impact of Executive Compensation and R&D Expenses on Firm Performance: A Comparison between Manufacturing and Services Companies in the United States
On the contrary, there is literature like the work of Chen and Jermias (2014) which stated that
firm’s performance is negatively affected by executive’s compensation, when this certain
compensation policy is not in line with the business strategy of the firm.
Based on these facts, I constructed the following hypotheses:
H1a1: Executives’ compensation has a significant positive association with the
performance of a manufacturing company in the United States.
H1b1: Executives’ compensation has a significant positive association with the
performance of a service company in the United States.
Another stream of literature that is relevant to my thesis is the one that regards executive
compensation in firms which are based in the United States. As I mentioned before, the
importance to examine the impact of executives’ compensation on firms’ performance partly
lies in the size of the United States economy, so as the results can be more visible. Besides the
above, the leading role that the United States play in the “Western”, developed world is of
great importance for this study’s results, in the sense that if these results are applicable in the
world’s largest economy they will be applicable everywhere.
In the relevant literature, Bebchuk et al. (2001) referred that CEOs in the United States were
compensated more compared to their colleagues in other countries. According to them,
various factors lead to this phenomenon. As example they pointed out the larger influence of
American CEOs compared to foreigners CEOs. Moreover, they suggested that the American
market is characterized by bigger competition, which lead American CEOs to get paid more
than their counterparts in other countries.
Next, to understand better the relation between the executives’ payments and firms’
performance, it would be beneficiary to examine the exact structure of the executive
compensation. As I stated in the introduction companies in modern economies exploit the use
of incentives to compensate their executives and to induce them, so as to succeed larger
profits. The type of incentives depends on whether they are based in equity-based
compensation or on behavioral characteristics; the former are pecuniary incentives, whereas
the latter are non-pecuniary incentives.
12

The Impact of Executive Compensation and R&D Expenses on Firm Performance: A Comparison between Manufacturing and Services Companies in the United States
In his work, Murphy (1999) stated that despite the different compensation systems that
companies may use, managers are getting paid mainly in four different ways: the basic salary,
the short-term incentives, the long-term incentives and the perquisites. This composition has
changed as well following the change in the magnitude of executive compensation. In
particular, since 1950 executive payments changed significantly, as forms of incentive
payments became the larger parts of the total compensation (Frydman and Saks, 2010). Also,
Mehran (1995) in his empirical work stressed that companies in which managers own shares
perform better. Likewise, Core et al. (2003) pointed out that is better for firm performance if
executives are also owners of the companies they work, by holding certain equity. In her
study, Frye (2004) suggested that firms which use compensation systems based on equity for
their employees (executive and non-executive perform better.
It is also interesting to observe that the exact structure of executive compensation could be
related to the composition of the board of directors. In details, it is a common fact that firms
with more outside directors tent to compensate their executives with a higher percentage of
equity-based forms of payments (Mehran, 1995).
Moreover, there is existing literature that focuses on the impact of executive compensation on
firms of two specific industries; the services companies and manufacturing companies. My
expectations to find different results between these two sectors lie in the important role that
the finance industry plays, as the most significant pillar in every country’s economy. But is
there actually any possibility of having different results between different industries? And if
yes, which are the characteristics that differentiate each industry from the other and lead to
these results?
According to Zhou et al. (2009) “services companies differ from manufacturing in labor
intensive, in intangibility, in service heterogeneity, in customer involvement, in customer-
supplier duality, in simultaneity of production and in consumption”. The financial sector
(Services Industry) differs from other industries in its complexity which can lead to a greater
impact of executive compensation on the firm’s performance of financial institutions than in
other companies (Macey and O’Hara, 2003; Doucouliagos et al., 2007; John and Qian, 2003).
The aforementioned complexity exists because of the special role that the financial
institutions have, regarding the progress of American markets and worldwide markets in
general. By this I mean that banks and other companies in the finance industry are the main
pillars in any economy as they supply with funds all other business sectors.
13

The Impact of Executive Compensation and R&D Expenses on Firm Performance: A Comparison between Manufacturing and Services Companies in the United States
However, financial institutions are regulated at a higher degree than manufacturing firms
(John and Qian, 2003) and this regulation is an alternative way of monitoring and a way of
providing incentives to managers (Hirschey and Pappas, 1981; Carroll and Ciscel, 1982).
Based on this regulation, the pay-performance sensitivity in financial institutions is expected
to be lower than it is in manufacturing companies. John and Qian (2003) stressed also that
pay-performance sensitivity in the banking industry is lower than it is in the manufacturing
industry because of its high leverage.
Now based on these arguments I will construct the hypotheses that will help to compare and
contrast the impact of executive compensation on companies in the service industry and in the
manufacturing industry. More specifically:
H2: The significant positive association of executives’ compensation with firm
performance is bigger in manufacturing than in services companies in the
United States.
2.2 R&D Expenses and Firm Performance Secondly, the importance of R&D (research and development) expenses should not be
considered less significant, as it is a core part of the modern business world. Businesses often
use research and development for future growth by emerging new products or processes, in
order to increase and advance their operations. Although R&D expenses are a synonymous
with high-tech companies, many firms from all industries spend large amounts of money to
improve their products/services.
Ericson and Jacobson (1992) stressed that firms in order to obtain an advantage over their
current or future competitors make use of R&D expenses. In this way, they manage to prevent
imitations and to increase substantially their profits. Similarly, Hayes and Abernathy (1980)
claimed that superior technologically products will help firms to succeed and to gain an edge
over their rivals. Additionally, Chao-Hung Wang (2011) focused on the survival of firms in
such a competitive environment and explained that R&D expenses can play a significant role
in it. In particular, he pointed out that R&D expenses are outweighed by the benefits they
have in innovation and performance. In his work, Drucker (2005) pointed out that firms
should increase their R&D investments in order to gain in competitiveness.
Another fact that demonstrates the importance of R&D expenses is the existence of RJV
(research joints ventures) which are created based on a cooperative agreement between firms
14

The Impact of Executive Compensation and R&D Expenses on Firm Performance: A Comparison between Manufacturing and Services Companies in the United States
that share the costs and the results of the research project. Specifically, the importance seems
from the fact that firms which may be competitors in an industry, cooperate in R&D
investments in order to minimize the costs and maximize the potential profits. According to
Siebert (1996), firms that cooperate in R&D expenses show higher profitability. Similarly,
Motta (1992) showed that a cooperative R&D has a higher welfare level than a non-
cooperative one. In the same range, Rosenkranz (1995) stressed that firms choose to cooperate
in their R&D expenses, because otherwise their profitability will be low or even zero due to
the uncertainty of their rival’s strategy. On the contrary, Choi (1993) suggested that this kind
of cooperation depends on the spillover rates and when these rates are high a cooperative
R&D is more preferable than a non-cooperative one, but the profit decreases. The reason for
that is the intensified competition that lies in the post-innovation period.
Next, there is the literature that shows if there is a positive or negative relationship between
R&D expenses and firm performance. In their work, Cooper et al. (2008) found a positive
relation between R&D expenses and firm performance in terms of future returns. Similarly,
Lev and Sougiannis (1999) found that R&D expenses become risk factors when they are
added to a firm’s capitalization and they have a positive impact on firm’s future returns.
Hirschey and Weygandt (1985) stressed that corporate expenses for innovation (R&D) need a
period of five to ten years to have a deferred effect. In addition, Toivanen et al. (2002)
showed that R&D investments positively affect market value. Liang and Zhang (2005) and
Cheng et al. (2006), by examining samples of 72 and 96 high technology companies
respectively, found also a positive relationship. However, there must be the appropriate
understanding and management of the knowledge produced by R&D investments, in order to
lead to an increase in firm’s future performance.
On the contrary, there are past papers that reveal no or negative relationship between R&D
expenses and firm performance. Donelson and Resutek (2012) claimed that expenses in
research and development and firm’s profits are not related. Hsu et al. (2013) showed that
R&D expenses increase net sales, but also increase operating costs which tend to decrease
operating income. Finally, Cooper et al. (2008) suggested that there is a negative relation
between R&D expenses and firm’s earnings when this relation is examined from finance
perspective, but it is positive in accounting.
Based on these facts, I constructed the following hypotheses:
15

The Impact of Executive Compensation and R&D Expenses on Firm Performance: A Comparison between Manufacturing and Services Companies in the United States
H1a2: Research and development expenses have a significant positive
association with the performance of a manufacturing company in the United
States.
H1b2: Research and development expenses have a significant positive
association with the performance of a service company in the United States.
Another stream of literature that is relevant to my thesis focuses on the use of R&D expenses
by American companies. It is interesting to observe how these companies consider
investments in R&D given that in the United States have their headquarters some of the
largest, most profitable and influential manufacturing and services firms in the world.
To begin with, Greenstone (2011) pointed out the importance of R&D expenses for the
United States, explaining that for at least a century America faced a continuous economic
growth due to innovation, which in turn increased the standard of living. Research and
Development investments lead to this innovation and to the competitiveness of the U.S.
economy. Another fact that reveals the importance of R&D expenses is that both the private
and the public sector spend large amounts of money on such investments (Greenstone, 2011).
In a comparative analysis between French and American manufacturing firms, Mulkay et al.
(2000) found that in U.S. firms the effect of cash flows and profits on R&D investments is
more intense. That practically means that in the United States it is easier to get access to
funding for research and development.
Furthermore, there is existing literature that focuses on the impact of research and
development expenses on firms of specific industries, such as manufacturing companies and
non-manufacturing companies. The latter are companies that do not produce anything and
therefore they may call services companies (including financial services companies).
Ehie and Olibe (2010) stressed that companies from different industries tend to approach
differently R&D expenses and to make use of different mixtures, in order to achieve their
goals. Specifically, manufacturing companies want to improve their production systems
through these investments, whereas services companies use R&D expenses for other
developments. Likewise, Mansfield and Lee (1996) stated that manufacturing companies may
be significantly benefitted by investments in R&D, since these investments can improve the
production, and hence can minimize the production costs. Ho et al. (2005) examined the
16

The Impact of Executive Compensation and R&D Expenses on Firm Performance: A Comparison between Manufacturing and Services Companies in the United States
impact of R&D expenses on firm performance in both manufacturing and services companies
for a one-year lag. They found that the performance of manufacturing firms was positively
affected in contrast with the performance of services companies.
Based on these facts, I constructed the following hypothesis:
H3: The significant positive association of research and development expenses
with firm performance is bigger in manufacturing than in services companies in
the United States.
2.3 Interaction EffectsFinally, there is the literature that is relevant to which metrics could be used as control
variables in the executive compensation and firm performance relation on the one hand and in
the R&D expenses and firm performance relation on the other hand. There is a plethora of
past papers that are referred to firm size1 as a control variable, meaning that affect both the
executive compensation and the firm performance.
Consistent with previous studies Cyert et al. (2002) found out that firm size is the most
important explanatory variable for all forms of executive compensation. Likewise Hubbard
and Palia (1995) showed the positive relation between the size of financial institutions and
their executive compensation. Besides all these, it is observed that in large companies the
productivity growth rate is linked to the firm size as it is shown by its working capital, the
number of employees, the amount of tangible assets and its sales (Halkos and Tzeremes,
2007). However, there are researchers who stress that pay-performance sensitivity should be
inversely related to firm size. More specifically, political influence could lead to lower pay-
performance sensitivity in large firms (Jensen and Murphy, 1990). Moreover, Schaefer
(1998), by using a model and empirical evidence, argued that pay-performance sensitivity
drops when firm size rises.
Based on these arguments, I constructed the following hypothesis:
H4a: The impact of executives’ compensation on the performance of a
manufacturing company in the United States should be greater in larger firms.
1 Firm size is used as control variable when testing H1-H3, while is used as moderator variable when testing the interaction effects in H4-H5.
17
The Impact of Executive Compensation and R&D Expenses on Firm Performance: A Comparison between Manufacturing and Services Companies in the United States
H4b: The impact of executives’ compensation on the performance of a service
company in the United States should be greater in larger firms.
There is also a plethora of past literature that includes firm size as a control variable when
testing the relationship between R&D expenses and firm performance. To begin with, Crépon
et al. (1998) found a significant correlation between firm size and R&D expenses. Similarly,
Hsu et al. (2013) stressed a positive relationship between firm size and R&D expenses. Ehie
and Olibe (2010) showed that R&D expenses positively influence firm performance after
controlling for firm size. Finally, Ayaydin and Karaaslan (2014) found that firm size has a
positive impact on the profitability of companies.
Based on the above, I constructed the following hypothesis (here firm size is used:
H5a: The impact of research and development expenses on the performance of
a manufacturing company in the United States should be greater in larger
firms.
H5b: The impact of research and development expenses on the performance of
a service company in the United States should be greater in larger firms.
Additionally, R&D expenses and executive compensation could be used as control variables
to see their influence on the relationship between executive compensation and firm
performance and R&D expenses and firm performance respectively.
According to Cheng (2004), there is a positive association between changes in R&D expenses
and changes in CEOs’ total annual compensation, when CEO is about to retire (horizon
problem) and when firms face small earnings reduction (myopia problem). On the contrary,
Bizjak et al. (1993) found a negative association between R&D expenses and CEO’s
compensation. One possible explanation for these contradictory findings is the danger of
overinvestment in R&D expenses, which makes it unclear for the compensation committees,
if they should motivate more R&D spending. Artz et al. (2010) showed that there is a positive
impact of R&D expenses on firm performance. Moreover, researchers like Salavou (2002)
and Prajogo (2006) stated that product innovation as a result of R&D expenses leads to firm
growth and performance increase. Similarly, in their works Roberts (1999) and Cho and Pucik
(2005) stressed a very positive association between innovation as a result of R&D expenses
and performance of manufacturing firms in the United States. Last but not least, there are few
18
The Impact of Executive Compensation and R&D Expenses on Firm Performance: A Comparison between Manufacturing and Services Companies in the United States
sources that indicate spending for research and development in the banking industry. Thomke
(2003) pointed out the experiment conducted by the Bank of America, one of the leading U.S.
banks, which has been running a series of ongoing R&D processes to create a new service
concept for retail banking. The results show a significant increase in the performance of the
bank.
Finally, the board of directors that is responsible for the level and the composition of
executive payments could be another control variable to test how it affects the relation
between executive compensation and firm performance.
Specifically, Doucouliagos et al. (2007) found out that there is a positive relation between the
directors’ and the CEO’s compensation. Also as it is referred above, when the majority in the
board of directors is outsiders, executives tent to be compensated basically with equity
(Mehran, 1995). This fact points out that the board of directors play a key role in the setting of
compensation systems. Lastly, CEO compensation monitoring is related to firm performance
and this relationship get stronger when firms are controlled by management rather than by
their owners.
After studying the already existing literature, I have found significant evidence that will
contribute to complete this particular survey. First of all, there is a plethora of previous
researches that examining the impact of executives’ compensation and R&D expenses on
firms’ performance.
Initially, the vast majority of studies related to executive compensation and firm performance
show that there is a strong relationship between them. However, there are some exceptions
where this link does not exist. More specifically, it is observed that in countries such as China
in which the government has a significant influence in many companies (including banks),
executives’ compensation does not affect firms’ performance at all (Zhou et al., 2011).
Furthermore, there is extensive literature about how this relation is applied in the United
States. There is also past literature related to the impact of executive compensation on firm’s
performance in both the finance and the manufacturing industry.
Continuously, most of the literature regarding R&D expenses and firm performance reveal a
strong positive relation between them with some exceptions. Following, there is literature
relevant to the use of research and development expenses in the United States. Last but not
19

The Impact of Executive Compensation and R&D Expenses on Firm Performance: A Comparison between Manufacturing and Services Companies in the United States
least, there are past researches that investigate the impact of R&D expenses on manufacturing
and non-manufacturing firms.
As far as control variables are concerned, I choose to use firm size because it has been
previously shown to have an effect on both the relations I am testing. Moreover, I choose to
use R&D expenses and executive compensation as control variables when executive
compensation and R&D expenses stand as my independent variables respectively. I did that
because R&D expenses are used to boost firm’s performance and as a competitive advantage
against competitors. Also many times they are manipulated so as to have an impact on
executive’s compensation (Cheng, 2004). All these are important for my thesis as they will
help me to interpret this study’s final findings and possibly to add something new in the
standing literature.
However, I have found no literature comparing the impacts between these two industries. For
this reason this work is important. Firstly, it can add to the existing literature regarding
executives’ compensation and firms’ performance on the one hand and R&D expenses and
firms’ performance on the other hand. Secondly it has important implications in both theory
and practice. Regarding the theory, this study offers important information in the content of
management control that has to do with decision making on administrative issues. Such issues
are executives’ compensation and their structure. This paper has also some important practical
implications. In particular, it can assist companies by modernizing their executive
compensation systems and by improving their operations. Moreover, it points out the
importance of R&D expenses for companies as far as their economic progress and their
competitiveness are concerned.
My thesis contributes to the already existing literature that is relevant to the impact of
executive compensation and R&D expenses on firm performance by examining and
comparing these relationships between companies from the services sector and the
manufacturing sector. Based on the existing literature I expect a strong impact of executive
compensation and R&D expenses on firm’s performance. Moreover, I expect the relation of
executive compensation on firm performance to be stronger for companies in the
manufacturing sector than for companies in the services sector. Similarly, I expect that the
impact of R&D expenses on firm performance will be greater on manufacturing than on
services companies.
20

The Impact of Executive Compensation and R&D Expenses on Firm Performance: A Comparison between Manufacturing and Services Companies in the United States
3. Research DesignIn this section, I will present and further elaborate the basic components-variables that I
intend to use in order to examine the research question of this thesis. More specifically, I will
elucidate what is and how I am going to measure firm performance, executive compensation,
R&D expenses and firm size. Moreover, in this section I will give information about data
collection. Finally, I will explain all about the methodology and the basic model I will use.
3.1 Variables A complete presentation of all the variables is available in Table 1 in the Appendix.
3.1.1 Independent VariablesIn this study, the independent variables are CEO remuneration and R&D expenses.
CEO RemunerationThe already existing literature provides little guidance for empirical researchers on
determining in the most appropriate way the compensation of executives and especially
CEOs. Most studies use nothing but a market or accounting measure of performance to
calculate executives’ payments. But how shall we determine the payments of business
executives? To understand this issue better and thus to find the most suitable answer, we
should determine first what is executive compensation and what components on average may
constitute such a compensation.
As stated in the introduction, companies in the modern economic environment compensate
their executives by using different incentives, so as to make them perform better by securing
and increasing shareholders’ wealth. Depending on whether the incentives are equity-based or
behavior-based, they are divided into two categories: the monetary and non-monetary
incentives. Both these categories have a common goal, which is rewarding employees for
doing their job well, but it is slightly different based on what they are designed to achieve.
More specifically, monetary incentives are something that employees can struggle for, in
contrast with non-monetary incentives.
Another way to classify and understand the compensation of executives is to distinguish it in
the four main categories that compose it. These main components are the basic salary, short-
term incentives, long-term incentives and perquisites:
21

The Impact of Executive Compensation and R&D Expenses on Firm Performance: A Comparison between Manufacturing and Services Companies in the United States
Basic salary
The basic salary is considered a “fixed” element of executives’ payments and usually it is not
affected by the company’s performance.
Short-term incentives
Short-term incentives or annually awarded incentives are used to compensate executives for
achieving the company’s short-term business goals set by the board. These types of incentives
are mostly financial metrics in the form of bonuses. However, many companies tend to use
non-financial metrics as well. In most cases executives in higher-level positions receive
higher of these award opportunities and vice versa. Finally, short-term incentives are usually
planned to provide minimum, desired and maximum levels of performance which are used to
create minimum, desired and maximum levels of payment.
Long-term incentives
Long-term incentives are mixtures of equity and cash compensation that is used to reward
executives for achieving the company’s long-term goals that will increase shareholders’
wealth. Examples of long-term incentives which are referring to a performance period that
usually is between three to five years are restricted stocks, shares, stock options, etc. Long-term
incentive objectives differ among companies but most of the times are focused on return
measures (return on assets) and operational measures (earnings per share). In any case
executives do not receive any further payment (from the incentives), but in the end of the
specific period. Similar to annual incentives, long-term incentives are usually designed to
have minimum, desired and maximum levels of performance. Finally, these kinds of
incentives are considered an important part of executives’ compensation because they are the
largest part of it (over 60 percent for the median S&P 500) and they guarantee an alignment
with the shareholder interest.
Benefits/Perquisites
The last component of executives’ total compensation package consists of a wide variety of
benefits and perquisites or “perks”. This form of compensation is used to recognize how
important to the company each executive is and include company cars, club membership,
spouse travel, housing accommodation etc.
22

The Impact of Executive Compensation and R&D Expenses on Firm Performance: A Comparison between Manufacturing and Services Companies in the United States
Because of the complexity to quantify and measure benefits such as “perks” due to lack of
reliability of data, this paper following past studies will focus solely on monetary incentives.
Moreover, they tend to be more effective and influential than other non-monetary incentives.
Research and development (R&D) expenses Another independent variable in this study is research and development expenses (R&D).
R&D expenses are a type of tax deductible operating expense, used to find and create new
products and/or services. These expenses can be of both minor and major significance
especially for large corporations. The already existing literature gives contradictory results
regarding the association between executive compensation and R&D expenses. According to
Cheng (2004), this is happening because compensation committees based on the fear of
overinvestment in R&D hesitate to allow further expenditures in the field of research and
development. Furthermore, there is extensive literature that shows the impact that R&D
expenses have on firm performance especially in the manufacturing industry. For example,
DeCarolis and Deeds (1999) and Hua and Wemmerlov (2006) pointed out the positive effect
that innovation through R&D expenses has on the performance of U.S. manufacturing firms.
Likewise, Wakelin (2000) showed the significant effect that R&D expenses have on the
performance of manufacturing firms in the United Kingdom.
There are three types of R&D. These are the following:
Basic Research: This kind research that applies to the industrial sector improves the scientific
knowledge without any specific commercial purposes. However, such research may be in the
interest to the company, present or future.
Applied Research: Industries use this type of research to gain new knowledge about products,
processes and services, with specific commercial purposes.
Development: Development is the systematic use of obtaining knowledge or understanding
through research to the production of products, systems or methods (with the design and
development of prototypes to be included).
23

The Impact of Executive Compensation and R&D Expenses on Firm Performance: A Comparison between Manufacturing and Services Companies in the United States
3.1.2 Dependent VariableIn this study, the dependent variable is firm performance.
Firm PerformanceWhat is firm performance depends on how someone perceives the term “firm performance”.
That is for example when someone uses marketing, operations, finance, human resource
management, productivity, profitability or another metric to answer this question. In general,
as firm performance could be considered the total output of a company; that is, all goods and
services that a company produces for a specific period of time which leads to the firms’ profit.
There is extensive literature that presents several measures of a company’s performance, both
market-based and accounting-based.
One difficulty that comes with comparing firm performance between different industries is
the different metrics they use to do it. In particular, banks and manufacturing firms may use
different ways to measure their performance. For example, banks can use non-performing
loans (NPL) to measure their performance as this can increase the competitiveness within the
banking system (Zhou et al, 2011). On the other hand, manufacturing firms may use their
productivity or return on sales (Firth et al, 2006; Mengistae and Xu, 2002) as metrics.
To avoid this problem, it is necessary to find a metric that can be used by both financial
institutions and manufacturing companies. There are many conventional measures that can be
used for companies in both the finance and the manufacturing industries. For example Brick
et al. (2008) used stock returns, while Buck et al. (2008) total shareholder returns, pre-tax
profits and returns on assets. Return on assets (ROA) and return on equity (ROE) are used
extensively for the assessment of the performance of financial institutions (Knapp et al, 2005;
Choi and Hasan, 2005; Shen and Chang, 2006) only in terms of profitability. Moreover, they
are performance metrics that can be used to compare the performance of banks and
manufacturing firms (Mishra and Nielsen, 2000).
Although ROE is the prevalent measure of firm performance, it can obscure some potential
difficulties. For example, some companies may increase their debt leverage levels to keep
their ROE falsely healthy. This could increase significantly risk with worse results for such
companies. On the contrary, ROA is a better metric of financial performance, as distortion
such as mentioned before (Brown et al., 2010). In my thesis, I choose to measure firm
performance in terms of ROE and ROA.
24

The Impact of Executive Compensation and R&D Expenses on Firm Performance: A Comparison between Manufacturing and Services Companies in the United States
3.1.3 Control VariablesIn this study, control variables are firm size, R&D expenses and executive compensation.
Firm sizeFirm size is an important control variable that influences the payments of CEOs, a
relationship that is examined extensively by many researchers (Jensen and Murphy, 1990;
Gregg et al., 1993; Bliss and Rosen, 2001). It is expected that managers in larger firms will
receive higher payments because of the higher degree of complexity of their duties. Every
industry has an optimal firm’s size based on its particular production technologies, including
capital intensities and scale economies (Kumar et al., 2001). All executive compensation
relevant literature includes firm size as a control variable, but measures it in different ways.
For example, Mishra and Nielsen (2000) used total capital, while Mengistae and Xu (2002)
used current sales. Furthermore, Brunelloa et al. (2001) used both revenue and employment as
size measures. This study uses the logarithm of sales turnover to measure size.
3.2 Data CollectionThe data used in this study were collected from Wharton Research Data Services system.
More specifically, our data consists of all manufacturing and services firms listed on the
COMPUSTAT ExecuCOMP Annual Compensation Database and the COMPUSTAT
Fundamentals Annual files from 2000 to 2014. To measure executive compensation, I used
total compensation (TDC1) which includes salary, bonus, other annual, total value of
restricted stock granted, total value of stock options granted (using Black-Scholes), long-term
incentive payouts and all other total. To measure R&D expenses, I used all costs incurred
during the year that relate to the development of new products or services (XRD). For
measuring firm performance, I used ROA by dividing net income (NI) with total assets (AT).
Finally, to measure firm size, I used net sales turnover (SALE).
The impact of executive compensation and R&D expenses on firm performance for all U.S.
manufacturing and services firms (including banks and other financial services companies) is
compared. I selected the companies based on their SIC (Standard Industrial Classification)
code. Particularly, I used all manufacturing firms that have a SIC code between 2000 and
3990 (analytical manufacturing companies with their SIC codes are listed in Table 2 in the
Appendix) and all services companies that have a SIC code between 6012 and 8900
(analytical services companies with their SIC codes are listed in Table 3 in the Appendix).
Lastly, my sample period is from 2000 until 2014, as I want to examine this effect in this time
25

The Impact of Executive Compensation and R&D Expenses on Firm Performance: A Comparison between Manufacturing and Services Companies in the United States
during which took place some of the most important political, economic and more events. For
example, the September 11 attacks in 2001 which shook among others the U.S. economy, the
introduction of the euro in 2002 as a competitive to the dollar currency and the 2008 Global
Financial Crisis.
3.3 MethodologyIn this section I will present how I am going to test my hypotheses about the relationship
between the executive compensation and firm performance on the one hand and R&D
expenses and firm performance on the other hand. My model is based on the basic model
analysis of compensation (Doucouliagos et al., 2007; Zhou et al, 2011), which is an Ordinary
Least Squares (OLS) analysis. This will be used to run the following regression:
PERF¿=β0+β1∗¿¿¿+β2∗R∧D ¿+β3∗PAY ¿+ε ¿¿
where PAY ¿ and R∧D¿ represents the executive compensation and the research and
development expenses for company i (manufacturing or services company) in year t. ¿¿¿¿
represents the size of each company measured in terms of sales turnover (operating expenses).
PERF¿ represents the performance of each company i in year t. Finally, ε ¿ represent the error
term.
Additionally, to measure the interaction effects in H4a-H5b, I will modify my regression
model, so as to include the interaction terms:
PERF¿=β0+β1∗R∧D¿+ β2∗PAY ¿+ β3∗¿¿¿+β4∗PAY ¿∗¿¿¿+ε¿¿¿
PERF¿=β0+β1∗PAY ¿+β2∗R∧D¿+ β3∗¿¿¿+β4∗R∧D¿∗¿¿¿+ε¿¿¿
where PAY ¿, R∧D¿, ¿¿¿ , PERF¿¿ and ε ¿ represent the same as before. PAY ¿∗¿¿¿¿ and
R∧D¿∗¿¿¿¿ represent the interaction effects between executive compensation and firm size
and R&D expenses and firm size respectively. Here ¿¿¿¿ is the moderating variable.
4. Empirical ResultsIn this chapter, I am presenting the results for the relations that I examine, based on statistical
tests. In the beginning, I will analyze the descriptive statistics and the Pearson correlation
matrices, while in the end I will present the results of my regression analysis, followed by the
acceptance or rejection of my hypotheses.
26
The Impact of Executive Compensation and R&D Expenses on Firm Performance: A Comparison between Manufacturing and Services Companies in the United States
4.1 Descriptive StatisticsTable 4 reports summary statistics for the key variables for manufacturing and services firms
used in this study. Panel A reports mean, median, standard deviation, minimum and
maximum values of return on assets, total executive compensation, research and development
expenses and sales turnover for manufacturing companies while Panel B for services
companies. As it is observed, in both Panels the variables that represent total executive
compensation, research and development expenses and sales turnover are substantially
skewed to the right with a mean significantly greater than the median. This skewness can be
described as asymmetry in a statistical distribution.
TABLE 4 - Summary statistics
Panel A: Descriptive Statistics for Manufacturing Companies
Variables Mean MedianStandard
DeviationMinimum Maximum
ROA 0.05 0.06 0.66 -8.63 24.09
TotalExComp 2,625.84 1,381.38 4,556.13 0.00 377,996.50
RDExp 407.48 57.80 1,160.48 0.03 12,183.00
SaleTurn 9,358.28 1,991.14 29,040.42 0.04 433,526.00
Panel B: Descriptive Statistics for Services Companies
Variables Mean MedianStandard
DeviationMinimum Maximum
ROA 0.02 0.05 0.21 -2.00 0.84
TotalExComp 2,699.01 1,262.59 5,778.70 0.00 120,060.70
RDExp 386.48 62.52 1,224.45 0.10 9,811.00
SaleTurn 3,841.24 756.87 13,297.23 1.74 106,916.00The examined samples consists of 22,442 manufacturing and 4,828 services firm-year observations from 2000
to 2014 respectively. Data about executive compensation, research and development expenses and sales
turnover for the examined period are collected from Compustat Execucomp and Compustat Annual
Fundamentals. ROA was constructed using data obtained from Compustat Annual Fundamental database.
Total compensation (TDC1 data item on Execucomp) includes salary, bonus, other annual, total value of
restricted stock granted, total value of stock options granted (using Black-Scholes), long-term incentive
payouts and all other total and referred to the total compensation of the top executives of manufacturing firms.
27

The Impact of Executive Compensation and R&D Expenses on Firm Performance: A Comparison between Manufacturing and Services Companies in the United States
Following Core and Guay (1999) and Karuna (2007) I will use logarithmic transformation to
mitigate this positive skewness. Table 5 present the new summary statistics for ROA and the
logarithms of the rest of the key variables. Panel A and Panel B report mean, median,
standard deviation, minimum and maximum values of return on assets, the logarithm of total
executive compensation, the logarithm of R&D expenses and the logarithm of sales turnover
for manufacturing and services companies respectively. It is observed that the mean and the
median values are much closer than before, which practically means that now the distribution,
is more normal.
TABLE 5 - Summary statistics (logarithmic transformation)
Panel A: Descriptive Statistics (logarithmic transformation) for Manufacturing Companies
Variables Mean MedianStandard
DeviationMinimum Maximum
ROA 0.05 0.06 0.66 -8.63 24.09
TotalExComp_log 7.29 7.23 1.07 -6.91 12.84
RDExp_log 4.21 4.07 1.86 -3.47 9.41
SaleTurn_log 7.60 7.60 1.81 -3.12 12.98
Panel B: Descriptive Statistics (logarithmic transformation) for Services Companies
Variables Mean MedianStandard
DeviationMinimum Maximum
ROA 0.02 0.05 0.21 -2.00 0.84
TotalExComp_log 7.19 7.14 1.23 -6.91 11.70
RDExp_log 4.30 4.14 1.74 -2.30 9.19
SaleTurn_log 6.61 6.63 1.63 0.55 11.58The examined samples consists of 22,442 manufacturing and 4,828 services firm-year observations from 2000
to 2014 respectively. Data about executive compensation, research and development expenses and sales
turnover for the examined period are collected from Compustat Execucomp and Compustat Annual
Fundamentals. ROA was constructed using data obtained from Compustat Annual Fundamental database.
Total compensation (TDC1 data item on Execucomp) includes salary, bonus, other annual, total value of
restricted stock granted, total value of stock options granted (using Black-Scholes), long-term incentive
payouts and all other total and referred to the total compensation of the top executives of manufacturing firms.
28
The Impact of Executive Compensation and R&D Expenses on Firm Performance: A Comparison between Manufacturing and Services Companies in the United States
4.2 Pearson Correlation MatrixTable 6 presents the Pearson correlation matrix for the main explanatory variables used in the
regression analysis. These are total executive compensation (TotalExComp_log), research and
development expenses (RDExp_log) and firm size in terms of sales turnover (SaleTurn_log).
Panel A reports the results for manufacturing firms, whereas Panel B shows he results for
services companies. In both Panels, there are high correlations among all explanatory
variables.
More specifically, for the manufacturing firms the correlation between TotalExComp_log and
RDExp_log is 0.58 and for the services companies the same correlation is 0.48. The fact that
the coefficient for manufacturing firms is greater than the one for services companies denotes
that this impact is a bit larger in companies of the manufacture sector.
Continuously, the positive and significant coefficients between TotalExComp_log and
SaleTurn_log for both manufacturing (0.61) and services (0.50) companies demonstrate that
larger firms have the economic capacity to pay more their executives.
Finally, high correlations are documented also between RDExp_log and SaleTurn_log for
both manufacturing (0.70) and services (0.82) companies. The positive and significant
coefficients show that larger firms have greater economic capacity to invest in research and
development.
TABLE 6 - Pearson Correlation Matrices
Panel A: Manufacturing Companies
TotalExComp_log RDExp_log SaleTurn_log
TotalExComp_log 1.00
RDExp_log 0.58*** 1.00
SaleTurn_log 0.61*** 0.70*** 1.00
Panel B: Services Companies
TotalExComp_log RDExp_log SaleTurn_log
TotalExComp_log) 1.00
RDExp_log 0.48*** 1.00
SaleTurn_log 0.50*** 0.82*** 1.00Note: *,**,*** indicate significance at the 10%, 5% and 1% level respectively.
29

The Impact of Executive Compensation and R&D Expenses on Firm Performance: A Comparison between Manufacturing and Services Companies in the United States
4.3 Main FindingsThis study focuses on determining whether executive compensation and research and
development expenses affect differently manufacturing and services companies in the United
States. Table 7 reports the results of the regression analysis based on a log-log Ordinary Least
Squares (OLS) model. In general the results show that executive compensation and R&D
expenses affect firms’ performance.
To begin with, in manufacturing firms-sample the R-sq (R square) shows that 0.2% of the
variance of the response variable ROA is explained by this regression model. The coefficient
on TotalExComp_log is positive and significant (5% level) in this regression. Hence, I have
enough evidence to accept the alternative hypothesis H1a1: Executives’ compensation has a
significant positive association with the performance of a manufacturing enterprise in the
United States. Particularly, when TotalExComp_log increases the level of agreement with the
statement that I am using, ROA also increases. There is also a numerical interpretation for
this; that is, for an increase in the total compensation of executives by one unit there is on
average an increase in the value of the variable ROA of 0.0129 units.
Next, the coefficient on RDExp_log is significant but negative and positive when firm
performance is measured in terms of return on assets (ROA). This positive and significant
coefficient means that an increase in R&D expenses by one unit will lead to an increase in the
value of ROA by 0.0162 units. Based on these, I have enough evidence to accept the
alternative hypothesis H1a2: Research and development expenses have a significant positive
association with the performance of a manufacturing enterprise in the United States.
Furthermore, in services firms-sample the R-sq (R square) shows that 5.9% of the variance of
the response variable ROA is explained by this regression model. In this sample the
coefficient on TotalExComp_log is positive but not significant. Consequently, I do not have
enough evidence to accept the alternative hypothesis H1b1: Executives’ compensation has a
significant positive association with the performance of a service company in the United
States. This might be explained by the fact that some companies belonging to the services
sector, such as banks and other financial institutions, are regulated to a greater extent than
manufacturing companies. Hence, the pay-performance sensitivity is expected to be much
lower.
30

The Impact of Executive Compensation and R&D Expenses on Firm Performance: A Comparison between Manufacturing and Services Companies in the United States
Moreover, the coefficients of RDExp_log in the regression, is significant (1% level) but
negative. The negative coefficient means that as RDExp_log increases the level of agreement
with the statement that I am using, ROA decreases. The numerical interpretation for this is
that for an increase in R&D investments by one unit there is on average a decrease in the
value of the variable ROA of 0.0165 units. As a result, I cannot accept the alternative
hypothesis H1b2: Research and development expenses have a significant association with the
performance of a service company in the United States., despite the fact the coefficient is
significant.
Finally, based on all the aforementioned about executive compensation I have enough
evidence to accept H2: The significant positive association of executives’ compensation with
firm performance is bigger in manufacturing than in services companies in the United States.
As far as the second independent variable is concerned, the association between research and
development expenses and firm performance is also bigger in manufacturing than in services
companies. Based on these, I have enough evidence to accept H3: The significant positive
association of research and development expenses with firm performance is bigger in
manufacturing than in services companies in the United States.
TABLE 7 - Regression Analysis
Manufacturing Firms Services Firms
ROA ROA
SaleTurn_log -0.0263*** 0.0439***
(-7.12) (13.59)
RDExp_log 0.0162*** -0.0165***
(4.67) (-5.50)
TotalExComp_log 0.0129** 0.0002
(2.39) (0.07)
_cons 0.0880*** -0.203***
(2.71) (-10.84)
N 22,442 4,828
R-sq 0.002 0.059
Note: *,**,*** indicate significance at the 10%, 5% and 1% level respectively.
31

The Impact of Executive Compensation and R&D Expenses on Firm Performance: A Comparison between Manufacturing and Services Companies in the United States
4.4 Interaction EffectsIn this chapter, I will present the results of the regression analysis focusing on the interaction
effects between executive compensation and firm size and R&D expenses and firm size.
Table 8 below shows the interaction effect between executive compensation and firm size.
The positive and significant (1% level) coefficient of the interaction effect depicted through
the variable ExComp_SaleTurn for manufacturing companies stress that H4a: The impact of
executives’ compensation on the performance of a manufacturing company in the United
States should be greater in larger firms is accepted. This means that larger firms have the
economic capacity to pay more their executives. The same coefficient for services companies
in not significant, hence I have to reject H4b: The impact of executives’ compensation on the
performance of a service company in the United States should be greater in larger firms.
TABLE 8 – Interaction Effect between Executive Compensation and Firm Size
Manufacturing Firms Services Firms
ROA ROA
RDExp_log 0.0143*** -0.0166***
(4.10) (-5.52)
TotalExComp_log -0.1142*** -0.0046
(-6.76) (-0.46)
SaleTurn_log -0.1338*** 0.0392***
(-9.54) (3.89)
ExComp_SaleTurn 0.0154*** 0.0007
(7.95) (0.50)
_cons 0.9701*** -0.1689**
(8.39) (-2.39)
N 22,441 4,282
R-sq 0.005 0.060
Note: *,**,*** indicate significance at the 10%, 5% and 1% level respectively.
Table 9 shows the interaction effect between R&D expenses and firm size. The positive and
significant coefficients of the interaction effect depicted through the variable
32

The Impact of Executive Compensation and R&D Expenses on Firm Performance: A Comparison between Manufacturing and Services Companies in the United States
RDExp_SaleTurn for both manufacturing (0.0632) and services (0.0032) companies stress
that H5a and H5b (The impact of research and development expenses on the performance of a
manufacturing or service company respectively in the United States should be greater in
larger firms) stand.
TABLE 9 – Interaction Effect between R&D expenses and Firm Size
Manufacturing Firms Services Firms
ROA ROA
TotalExComp_log 0.0134** 0.0000
(2.47) (0.01)
RDExp_log -0.0364*** -0.0399***
(-3.54) (-6.42)
SaleTurn_log -0.0515*** 0.0293***
(-8.70) (6.24)
RDExp_SaleTurn 0.0632*** 0.0032***
(5.45) (4.30)
_cons 0.2807*** -0.1041***
(5.85) (-3.52)
N 22,442 4,282
R-sq 0.004 0.063
Note: *,**,*** indicate significance at the 10%, 5% and 1% level respectively.
The interaction results are quiet important for financial managers who are responsible for the
financial health of a company. Financial managers develop plans and strategies that set the
long-term financial goals of their companies. More specifically, the interaction effect between
executive compensation and firm size (for manufacturing companies) and the interaction
effect between R&D expenses and firm size (for both manufacturing and services companies)
are positive. Hence, these results provide financial managers with the opportunity to build
proper compensation and innovation (R&D) systems that will maximize firm performance
according to each company’s size.
33
The Impact of Executive Compensation and R&D Expenses on Firm Performance: A Comparison between Manufacturing and Services Companies in the United States
5. ConclusionThis study, based on empirically data, tries to answer the following question:
RQ: Does executive compensation and R&D expenses have a stronger impact
on the output of services firms than on manufacturing companies in the United
States?
With regard to the theory, this study shows that the relation between executive compensation
and the performance of manufacturing firms is positive, whereas the relation between
executive compensation and the performance of services companies does not exist at all. To
begin with, prior and more recent empirical studies provide contradictory results on the
relationship between executive compensation and firm performance. However, the vast
majority of the already existing literature stresses the positive impact of executive
compensation on firm performance. Researchers like Chaubey and Kulkarni (1988), Zajac
(1990) and Wallsten (1999) pointed out the strong, unbreakable link between these two
variables. Furthermore, Mehran (1995), Hubbard and Palia (1995) and Canarella and
Gasparyan (2008) found that the aforementioned relationship applies for both manufacturing
and services companies. These studies lead me to hypothesize that the more executives are
paid the better firm performance will be. The empirical results support this hypothesis for
manufacturing companies but not for services companies for which this association is neither
negative nor positive.
In this part it should be interesting to compare my results with some contradictory results of
the prior literature. More specifically, there are researchers like Firth et al. (2006),
Doucouliagos et al. (2007) and Zhou et al. (2011) that found no association between payments
and performance. The basic reason that my results differ from theirs is the different firm-
samples that we used. As far as the manufacturing-firm-sample is concerned, Doucouliagos et
al. (2007) and Zhou et al. (2011) were focused on banks which are characterized by a higher
degree of regulation, whereas Firth et al. (2006) used state owned companies. On the other
hand, in service-firm-sample there is not an association between executive payments and firm
performance. This could be possibly because this sample contains also banks and other
financial services companies.
Furthermore, this study finds that the relation between R&D expenses and the performance of
manufacturing firms is positive, while the same relation is negative for services companies.
34
The Impact of Executive Compensation and R&D Expenses on Firm Performance: A Comparison between Manufacturing and Services Companies in the United States
After a careful reviewing of the literature about the impact of R&D expenses on firm
performance, both prior and more recent literature show the positive impact that research and
development expense have on firm performance. Among the supporters of this positive
association are Hirschey and Weygandt (1985), Lev and Sougiannis (1999) and Cooper et al.
(2008), who are nevertheless emphasized on the future and not the present value of R&D
expenses on firm performance. In addition, according to Mansfield and Lee (1996) and Ehie
and Olibe (2010) both manufacturing and services companies use research and development
expenses to develop their products and services, hence their future returns. These studies lead
me to hypothesize that the more R&D expenses a company use the better firm performance
will be. The empirical results support this hypothesis for manufacturing companies but not for
services companies for which this association is negative.
Based on the results, executive compensation positively affects the performance of
manufacturing companies but it does not have an impact at all on the performance of services
companies. Additionally, R&D expenses have a positive impact on the performance of
manufacturing companies, but a negative one on the performance of services companies.
According to this research’s results, it is strongly supported that executive compensation
affect more the performance of manufacturing firms, as well as do R&D. Moreover, the
findings show that the impact of executive compensation on performance is going to be larger
in larger companies belonging in the manufacturing sector, while it seems that this association
does not apply for the services firms. Finally, the association between R&D expenses and
firm size is positive (for both manufacturing and services companies).
The results of this study are important to the large proportion of the American public that
owns shares in American manufacturing firms, as well as to foreign investors. Specifically, in
manufacturing companies the positive association between executive compensation and firm
performance on the one hand and R&D expenses and firm performance on the other hand
show that there is a chance for better management and higher profits. This indicates that these
associations implicate that policy-makers in manufacturing companies could create
compensation formulas to induce executives to attribute the best of their capabilities.
Moreover, they could create proper systems that would release funds for research and
development in order to obtain larger part in the economy. Unfortunately, for services
companies there is not an association between executive payments and firm performance.
35

The Impact of Executive Compensation and R&D Expenses on Firm Performance: A Comparison between Manufacturing and Services Companies in the United States
Possibly, because of the greater degree of regulation of the financial firms that belong to the
greater services-firms sample.
5.1 Limitations and Future ResearchThere are two limitations to this study. First, the classification of companies in only two
major industries: the manufacturing and the services companies. The problem here is that
companies that belong to one of the two categories may differ among them a lot. For example,
financial services companies are characterized from a higher degree of regulation, which lead
to a lower pay-performance sensitivity. This could alter significantly the results of this study
for other companies that belong also to the broader services industry. Another limitation is
that this study examines the impact of executive compensation and R&D expenses on
performance for a period of time. Hence the impact may not be quiet visible. By this I mean
that the examined impact may be more obvious if there was a comparison to the same impact
in another period of time.
These limitations may be overcome with further research in the future. More specifically, it
would be beneficiary to examine the same impact in industries with different classification.
For example, future research may focus on the impact of executive compensation on
automotive industry versus financial services industry. Moreover, a comparison of the
examined impact during different decades may reveal how much this impact increased.
Another interesting extension would be to examine the same impact but controlling for
different variables, such as leverage, tenure, etc.
36

The Impact of Executive Compensation and R&D Expenses on Firm Performance: A Comparison between Manufacturing and Services Companies in the United States
References
Artz, K. W., Norman, P. M., Hatfield, D. E., & Cardinal, L. B. (2010). A Longitudinal Study
of the Impact of R&D, Patents, and Product Innovation on Firm Performance. Journal
of Product Innovation Management, 27 (5), 725-740.
Ayaydin, H., & Karaaslan, İ. (2014). The Effect of Research and Development Investment on
Firms’ Financial Performance: Evidence from Manufacturing Firms in Turkey. The
Journal of Knowledge Economy & Knowledge Management, 9 (2), 23-39.
Barkema, H. G., & Gomez-Mejia, L. R. (1998). Managerial Gompensation and Firm
Performance: A General Research Framework. Academy of Management Journal, 41
(2), 135-145.
Bebchuk, L. A., Fried, J. M., & Walker, D. I. (2001). Executive Compensation in America:
Optimal Contracting or Extraction of Rents?. University of Chicago Law Review, 69,
751-846.
Bizjak, J. M., Brickley, J. A., & Coles, J. L. (1993). Stock-based incentive compensation and
investment behavior. Journal of Accounting and Economics, 16 (1), 349-372.
Black, F., & Scholes, M. (1973). The Pricing of Options and Corporate Liabilities. Journal of
Political Economy, 81 (3), 637-654.
Bliss, R. T., & Rosen, R. J. (2001). CEO compensation and bank mergers. Journal of
Financial Economics, 61 (1), 107-138.
Brick, I. E., Palmon, O., & Wald, J. K. (2006). CEO compensation, director compensation,
and firm performance: Evidence of cronyism?. Journal of Corporate Finance, 12 (3),
403-423.
Brown, J. S., Davison, L., & Hagel, J. III. (2010). The Best Way to Measure Company
Performance. Harvard Business Review, 81 (4), 70-9, 122.
Brunello, G., Graziano, C., & Parigi, B. (2001). Executive compensation and firm
performance in Italy. International Journal of Industrial Organization, 19 (1), 133-
161.
37
The Impact of Executive Compensation and R&D Expenses on Firm Performance: A Comparison between Manufacturing and Services Companies in the United States
Buck, T., Liu, X., & Skovoroda, R. (2008). Top executive pay and firm performance in
China. Journal of International Business Studies, 39 (5), 833-850.
Canarella, G., & Gasparyan, A. (2008). New insights into executive compensation and firm
performance: Evidence from a panel of “new economy” firms, 1996-2002.
Managerial Finance, 34 (8), 537-554.
Carroll, T. M., & Ciscel, D. H. (1982). The Effects of Regulation on Executive
Compensation. The Review of Economics and Statistics, 64 (3), 505-509.
Chaubey, M. D., & Kulkarni, M. S. (1988). Executive Compensation and Performance of
Firms. Managerial Finance, 14 (4), 14 - 18.
Chen, Y., & Jermias, J. (2014). Business strategy, executive compensation and firm
performance. Accounting & Finance, 54 (1), 113-134.
Cheng, H., Zhang, Y., & Chang, Y. (2006). An Empirical Study on the Relationship Between
R&D Inputs and Performance. Scientific management research, 110-113.
Cheng, S. (2004). R&D Expenditures and CEO Compensation. The Accounting Review, 79
(2), 305-328.
Chidambaran, N. K., & John, K. (2001). Managerial compensation, voluntary disclosure, and
large shareholder monitoring. working paper, New York University.
Cho, H. J., & Pucik, V. (2005). Relationship Between Innovativeness, Quality, Growth,
Profitability, and Market Value. Strategic Management Journal, 26 (6), 555-575.
Choi, J. P. (1993). Cooperative R&D with Product Market Competition. International Journal
of Industrial Organization, 11 (4), 553-571.
Choi, S., & Hasan, I. (2005) Ownership, Governance, and Bank Performance: Korean
Experience. Financial Markets, Institutions and Instruments, 14 (4), 215–242.
Cooper, M. J., Gulen, H., & Schill, M. J. (2008). Asset Growth and the Cross-Section. The
Journal of Finance, 63 (4), 1609-1651.
Core, J. E., Guay, W. R., & Larcker, D. F. (2003). Executive Equity, Compensation and
Incentives: A Survey. Economic Policy Review, 9 (1), 27-50.
38
The Impact of Executive Compensation and R&D Expenses on Firm Performance: A Comparison between Manufacturing and Services Companies in the United States
Core, J., & Guay, W. (1999). The Use of Equity Grants to Manage Optimal Equity Incentive
Levels. Journal of Accounting and Economics, 28 (2), 151–184.
Core, J., & Guay, W. (2002). Estimating the Value of Employee Stock Option Portfolios and
Their Sensitivities to Price and Volatility. Journal of Accounting Research, 40 (3),
613-630.
Coughlan, A. T., & Schmidt, R. M. (1985). Executive Compensation, Management Turnover,
and Firm Performance: An Empirical Investigation. Journal of Accounting and
Economics, 7 (1), 43–66.
Crépon, B., Duguet, E., & Mairesse, J. (1998). Research, Innovation, and Productivity: An
Econometric Analysis at the Firm Level. Economics of Innovation and New
Technology, 7 (2), 115-158.
Cyert, R. M., Kang, S.-H., & Kumar, P. (2002). Corporate Governance, Takeovers, and Top-
Management Compensation: Theory and Evidence, Management Science. 48 (4), 453–
469.
Daniel, N., Li, Y., & Naveen, L. (2013). No asymmetry in pay for luck. Working paper,
Drexel University.Available at http://dx.doi.org/10.2139/ssrn.2160015
DeCarolis, D.M., & Deeds, D.L. (1999). The Impact of Stocks and Flows of Organizational
Knowledge on Firm Performance: An Empirical Investigation of the Biotechnology
Industry. Strategic Management Journal, 20 (10), 953–968.
Donelson, D. C., & Resutek, R. J. (2012). The Effect of R&D on Future Returns and Earnings
Forecasts. Review of Accounting Studies, 17 (4), 848-876.
Doucouliagos, H., Haman, J., & Askary, S. (2007). Directors' Remuneration and Performance
in Australian Banking. Corporate Governance : An International Rreview, 15 (6),
1363-1383.
Drucker P. (2005). The Purpose of a Business. New Zealand Management, (September 1), 27.
Ehie, I. C., & Olibe, K. (2010). The Effect of R&D Investment on Firm Value: An
Examination of US Manufacturing and Service Industries. International Journal of
Production Economics, 128 (1), 127–135.
39

The Impact of Executive Compensation and R&D Expenses on Firm Performance: A Comparison between Manufacturing and Services Companies in the United States
Erickson, G., & Jacobson, R. (1992). Gaining Comparative Advantage Through Discretionary
Expenditures: The Returns to R&D and Advertising. Management Science, 38 (9),
1264 - 1279.
Firth, M., Fung, P. M., & Rui, O. M. (2006). Corporate Performance and CEO Compensation
in China. Journal of Corporate Finance, 12 (4), 693–714.
Friedman, H. H., & Friedman, L. W. (2010). Lessons from the Global Financial Meltdown of
2008. Journal of Financial Transformation, 28, 45-54.
Frydman, C. & Jenter, D. (2010). CEO Compensation. Review of Financial Economics,
Annual Reviews, 2 (1), 75-102.
Frydman, C., & Saks, R. E. (2010). Executive Compensation: A New View from a Long-
Term Perspective, 1936–2005. The Review of Financial Studies, 23 (5), 2099-2138
Frye, M. B. (2004). Equity-based Compensation for Employees: Firm Perforance and
Determinants. The Journal of Financial Research, 27 (1), 31-54.
Gaver, J. J., & Gaver, K. M. (1998). The relation between nonrecurring accounting
transactions and CEO cash compensation. The Accounting Review, 73, 235–253.
Greenstone, M., (2010). The Importance of Research and Development (R&D) for U.S.
Competitiveness and a Clean Energy Future. Testimony before the U.S. Senate Joint
Economic Committee, July 27th, 2010.
Gregg, P., Machin, S., & Szymanski, S. (1993). The Disappearing Relationship Between
Directors' Pay and Corporate Performance. British Journal of Industrial Relations, 31
(1), 1–9.
Halkos, G. E., & Tzeremes, N. G. (2007). Productivity Efficiency and Firm Size: An
Empirical Analysis of Foreign Owned Companies. International Business Review, 16
(6), 713–731.
Hayes R.H., and W.J. Abernathy. (1980). Economic Scene 'Results Now': Pay Later?. The
New York Times, (August 22).
Hirschey, M., & Pappas, J. L. (1981). Regulatory and Life Cycle Influences on Managerial
Incentives. Southern Economic Journal, 48 (2), 327-334.
40
The Impact of Executive Compensation and R&D Expenses on Firm Performance: A Comparison between Manufacturing and Services Companies in the United States
Hirschey, M., & Weygandt, J. J. (1985). Amortization Policy for Advertising and Research
and Development Expenditures. Journal of Accounting Research, 23 (1), 326-335.
Ho, Y. K., Keh, H. T., & Ong, J. M. (2005). The Effects of R&D and Advertising on Firm
Value: An Examination of Manufacturing and Non-manufacturing Firms. IEEE
Transactions on Engineering Management , 52 (1), 3 - 14.
Hsu, F.-J., Chen, M.-Y., Chen, Y.-C., & Wang, W.-C. (2013). An Empirical Study on the
Relationship between R&D and Financial Performance. Journal of Applied Finance &
Banking, 3 (5), 107-119.
Hua, S.Y., & Wemmerlov, U. (2006). Product Change Intensity, Product Advantage, and
Market Performance: An Empirical Investigation of the PC Industry. Journal of
Product Innovation Management, 23 (4), 316–329.
Hubbard, R. G., & Palia, D. (1995). Executive Pay and Performance Evidence from the U.S.
Banking Industry. Journal of Financial Economics, 39 (1), 105-130.
Iyengar, R. J. (2000). ‘CEO Compensation In Poorly Performing Firms’. Journal of Applied
Business Research, 16 (3), 1-28.
Jensen, M. C., & Murphy, K. J. (1990). Performance Pay and Top-Management Incentives.
Journal of Political Economy, 98 (2), 225-264.
John, K., & Qian, Y. (2003). Incentive Features in CEO Compensation in the Banking
Industry. Economic Policy Review, 9 (1), 109-121.
Karuna, C. (2007). Industry Product Market Competition and Managerial Incentives. Journal
of Accounting and Economics, 43 (2-3), 275–297.
Kirkland, Rik (2006, June 30). The Real CEO Pay Problem. Fortune, Retrieved July 29, 2015
From http://money.cnn.com/magazines/fortune/fortune_archive/2006/07/10/8380799/
index.htm
Knapp, M., Gart, A., & Becher, D. (2005). Post-Merger Performance of Bank Holding
Companies, 1987–1998. The Financial Review, 40, 549–574.
41

The Impact of Executive Compensation and R&D Expenses on Firm Performance: A Comparison between Manufacturing and Services Companies in the United States
Kubo, K., & Saito, T. (2008). The Relationship between Financial Incentives for Company
Presidents and Firm Performance in Japan. The Japanese Economic Review, 59 (4),
401–418.
Kumar, K. B., Rajan, R. G., & Zingales, L. (2001). What Determines Firm Size?. NBER
Working Paper Series. Available at: http://www.nber.org/papers/w7208 [last accessed:
13/02/2015]
Lev, B., & Sougiannis, T. (1999). Penetrating the Book-to-Market Black Box: The R&D
Effect. Journal of Business Finance & Accounting, 26 (3-4), 419–449.
Liang, L., & Zhang, H. (2005). An Empirical Study on the R&D Inputs Performance of High-
tech Enterprises. J.Cent. South University, 232-236.
Macey, J. R., & O’Hara, M. (2003). The Corporate Governance of Banks. Economic Policy
Review, 9 (1), 91-107.
Mansfield, E., & Lee, J.-Y. (1996). The Modern University: Contributor to Industrial
Innovation and Recipient of Industrial R&D Support. Research Policy, 25 (7), 1047–
1058.
Mehran, H. (1995). Executive Compensation Structure, Ownership, and Firm Performance.
Journal of Financial Economics, 38 (2), 163-184.
Mengistae, T., & Xu, L.C. (2004). Agency Theory and Executive Compensation: The Case of
Chinese State-Owned Enterprises. Journal of Labour Economics, 22 (3), 615-638.
Merton, R. C. (1973). An Intertemporal Capital Asset Pricing Model. Econometrica, 41 (5),
867-887.
Mishra, C. S., & Nielsen, J. F. (2000). Board Independence and Compensation Policies in
Large Banks Holding Companies. Financial Management, 29 (3), 51–70.
Motta, M. (1992). Cooperative R&D and Vertical Product Differentiation. International
Journal of Industrial Organization, 10 (4), 643–661.
Murphy, K. J. (1999). Executive Compensation. Handbook of Labor Economics, 3, 2485-
2563.
42

The Impact of Executive Compensation and R&D Expenses on Firm Performance: A Comparison between Manufacturing and Services Companies in the United States
Mulkay, B., Hall, B., & Mairesse, J. (2000). Firm Level Investement and R&D in France and
the United States: A Comparison. National Bureau of Economic Research Working
Paper 8038: Cambridge, MA.
Rosenkranz, S. (1995). Innovation and Cooperation under Vertical Product Differentiation.
International Journal of Industrial Organization, 13 (1), 1–22.
Prajogo, D.I. (2006). The Relationship between Innovation and Business Performance-A
Comparative Study between Manufacturing and Service Firms. Knowledge and
Process Management 13 (3), 218–225.
Roberts, P.W. (1999). Product Innovation, Product-Market Competition and Persistent
Profitability in the U.S. Pharmaceutical Industry. Strategic Management Journal 20
(7), 655–670.
Salavou, H. (2002). Profitability in Market‐Oriented SMEs: Does Product Innovation Matter?.
European Journal of Innovation Management, 5 (3), 164 - 171
Schaefer, S. (1998). The Dependence of Pay-Performance Sensitivity on the Size of the Firm.
The Review of Economics and Statistics, 80 (3), 436-443.
Shaw, K. W., & Zhang, M. H. (2010). Is CEO cash compensation punished for poor firm
performance?. The Accounting Review, 85 (3), 1065-1093.
Shen, C. H., & Chang, Y. H. (2006). Do Regulations Affect Banking Performance?
Government Governance May Matter. Contemporary Economic Policy, 24 (1), 92–
105.
Siebert, R. (1996): The Impact of Research Joint Ventures on Firm Performance: An
Empirical Assessment. WZB Discussion Paper, 4, 96-3
Sun, F., Wei, X., & Huang, X. (2013). CEO Compensation and Firm Performance. Review of
Accounting and Finance, 12 (3), 252 - 267.
Thomke, S. (2003). R&D Comes to Services. Bank of America's Pathbreaking Experiments.
Harvard Business Review, 81 (4), 70-9, 122.
Toivanen, O., Stoneman, P., & Bosworth, D. (2002). Innovation and the Market Value of UK
Firms, 1989–1995. Oxford Bulletin of Economics and Statistics, 64 (1), 39–61.
43

The Impact of Executive Compensation and R&D Expenses on Firm Performance: A Comparison between Manufacturing and Services Companies in the United States
Wakelin, K. (1998). Innovation and Export Behaviour at the Firm Level. Research Policy, 26
(7–8), 829–841.
Wallsten, S. J. (1999). 'Executive Compensation and Firm Performance: Big Carrot, Small
Stick'. United Nations World Employment Programme, SIEPR Policy paper (99-117),
San Francisco, California
Wang, C.-H. (2011). Clarifying the Effects of R&D on Performance: Evidence from the High
Technology Industries. Asia Pacific Management Review, 14 (1), 51-64.
Wei, G. (2000). Advanced Executive Incentive and the Listed Firm Performance. Chinese
Journal of Economic Research, (3), 32 – 39.
Zajac, E. J. (1990). CEO Selection, Succession, Compensation and Firm Performance: A
Theoretical Integration and Empirical Analysis. Strategic Management Journal, 11
(3), 217-230.
Zhou, M., Yi, J., & Park, T. (2009). Commonalities and Differences between Service and
Manufacturing Supply Chains: Combining Operations Management Studies with
Supply Chain Management. California Journal of Operations Management, 7 (1),
136-143.
Zhou, W., Georgakopoulos, G., Sotiropoulos, I., & Vasileiou, K. Z. (2011). The Impact of
Executive Payment on Firm Performance of the Financial Enterprises in China. Asian
Social Science, 7 (8), 65-80.
44
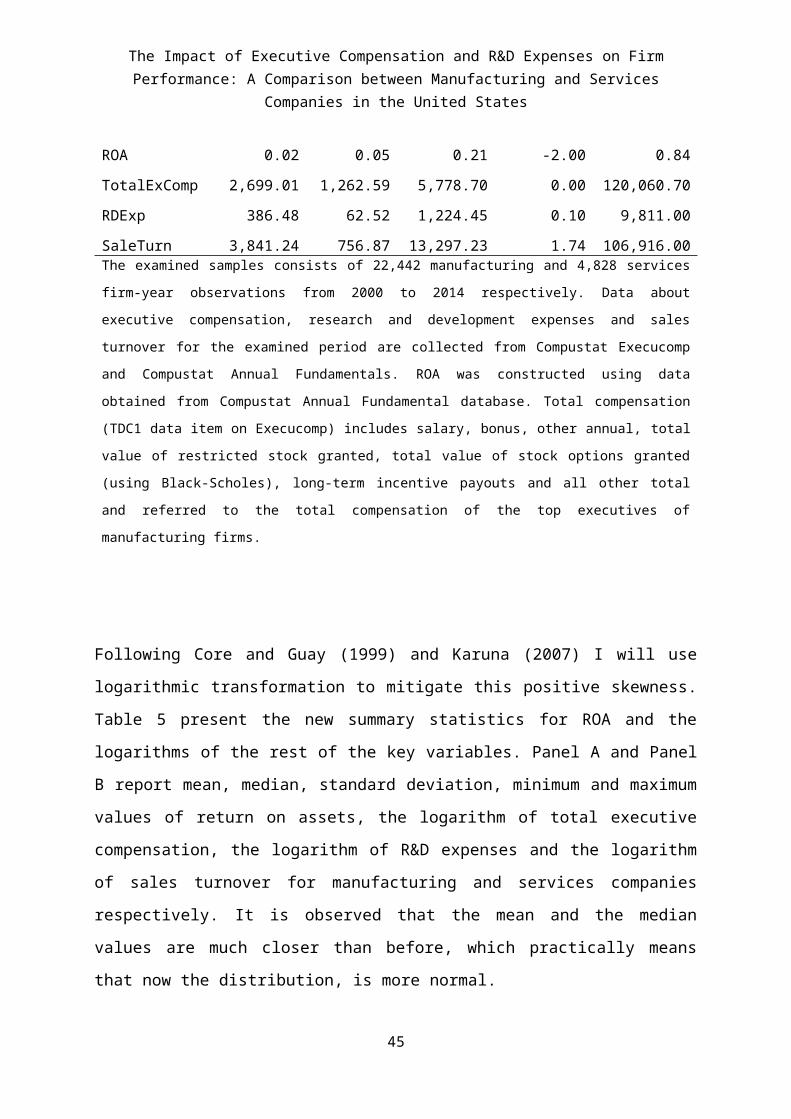
The Impact of Executive Compensation and R&D Expenses on Firm Performance: A Comparison between Manufacturing and Services Companies in the United States
Appendix
TABLE 1 - Definition and Measurement of Variables
Variable Name Definition Category Measurement
ROA Return on Assets Dependent Variable The return on assets of each firm
TotalExComp_log Total Executive Compensation
Independent Variable (control variable)
The natural logarithm of total executive compensation
RDExp_logResearch and development
expenses
Independent Variable (control variable)
The natural logarithm of research and development
expenses of each firm
SaleTurn_log Sales Turnover Control Variable (Moderator Variable)
The natural logarithm of sales turnover of each firm
ExComp_SaleTurnTotal Executive Compensation * Sales Turnover
Interaction EffectThe interaction effect
between executive payments and firm size
RDExp_SaleTurn R&D expenses * Sales Turnover Interaction Effect
The interaction effect between R&D expenses and
firm size
TABLE 2
SIC codes of manufacturing companies and their description
2000 Food and Kindred Products
2011 Meat Packing Plants
2013 Sausages & Other Prepared Meat Products
2015 Poultry Slaughtering and Processing
2020 Dairy Products
2024 Ice Cream & Frozen Desserts
2030 Canned, Frozen & Preserved Fruit, Veg & Food Specialties
2033 Canned, Fruits, Veg, Preserves, Jams & Jellies
2040 Grain Mill Products
2050 Bakery Products
2052 Cookies & Crackers
2060 Sugar & Confectionery Products
2070 Fats & Oils
2080 Beverages
2082 Malt Beverages
45

The Impact of Executive Compensation and R&D Expenses on Firm Performance: A Comparison between Manufacturing and Services Companies in the United States
2086 Bottled & Canned Soft Drinks & Carbonated Waters
2090 Miscellaneous Food Preparations & Kindred Products
2092 Prepared Fresh or Frozen Fish & Seafood
2100 Tobacco Products
2111 Cigarettes
2200 Textile Mill Products
2211 Broadwoven Fabric Mills, Cotton
2221 Broadwoven Fabric Mills, Man Made Fiber & Silk
2250 Knitting Mills
2253 Knit Outerwear Mills
2273 Carpets & Rugs
2300 Apparel & Other Finished Prods of Fabrics & Similar Matl
2320 Men's & Boys' Furnishings, Work Clothing, & Allied Garments
2330 Women's, Misses', and Juniors Outerwear
2340 Women's, Misses', Children's & Infant's Undergarments
2390 Miscellaneous Fabricated Textile Products
2400 Lumber & Wood Products (No Furniture)
2421 Sawmills & Planing Mills, General
2430 Millwood, Veneer, Plywood, & Structural Wood Members
2451 Mobile Homes
2452 Prefabricated Wood Bldgs & Components
2510 Household Furniture
2511 Wood Household Furniture, (No Upholstered)
2520 Office Furniture
2522 Office Furniture (No Wood)
2531 Public Bldg & Related Furniture
2540 Partitions, Shelvg, Lockers, & office & Store Fixtures
2590 Miscellaneous Furniture & Fixtures
2600 Papers & Allied Products
2611 Pulp Mills
46

The Impact of Executive Compensation and R&D Expenses on Firm Performance: A Comparison between Manufacturing and Services Companies in the United States
2621 Paper Mills
2631 Paperboard Mills
2650 Paperboard Containers & Boxes
2670 Converted Paper & Paperboard Prods (No Containers/Boxes)
2673 Plastics, Foil & Coated Paper Bags
2711 Newspapers: Publishing or Publishing & Printing
2721 Periodicals: Publishing or Publishing & Printing
2731 Books: Publishing or Publishing & Printing
2732 Book Printing
2741 Miscellaneous Publishing
2750 Commercial Printing
2761 Manifold Business Forms
2771 Greeting Cards
2780 Blankbooks, Looseleaf Binders & Bookbinding & Related Work
2790 Service Industries For The Printing Trade
2800 Chemicals & Allied Products
2810 Industrial Inorganic Chemicals
2820 Plastic Material, Synth Resin/Rubber, Cellulos (No Glass)
2821 Plastic Materials, Synth Resins & Nonvulcan Elastomers
2833 Medicinal Chemicals & Botanical Products
2834 Pharmaceutical Preparations
2835 In Vitro & In Vivo Diagnostic Substances
2836 Biological Products, (No Diagnostic Substances)
2840 Soap, Detergents, Cleaning Preparations, Perfumes, Cosmetics
2842 Specialty Cleaning, Polishing and Sanitation Preparations
2844 Perfumes, Cosmetics & Other Toilet Preparations
2851 Paints, Varnishes, Lacquers, Enamels & Allied Prods
2860 Industrial Organic Chemicals
2870 Agricultural Chemicals
2890 Miscellaneous Chemical Products
47
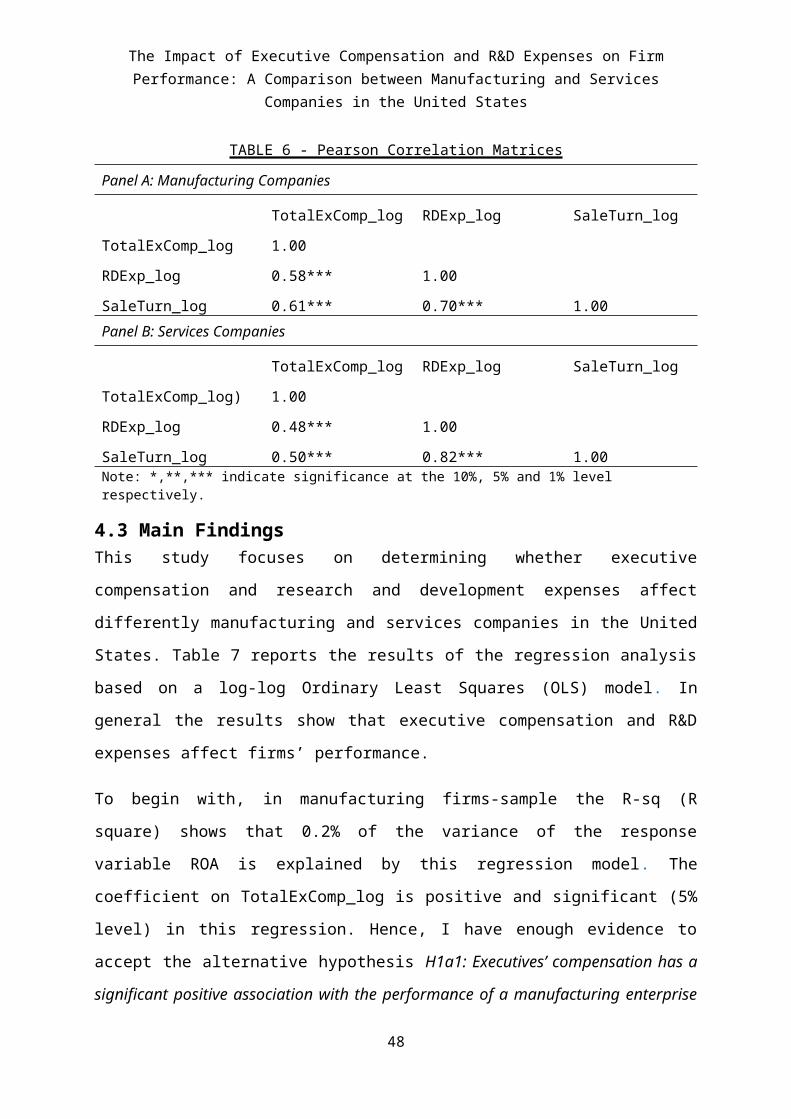
The Impact of Executive Compensation and R&D Expenses on Firm Performance: A Comparison between Manufacturing and Services Companies in the United States
2891 Adhesives & Sealants
2911 Petroleum Refining
2950 Asphalt Paving & Roofing Materials
2990 Miscellaneous Products of Petroleum & Coal
3011 Tires & Inner Tubes
3021 Rubber & Plastics Footwear
3050 Gaskets, Packg & Sealg Devices & Rubber & Plastics Hose
3060 Fabricated Rubber Products, NEC
3080 Miscellaneous Plastics Products
3081 Unsupported Plastics Film & Sheet
3086 Plastics Foam Products
3089 Plastics Products, NEC
3100 Leather & Leather Products
3140 Footwear, (No Rubber)
3211 Flat Glass
3220 Glass & Glassware, Pressed or Blown
3221 Glass Containers
3231 Glass Products, Made of Purchased Glass
3241 Cement, Hydraulic
3250 Structural Clay Products
3260 Pottery & Related Products
3270 Concrete, Gypsum & Plaster Products
3272 Concrete Products, Except Block & Brick
3281 Cut Stone & Stone Products
3290 Abrasive, Asbestos & Misc Nonmetallic Mineral Prods
3310 Steel Works, Blast Furnaces & Rolling & Finishing Mills
3312 Steel Works, Blast Furnaces & Rolling Mills (Coke Ovens)
3317 Steel Pipe & Tubes
3320 Iron & Steel Foundries
3330 Primary Smelting & Refining of Nonferrous Metals
48

The Impact of Executive Compensation and R&D Expenses on Firm Performance: A Comparison between Manufacturing and Services Companies in the United States
3334 Primary Production of Aluminum
3341 Secondary Smelting & Refining of Nonferrous Metals
3350 Rolling Drawing & Extruding of Nonferrous Metals
3357 Drawing & Insulating of Nonferrous Wire
3360 Nonferrous Foundries (Castings)
3390 Miscellaneous Primary Metal Products
3411 Metal Cans
3412 Metal Shipping Barrels, Drums, Kegs & Pails
3420 Cutlery, Handtools & General Hardware
3430 Heating Equip, Except Elec & Warm Air; & Plumbing Fixtures
3433 Heating Equipment, Except Electric & Warm Air Furnaces
3440 Fabricated Structural Metal Products
3442 Metal Doors, Sash, Frames, Moldings & Trim
3443 Fabricated Plate Work (Boiler Shops)
3444 Sheet Metal Work
3448 Prefabricated Metal Buildings & Components
3451 Screw Machine Products
3452 Bolts, Nuts, Screws, Rivets & Washers
3460 Metal Forgings & Stampings
3470 Coating, Engraving & Allied Services
3480 Ordnance & Accessories, (No Vehicles/Guided Missiles)
3490 Miscellaneous Fabricated Metal Products
3510 Engines & Turbines
3523 Farm Machinery & Equipment
3524 Lawn & Garden Tractors & Home Lawn & Gardens Equip
3530 Construction, Mining & Materials Handling Machinery & Equip
3531 Construction Machinery & Equip
3532 Mining Machinery & Equip (No Oil & Gas Field Mach & Equip)
3533 Oil & Gas Field Machinery & Equipment
3537 Industrial Trucks, Tractors, Trailers & Stackers
49
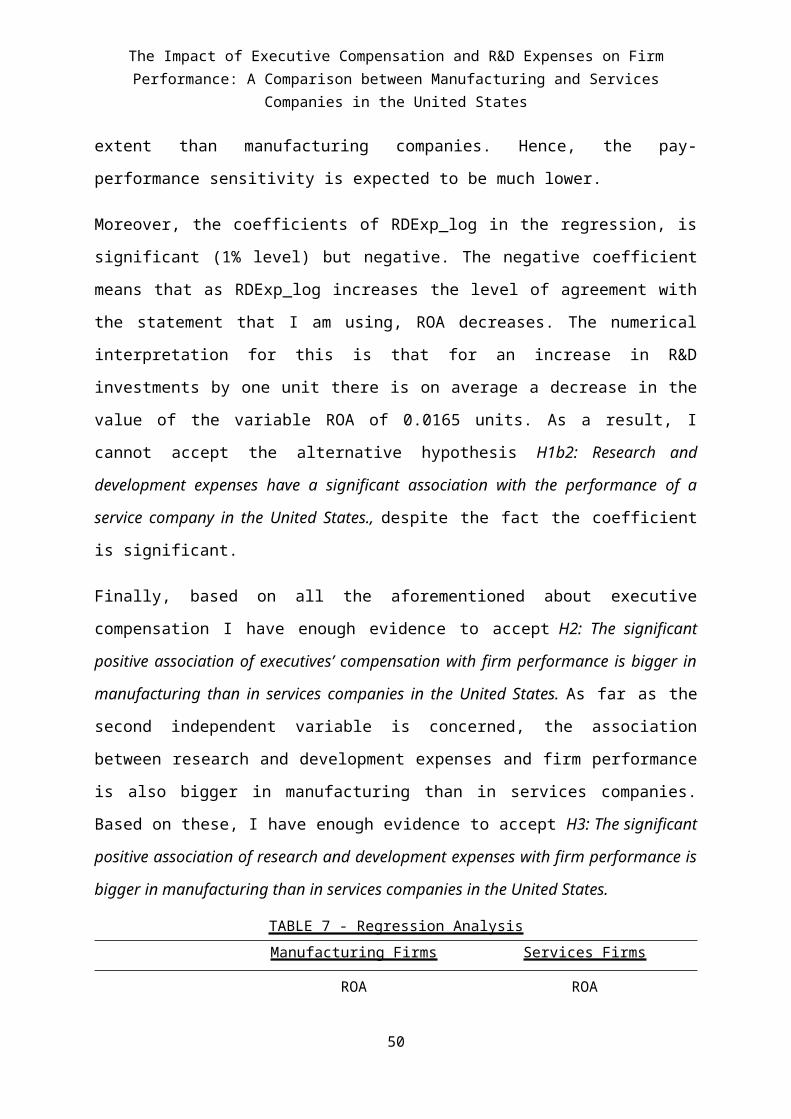
The Impact of Executive Compensation and R&D Expenses on Firm Performance: A Comparison between Manufacturing and Services Companies in the United States
3540 Metalworkg Machinery & Equipment
3541 Machine Tools, Metal Cutting Types
3550 Special Industry Machinery (No Metalworking Machinery)
3555 Printing Trades Machinery & Equipment
3559 Special Industry Machinery, NEC
3560 General Industrial Machinery & Equipment
3561 Pumps & Pumping Equipment
3562 Ball & Roller Bearings
3564 Industrial & Commercial Fans & Blowers & Air Purifying Equip
3567 Industrial Process Furnaces & Ovens
3569 General Industrial Machinery & Equipment, NEC
3570 Computer & office Equipment
3571 Electronic Computers
3572 Computer Storage Devices
3575 Computer Terminals
3576 Computer Communications Equipment
3577 Computer Peripheral Equipment, NEC
3578 Calculating & Accounting Machines (No Electronic Computers)
3579 Office Machines, NEC
3580 Refrigeration & Service Industry Machinery
3585 Air-Cond & Warm Air Heatg Equip & Comm & Indl Refrig Equip
3590 Misc Industrial & Commercial Machinery & Equipment
3600 Electronic & Other Electrical Equipment (No Computer Equip)
3612 Power, Distribution & Specialty Transformers
3613 Switchgear & Switchboard Apparatus
3620 Electrical Industrial Apparatus
3621 Motors & Generators
3630 Household Appliances
3634 Electric Housewares & Fans
3640 Electric Lighting & Wiring Equipment
50

The Impact of Executive Compensation and R&D Expenses on Firm Performance: A Comparison between Manufacturing and Services Companies in the United States
3651 Household Audio & Video Equipment
3652 Phonograph Records & Prerecorded Audio Tapes & Disks
3661 Telephone & Telegraph Apparatus
3663 Radio & TV Broadcasting & Communications Equipment
3669 Communications Equipment, NEC
3670 Electronic Components & Accessories
3672 Printed Circuit Boards
3674 Semiconductors & Related Devices
3677 Electronic Coils, Transformers & Other Inductors
3678 Electronic Connectors
3679 Electronic Components, NEC
3690 Miscellaneous Electrical Machinery, Equipment & Supplies
3695 Magnetic & Optical Recording Media
3711 Motor Vehicles & Passenger Car Bodies
3713 Truck & Bus Bodies
3714 Motor Vehicle Parts & Accessories
3715 Truck Trailers
3716 Motor Homes
3720 Aircraft & Parts
3721 Aircraft
3724 Aircraft Engines & Engine Parts
3728 Aircraft Parts & Auxiliary Equipment, NEC
3730 Ship & Boat Building & Repairing
3743 Railroad Equipment
3751 Motorcycles, Bicycles & Parts
3760 Guided Missiles & Space Vehicles & Parts
3790 Miscellaneous Transportation Equipment
3812 Search, Detection, Navigation, Guidance, Aeronautical Sys
3821 Laboratory Apparatus & Furniture
3822 Auto Controls For Regulating Residential & Comml Environments
51

The Impact of Executive Compensation and R&D Expenses on Firm Performance: A Comparison between Manufacturing and Services Companies in the United States
3823 Industrial Instruments For Measurement, Display, and Control
3824 Totalizing Fluid Meters & Counting Devices
3825 Instruments For Meas & Testing of Electricity & Elec Signals
3826 Laboratory Analytical Instruments
3827 Optical Instruments & Lenses
3829 Measuring & Controlling Devices, NEC
3841 Surgical & Medical Instruments & Apparatus
3842 Orthopedic, Prosthetic & Surgical Appliances & Supplies
3843 Dental Equipment & Supplies
3844 X-Ray Apparatus & Tubes & Related Irradiation Apparatus
3845 Electromedical & Electrotherapeutic Apparatus
3851 Ophthalmic Goods
3861 Photographic Equipment & Supplies
3873 Watches, Clocks, Clockwork Operated Devices/Parts
3910 Jewelry, Silverware & Plated Ware
3911 Jewelry, Precious Metal
3931 Musical Instruments
3942 Dolls & Stuffed Toys
3944 Games, Toys & Children's Vehicles (No Dolls & Bicycles)
3949 Sporting & Athletic Goods, NEC
3950 Pens, Pencils & Other Artists' Materials
3960 Costume Jewelry & Novelties
3990 Miscellaneous Manufacturing Industries
TABLE 3
SIC codes of services firms and their description
6012 Pay Day Lenders
6021 National Commercial Banks
6022 State Commercial Banks
6029 Commercial Banks, NEC
52

The Impact of Executive Compensation and R&D Expenses on Firm Performance: A Comparison between Manufacturing and Services Companies in the United States
6035 Savings Institution, Federally Chartered
6036 Savings Institutions, Not Federally Chartered
6099 Functions Related To Depository Banking, NEC
6111 Federal & Federally Sponsored Credit Agencies
6141 Personal Credit Institutions
6153 Short-Term Business Credit Institutions
6159 Miscellaneous Business Credit Institution
6162 Mortgage Bankers & Loan Correspondents
6163 Loan Brokers
6172 Finance Lessors
6189 Asset-Backed Securities
6199 Finance Services
6200 Security & Commodity Brokers, Dealers, Exchanges & Services
6211 Security Brokers, Dealers & Flotation Companies
6221 Commodity Contracts Brokers & Dealers
6282 Investment Advice
6311 Life Insurance
6321 Accident & Health Insurance
6324 Hospital & Medical Service Plans
6331 Fire, Marine & Casualty Insurance
6351 Surety Insurance
6361 Title Insurance
6399 Insurance Carriers, NEC
6411 Insurance Agents, Brokers & Service
6500 Real Estate
6510 Real Estate Operators (No Developers) & Lessors
6512 Operators of Nonresidential Buildings
6513 Operators of Apartment Buildings
6519 Lessors of Real Property, NEC
6531 Real Estate Agents & Managers (For Others)
53

The Impact of Executive Compensation and R&D Expenses on Firm Performance: A Comparison between Manufacturing and Services Companies in the United States
6532 Real Estate Dealers (For Their Own Account)
6552 Land Subdividers & Developers (No Cemeteries)
6770 Blank Checks
6792 Oil Royalty Traders
6794 Patent Owners & Lessors
6795 Mineral Royalty Traders
6798 Real Estate Investment Trusts
6799 Investors, NEC
7000 Hotels, Rooming Houses, Camps & Other Lodging Places
7011 Hotels & Motels
7200 Services-Personal Services
7310 Services-Advertising
7311 Services-Advertising Agencies
7320 Services-Consumer Credit Reporting, Collection Agencies
7330 Services-Mailing, Reproduction, Commercial Art & Photography
7331 Services-Direct Mail Advertising Services
7334 Services-Photocopying and Duplicating Services
7340 Services-To Dwellings & Other Buildings
7350 Services-Miscellaneous Equipment Rental & Leasing
7359 Services-Equipment Rental & Leasing, NEC
7361 Services-Employment Agencies
7363 Services-Help Supply Services
7370 Services-Computer Programming, Data Processing, Etc.
7371 Services-Computer Programming Services
7372 Services-Prepackaged Software
7373 Services-Computer Integrated Systems Design
7374 Services-Computer Processing & Data Preparation
7377 Services-Computer Rental & Leasing
7380 Services-Miscellaneous Business Services
7381 Services-Detective, Guard & Armored Car Services
54

The Impact of Executive Compensation and R&D Expenses on Firm Performance: A Comparison between Manufacturing and Services Companies in the United States
7384 Services-Photofinishing Laboratories
7385 Services-Telephone Interconnect Systems
7389 Services-Business Services, NEC
7500 Services-Automotive Repair, Services & Parking
7510 Services-Auto Rental & Leasing (No Drivers)
7600 Services-Miscellaneous Repair Services
7812 Services-Motion Picture & Video Tape Production
7819 Services-Allied To Motion Picture Production
7822 Services-Motion Picture & Video Tape Distribution
7829 Services-Allied To Motion Picture Distribution
7830 Services-Motion Picture Theaters
7841 Services-Video Tape Rental
7900 Services-Amusement & Recreation Services
7948 Services-Racing, Including Track Operation
7990 Services-Miscellaneous Amusement & Recreation
7994 Services-Video Game Arcades
7995 Services-Gambling Transactions
7996 Services-Amusement Parks
7997 Services-Membership Sports & Recreation Clubs
8000 Services-Health Services
8011 Services-Offices & Clinics of Doctors of Medicine
8050 Services-Nursing & Personal Care Facilities
8051 Services-Skilled Nursing Care Facilities
8060 Services-Hospitals
8062 Services-General Medical & Surgical Hospitals, NEC
8071 Services-Medical Laboratories
8082 Services-Home Health Care Services
8090 Services-Misc Health & Allied Services, NEC
8093 Services-Specialty Outpatient Facilities, NEC
8111 Services-Legal Services
55

The Impact of Executive Compensation and R&D Expenses on Firm Performance: A Comparison between Manufacturing and Services Companies in the United States
8200 Services-Educational Services
8300 Services-Social Services
8351 Services-Child Day Care Services
8600 Services-Membership organizations
8700 Services-Engineering, Accounting, Research, Management
8711 Services-Engineering Services
8731 Services-Commercial Physical & Biological Research
8734 Services-Testing Laboratories
8741 Services-Management Services
8742 Services-Management Consulting Services
8744 Services-Facilities Support Management Services
8748 Business Consulting Services, Not Elsewhere Classified
8880 American Depositary Receipts
8888 Foreign Governments
8900 Services-Services, NEC
56


![Veterans Benefits: Compensation & · PDF file[VETERANS BENEFITS: COMPENSATION & PENSION] ... Osteitis deformans (Paget’s disease). Osteomalacia. Palsy, bulbar. Paralysis agitans.](https://static.fdocuments.net/doc/165x107/5a7353817f8b9aa2538e908e/veterans-benefits-compensation-pensioncymcdncomsites-veterans-benefits.jpg)