Foundation Expenses and Compensation - Urban Institute
68
The Urban Institute Foundation Expenses & Compensation How Operating Characteristics Influence Spending Authors Elizabeth T. Boris, Principal Investigator, Center on Nonprofits and Philanthropy, The Urban Institute Loren Renz, Principal Investigator, The Foundation Center Asmita Barve, The Foundation Center Mark A. Hager, The Urban Institute George Hobor, The Urban Institute Contributors Amy Brimer, The Urban Institute Charles E. McLean, GuideStar o R
Transcript of Foundation Expenses and Compensation - Urban Institute

The UrbanInstitute
Foundation Expenses & CompensationHow Operating Characteristics Influence Spending
AuthorsElizabeth T. Boris, Principal Investigator, Center on Nonprofits and Philanthropy, The Urban InstituteLoren Renz, Principal Investigator, The Foundation CenterAsmita Barve, The Foundation CenterMark A. Hager, The Urban Institute
George Hobor, The Urban Institute
ContributorsAmy Brimer, The Urban InstituteCharles E. McLean, GuideStar
o
R
Copyright © 2006. The Urban Institute, the Foundation Center, and Philanthropic Research, Inc.
Foundation Expenses & CompensationHow Operating Characteristics Infl uence Spending

Copyright © 2006. The Urban Institute, the Foundation Center, and Philanthropic Research, Inc.All rights reserved. Conclusions and interpretations expressed are those of the authors and do not necessarilyreflect the views of the broader staff, officers, or trustees of the partner organizations, the project’s advisors,
or the funders of the research.

The UrbanInstitute
Foundation Expenses & CompensationHow Operating Characteristics Influence Spending
AuthorsElizabeth T. Boris, Principal Investigator, Center on Nonprofits and Philanthropy, The Urban InstituteLoren Renz, Principal Investigator, The Foundation CenterAsmita Barve, The Foundation CenterMark A. Hager, The Urban Institute
George Hobor, The Urban Institute
ContributorsAmy Brimer, The Urban InstituteCharles E. McLean, GuideStar
o
R
Copyright © 2006. The Urban Institute, the Foundation Center, and Philanthropic Research, Inc.


TABLE OF CONTENTS
Table of Contents i
List of Figures ii
Acknowledgments iv
Executive Summary vi
I. Introduction 1Dimensions of the Study 2Types of Foundations 3
Private Foundations: Independent and Corporate 3Community Foundations 4
II. Components of Foundation Charitable Expenses 5Charitable Operating and Administrative Expenses 5
III. Foundation Operating Characteristics and Charitable Expenses 11Independent Foundations 11
Influence of Paid Staff 12Influence of Staff Size 13Influence of Family Involvement 14Influence of Endowed vs. Pass-Through 15Influence of Geographic Scope of Giving 16Influence of Direct Charitable Activities 17Influence of Grants to Individuals Programs 18Influence of Maintaining Web Sites 19
Corporate Foundations 20Influence of Paid Staff 20Influence of Staff Size 21Influence of Direct Charitable Activities 22Influence of Geographic Scope of Giving 23
Community Foundations 24Influence of Staff Size 24Influence of Foundation Age 25Influence of Direct Charitable Activities 26Influence of Maintaining Web Sites 27

ii
IV. Foundation Compensation Patterns 29Aggregate Compensation 29Trustee and Executive Compensation 31
Individual Trustee Compensation 31Institutional Trustee Compensation 32Foundation Executive Compensation 33
V. Conclusions 37
Appendix 41A. Methodology 41B. List of Variables 44C. Benchmarking Tables 47
LIST OF FIGURES
Figure 1.1 Aggregate Finances of the 10,000 Largest Foundations (2001) byFoundation Type 2
Figure 1.2 Foundations that Compensate and the Aggregate Amount ofCompensation that Qualifies as Charitable 3
Figure 2.1 The Distribution of Charitable Operating and Administrative Expensesfor Independent, Corporate, and Community Foundations 6
Figure 2.2 Compensation, Other Expenses, and Other Professional Fees as aPercentage of Charitable Operating and Administrative Expenses:Independent Foundations 8
Figure 2.3 Compensation, Other Expenses, and Other Professional Fees as aPercentage of Charitable Operating and Administrative Expenses:Corporate Foundations 8
Figure 2.4 Compensation, Other Expenses, and Other Professional Fees as aPercentage of Charitable Operating and Administrative Expenses:Community Foundations 9
Inset Staffing Configurations of Independent Foundations 12Figure 3.1 Charitable Operating and Administrative Expenses as a Percentage
of Qualifying Distributions: Staffed and Unstaffed IndependentFoundations 13
Figure 3.2 Range of Charitable Operating and Administrative Expenses as aPercentage of Qualifying Distributions: Staffed vs. UnstaffedIndependent Foundations 13
Figure 3.3 Charitable Operating and Administrative Expenses as a Percentage ofQualifying Distributions: Staff Size (Staffed Independent Foundations) 14
Figure 3.4 Charitable Operating and Administrative Expenses as a Percentage ofQualifying Distributions: Family vs. Non-Family (Staffed IndependentFoundations) 15
Figure 3.5 Charitable Operating and Administrative Expenses as a Percentage ofQualifying Distributions: Endowed vs. Pass-Through (StaffedIndependent Foundations) 16
Figure 3.6 Charitable Operating and Administrative Expenses as a Percentage ofQualifying Distributions: Geographic Scope of Giving (StaffedIndependent Foundations) 17

iii
Figure 3.7 Charitable Operating and Administrative Expenses as a Percentage ofQualifying Distributions: Direct Charitable Activities (StaffedIndependent Foundations) 17
Figure 3.8 Charitable Operating and Administrative Expenses as a Percentage ofQualifying Distributions: Grants to Individuals Programs (StaffedIndependent Foundations) 18
Figure 3.9 Charitable Operating and Administrative Expenses as a Percentage ofQualifying Distributions: Web Sites (Staffed Independent Foundations) 19
Figure 3.10 Charitable Operating and Administrative Expenses as a Percentage ofQualifying Distributions: Staffed and Unstaffed Corporate Foundations 20
Figure 3.11 Charitable Operating and Administrative Expenses as a Percentage ofQualifying Distributions: Giving Less than $5 M (CorporateFoundations) 21
Figure 3.12 Charitable Operating and Administrative Expenses as a Percentage ofQualifying Distributions: Giving $5 M or Over (Corporate Foundations) 21
Figure 3.13 Charitable Operating and Administrative Expenses as a Percentage ofQualifying Distributions: Direct Charitable Activities (CorporateFoundations) 22
Figure 3.14 Charitable Operating and Administrative Expenses as a Percentage ofQualifying Distributions: Geographic Scope of Giving (CorporateFoundations) 23
Figure 3.15 Charitable Operating and Administrative Expenses as a Percentage ofQualifying Distributions: Giving Less than $3 M (CommunityFoundations) 24
Figure 3.16 Charitable Operating and Administrative Expenses as a Percentage ofQualifying Distributions: Giving $3 M or Over (CommunityFoundations) 25
Figure 3.17 Charitable Operating and Administrative Expenses as a Percentage ofQualifying Distributions: Foundation Age (Community Foundations) 26
Figure 3.18 Charitable Operating and Administrative Expenses as a Percentage ofQualifying Distributions: Direct Charitable Activities (CommunityFoundations) 26
Figure 3.19 Charitable Operating and Administrative Expenses as a Percentage ofQualifying Distributions: Web Sites (Community Foundations) 27
Figure 4.1 Compensation as a Percentage of Giving for Foundations thatCompensate 30
Figure 4.2 Range of Compensation to Giving for Foundations that ReportCompensation 30
Figure 4.3 Individual Trustee Compensation Patterns 31Figure 4.4 Compensation Ranges for Compensated Individual Trustees 32Figure 4.5 Compensation Ranges for Institutional Trustees 33Figure 4.6 Median Compensation of Foundation Executives by Foundation Type
and Asset Size 33Figure 4.7 Compensation Ranges for Foundation Executives 34

ACKNOWLEDGMENTS
This research was made possible through funding from the C.S. Mott Foundation and theFord Foundation. The partners wish to especially acknowledge the role of William S. White,
chairman of the Mott Foundation, whose leadership led to the launching of the study in 2004.We are also grateful to Elan Garonzik, former program officer of the Mott Foundation, andBarry Gaberman, senior vice president of the Ford Foundation, for their efforts to sustain theproject in 2005. Finally, we thank the study’s advisors who helped to shape the research issuesearly on and who have provided valuable feedback throughout the two-year project. Amongthe advisors, special recognition is due to James Allen Smith, Waldemar A. Nielsen Chair inPhilanthropy at Georgetown University, for his contributions to the final report.
Foundation Expenses and Compensation Study Advisory CommitteeDiana Campoamor, Hispanics in PhilanthropyGavin Clabaugh, Charles Stewart Mott FoundationRobert S. Collier, Council of Michigan FoundationsKit Conroy, New York Community TrustElan Garonzik, The ELMA Philanthropies Services, (U.S.) Inc.Judith Kroll, Council on FoundationsMelissa Ludlum, IRS–Statistics of Income DivisionLa June Montgomery-Tally, W.K. Kellogg FoundationTerry Odendahl, Santa Fe Community FoundationJames Allen Smith, Georgetown UniversityBarron M. Tenny, The Ford FoundationCraig Ziegler, California HealthCare Foundation


EXECUTIVE SUMMARY
Questions about how much U.S. grantmaking foundations spend on staff, trustees, overhead, and otheradministrative expenses—and how much is appropriate to spend—are at the forefront of current
debates on foundation practices. Over the past several years, stories in the media have spotlightedfoundations with questionably high compensation and expenses. In turn, this media scrutiny has promptedaction by policymakers to address perceived improprieties. In the foundation field, it has sparked wide-spread discussion at the national and local levels about what constitutes appropriate practice.
Missing from these debates has been adequate information about current practices across a widespectrum of foundations. This report provides a comprehensive look at expense and compensation patternsof the 10,000 largest independent, corporate, and community foundations (by giving) and documents howmajor differences in foundations’ operating characteristics have an impact on their expense levels. Thefindings shed light on what factors are tending to drive administrative and operating expenses. Under-standing foundations’ program strategies and characteristics is key to understanding how much theyspend.
This research, generated by a partnership of the Urban Institute’s Center on Nonprofits and Philanthropy,the Foundation Center, and GuideStar, uses circa 2001 financial and programmatic data as reported onForms 990-PF and 990 supplemented by survey data from the Foundation Center. To examine trusteeand executive compensation patterns, the study uses individual-level compensation data on more than51,000 officers, trustees, and key paid staff reported by these same 10,000 foundations. These foundationsrepresent 16 percent of all 61,810 active grantmaking foundations identified by the Foundation Center in2001. They account for 78 percent of all foundation giving and 77 percent of all foundation assets.
U.S. foundations vary substantially in the ways they accomplish their work, and those variations havea measurable impact on their expense levels. Most of the 10,000 largest foundations report modest expenses;the vast majority are unstaffed, and many are run largely by unpaid trustees. A small number of foundationshave high ratios of expenses to qualifying distributions and some have compensation levels that are wellabove the typical ranges for their cohort. The overall picture is one of diversity—this is a heterogeneousgroup of institutions that can only be understood by disaggregating the data along the dimensions ofsize, type, and staffing and program characteristics.
Independent, corporate, and community foundations, by definition, have different auspices, governance,and structural characteristics. This report documents how major differences in operating characteristicsaffect the expense levels of private and community foundations. These findings suggest that, along withtype and size, the missions and goals of foundations that lead to different staffing levels and types ofexpenses are important characteristics to consider when assessing foundations’ charitable expenditures.

Executive Summary � vii
Key Findings
Operating Characteristics and Expense Patterns
Of the 10,000 largest foundations, 30 percent report no charitable operating and administrative expenses.Community foundations, nearly all of which employ staff, are most likely to report operating expenses.Corporate foundations, which are often staffed by company employees, are least likely. Twenty-sevenpercent of independent foundations do not report expenses, and they are likely run by donors, familymembers, and unpaid trustees.
Staffing appears to be the most significant factor influencing charitable operating expenses. Employ-ment of paid staff significantly raises operating costs for all types of foundations, and expense levelsincrease along with staff size.
Foundation size emerges as another important factor. Larger givers reported lower expense-to-distribu-tion ratios for a number of operating characteristics, suggesting greater efficiency with size.
Among staffed independent foundations, charitable operating and administrative expenses rangefrom less than 5 percent (for 41 percent) to 20 percent or more (for 14 percent); the median is 7 percent.By comparison, 84 percent of unstaffed foundations fall into the 0 to 5 percent range, with a median ofless than 1 percent.
For staffed independent foundations, operating characteristics strongly associated with higherexpense levels include international giving, direct charitable activities, and grants to individuals pro-grams. The staff-intensive nature of these activities can boost a foundation’s expense levels. In contrast,donor-family involvement and operating as a non-endowed, or ‘‘pass-through,’’ foundation tend to lowercharitable expenditure levels. The lower levels of expenses for staffed family foundations compared tonon-family foundations suggest that family members help to hold staff-related costs down by providingadditional volunteer or low-cost labor for administering grantmaking programs. They may also contributeoffice space and provide administrative support.
Compared with independent foundations, corporate foundations have lower expense-to-qualifyingdistribution ratios, and fewer operating characteristics show a clear relationship to expenses. Themedian expense-to-qualifying distribution ratio for staffed corporate foundations is less than 1 percent.Close ties between foundations and their parent companies make it difficult to determine actual expensesand staff costs, as companies often assume foundation expenses. Nevertheless, staff size, scope of grantmak-ing, and presence or absence of direct charitable activities appear to have an influence on expense levels.In fact, direct charitable activities comprise a bigger share of the charitable disbursements of a few largecorporate foundations than grantmaking does.
Operating and administrative expense-to-charitable disbursement levels are more consistent acrosscommunity foundations, nearly all of which are staffed, and large givers are less likely to benefit fromeconomies of scale. The median ratio of expenses to qualifying distributions ranges from 5 percent forsmaller foundations to more than 7 percent for larger foundations. Operating characteristics and activitiesthat appear to have a substantial impact on community foundation expense levels include staff size,engagement in direct charitable activities, and foundation age.
The youngest community foundations have the highest ratios of charitable expenses to qualifyingdistributions. Possible explanations include the existence of high start-up costs and the tendency for newcommunity foundations to do very little grantmaking in their early years of operation while they raise fundsand build their endowments. As grantmaking programs ramp up, administrative expense ratios decrease.
Independent and community foundations with web sites have greater expense-to-qualifying distribu-tion ratios than those without. While it is unlikely that web sites alone influence expense levels, itseems possible that foundations that invest in maintaining web sites have other cost factors (e.g., highercommunications expenses, higher professional fees, and/or larger staff) that exert an upward pressureon expenses.
Compensation
Of the 10,000 largest U.S. foundations, 66 percent do not pay any compensation to staff or trustees forconducting grantmaking and other charitable activities. Among the nearly 3,400 that do, the medianpercentage of compensation to giving is higher for community and independent foundations (roughly 5

viii � Executive Summary
percent) and lower for corporate foundations (less than 2 percent). Roughly four in five foundations,regardless of type, compensate at less than 10 percent of giving.
The largest foundations tend to compensate at the highest amounts, yet their median percentagesof compensation to giving are among the lowest. The median percentage of compensation to giving forindependent foundations that give over $50 million is 3 percent, compared with roughly 5 percent forthe smallest givers. The difference is even greater for community foundations—3 percent compared toover 10 percent.
Eighty-five percent of the more than 46,000 individual trustees serving foundations in the studyreceive no compensation. Most of the 7,132 compensated individual trustees are found in independentfoundations. While most of the compensated independent foundation trustees received less than $10,000,a few received over $100,000. Only 3 percent of corporate foundation trustees and less than 1 percent ofcommunity foundation trustees were compensated compared with nearly 20 percent of independentfoundation trustees. Collectively, all compensated individual trustees received $111.6 million in 2001.
Institutional trustees typically receive higher compensation than individual trustees. Institutionaltrustees, such as banks, law firms, and investment firms, often play important managerial roles in founda-tions. Of the 1,340 institutional trustees reported, 1,248 receive compensation, and most of these serveindependent foundations. The largest category of independent foundation institutional trustees is paidin the $30,000 to $60,000 range.
Compensation of foundation executives is strongly influenced by foundation size. Of the 2,923foundations reporting paid staff in 2001, 1,005 foundations list executive directors, presidents, or chiefexecutive officers. While the median salary of executives overall was roughly $100,000 in 2001, the medianexecutive compensation in foundations with over $200 million in assets was $200,000. The median executivein foundations with less than $10 million in assets received approximately $50,000.
RECOMMENDATIONS FOR CHANGES TO FORMS 990 AND 990-PF
While this study yields insights on how different operating styles can hike or curtail expenses, it alsoreveals shortcomings in the data and in the current reporting of foundation information to the IRS. Forstarters, foundations should be educated as to the importance of Forms 990-PF and 990 as the most visiblesummary of their finances. Changes in the forms themselves should be made to clarify information aboutexpenses and compensation, especially related to certain categories of expenses, direct charitable activities,and individual trustee and staff compensation. Such changes will facilitate better understanding and morein-depth explorations of foundation practices.

IINTRODUCTION
This report focuses on the expenses and compensation of the 10,000 largest independent, corporate, andcommunity foundations (ranked by giving) as reported for 2001. It provides a comprehensive review
of charitable administrative and operating expense patterns and compensation levels across differenttypes and sizes of grantmaking foundations; it explains how they are influenced by different organizationalcharacteristics and operating styles. This study appears at a timely moment, with policymakers engagedin debates concerning the nonprofit sector and foundation leaders discussing appropriate and improvedpractices for their field.
While there are public policy concerns immediately at hand, this study confronts questions that haveraised perennial issues for foundations. The assets that are bestowed on foundations are intended to servea public purpose; they are not destined for the personal benefit of foundation managers or trustees. Yetto pursue the public good knowledgeably, effectively, and responsibly, foundations must often expendsome of their resources on internal administrative tasks. At times, some foundations have concluded thatit is best to operate their own charitable programs, thus incurring still larger administrative expenses.The question of how much is too much to spend on administration, compensation, and program operationsis at the core of current concerns.
This report asks a fundamental question: how much do foundations expend on administration, especiallycompensation, and on the charitable programs that they themselves operate? And this question leads toanother: what factors are tending to drive administrative and operating expenses? Even the most casualobserver of foundations will quickly perceive the diversity within the sector and will understand thatfoundations administer and fund programs of countless variety, in places near and far, pursuing goals witha wide array of tactics and strategies. Understanding foundations’ program strategies and characteristics iskey to understanding how much they spend. Answers to these questions yield yet another question, onethat is particularly relevant to policymakers, regulatory authorities, and foundation and nonprofit leaders:what additional data should be reported or collected to better understand foundation expense levels?
Some of what we now know about expenses has come to light recently through stories in the pressthat have focused a spotlight on foundations with questionably high compensation and administrativeexpenditures. In turn, this media scrutiny has sparked interest within the halls of Congress, the InternalRevenue Service, and the offices of state attorneys general; their inquiries have culminated in a series ofproposals to address the perceived improprieties. At the same time, foundation officials, professionalassociations, and research organizations have also begun to pose their own questions about appropriateadministrative expenses and compensation for staff and trustees, as well as the levels and compositionof distributions that qualify as charitable; they, too, have advanced proposals for greater self-regulation,better reporting, and stricter enforcement of existing laws.
Often missing from these debates has been adequate information about current practices coupled withsufficient aggregate data for determining appropriate administrative expense and compensation levels.

2 � Foundation Expenses and Compensation
Neither government oversight nor foundation self-regulation can be effective without such information.This report begins to fill this need. It cautions against constructing a ‘‘one size fits all’’ approach to settingstandards. It emphasizes the need to consider the impact of foundation type and size and the diversegoals and missions of foundations on staffing levels and expenditure patterns. It also points to the gapsin our understanding of foundation operations and practices, suggesting the need for further researchand for revisions to current reporting requirements. This information is critical to informed public policydebate. It will assist policymakers in shaping sound policies that are capable of improving foundationaccountability without creating unnecessary and potentially burdensome legislation. The study also servesas an important resource for foundation leaders as they assess their organizations’ practices and internalpolicies. In the end, this study can also serve as a baseline for analyzing future trends.
An interim report, released in July 2005, focused mainly on independent foundations, which representthe vast majority of the largest 10,000 foundations. This report presents complete findings on the expenseand compensation patterns of independent, corporate, and community foundations.
DIMENSIONS OF THE STUDY
This research comes out of a partnership of the Urban Institute’s Center on Nonprofits and Philanthropy,the Foundation Center, and GuideStar. It is based on summary data from two datasets, briefly describedin the figures below. The first includes financial and programmatic data circa 2001 on the 10,000 largestindependent, corporate, and community foundations (ranked by giving) as reported on Forms 990-PFand 990, which are filed annually with the Internal Revenue Service, and supplemented by annual surveysconducted by the Foundation Center. The second consists of compensation data on the 51,533 individualofficers, directors, trustees, key employees, and institutional trustees reported on Forms 990-PF and 990for the same 10,000 foundations.
Figure 1.1 provides an overview of finances for the foundations in the first dataset. The largest 10,000 U.S.grantmaking foundations represent 16 percent of the total 61,810 independent, corporate, and communityfoundations identified by the Foundation Center in 2001. These foundations are responsible for 78 percentof all foundation giving and 77 percent of all foundation assets. Most of the largest foundations areindependent, including family foundations.1
Figure 1.1 also highlights charitable operating and administrative expenses and qualifying distributions,the main foci of the report. Charitable operating and administrative expenses are costs incurred byfoundations related to their charitable mission. They represent one component of qualifying distributions.Qualifying distributions are all disbursements that count toward the mandated 5 percent payout require-ment for private foundations.2
Another focus of the report is compensation. Figure 1.2 provides a breakdown of the number offoundations in the study that compensate and the total amount of compensation that is included incharitable operating and administrative expenses and therefore qualifies toward the mandated 5 per-cent payout.
One-third (33.9 percent) of the 10,000 largest foundations reported aggregate compensation, for a totalgreater than $800 million. This report uses a second dataset to take a closer look at these foundations and
Figure 1.1. Aggregate Finances of the 10,000 Largest Foundations* (2001) by Foundation Type
Independent Corporate Community Totals
Number 8,876 807 317 10,000
Assets (MV) ($) 333.7 B 13.2 B 25.2 B 372.1 B
Total giving ($)a 19.2 B 2.9 B 1.9 B 24.0 B
Charitable operating and administrative expenses ($)b 1.5 B 201.0 M 169.0 M 1.9 B
Qualifying distributions ($)c 21.2 B 3.1 B 2.1 B 26.4 B
*Ranked by giving.aSource: Form 990-PF, part I, line 25, column d. For community foundations, Form 990, part II, lines 22 and 23, column B.bSource: Form 990-PF, part I, line 24, column d. For community foundations, Form 990, part II, lines 24–43, column B.cSource: Form 990-PF, part XII, line 4. For community foundations, we use total program expenditures (Form 990, part II, line 44, column B) as a proxyfor qualifying distributions.

Introduction � 3
Figure 1.2. Foundations that Compensate and the Aggregate Amount of Compensation that Qualifies as Charitable
Independent Corporate Communityfoundations foundations foundations Total
Foundations reporting charitable compensationa 3,068 126 194 3,388
Charitable compensation ($) 715.9 M 24.3 M 60.2 M 800.4 M
aSource: Charitable compensation: Form 990-PF, Part I, sum of lines 13–15, column d, for private foundations. Form 990, Part 2, sum of lines 25–29,column B, for community foundations.
their compensation practices.3 This complementary dataset provides a detailed account of trustee andexecutive pay.
The various components of charitable operating and administrative expenses are analyzed in SectionII of the report. A key purpose of the research is to identify foundation characteristics and operatingstyles that affect expense levels for the different types of foundations. Therefore, Section III details theeffects of size, staffing, scope of giving, and other factors on charitable expenses. Section IV providesmore detailed information on compensation levels across all foundation types, including aggregate com-pensation as a percentage of giving and levels of individual trustee, institutional trustee, and executivecompensation. A concluding section summarizes key findings of the study and engages the current publicpolicy debate.
Throughout this study, differences in foundation size and type are considered in assessing charitableexpenditures. Asset level, giving level, and number of staff are used to categorize foundations by size.While size categories are fairly straightforward and commonly understood, foundation types are not andtherefore merit further explanation. The following descriptions shed light on important differences amongvarious types of foundations as they relate to foundation operating and administrative costs.
TYPES OF FOUNDATIONS
U.S. foundations resist easy definition. Not only are there important operational and legal distinctionsbetween private foundations and other types of charitable organizations, but sharp contrasts also existamong different types of grantmaking foundations. Independent, corporate, and community foundationshave different auspices, governance, and structural characteristics. Even among foundations of the sametype, foundations vary substantially not only by size but also in the ways they accomplish their work,the geographic scope of their giving, and the kinds of programs they undertake. These differences havea pronounced effect on charitable expenditures.
Private Foundations: Independent and Corporate
Private foundations, which include independent and corporate foundations, derive their funds from asingle source and their activities are governed by specific rules and regulations set in the tax code. Ofthese regulations, two have special bearing on this study of expenses: private foundations are requiredto distribute for charitable purposes a minimum of 5 percent of the average monthly value of that year’sassets, which must be paid out by the end of the following year; and they must file with the IRS annualinformation Form 990-PF, which includes financial information, grants awarded, direct charitable activities,and other charitable expenses that qualify toward the payout requirement.
Independent foundations, which comprise the vast majority of U.S. grantmaking foundations andinclude family foundations, derive their funds from one or more related individuals (or a family). Whilethey may administer grants and programs through the efforts of a mix of paid and unpaid people, onlyabout one-quarter of the independent foundations included in this study are staffed. Three-quartersoperate through the efforts of unpaid trustees (see pages 12–15). Functionally, independent foundationsmay operate as endowed foundations, which finance their grants and expenses from earnings on theirendowments, or as pass-throughs, which receive annual or periodic gifts from living donors from whichexpenditures are made. In terms of scope of giving, they may operate programs locally, nationally, orinternationally. Although the principal activity of independent foundations is grantmaking, they may

4 � Foundation Expenses and Compensation
accomplish their mission through a range of activities, including foundation-administered programs andprogram-related investments.
Both independent and corporate foundations are subject to the same regulations. However, they differsubstantially in their operations.
Corporate foundations, while legally independent grantmaking organizations, maintain close ties tothe companies that provide their funds. They are governed by a board of directors, often composedof corporate officials, which may include individuals with no corporate affiliation. Like independentfoundations, corporate foundations may draw on the efforts of a mix of people to administer grants andprograms, including paid staff. However, staffing is often provided directly by the parent company andnot reported as an expense to the foundation. The parent company may also donate other goods andservices that reduce foundation expenses, such as office space, equipment, printing, web site and othercommunications services, and even consultants. Corporate foundations may operate locally (in one or morelocations), nationally, or internationally. Even when they operate internationally, however, administrativefunctions and costs may be assumed by local affiliates of the company and therefore not appear asexpenses of the foundation. The undocumented contributions of parent companies and affiliates to corpo-rate foundation operations make it difficult to determine the true costs of their activities and to comparetheir expense levels with other types of foundations.
Community Foundations
Unlike private foundations, community foundations are publicly supported organizations made up offunds contributed by many donors and governed by a board of private citizens chosen to be representativeof the public interest and for their knowledge of the community. Among the primary functions ofcommunity foundations beyond grantmaking are to professionally manage the assets of their componentfunds and to build charitable endowments through fundraising. Because of these diverse functions, evensmall and relatively new community foundations have paid staff, which in turn exerts upward pressureon their expense levels. They rely on revenue generated by their endowments and fundraising to pay forstaffing and other administrative costs. Community foundations primarily make grants to charitableorganizations within a particular city, county, state, or other geographically defined area, although theymay administer funds intended to benefit other geographic areas.
As public charities, community foundations are not subject to private foundation regulations, includingthe payout requirement. They also have different reporting requirements. While they must file an annualinformational return, Form 990, this form differs from Form 990-PF in several ways. For example, itcategorizes certain expense items differently and does not track direct charitable activities, program-related investments, set-asides, and other ‘‘charitable’’ expenditures that are calculated in satisfying theprivate foundation payout requirement.
The differences outlined above in reporting requirements, structural characteristics, and operations ofdifferent foundation types are reflected through variations in the charitable expense patterns of indepen-dent, corporate, and community foundations. The following section focuses on how the components ofcharitable administrative and operating expenditures vary across foundation types.
N O T E S
1. Since this study focuses on grantmaking foundations, operating foundations are not included. While they maydo some grantmaking, operating foundations use the bulk of their resources to provide charitable services or to runcharitable programs rather than to distribute grants.
2. For more information on regulations and requirements for private foundations, see ‘‘Appendix B: Regulationof Private Foundations,’’ in Foundation Center, 2005, Foundation Yearbook: Facts and Figures on Private and CommunityFoundations. (New York: Foundation Center.)
3. Due to the complex process associated with assembling the compensation dataset from Forms 990, descriptivestatistics from this dataset are not provided here. The appendix provides a full explanation for how these datawere compiled.

IICOMPONENTS OF FOUNDATIONCHARITABLE EXPENSES
This section focuses on the breakdown of charitable operating and administrative expenses by categoryand compares how the composition of these expenses varies across foundation types. The impact
of foundation size on select charitable expense categories for independent, corporate, and communityfoundations is also explored.
KEY FINDINGS
● Independent, corporate, and community foundations differ in the composition of their charitableadministrative and operating expenses. In general, compensation and the residual categories ‘‘otherexpenses’’ and ‘‘other professional fees’’ represent the most significant portions of these expenses.However, their shares differ across the three foundation types.
● The impact of foundation size on the distribution of selected categories of charitable operatingand administrative expenses varies by foundation type, and only shows a consistent influence oncommunity foundations.
CHARITABLE OPERATING AND ADMINISTRATIVE EXPENSES1
Charitable operating and administrative expenses are costs incurred by foundations related to theircharitable mission, including expenses for grants administration and non-grant charitable activities. Asdescribed earlier, charitable expenses are one component of mandated qualifying distributions. Investment-related expenses are not included among charitable expenses; they do not count as qualifying distributions.2
Among the top 10,000 foundations, 6,982 reported charitable operating and administrative expenses;the remainder reported none. Twenty-seven percent of independent foundations in the study reportedno charitable expenses. The equivalent share was higher for corporate foundations (37 percent) and slightlylower for community foundations (25 percent). Foundations that do not report expenses are likely beingrun by donors and their families, unpaid trustees, corporate staff, or community volunteers. Expensesare probably covered by donors for independent foundations, by corporations for corporate foundations,and by community groups, local banks, and businesses for community foundations.
Figure 2.1 divides the sum of charitable operating and administrative expenses into its component partsby foundation type. The principal expense categories include compensation and benefits; professional,legal, and accounting fees; other professional fees; occupancy costs; printing and publication costs; travel;other expenses; and taxes.

6 � Foundation Expenses and Compensation
Figure 2.1. The Distribution of Charitable Operating and Administrative Expenses for Independent, Corporate, and CommunityFoundations
Printing and publications2%
Travel, conferences, andmeetings
6%Occupancy
6%Taxes
1%Interest
1%
Other professional fees14%
Legal fees3%
Accounting fees2%
Other expenses19%
Total compensation46%
Independent foundations (n=8,876)
Printing and publications1.7%
Travel, conferences2.5%
Occupancy3.8%
Interest1.1%
Other expenses50.9%
Depreciation3.0%
Total compensation36.3%
Community foundations (n=317)
Other professional fees1.0%
Printing and publications3.8%
Travel, conferences, andmeetings
1.7%
Occupancy0.6%
Interest0.0%
Other professional fees13.7%
Other expenses66.2%
Taxes0.5%
Total compensation12.1%
Legal fees0.6% Accounting fees
0.8%
Corporate foundations (n=807)

Components of Foundation Charitable Expenses � 7
‘‘Other professional fees’’ and ‘‘other expenses’’ are vaguely defined expense categories. The formeroften refers to consulting services associated with administration, program development, or informationtechnology. Understanding the largely undifferentiated ‘‘other expenses’’ category is more difficult. It isa residual category for expenses that do not fit into one of the major line items on Forms 990 and 990-PF and it also appears to be a catchall category for those who do not take the time to allocate items tothe correct lines on the forms.
An investigation intended to clarify this expense category showed that the composition of ‘‘otherexpenses’’ differs by foundation type. For a sample of the largest independent foundations, the top threetypes of expenses in this category by dollar amount were personnel (17 percent), equipment and supplies(14 percent), and project development (4 percent). For the largest corporate foundations, expenditures byjust a few of the largest grantmakers for special fundraising events and public service advertising domi-nated the ‘‘other expenses’’ category.3 For a sample of the largest community foundations, the top threeexpenses within the ‘‘other expenses’’ category were consulting and management (30 percent), investmentand custodial (26 percent), and program development/evaluation (18 percent).4 Notably, the researchshowed that community foundations often report professional fees under ‘‘other expenses’’ since unlikethe Form 990-PF, Form 990 does not include ‘‘other professional fees’’ as an expense category.
While these findings shed some light on ‘‘other expenses,’’ this is an area for improvement, both in theexpense categories on Forms 990 and 990-PF and in reporting by foundations. Additional analysis canhelp to identify useful modifications to the forms and promote more accurate reporting.
Figure 2.1 compares the breakdown of expenses for the three foundation types and reveals that:
● For independent foundations, compensation was the dominant expense category, making up 46percent of charitable operating and administrative expenses.
● Community foundations spent the second largest share of their charitable expenses on compensation(36 percent), while corporate foundations spent less on this category (12 percent) than other founda-tion types.
● Corporate foundations reported 66 percent of their charitable operating and administrative expensesas ‘‘other expenses.’’ This was the largest share reported by any type of foundation.5
● Community foundations allocated 51 percent of expenditures to ‘‘other expenses,’’ the largest compo-nent of charitable operating and administrative expenses for those foundations.
● By contrast, independent foundations allocated far less to this category (19 percent).● ‘‘Other professional fees’’ represented 14 percent of total charitable operating and administrative
expenses for independent foundations and 14 percent for corporate foundations. As noted above,community foundations do not report ‘‘other professional fees,’’ as the Form 990 does not providethat option.
In sum, compensation and ‘‘other expenses’’ were significant shares of total charitable operating andadministrative expenses for all three types of foundations, but the percentages varied. Corporate founda-tions and independent foundations spent a similar percentage of their charitable expenses on ‘‘otherprofessional fees.’’ Among other designated expense categories, travel, occupancy, printing and publica-tions, accounting fees, legal fees, and taxes ranged from 0 to 6 percent of total charitable operating andadministrative costs, regardless of foundation type.
Figures 2.2 through 2.4 show the impact of foundation size on selected expense categories as a shareof total charitable operating and administrative expenses for independent, corporate, and communityfoundations. Foundations are divided into six asset groups, determined by the fair market value of theirreported assets in 2001.
Figure 2.2 reveals the following patterns of expenses for independent foundations:
● Compensation as a percentage of total charitable operating and administrative expenses varied withina narrow range of 42 percent to 50 percent for independent foundations with assets ranging from $1million to over $500 million. The share of compensation was the lowest (34 percent) for foundationswith assets under $1 million.
● The share of ‘‘other expenses’’ to charitable operating and administrative expenses was the highestfor the smallest independent foundations (29 percent) and the lowest for the largest foundations (16percent). The percentage of ‘‘other expenses’’ varied very little, between 19 and 23 percent, acrossother size categories.

8 � Foundation Expenses and Compensation
Figure 2.2. Compensation, Other Expenses, and Other Professional Fees as a Percentage of Charitable Operating andAdministrative Expenses: Independent Foundations (N � 8,677)
0%
10%
20%
30%
40%
50%
60%
< $1 M $1 M–$10 M $10 M–$50 M $50 M–$200 M $200 M–$500 M > $500 M All
Asset group
Per
cent
Compensation Other expenses Other professional fees
● The percentage of ‘‘other professional fees’’ was the highest for the smallest (15 percent) and largest(19 percent) foundations, but remained fairly stable across the other asset groups (9 to 10 percent).
In general, the three largest expense categories of independent foundations did not demonstrate anyspecific pattern across asset levels, suggesting that size may not be a good determinant of the compositionof these expenses.
The following figure examines size and the charitable operating and administrative expenses of corporatefoundations.
Figure 2.3. Compensation, Other Expenses, and Other Professional Fees as a Percentage of Charitable Operating andAdministrative Expenses: Corporate Foundations (N � 772)
0%
10%
20%
30%
40%
50%
60%
70%
80%
< $1 M $1 M–$10 M $10 M–$50 M $50 M–$200 M $200 M–$500 M All
Asset group
Perc
ent
Compensation Other expenses Other professional fees

Components of Foundation Charitable Expenses � 9
● Compensation as a share of total charitable operating and administrative expenses was fairly stableacross asset levels, ranging from 7 percent to 14 percent, spiking to 29 percent only for foundationsin the $1 million to $10 million asset range.
● Size does appear to have an impact on the ‘‘other expenses’’ category, with the share increasing from31 percent for the smallest foundations to 76 percent for foundations with assets of $50 million to$200 million.
● ‘‘Other professional fees’’ made up the greatest proportion of charitable operating and administrativeexpenses for the smallest foundations, with a 49 percent share. They represented a smaller percentageof charitable expenses compared to ‘‘other expenses’’ in all other asset categories.
In summary, foundation size influences the distribution of selected categories of charitable operatingand administrative expenses of corporate foundations. Specifically, other expenses as a share of theseexpenses generally increased along with asset size. However, the effect is not consistent. The largestcorporate foundations did not spend as high a percentage on ‘‘other expenses’’ as foundations in the $50million to $200 million asset range.
Finally, figure 2.4 details the impact of size on select charitable expenses of community foundations.Since community foundations do not report professional fees separately, they are not included in the figure.
● Compensation as a percentage of charitable operating and administrative expenses varied from 3percent for the smallest community foundations to 43 percent for the largest.
● The share of ‘‘other expenses’’ also varied by size from 86 percent for the smallest communityfoundations to 32 percent for the largest.
The impact of size on the distribution of charitable operating and administrative expenses was morepronounced for community foundations than for independent and corporate foundations. The compensa-tion-to-charitable expenses share increased consistently with asset size whereas the share of other expensesdecreased across asset levels. Community foundations usually employ staff, and the number of staff tendsto increase with asset size. As staffing levels increase, perhaps better reporting and less reliance onconsultants may drive down costs reported in the ‘‘other expenses’’ category. The impact of staffing onexpenses will be explored in the next section.
Figure 2.4. Compensation, Other Expenses, and Other Professional Fees as a Percentage of Charitable Operating andAdministrative Expenses: Community Foundations (N � 316)
0%
10%
20%
30%
40%
50%
60%
70%
80%
90%
100%
< $1 M $1 M–$10 M $10 M–$50 M $50 M–$200 M $200 M–$500 M > $500 M All
Asset group
Perc
ent
Compensation Other expenses

10 � Foundation Expenses and Compensation
SUMMARY
For all foundations, compensation and ‘‘other expenses’’ dominate charitable expenses. ‘‘Other professionalfees’’ also represent a sizeable proportion of charitable expenses for independent and corporate founda-tions. Foundation type affects the distribution of these expenses, with different types of foundationsspending varying amounts on the major expense categories.
For independent foundations, total compensation is the largest expense category, accounting for 46percent of charitable expenses, followed by ‘‘other expenses’’ (19 percent) and ‘‘other professional fees’’ (14percent). For corporate foundations, ‘‘other expenses’’ dominate charitable operating and administrativeexpenses with a 66 percent share. In comparison to the other foundation types, compensation occupies aconsiderably smaller percentage of charitable operating and administrative expenses for corporate founda-tions (12 percent), representing the third largest expense category, next to other professional fees (14 per-cent).
Community foundations spend the bulk of their charitable operating and administrative expenses on‘‘other expenses’’ (51 percent) and compensation (36 percent). They do not report professional fees, butas noted above, the ‘‘other expenses’’ category often subsumes the expenses that would otherwise beclassified under ‘‘other professional fees.’’
The impact of size on charitable operating and administrative expenses varies by foundation type, andit is inconsistent. Size is a weak determinant of the composition of charitable operating and administrativeexpenses for independent foundations, and it somewhat influences the distribution of expenses in corporatefoundations. It only has a clear and consistent impact on community foundations. Compensation tendsto increase as a proportion of charitable expenses for larger foundations while ‘‘other expenses’’ tendsto decrease.
Given the diversity of foundations, the following section explores how charitable expenditures of thethree different types of foundations vary with different operating characteristics and activities.
N O T E S
1. Charitable operating and administrative expenses: Form 990-PF, Part I, line 24, column d. For communityfoundations, Form 990, Part II, line 22 subtracted from line 23, column B.
2. See List of Variables in the appendix for definitions of terms.3. A few large corporate foundations with high levels of spending on direct charitable activities account for a
substantial share of the total ‘‘other expenses’’ amount reported by all corporate foundations.4. Community foundations may invest assets for other organizations and may regard these activities as ‘‘program
expenses,’’ rather than as administration and general expenses. Form 990 is limited in its ability to capture accuratelythe financial flows and program activities of community foundations.
5. As noted in note 3 above, a few large corporate foundations report a large proportion of the ‘‘other expenses,’’yet even without them ‘‘other expenses’’ remains the largest category of expenses for corporate foundations. Furtheranalysis is required to understand the types of costs allocated to this category.

IIIFOUNDATION OPERATINGCHARACTERISTICS ANDCHARITABLE EXPENSES
One of the primary purposes of this study is to determine whether certain foundation characteristicsand operating styles influence charitable operating and administrative expense patterns more than
others. This section examines specific characteristics that were found to be associated with large and/orinteresting variations in charitable expense levels for each foundation type. We use the ratio of charitableoperating and administrative expenses to qualifying distributions as a measure of expense levels. Theanalysis tests several characteristics as appropriate for each foundation type, including giving size; whetheror not a foundation is staffed; staff size; donor-family involvement; foundation age; geographic scope ofgiving; and presence of direct charitable activities, program-related investments, grants to individuals,and web sites.1 To account for the influence of foundation size on expenses, foundations in the study aregrouped into ‘‘giving groups’’ defined by the total amount of grants paid in 2001.
KEY FINDINGS
● Operating characteristics affect expense levels of independent, corporate, and community foundationsdifferently owing to the inherent differences among the three types of foundations.
● Staffing appears to be the single most important variable impacting charitable operating costs, regard-less of the type of foundation.
● Foundation size emerges as an important factor in the study. Larger givers reported lower mediancharitable operating and administrative expense-to-qualifying distribution ratios for a number ofoperating characteristics, suggesting the presence of greater operating efficiency associated with size.
INDEPENDENT FOUNDATIONS
Charitable operating and administrative expenses are one component of qualifying distributions. Qualify-ing distributions are all disbursements that count toward the minimum 5 percent payout requirement forprivate foundations, described earlier. In addition to charitable operating and administrative expenses,they include grants, charitable loans and other program-related investments, set-asides, and amounts paidto acquire assets used for charitable purposes. The sum of charitable operating and administrative expensesrepresents 7 percent of qualifying distributions for the 8,876 largest independent foundations.
The following subsection focuses on how charitable operating and administrative expense ratios ofindependent foundations vary by operating styles. Of those studied, characteristics and activities thatshowed notable impact for independent foundations include staffing, donor-family involvement, whether

12 � Foundation Expenses and Compensation
or not the foundation is endowed, scope of giving (local, national, or national/international), engagementin direct charitable activities, giving to individuals, and maintenance of web sites.
Staffing Configurations of Independent Foundations
Foundations administer grants and programs through the efforts of a mix of people, including paidstaff; consultants; representatives from banks and law and investment firms; compensated and uncom-pensated trustees; and other volunteers. Only about one-quarter (2,350) of the independent foundationsin the study reported having paid staff in 2001. This leaves nearly three-quarters that operated throughthe efforts of trustees and volunteers.
The majority of unstaffed independent foundations (4,745) operate without paying compensationto anyone. Of the 8,876 independent foundations in the study, 743 (8.4 percent) compensated banksand other institutional trustees only. Another 1,039 (11.7 percent) compensated institutional and/orindividual trustees rather than paying staff to operate the foundation.
Unstaffed: None compensated53.5%
Unstaffed: Compensated institutional or individual
trustees 11.7%
Staffed 26.5%
Unstaffed: Compensated institutional trustees only 8.4%
Unstaffed73.5%
N = 8,876
Influence of Paid Staff
As illustrated in the inset, roughly one-quarter of the independent foundations have paid staff. Figures 3.1and 3.2 show the impact of paid staff on the relationship between charitable operating and administrativeexpenses and qualifying distributions. To consider the influence of foundation size on expenses, founda-tions are divided into six giving groups based on the total contributions paid in 2001, ranging from under$500,000 to over $50 million.
Figure 3.1 shows the following expense patterns:
● Staffed foundations spent substantially higher percentages of qualifying distributions on charitableoperating and administrative expenses. This finding holds in all giving groups.
● For staffed foundations, however, the median percentage declined by giving size from 8.3 percentfor the smallest givers to 5.9 percent for those giving $50 million or more, suggesting economies of scale.
● For unstaffed foundations the pattern is similar, although expenses were tiny for all giving groups.
Whereas the medians reported in figure 3.1 show typical charitable operating and administrative expensepercentages, figure 3.2 shows the distribution of these foundations (regardless of giving size) across rangesof charitable operating and administrative expenses as a percentage of qualifying distributions.
● For both staffed and unstaffed independent foundations, the largest single range category was 0 to5 percent; 84.2 percent of unstaffed foundations and 40.9 percent of staffed foundations fell intothis range.

Foundation Operating Characteristics & Charitable Expenses � 13
Figure 3.1. Charitable Operating and Administrative Expenses as a Percentage of Qualifying Distributions: Staffed andUnstaffed Independent Foundations (N � 8,688)
0%
1%
2%
3%
4%
5%
6%
7%
8%
9%
< $500 K $500 K–$1 M $1 M–$5 M $5 M–$10 M $10 M–$50 M > $50 M All
Giving group
Med
ian
perc
enta
ge
Unstaffed (n = 6,361) Staffed (n = 2,327)
Note: Careful readers will note that 8,688 does not represent all 8,876 independent foundations in the study. Throughout the report, numbers vary because individual cases are missing data on a variable ofinterest. In figure 3.1, for example, some cases are lost because qualifying distributions are not known.
Figure 3.2. Range of Charitable Operating and Administrative Expenses as a Percentage of Qualifying Distributions: Staffedvs. Unstaffed Independent Foundations (N � 8,684)
0%
10%
20%
30%
40%
50%
60%
70%
80%
90%
< 5% 5%–10% 10%–15% 15%–20% 20%–30% 30%–50% > 50%
Per
cent
age
of fo
und
atio
ns
Unstaffed (n = 6,357) Staffed (n = 2,327)
● At the other end of the distributions, 96 unstaffed foundations (1.5 percent) and 325 staffed foundations(14.0 percent) had charitable operating and administrative expenses of 20 percent or more of qualifyingdistributions.
Since paid staff represent a substantial charitable operating and administrative expense, the followingfigures include only staffed independent foundations. The intent is to focus on the expense patterns offoundations with similar operating styles.
Influence of Staff Size
As figure 3.2 demonstrates, staffing significantly influences the relationship between charitable operatingand administrative costs and qualifying distributions. The next figure shows how expense levels of staffed
A : 88716$$CH302-01-06 12:05:07 Page 13Layout: 88716B : Odd

14 � Foundation Expenses and Compensation
Figure 3.3. Charitable Operating and Administrative Expenses as a Percentage of Qualifying Distributions: Staff Size (StaffedIndependent Foundations, N � 2,102)
0%
5%
10%
15%
20%
25%
30%
35%
40%
45%
50%
1 (n = 767) 2–3 (n = 766) 4–14 (n = 480) 15–50 (n = 72) > 50 (n = 17) All (n = 2,102)
Staff size
Med
ian
perc
enta
ge
< $1 M $1 M–$10 M $10 M–$50 M >$50 M
Note: While figure 3.3 compares median expense levels of four foundation size groups across five different staff size categories, presenting different foundation size levels in a single chart may be misleading.For example, only one foundation with giving over $50 million has staff between 2 and 3 (not shown in the chart). At the other extreme, no foundations with giving under $1 million and only one foundationwith giving between $1 million and $10 million report having more than 50 staff.
independent foundations vary across different staff sizes. Foundations are divided into four giving groupsdefined by the total grant money given out in 2001, ranging from under $1 million to over $50 million.
● Charitable operating and administrative expenses as a percentage of qualifying distributions consis-tently increased with number of staff for each giving group. For example, the median expense ratioof foundations with giving between $1 million and $10 million rose from 3.2 percent for the 205foundations employing 1 staff to 41.6 percent for the single foundation with more than 50 staff.
● For each staff size category, expenses as a percentage of qualifying distributions declined by givingsize, suggesting the presence of economies of scale. For example, in the 4 to 14 staff size category,expenses as a share of qualifying distributions was 10.5 percent for the 270 foundations with givingbetween $1 million and $10 million compared to 1.4 percent for the 11 foundations with giving over$50 million.
● The most typical staff size for the 41 foundations with giving over $50 million was between 15 and50. The 15 large foundations that fell into this staff size category had a median expense ratio of5.7 percent.
Staffing is a significant determinant of charitable operating and administrative expense levels in indepen-dent foundations. However, economies of scale enable smaller costs-to-qualifying distribution ratios forlarger givers with a particular staff size compared to smaller givers with the same staff size.
Influence of Family Involvement
Family foundations are a subset of independent foundations that report or demonstrate measurable donoror donor-family involvement.2 Of the 8,876 independent foundations included in this dataset, 5,127 (57.8percent) meet the criteria for family foundations defined by the Foundation Center. Figure 3.4 shows thedifference in the median ratios of charitable operating and administrative expenses to qualifying distribu-tions of staffed family and non-family independent foundations by six giving size groups.

Foundation Operating Characteristics & Charitable Expenses � 15
Figure 3.4. Charitable Operating and Administrative Expenses as a Percentage of Qualifying Distributions: Family vs. Non-Family (Staffed Independent Foundations, N � 2,327)
0%
2%
4%
6%
8%
10%
12%
< $500 K $500 K–$1 M $1 M–$5 M $5 M–$10 M $10 M–$50 M > $50 M All
Giving group
Med
ian
perc
enta
ge
Non-family (n = 1,047) Family (n = 1,280)
Note: Figure 3.4 pertains only to the 1,280 staffed family foundations. Among all independent foundations in the study dataset, 5,127 were classified as having donor-family involvement.
● Staffed family foundations had lower median charitable expenses than non-family foundations in allgiving categories.
● For family foundations, the median charitable expense ratio consistently declined as giving increased,from 6.7 percent for the smallest givers to 3.7 percent for those giving $50 million or over, suggestingthe presence of economies of scale.
● Non-family independent foundations did not report the same economies of scale. Moreover, thedifference in charitable expense levels between family and non-family independent foundations wasgreatest for the largest foundations—less than 4 percent compared to over 8 percent.
The lower levels of charitable operating and administrative expenses for family foundations comparedto non-family foundations suggests that family members may help to hold staff-related costs down byproviding additional volunteer or low-cost labor for administering grants and other programs. Familymembers may also contribute office space and perform other volunteer administrative functions, such aslegal and accounting, thereby lowering expense levels.
Influence of Endowed vs. Pass-Through
The vast majority of staffed independent foundations pay for grants and other expenses from earningson their endowments. Foundations with living donors, however, may operate as pass-throughs, withgrants and expenses funded through periodic gifts to the foundation from the donor(s). To distinguishbetween endowed and non-endowed foundations in this study, foundations are defined as pass-throughsif the total amount of their giving in 2001 represented more than 20 percent of the year-end value of theirassets.3 Figure 3.5 compares how charitable operating and administrative expenses as a percentage ofqualifying distributions differs between endowed and pass-through foundations.

16 � Foundation Expenses and Compensation
Figure 3.5. Charitable Operating and Administrative Expenses as a Percentage of Qualifying Distributions: Endowed vs. Pass-Through (Staffed Independent Foundations, N � 2,327)
0% 1% 2% 3% 4% 5% 6% 7% 8% 9%
10%
< $500 K $500 K–$1 M $1 M–$5 M $5 M–$10 M $10 M–$50 M > $50 M All
Giving group
Med
ian
perc
enta
ge
Endowed (n = 2,104) Pass-through (n = 223)
● 223 of the 2,327 staffed independent foundations in the dataset were pass-throughs. The vast majorityof these foundations (83.4 percent) are small, with giving less than $5 million. Only two of the 41foundations with giving over $50 million met the criteria for pass-throughs.
● Endowed foundations reported much higher ratios of charitable operating and administrativeexpenses to qualifying distributions than pass-throughs. This finding was consistent across all giv-ing groups.
Although direct investment expenses are excluded from charitable operating and administrative costs,the higher charitable expense levels associated with endowed foundations compared to pass-throughfoundations suggest that these foundations employ larger and more specialized staff. They may also incurhigher legal and professional fees. Endowed independent foundations are also likely to be older thanpass-throughs and therefore able to reap fewer benefits from direct donor and donor-family involvement.
Influence of Geographic Scope of Giving
The influence of scope of giving on expense ratios is the subject of figure 3.6. The geographic scope ofgiving is taken from foundation survey responses and foundation grants lists.4 Most staffed independentfoundations give locally: 1,852 (81.5 percent) primarily gave only locally or within their state; 309 (13.6percent) gave nationally, and 111 (4.9 percent) gave on a national and international basis. Findings onexpense patterns exhibited in figure 3.6 include:
● Foundations that gave internationally incurred higher costs than those that limited their giving tothe local or national level. These higher expenses may be due to greater travel- and communications-related costs as well as costs associated with conducting due diligence on non-U.S. applicants andgrantees.
● The higher cost of international giving is consistent across giving groups. Nevertheless, medianexpense ratios for international funders declined with giving levels, from 23.1 percent for the smallestgiving group to 11.2 percent for the largest giving group.
● These economies of scale hold for local givers as well; however, the trend does not hold for national-level givers.
● The difference between the cost ratios for international versus local and national organizations wasgreatest for foundations giving less than $500,000 in annual grants.
Foundation Operating Characteristics & Charitable Expenses � 17
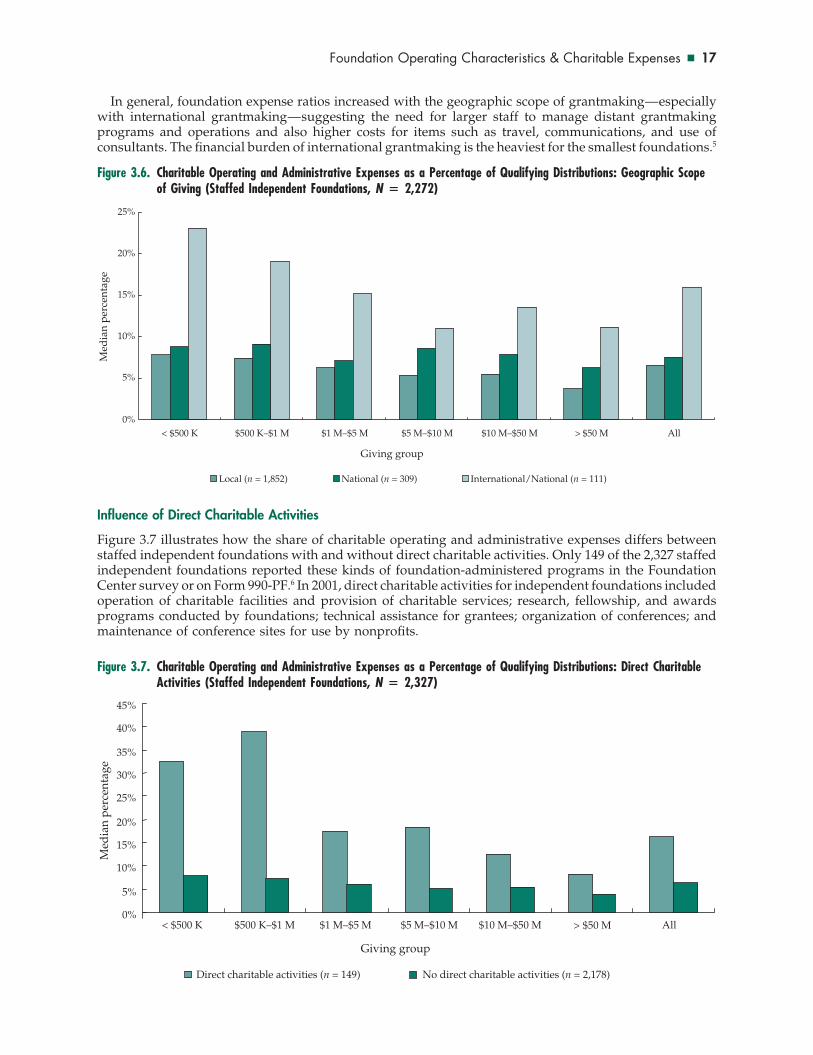
In general, foundation expense ratios increased with the geographic scope of grantmaking—especiallywith international grantmaking—suggesting the need for larger staff to manage distant grantmakingprograms and operations and also higher costs for items such as travel, communications, and use ofconsultants. The financial burden of international grantmaking is the heaviest for the smallest foundations.5
Figure 3.6. Charitable Operating and Administrative Expenses as a Percentage of Qualifying Distributions: Geographic Scopeof Giving (Staffed Independent Foundations, N � 2,272)
0%
5%
10%
15%
20%
25%
< $500 K $500 K–$1 M $1 M–$5 M $5 M–$10 M $10 M–$50 M > $50 M All
Giving group
Med
ian
perc
enta
ge
Local (n = 1,852) National (n = 309) International/National (n = 111)
Influence of Direct Charitable Activities
Figure 3.7 illustrates how the share of charitable operating and administrative expenses differs betweenstaffed independent foundations with and without direct charitable activities. Only 149 of the 2,327 staffedindependent foundations reported these kinds of foundation-administered programs in the FoundationCenter survey or on Form 990-PF.6 In 2001, direct charitable activities for independent foundations includedoperation of charitable facilities and provision of charitable services; research, fellowship, and awardsprograms conducted by foundations; technical assistance for grantees; organization of conferences; andmaintenance of conference sites for use by nonprofits.
Figure 3.7. Charitable Operating and Administrative Expenses as a Percentage of Qualifying Distributions: Direct CharitableActivities (Staffed Independent Foundations, N � 2,327)
0%
5%
10%
15%
20%
25%
30%
35%
40%
45%
< $500 K $500 K–$1 M $1 M–$5 M $5 M–$10 M $10 M–$50 M > $50 M All
Med
ian
perc
enta
ge
Giving group
No direct charitable activities (n = 2,178)Direct charitable activities (n = 149)

18 � Foundation Expenses and Compensation
● Staffed independent foundations that engage in direct charitable activities had higher median expense-to-qualifying distribution ratios than those that did not engage in direct charitable activities.
● Charitable expense ratios declined sharply with amount of giving from a median of more than 30percent for those that gave less than $1 million to less than 10 percent for those that gave in excessof $50 million.
● For a small number of independent foundations, direct charitable activities represented a largerproportion of their charitable disbursements than grantmaking. While these foundations are notclassified legally as operating foundations, they appear to function more like operating foundationsthan grantmaking foundations.
The high expense levels reported by foundations operating their own programs may be attributed toa couple of factors: (1) the staff-intensive nature of such programs and (2) the allocation of resourcescreated by these activities, which may reduce the size of the foundations’ grantmaking programs. Thedifference between the expense ratios of foundations with direct charitable activities and those withoutis most pronounced in the smallest giving category. As noted above, staffing itself represents a highercost for small foundations.
Influence of Grants to Individuals Programs
The next figure illustrates how the ratio of charitable operating and administrative expenses to qualifyingdistributions differs between foundations with and without grants to individuals programs. Grants toindividuals may be in the form of scholarships, fellowships, grants, awards, and prizes.7 To distinguishfoundations that make occasional grants to individuals from those that have full-fledged programs,foundations with grants to individuals programs are defined as those that contribute 10 percent or moreof their grant dollars to individuals. Only 149 of the 2,327 independent staffed foundations in the studydataset met this criterion for 2001.
Figure 3.8. Charitable Operating and Administrative Expenses as a Percentage of Qualifying Distributions: Grants toIndividuals Programs (Staffed Independent Foundations, N � 2,327)
0%
2% 4% 6% 8%
10% 12% 14% 16%
< $500 K $500 K–$1 M $1 M–$5 M $5 M–$10 M $10–$50 M > $50 M All
Med
ian
perc
enta
ge
Giving group
No grants to individuals program (n = 2,178) Grants to individuals program (n = 149)
● Foundations that made grants to individuals were associated with higher expense levels than thosethat did not.
● The higher expense ratios were consistent across all giving levels.● Larger and smaller foundations that made grants to individuals reported nearly comparable median
charitable expense ratios, ranging between 11.2 and 14.9 percent; there was no evidence of economiesof scale.

Foundation Operating Characteristics & Charitable Expenses � 19
The higher expense ratios associated with foundations making grants to individuals reflect the resource-intensive nature of such an activity. Operating a grants to individuals program is likely to involve a largerstaff to manage the program and oversee large numbers of grant applications and grants, and also highercosts associated with advisory committees, outreach and communications efforts, and compliance withlegal and reporting requirements.
Influence of Maintaining Web Sites
Figure 3.9 illustrates how median percentages of charitable and administrative expenses to qualifyingdistributions vary between staffed independent foundations with and without web sites. We includedweb sites in the analysis as an indicator of larger communications and outreach efforts by the foundationsthat maintained them.8 The bulk of the larger foundations in the dataset have web sites, while a majorityof the smaller foundations do not. For example, 37 of the 41 foundations (90.2 percent) with giving over$50 million have web sites compared with only 65 of the 703 foundations (9.2 percent) giving lessthan $500,000.
Figure 3.9. Charitable Operating and Administrative Expenses as a Percentage of Qualifying Distributions: Web Sites (StaffedIndependent Foundations, N � 2,327)
0%
2%
4%
6%
8%
10%
12%
14%
16%
18%
< $500 K $500 K–$1 M $1 M–$5 M $5 M–$10 M $10 M–$50 M > $50 M All
Med
ian
perc
enta
ge
Giving group
No web site (n = 1,776) Web site (n = 551)
● Foundations with web sites reported notably higher charitable expense-to-qualifying distributionratios than those without.
● The higher charitable expense levels for foundations with web sites are consistent across givinggroups. Nevertheless, median expense ratios for foundations with web sites declined with givinglevels from 16.7 percent for the smallest givers to 6.4 percent for those giving $50 million or more.
While the presence of web sites appears to be associated with higher expense levels, it is unlikely thatweb sites alone influence these levels. Rather, it seems possible that foundations that invest in developingand maintaining web sites have other cost factors (e.g., higher communications expenses, higher profes-sional fees, and/or larger staff) that exert an upward pressure on expenses.
Summary
For independent foundations, maintaining a large staff, conducting international programs, engaging indirect charitable activities, and maintaining a web site (a possible indicator of a larger communicationseffort) raises expense levels; however, the increase is greater for smaller than for larger givers. Making

20 � Foundation Expenses and Compensation
grants to individuals also exerts an upward pressure on expense ratios. By contrast, donor-family involve-ment and operating as a pass-through foundation tend to lower charitable expenditure levels.
CORPORATE FOUNDATIONS
Corporate foundations are subject to the same minimum 5 percent payout requirement as independentfoundations and the same IRS filing requirements. For example, they must report identical categories ofcharitable operating and administrative expenses as well as other disbursements that count toward qualify-ing distributions. Yet corporate foundations differ from independents in both the extent and the composi-tion of their charitable expenses. As noted earlier, the relationship of these foundations with their parentcompany provides them with access to ‘‘free’’ administrative, technical, and staffing support not availableto independents. This support, in turn, is reflected in their comparatively low expense ratios.
For the 807 largest corporate foundations in this study, the sum of charitable operating and administrativeexpenses represents 6 percent of the total qualifying distributions that meet the payout requirement.9
This subsection of the report examines how certain operating styles affect the ratio of charitable operatingand administrative expenses to qualifying distributions in corporate foundations. Compared with indepen-dent foundations, fewer characteristics tested in this study showed a clear relationship to expenses. Thisfinding in part underscores the difficulty in determining actual corporate foundation expenses, sinceexpenses paid directly by the parent company are not reported on Form 990-PF. Still, staff size, presenceof direct charitable activities, and geographic scope of giving were found to impact corporate foundationexpense levels.
Influence of Paid Staff
Only 260 or less than one-third of the 807 larger corporate foundations in the dataset reported paid staffin the Foundation Center’s annual survey or reported staff compensation on Form 990-PF. Thus, it appearsthat a majority of corporate foundations are staffed or administered by employees of the parent companies,which bear the cost of compensating these individuals. The close ties between corporate foundations andtheir parent companies make it difficult to compare data on corporate foundation staff size and compensa-tion with data on independent and community foundations.
Figure 3.10 illustrates the influence of paid staff on the relationship between charitable operating andadministrative expenses and qualifying distributions of corporate foundations. Due to the relatively smallnumber of corporate foundations in the dataset reporting paid staff, foundations are divided into threesize groups.
Figure 3.10. Charitable Operating and Administrative Expenses as a Percentage of Qualifying Distributions: Staffed andUnstaffed Corporate Foundations (N � 772)
0.0%
0.2%
0.4%
0.6%
0.8%
1.0%
1.2%
< $1 M $1 M–$5 M > $5 M All
Med
ian
perc
enta
ge
Giving group
Unstaffed (n = 512) Staffed (n = 260)

Foundation Operating Characteristics & Charitable Expenses � 21
● Staffed corporate foundations recorded higher median expense ratios than unstaffed foundationsregardless of foundation size. While staffing had an effect on expense levels, expense-to-qualifyingdistribution ratios were relatively low for both staffed and unstaffed corporate foundations.10
Support in the form of technical and specialized services, staffing, and infrastructure from the donorcompany contribute to the comparatively low expense ratios for staffed and unstaffed corporate founda-tions.
Influence of Staff Size
Figures 3.11 and 3.12 show how an increase in staff size affects the ratio of charitable operating andadministrative expenses to qualifying distributions for small and large corporate foundations. Foundationscontributing less than $5 million in 2001 are classified as small and those making grants totaling $5million or over are termed large. Separate staff size categories were created for small and large corporatefoundations based on the distribution of staff.
Figure 3.11. Charitable Operating and Administrative Expenses as a Percentage of Qualifying Distributions: Giving Less than$5 M (Corporate Foundations, N � 183)
0%
1%
2%
3%
4%
5%
6%
1 (n = 58) 2–3 (n = 93) > 3 (n = 32) All (n = 183)
Number of staff
Med
ian
perc
enta
ge
Figure 3.12. Charitable Operating and Administrative Expenses as a Percentage of Qualifying Distributions: Giving $5 M orOver (Corporate Foundations, N � 73)
0.0%
0.5%
1.0%
1.5%
2.0%
2.5%
3.0%
1–2 ( n = 8) 3–5 ( n = 30) 5–8 ( n = 18) > 8 ( n = 17) All (n = 73)
Med
ian
perc
enta
ge
Number of staff

22 � Foundation Expenses and Compensation
● Corporate foundations with the largest number of paid staff reported higher ratios of charitableexpenses to qualifying distributions than staffed foundations overall (5.3 percent versus 0.4 percentfor foundations giving less than $5 million, and 2.7 percent versus 1 percent for foundations giving$5 million or over). This finding holds for both small and large corporate foundations.
● Among corporate foundations giving less than $5 million, charitable expense levels consistentlyincreased with number of staff, from 0.3 percent for those with one staff to over 5 percent for thosewith four or more (figure 3.11).
● Charitable expense levels in large foundations also increased consistently with size of staff—from0.4 percent for those with one or two staff to 2.7 percent for those with nine or more (figure 3.12)—but the difference in expense levels associated with various staff sizes was less pronounced than forthe smaller corporate foundations. Moreover, large corporate foundations with the most staff hadlower expense ratios than small foundations with the largest staff (2.7 percent versus 5.3 percent),suggesting the existence of economies of scale.
These analyses suggest a relationship between staffing and expenses for corporate foundations thatreport paid staff. However, as noted earlier, information on the staffing patterns of corporate foundationsoverall is limited and somewhat unreliable because corporate foundations are often staffed with corporateemployees who may not be on the foundation payroll. Therefore, the remaining analyses of how operatingstyles affect the expense levels of corporate foundations focus on all corporate foundations rather thanjust those that report staff.
Influence of Direct Charitable Activities
Figure 3.13 shows how charitable administrative and operating expense levels differ for small and largecorporate foundations that engage in direct charitable activities and those that do not. Only 16 corporatefoundations reported foundation-administered programs and other direct charitable activities in additionto grants. In 2001, these activities included walkathons and other fundraising events to support medicalresearch, financial assistance programs, professional guidance and training programs, production anddissemination of public information materials (e.g., related to health promotion and affordable homeowner-ship), and technical and strategic support. For some corporate foundations, direct charitable activitiesrepresented the majority of their expenses.
● Corporate foundations that engaged in direct charitable activities had notably higher expense ratiosthan those that did not.
● Large givers that engaged in direct charitable activities reported higher median percentages thangivers making grants of less than $5 million (51.5 percent versus 10.8 percent). For several of theselarge donors, spending on direct charitable activities represented the vast majority of their charitableexpenses, far exceeding grantmaking.
Figure 3.13. Charitable Operating and Administrative Expenses as a Percentage of Qualifying Distributions: Direct CharitableActivities (Corporate Foundations, N � 772)
0%
10%
20%
30%
40%
50%
60%
< $5 M (n = 651) $5 M and > (n = 121) All (n = 772)
Giving group
Med
ian
perc
enta
ge
No direct charitable activities (n = 756) Direct charitable activities (n = 16)
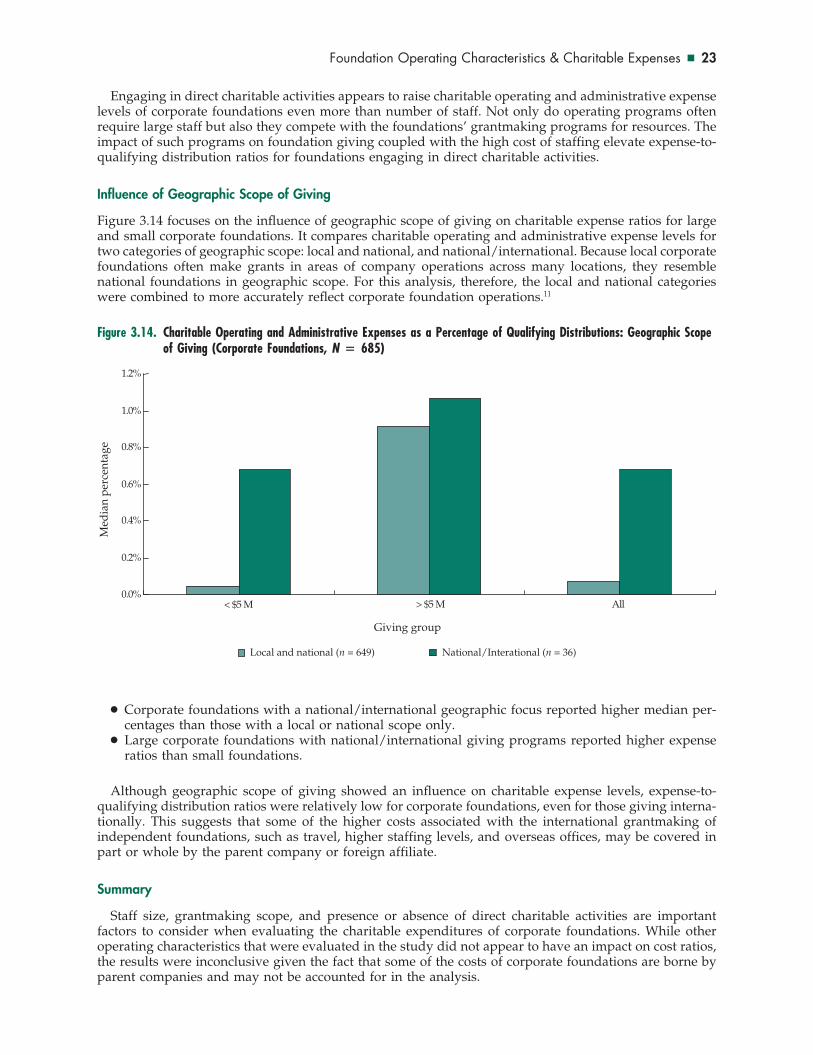
Foundation Operating Characteristics & Charitable Expenses � 23
Engaging in direct charitable activities appears to raise charitable operating and administrative expenselevels of corporate foundations even more than number of staff. Not only do operating programs oftenrequire large staff but also they compete with the foundations’ grantmaking programs for resources. Theimpact of such programs on foundation giving coupled with the high cost of staffing elevate expense-to-qualifying distribution ratios for foundations engaging in direct charitable activities.
Influence of Geographic Scope of Giving
Figure 3.14 focuses on the influence of geographic scope of giving on charitable expense ratios for largeand small corporate foundations. It compares charitable operating and administrative expense levels fortwo categories of geographic scope: local and national, and national/international. Because local corporatefoundations often make grants in areas of company operations across many locations, they resemblenational foundations in geographic scope. For this analysis, therefore, the local and national categorieswere combined to more accurately reflect corporate foundation operations.11
Figure 3.14. Charitable Operating and Administrative Expenses as a Percentage of Qualifying Distributions: Geographic Scopeof Giving (Corporate Foundations, N � 685)
0.0%
0.2%
0.4%
0.6%
0.8%
1.0%
1.2%
< $5 M > $5 M All
Med
ian
perc
enta
ge
Giving group
Local and national (n = 649) National/Interational (n = 36)
● Corporate foundations with a national/international geographic focus reported higher median per-centages than those with a local or national scope only.
● Large corporate foundations with national/international giving programs reported higher expenseratios than small foundations.
Although geographic scope of giving showed an influence on charitable expense levels, expense-to-qualifying distribution ratios were relatively low for corporate foundations, even for those giving interna-tionally. This suggests that some of the higher costs associated with the international grantmaking ofindependent foundations, such as travel, higher staffing levels, and overseas offices, may be covered inpart or whole by the parent company or foreign affiliate.
Summary
Staff size, grantmaking scope, and presence or absence of direct charitable activities are importantfactors to consider when evaluating the charitable expenditures of corporate foundations. While otheroperating characteristics that were evaluated in the study did not appear to have an impact on cost ratios,the results were inconclusive given the fact that some of the costs of corporate foundations are borne byparent companies and may not be accounted for in the analysis.

24 � Foundation Expenses and Compensation
COMMUNITY FOUNDATIONS
As discussed earlier, community foundations differ from private foundations, both operationally and interms of federal regulations. For example, unlike private foundations, community foundations are notsubject to the 5 percent annual payout requirement.12 As a result, the Form 990 filed by communityfoundations does not specifically track payout or qualifying distributions. For the purposes of this study,we use total program services expenses (which includes grants paid and administrative expenses relatedto grantmaking and other charitable programs) as a proxy for qualifying distributions.13 The total ofprogram service expenses minus grants paid is used as a substitute for charitable operating and administra-tive expenses.14
The sum of charitable operating and administrative expenses represents 8 percent of qualifying distribu-tions for the 317 largest community foundations in this dataset.
This subsection of the report focuses on how charitable expense levels of community foundations varyby foundation operating styles. Operating characteristics and activities that appear to have an impact oncommunity foundation expense ratios include staff size, foundation age, engagement in direct charitableactivities, and presence of web sites.
Influence of Staff Size
Of the 317 community foundations in the study, 306 (96.5 percent) reported paid staff in the FoundationCenter’s annual survey or reported staff compensation in Form 990. Unlike independent and familyfoundations, which may draw on family members and other volunteers to administer programs, andcorporate foundations, which may draw on their parent corporations’ resources, most community founda-tions depend on paid staff to manage foundation operations.
The next two figures explore the influence of staff size on charitable expenses as a share of qualifyingdistributions. Staff size categories are based on the distribution of community foundations in the studydataset across staff number. To account for differences in staff size of large and small community founda-tions, separate staff size categories were created for foundations giving less than $3 million and thosegiving $3 million or over.
Figure 3.15. Charitable Operating and Administrative Expenses as a Percentage of Qualifying Distributions: Giving Less than$3 M (Community Foundations, N � 208)
0%
2%
4%
6%
8%
10%
12%
14%
16%
18%
20%
1–2 (n = 77) 3–4 (n = 37) 5–6 (n = 72) > 6 (n = 22) All (n = 208)
Number of staff
Med
ian
perc
enta
ge
● For small foundations, median charitable operating and administrative expenses as a percentage ofqualifying distributions increased with staff size from 3.1 percent for those with up to two staff to18.5 percent for those with seven or more staff.
● The pattern of median charitable expense shares across staff size categories in large foundations issimilar to that in small foundations: expense levels increase with an increase in number of staff.

Foundation Operating Characteristics & Charitable Expenses � 25
Figure 3.16. Charitable Operating and Administrative Expenses as a Percentage of Qualifying Distributions: Giving $3 M orOver (Community Foundations, N � 95)
0%
1%
2%
3%
4%
5%
6%
7%
8%
9%
1–9 (n = 34) 10–19 (n = 31) > 19 (n = 30) All (n = 95)
Number of staff
Med
ian
perc
enta
ge
● Increases in staff size have a stronger influence on expense levels of the smaller community foundationsthan of the larger ones. For example, small foundations with the largest staff level (7 or more) reporteda median expense ratio of 18.5 percent, while large foundations with the most staff (20 or more)reported a ratio of 8 percent.
Staff size is a significant indicator of expense levels in community foundations, regardless of foundationsize. Nevertheless, foundation size does affect the magnitude of expense ratios: cost levels of smallerfoundations are more strongly affected by staff size increases compared to those of larger foundations.
Since nearly all of the 317 community foundations in this study are staffed, the remaining analysescover all the community foundations in the dataset; they do not differentiate between staffed and unstaffedfoundations.
Influence of Foundation Age (Establishment Period)
Figure 3.17 illustrates how age affects the relationship between charitable operating and administrativeexpenses and qualifying distributions for small and large community foundations.15 Foundations aregrouped into four establishment periods ranging from before 1950 to since 1990.
● Whether large or small, the youngest community foundations had the highest median ratios ofcharitable expenses to qualifying distributions.
● Among larger community foundations, expense levels were highest for the youngest foundations—those formed since 1990—and for the oldest foundations.
● In contrast, among smaller community foundations, while expense levels were also the highest forthe youngest foundations, they were the lowest for the oldest foundations.
The higher median expense levels for new community foundations suggest the existence of high start-up costs. Another possible explanation for the elevated expense ratios is that new community foundationstypically engage in very limited grantmaking in their early years of operation while they raise funds andbuild their endowments. As grantmaking programs ramp up, administrative expense ratios decrease.
Also, it appears that as small community foundations mature, more evolved organizational and grant-making techniques result in operational efficiencies that lower charitable expense levels. In large founda-tions, however, these economies diminish as the organizations grow in scope, confront new organizationaland logistical challenges, and play more diverse non-grantmaking roles in their communities, such asconvening local stakeholders around important community issues.

26 � Foundation Expenses and Compensation
Figure 3.17. Charitable Operating and Administrative Expenses as a Percentage of Qualifying Distributions: Foundation Age(Community Foundations, N � 307)
0%
1%
2%
3%
4%
5%
6%
7%
8%
9%
10%
Before 1950 1950 to 1969 1970 to 1989 Since 1990 All
Establishment period
Med
ian
perc
enta
ge
< $3 M (n = 214) > $3 M (n = 93)
Influence of Direct Charitable Activities
Figure 3.18 shows how the charitable expense share of qualifying distributions varies between communityfoundations that engage in direct charitable activities and those that do not.16 Only nine communityfoundations in the study dataset reported such activities for 2001. A review of their programs revealed awide range of activities, from operating community service and leadership training programs, to organizingcultural and educational programs, to providing technical support and other resources to enhance nonprofitmanagement.
Figure 3.18. Charitable Operating and Administrative Expenses as a Percentage of Qualifying Distributions: Direct CharitableActivities (Community Foundations, N � 316)
0%
2%
4%
6%
8%
10%
12%
Med
ian
perc
enta
ge
No direct charitable activities(n = 307)
Direct charitable activities(n = 9)
● Similar to private foundations, community foundations that operated their own charitable programshad a higher overall median expense-to-qualifying distribution ratio compared to those that didnot—10.4 percent versus 5.5 percent.
● Among these nine community foundations, charitable expense ratios ranged from a low of 5.4 percentto a high of 96.7 percent.17

Foundation Operating Characteristics & Charitable Expenses � 27
For community foundations engaging in direct charitable activities that reported high percentages ofexpenses to qualifying distributions, operating programs represented a large share of the foundations’charitable operating and administrative expenses. In fact, research showed that a few community founda-tions functioned more as operating foundations than as grantmaking foundations.
Influence of Maintaining Web Sites
Due to the very public nature of the role played by community foundations in the areas they serve andbecause they are constantly seeking new donors, community foundations are much more likely than othertypes of foundations to create and maintain web sites. For example, almost 72 percent of the communityfoundations in this study have web sites, compared with about 24 percent of staffed independents.Investment in the creation and maintenance of web sites is thought to be indicative of a larger communica-tions effort by foundations. We therefore included the variable in this analysis. Figure 3.19 demonstrateshow charitable operating and administrative expenses as a percentage of qualifying distributions varywith the presence or absence of web sites for large and small community foundations.
Figure 3.19. Charitable Operating and Administrative Expenses as a Percentage of Qualifying Distributions: Web Sites(Community Foundations, N � 316)
0.0%
1.0% 2.0% 3.0% 4.0% 5.0% 6.0% 7.0% 8.0% 9.0%
< $3 M > $3 M All
Med
ian
perc
enta
ge
Giving group
No web site (n = 89) Web site (n = 227)
● Almost all of the community foundations giving $3 million or more (93 of the 95) maintained web sites.● Foundations with web sites had greater expense levels compared to those without; this finding held
true for small and large community foundations.
While the presence of web sites is accompanied by higher expense-to-qualifying distribution ratios incommunity foundations, it is unlikely that web sites alone influence these high ratios. As found earlierfor independent foundations, it seems that the existence of web sites may be an indicator of other costfactors such as higher overall communications costs, higher professional fees, and/or larger staff, whichmay in turn influence community foundation expense levels.
Summary
For community foundations, having paid staff, engaging in direct charitable activities, and maintainingweb sites exert an upward pressure on charitable expense ratios. Young community foundations, regardlessof size, have higher expense levels, suggesting the presence of high start-up costs associated with establish-ing community foundation operations.

28 � Foundation Expenses and Compensation
N O T E S
1. Other variables tested in the analyses include asset size, number of grants, average grant size, level of compensa-tion paid to trustees, and presence of publications. None of these variables showed a consistent pattern of influenceon expense levels for independent, corporate, or community foundations.
2. The Foundation Center uses a number of objective and subjective criteria to identify independent foundationswith donor or donor-family involvement: (1) if a foundation identifies itself as a ‘‘family foundation’’ in the Center’sannual survey; (2) if the foundation has ‘‘Family’’ or ‘‘Families’’ in its name; (3) if a living donor’s surname matchesthe foundation’s name; or (4) if at least two trustees’ surnames match a living or deceased donor’s name.
3. Of the 8,876 independent foundations in this dataset, 1,764 qualified as pass-through foundations according tothe study’s criteria.
4. The Foundation Center surveys foundations, examines their grants lists annually to ascertain geographic scopeof giving, and codes foundations as local, national, national/international, or international only.
5. While overall expense ratios for international giving may be higher, international funders who work mainly indeveloping countries point out that the benefit derived per grant dollar is much higher in these areas than in theU.S. In fact, many small to medium-sized foundations engage in international work precisely because they believethat their grant dollars will have a greater impact on the problems of the most impoverished countries.
6. Another 543 filled in information on Form 990-PF, Part IX-A mainly about their grant programs, suggesting thatthis part of the form is poorly understood and used inconsistently.
7. The Foundation Center collects data on a foundation’s grants to individuals separately from its grants toorganizations through its annual foundation survey and from grants lists.
8. The Foundation Center collects data on foundation web sites using web site tracking software and throughregular staff searches to identify newly formed sites.
9. The ratio of the sum of charitable operating and administrative expenses to qualifying distributions drops tojust 2.3 percent if four large corporate foundations with substantial direct charitable activity are excluded. The lowerratio is much closer to the median expense-to-qualifying distribution ratio (0.8 percent) shown in figure 3.10.
10. Compensation as a percentage of total charitable operating and administrative expenses was the lowest forcorporate foundations (12 percent) compared to independent foundations (46 percent) or community foundations(36 percent).
11. The Foundation Center applies the same criteria for classifying independent and corporate foundations bygeographic scope: in the absence of specified guidelines, foundations giving in ten or more states are classified asnational while those giving in fewer than ten states are classified as local. In practice, however, most ‘‘local’’ independentfoundations give in only one or two states. In contrast, many ‘‘local’’ corporate donors give in areas of companyoperation across several states. Since local and national corporate foundations may differ only slightly in theirgrantmaking scope, they are grouped together in figure 3.14.
12. A private foundation (whether independent or corporate) must pay out annually for charitable purposes atleast 5 percent of its average asset value, regardless of its income each year.
13. Form 990, Part II, line 44, column B.14. Form 990, Part II, line 44, column B–Part II, lines 22 and 23, column B.15. The Foundation Center collects data on the year of foundation establishment from the initial Form 990-PF or
Form 990 filed by each foundation and through its annual foundation survey.16. The Foundation Center collects information on foundation-administered programs through its annual survey.17. The foundation with the charitable expenses-to-qualifying distribution ratio of almost 97 percent reported
organizing of cultural, educational, and athletic events in its community as its primary charitable mission. Thefoundation’s direct charitable activities alone accounted for close to half (47.2 percent) of all its charitable disbursements,while giving accounted for slightly over 3 percent.

IVFOUNDATION COMPENSATIONPATTERNS
The final purpose of this study is to explore compensation amounts and patterns for the different typesof foundations. This report provides the first analysis of executive and trustee compensation levels
across a large representative group of foundations. The results provide context and data to informfoundation boards and staff and the current public policy debates.
In this section, we consider two measures of compensation levels: total aggregate compensation thatis included in qualifying distributions, and individual-level trustee and executive compensation.1
AGGREGATE COMPENSATION
Aggregate compensation includes staff salaries and benefits and all forms of trustee remuneration andreimbursement that are included in qualifying distributions.2 Two-thirds (66.1 percent) of the 10,000 largestfoundations did not report any aggregate compensation; among the nearly 3,400 that did, compensationpatterns varied by foundation type. To derive a value of compensation that has meaning across foundationsof various sizes, we compared aggregate compensation with total giving. The next two figures illustratehow the ratio of aggregate compensation to giving varies by foundation type. Findings associated withfigure 4.1 include:
● The median percentage of compensation to giving was higher for community and independentfoundations (roughly 5 percent) and lower for corporate foundations (nearly 2 percent).
● Among community foundations, compensation percentages declined by giving group, suggestingeconomies of scale related to these expenses.
● The median percentage of compensation to giving for independent foundations that gave over $50million was 3 percent, compared with roughly 5 percent for the smallest givers.
In sum, smaller community foundations reported the highest ratios of compensation to giving. Thesepercentages did not vary much by giving group for independent and corporate foundations. Furthermore,the compensation-to-giving ratio was comparatively lower across all giving groups for corporate founda-tions.

30 � Foundation Expenses and Compensation
Figure 4.1. Compensation as a Percentage of Giving for Foundations that Compensate (N � 3,388)
0%
2%
4%
6%
8%
10%
12%
< $500 K $500 K–$1 M $1 M–$5 M $5 M–$10 M $10 M–$50 M > $50 M All
Giving group
Med
ian
perc
enta
ge
Independent (n = 3,068) Corporate (n = 126) Community (n = 194)
Figure 4.2 illustrates the distribution of independent, corporate, and community foundations acrossdifferent ranges of the ratio of compensation to giving. The bars in the chart represent the share offoundations that fall into specific ranges.
Figure 4.2. Range of Compensation to Giving for Foundations that Report Compensation (N � 3,388)
0%
10%
20%
30%
40%
50%
60%
70%
80%
< 5% 5%–10% 10%–15% 15%–20% 20%–30% 30%–50% > 50%
Per
cent
age
of fo
und
atio
ns
Independent (n = 3,068) Corporate (n = 126) Community (n = 194)
● Of the nearly 3,400 foundations that reported compensation, roughly four in five, regardless of type,compensated at less than 10 percent of giving. Most foundations fell below 5 percent.
● Nevertheless, a small number of foundations reported compensation to giving greater than 30 percent.A handful, mainly independent foundations, reported compensation to giving over 50 percent.3
A preliminary investigation into the small number of foundations reporting compensation of over 30percent of giving showed that payment of deferred compensation to retiring executives in 2001 andexecution of large operating programs contributed to the low levels of giving relative to expenses inseveral of these foundations. Nevertheless, this group deserves further study.

Foundation Compensation Patterns � 31
TRUSTEE AND EXECUTIVE COMPENSATION
The remaining examination of compensation focuses on compensation paid to individual trustees, institu-tional trustees, and foundation executives. Data for this analysis come from foundation reporting onthe titles, number of hours worked, and compensation amounts of officers, directors, trustees, and keyemployees.4 Compensation includes any combination of remuneration, fringe benefits (current or deferred),and expense accounts.5, 6
Individual Trustee Compensation
Individual trustees are members of a foundation’s governing board who spend a limited amount of timeprimarily providing governance for the foundation. Since Forms 990-PF and 990 do not ask foundationsto separate trustees from key staff, users must make inferences about the primary role of such officerslisted on the form. We considered the titles, hours worked, salaries, benefits package, and relative positionin the foundation to identify each person as either a staff member or a trustee. The 10,000 foundationsin the study reported a total of 46,526 trustees, not including staff who also serve as trustees. Figure 4.3shows the number of these trustees that are compensated and the number of foundations that compen-sate trustees.
Figure 4.3. Individual Trustee Compensation Patterns
n=6,927
n=173
n=32
n=2,110
n=61
n=10
0%
5%
10%
15%
20%
25%
30%
Independent Corporate Community
% of individual trustees who receive compensation % of foundations that compensate trustees
● Trustee compensation patterns vary by foundation type.● Nearly one-fourth (23.8 percent) of independent foundations compensated trustees. Fewer corporate
(7.6 percent) and community foundations (3.2 percent) did so.7
● Of the 2,181 foundations that compensated trustees, 2,110 (96.7 percent) were independent founda-tions.
● Nearly 20 percent of independent foundation trustees received compensation, while only 3.2 percentof corporate foundation trustees and less than 1 percent of community foundation trustees werecompensated.
● Of the 7,132 compensated trustees, nearly 7,000 represented independent foundations.
Collectively, the 7,132 compensated individual trustees received $111.6 million in 2001. The mediancompensation was $7,750; the 75th percentile was $20,036. The average (mean) compensation was $15,637;when uncompensated trustees are included, the mean drops to $2,417. Independent foundations are morelikely to compensate individual trustees than other foundation types. Levels of compensation are detailedfurther in figure 4.4, which examines compensation ranges for individual trustees of independent andcorporate foundations. The 32 compensated community foundation trustees were too few to include inthe analysis.

32 � Foundation Expenses and Compensation
Figure 4.4. Compensation Ranges for Compensated Individual Trustees
0%
5%
10%
15%
20%
25%
30%
35%
40%
< $1 K $1 K–$3 K $3 K–$10 K $10 K–$25 K $25 K–$50 K $50 K–$100 K > $100 K
Per
cent
age
of c
ompe
nsat
ed tr
uste
es
Independent foundation trustees (N = 6,927) Corporate foundation trustees (N = 173)
● The largest categories of independent foundation trustees were paid in the ranges of $3,000 to $10,000and $10,000 to $25,000; four-fifths of independent foundation trustees received less than $25,000, and56 percent earned less than $10,000.
● At the high end of the spectrum, 1 percent of independent foundation trustees (69 individuals)received over $100,000; the highest paid individual trustee in 2001 received $211,538.
● Eighty percent of the 173 compensated corporate foundation trustees received less than $10,000 inremuneration, benefits, and expense allowances. In fact, 34 percent received less than $1,000, suggest-ing that they were mainly reimbursed for expenses.
Not only is individual trustee compensation more common for independent foundations, but trusteesof these foundations also receive greater compensation. As illustrated above, only 69 foundation trusteesreceive more than $100,000 in compensation, and all are from independent foundations.
Institutional Trustee Compensation
Of the 10,000 foundations in the study, 1,213 listed a bank, law firm, investment firm, or other institutionamong their trustees.8 Some foundations listed more than one institutional trustee, so the number ofinstitutional trustees numbered 1,340. Institutional trustees typically play important managerial rolesin foundations: managing assets, keeping books, providing legal representation, and filing regulatorydocuments. Among all foundations in the study, 743 provided compensation to an institutional trusteeonly, suggesting that these institutions were running the foundations (see Inset, page 12).
Figure 4.5 illustrates the distribution of institutional trustees in independent and corporate foundationsacross various ranges of compensation. Of the 1,340 institutional trustees reported, 1,248 (93.3 percent)received compensation; these included 1,186 independent foundation trustees and 57 corporate foundationtrustees. Both compensated and uncompensated trustees are included in figure 4.5. The five compensatedinstitutional trustees listed by community foundations are too few to include in this analysis.
● Institutional trustees typically received higher compensation than individual trustees; the mediancompensated institutional trustee received $39,049.
● Institutional trustees received higher compensation from independent foundations than from corpo-rate foundations: the largest category of independent foundation institutional trustees was paid inthe $30,000 to $60,000 range, compared with less than $10,000 for corporate foundation institu-tional trustees.9
● Five institutional trustees received in excess of $1 million in 2001; 191 received over $100,000 each.
Past research on trustee compensation has not separated individual trustees from institutional trustees.By doing so, this study has been able to document that institutional trustees collectively received $83.2million in 2001. Similar to individual trustee compensation, institutional trustee compensation is largelya practice of independent foundations.

Foundation Compensation Patterns � 33
Figure 4.5. Compensation Ranges for Institutional Trustees (N � 1,335)
0%
5%
10%
15%
20%
25%
30%
35%
No compensation
< $10 K $10 K–$30 K $30 K–$60 K $60 K–$100 K $100 K–$200 K > $200 K
Per
cent
age
of in
stit
utio
nal t
rust
ees
Independent (n = 1,263) Corporate (n = 72)
Foundation Executive Compensation
This report defines foundation executives as presidents, chief executive officers, and executive directorswho regularly spend a substantial amount of time operating the daily affairs of the foundation. Whilesome executives also serve on their foundation’s governing board, they are counted here as staff and arenot included in analyses of trustees.10
Of the 2,923 foundations reporting paid staff in 2001, 1,005 foundations (34.4 percent) listed a paid staffmember with the title executive director, president, or chief executive officer.11, 12 Only paid staff areincluded in the analysis; uncompensated executives are not included.
Figure 4.6 shows the median compensation of foundation executives across different asset categoriesfor independent, corporate, and community foundations.
Figure 4.6. Median Compensation of Foundation Executives by Foundation Type and Asset Size
$-
$50,000
$100,000
$150,000
$200,000
$250,000
$300,000
< $10 M(n = 60)
$10 M–$200 M(n = 157)
>$200 M(n = 24)
< $10 M(n = 20)
> $10 M(n = 16)
< $10 M(n = 132)
$10 M–$200 M(n = 475)
>$200 M(n = 121)
Community foundations Corporate foundations Independent foundations
Med
ian
com
pens
atio
n
Asset group
● Asset size exerts a greater influence on executive compensation than foundation type. While themedian salary of executives overall was $100,209, the median executive compensation in foundationswith over $200 million in assets was $200,000. In contrast, the median executive in foundations withless than $10 million in assets received approximately $50,000 in compensation in 2001.13
● Compensation paid to executive staff in 2001 ranged widely from a low of $88 paid to an executivedirector and trustee with a 20-hour workweek to highs of over $1 million paid to three presidents.The top compensated executive in 2001 received nearly $2 million, due largely to a $1.5 million bonusfor his participation in the sale of appreciated foundation assets.

34 � Foundation Expenses and Compensation
Figure 4.7 illustrates the distribution of compensation for foundation executives in independent andcommunity foundations. The 36 compensated executives listed in corporate foundation 990-PFs are toofew to establish a trend across compensation categories.
Figure 4.7. Compensation Ranges for Foundation Executives
0%
5%
10%
15%
20%
25%
30%
35%
40%
< $30 K $30 K–$60 K $60 K–$100 K $100 K–$150 K $150 K–$200 K > $200 K
Per
cent
age
of fo
und
atio
n ex
ecut
ives
Independent (N = 728) Community (N = 241)
● Community foundation executive compensation peaked in the $60,000 to $100,000 range, with one-third of compensated executives falling into this category.
● Executive compensation in independent foundations was more evenly dispersed across compensationcategories ranging from $60,000 to $200,000.
While community foundations infrequently compensate trustees, they are the most likely to compensateexecutives. However, most community foundation executives received less than $100,000 in compensation.
SUMMARY
Two-thirds of the foundations in this study reported no compensation. Among those that did compensate,community foundations had the highest ratio of aggregate compensation to giving. This was especiallytrue for the smallest community foundations (giving less than $500,000). Among independent and corporatefoundations, the compensation-to-giving ratio varied only modestly across the different giving groups(from roughly 2 to 5 percent), although corporate foundations consistently reported lower ratios.
The practice of compensating individual trustees is most common among independent foundations.While most of the compensated independent foundation individual trustees received less than $10,000,a few received over $100,000. In contrast, among corporate foundations, no individual trustee receivedmore than $100,000. In fact, 80 percent of corporate foundation individual trustees who were compensatedreceived less than $10,000.
The story is similar for institutional trustees. Independent foundations are more likely to compensateinstitutional trustees. A few institutional trustees of both independent and corporate foundations receivedcompensation greater than $200,000. As noted earlier, the majority of institutional trustees were the solerecipients of compensation in their foundations, suggesting that they are compensated at higher levelsbecause they are running the foundation. However, additional research is needed to better understandthe various functions performed by these institutions and the associated pay scales.
Finally, compensation of foundation executives is clearly influenced by foundation size. Those withgreater assets, irrespective of foundation type, compensated at higher levels. Unlike trustee compensation,

Foundation Compensation Patterns � 35
executive compensation is more common in community foundations. Most community foundation execu-tives were compensated in the $60,000 to $100,000 range. Most independent foundation executives werecompensated in the $100,000 to $200,000 range. Fewer than 40 corporate foundations in the sample reportedcompensating an executive. This finding suggests that executive compensation was paid directly by thefoundation’s parent company.
N O T E S
1. See Methodology in the appendix for descriptions of these two measures of compensation.2. For private foundations, aggregate compensation includes Form 990-PF, Part I, lines 13–15, column d (sometimes
referred to as ‘‘charitable’’ compensation); for community foundations, it includes Form 990, Part II, lines 25–29, columnB. Aggregate compensation reported in the next two figures specifically excludes investment-related compensation.
3. Of the 20 independent foundations with the highest ratios of compensation to giving, 10 report direct charitableactivities or other operating programs and 19 report staff.
4. This summary does not consider compensation of other categories of officers (such as vice presidents or chieffinancial officers) or of non-executive staff. Data come from Form 990-PF, Part VIII for private foundations and Form990, Part V for community foundations.
5. While compensation, benefits plans and deferred compensation, and expense accounts and other allowances arereported separately on Form 990-PF and Form 990, our working data file does not capture these distinctions.
6. Trustee and executive compensation may include investment-related compensation.7. These percentages apply only to the 10,000 largest U.S. foundations. Since compensation is more likely in larger
foundations, percentages would be much lower if all foundations were considered.8. These data reveal nothing about the individuals employed by institutional trustees who provide management
and investment services to foundations.9. Corporate foundations were also much less likely to pay institutional trustees, suggesting that these institutions
might be serving the foundation as part of other compensated activities rendered directly to the corporation.10. Research staff analyzed data and categorized individuals by position. This process is detailed more thoroughly
in the appendix.11. When a foundation listed more than one executive staff member (for example, both an executive director and
a president who functions as a staff member), we selected the one with the highest compensation. In some foundations,such employees as chief financial officers draw higher salaries than chief executive officers. For comparability purposes,however, only foundation executives were considered.
12. Many of these foundation executives are also members of the board of directors. They were included as staffin this analysis if their combination of salary, hours worked, benefits package, and relative position in the foundationsuggested that they function as executive staff in addition to their trustee duties.
13. Only one corporate foundation with assets of $200 million or more reported executive compensation, suggestingthat compensation of corporate foundation executives may be paid directly by the company.


VCONCLUSIONS
U.S. grantmaking foundations vary substantially in the ways they accomplish their work, and thosevariations have a measurable impact on their expense levels. Most of the 10,000 largest foundations
report modest expenses; the vast majority are unstaffed, and many are run largely by unpaid trustees.Larger foundations incur higher costs, although there appear to be economies of scale in that their expensesrelative to others with similar operating characteristics are generally a smaller proportion of their qualifyingdistributions. A handful of foundations have high ratios of expenses to qualifying distributions and somehave compensation levels that are well above the typical ranges for their cohort. Some of these casesare explainable by substantial operating programs, large staff size, or one-time payment of deferredcompensation to an executive upon retirement. Others cannot be explained with the data available. Theoverall picture is one of diversity—this is a heterogeneous group of institutions that can only be understoodby disaggregating the data along the dimensions of size, type, and staffing and program characteristics.
Independent, corporate, and community foundations, by definition, have different auspices, governance,and structural characteristics. This report documents how major differences in operating styles affect theexpense levels of private and community foundations. These findings suggest that, along with foundationtype and size, the missions and goals of foundations that lead to different staffing levels and types ofexpenses are important characteristics to consider when assessing the charitable expenditures of founda-tions.
For independent foundations, which represent the vast majority of the grantmakers documented in thisreport, employment of paid staff has a substantial impact on charitable operating costs, and expenselevels consistently increase along with number of staff. Giving level is also an important factor. Staffedfoundations with the lowest giving levels, for example, spend proportionally more on charitable operatingand administrative expenses. Grantmaking scope also affects charitable operating costs. Internationalgiving results in higher median operating costs for all sizes of staffed foundations. Finally, staffed founda-tions that engage in direct charitable activities beyond grantmaking, such as operating a facility orconducting research, those that maintain web sites (considered a possible indicator of a larger communica-tions effort), and those that make grants to individuals have higher median charitable expenses than thosethat do not. Similar to having paid staff, conducting international programs, engaging in direct charitableactivities, and maintaining web sites raise expense ratios more for the smaller than for the larger givers,suggesting economies of scale. By contrast, donor-family involvement in foundations and operating aspass-throughs (rather than as endowed entities) tend to lower charitable expenditure levels.
For corporate foundations included in this study, fewer operating characteristics show a clear relation-ship to expense. This finding in part underscores the difficulty in determining actual corporate foundationexpenses, given these foundations’ close ties to their parent companies. For example, less than a third ofthe corporate foundations in the study report paid staff, suggesting that staff is employed directly by thecompany. Staffing and other ‘‘free’’ administrative support are in turn reflected in comparatively lowcharitable expense-to-qualifying distribution levels for many corporate foundations. Nevertheless, having

38 � Foundation Expenses and Compensation
a larger staff size, conducting international programs, and engaging in direct charitable activities tend toincrease the expense levels of large and small corporate foundations. In fact, for a few corporate founda-tions, direct charitable activities represent the majority of their expenses, far exceeding grantmaking.
Community foundations differ from private foundations, both operationally and in terms of federalregulations and annual reporting requirements. Nevertheless, community foundations documented inthis study share a few patterns of expenses with private foundations: having a larger staff size, engagingin direct charitable activities, and maintaining web sites exert an upward pressure on charitable expenselevels. Cost levels of smaller foundations are more strongly affected by staff size than are those oflarger foundations. Unlike for private foundations, age is also an important factor. Young communityfoundations, regardless of size, have higher expense levels, suggesting the presence of high start-up costsassociated with establishing operations and raising funds, as well as limited grantmaking activity duringthis early period.
The report also considers compensation, the largest component of charitable expenses. Two-thirds of the10,000 largest foundations do not report any compensation. Among those that do, the median percentage ofcompensation to giving is higher for independent and community foundations (roughly 5 percent) andlower for corporate foundations (under 2 percent). The largest foundations tend to compensate at thehighest levels, yet their median percentages of compensation to giving are among the lowest. A handfulof foundations report compensation at 50 percent or more of giving. A review of those reporting thehighest percentages show that nearly all are staffed and more than half report direct charitable activitiesor other foundation-administered programs.
Trustee compensation practices also vary by foundation type. Over 80 percent of the more than 46,000individual trustees serving foundations in the study receive no compensation. Most of the 7,140 compen-sated individual trustees are found in independent foundations; in 2001, they collectively received $111.6million. Individual trustee compensation ranges from incidental reimbursements of expenses to paymentsof over $100,000, with a median of $7,750 in 2001. Institutional trustees, such as banks and law firms, receivemuch higher compensation, on average. Separating these two types of trustees and further distinguishingbetween compensated staff and non-staff trustees are important contributions of this study. Among paidstaff, executive compensation varies by foundation size: medians of $50,000 for the smallest and $200,000for the largest foundation chief executives, with a few executives receiving over $1 million in 2001.
This project provides a framework and a dataset that will be the basis for examining expense andcompensation patterns of private and community foundations over time.
While the study has already yielded insights on the impact of differences in foundation operating styleson charitable expenses, conducting this research has made us aware of many shortcomings in the dataand in the current reporting of foundation information to the Internal Revenue Service. Informationreported on Forms 990 is subject to the limitations of the financial reporting systems used by foundationsand to the rigor of those filling out the forms. While many forms are completed by accounting professionalswho sign their names attesting to the accuracy of the reports, many others are incomplete and inaccurate.
There is an ongoing need for education of foundations on the importance of Forms 990-PF and 990 asthe most visible summary of their finances—available to anyone with the click of a mouse. Providingassistance to foundations to properly complete these forms, as some regional associations have done, andpromoting better designed forms, as the Foundations Financial Officers Group is doing, is part of thesolution. Electronic filing of the IRS forms will be another important step forward.
Changes in Forms 990-PF and 990 should allow for more in-depth exploration of expenses and compensa-tion, especially related to reporting of different types of expenses, direct charitable activities, and trusteeand staff compensation. Investigators working on this project have already submitted recommendationsabout Forms 990-PF and 990 to the Panel on the Nonprofit Sector convened by Independent Sector. Fora summary of recommendations on changes to the forms that will improve transparency, see the inset.

Conclusions � 39
RECOMMENDATIONS FOR CHANGES TO FORMS 990 AND 990-PF
This study of Foundation Expenses and Compensation revealed areas of the Forms 990 that shouldbe improved to promote greater transparency. Electronic filing of the forms will permit better differenti-ation of expenses and more precise instructions at the point of completion, with very little, if any,associated costs.
RECOMMENDATIONS FOR FORM 990-PF
Identify and pull out major categories of expenses associated with ‘‘other expenses’’ and ‘‘other profes-sional fees’’ to recognize the growing reliance on those items as foundations increasingly turn toconsultants instead of paid staff and undertake direct charitable activities that are not easily capturedin current categories.
● ‘‘Other expenses’’ (Part I, line 23): This category has become a catchall that obscures a significantamount of operating expenditures. The Form 990-PF should list two to four frequently reportedcomponents of those expenses currently not itemized. For example, based on preliminary research,one component might capture equipment, supplies, and maintenance, and another might captureinsurance, bank fees, and dues, permitting ‘‘other expenses’’ to become a smaller residual category.
● ‘‘Other professional fees’’ (Part I, line 16c) should provide choices—for example, evaluation,administrative, technology, and communications services—so that the residual is a small, undiffer-entiated set of services.
● Direct charitable activities (Part IX-A): These activities, which include foundation-run programsand charitable-purpose facilities, are not clearly defined and are only partially listed on Form990-PF. The form should provide a section to describe and account for all direct charitable activitiesand a separate column should be provided for reporting expenses attributable to those activities.
RECOMMENDATIONS FOR FORM 990
● ‘‘Other Expenses’’ (Part II, line 43a–43e) on Form 990 should be revised as suggested above.● Form 990 should add a category for ‘‘other professional fees’’ broken down as suggested above.● Form 990 should be revised to better reflect the realities of community foundation activities in
two areas: direct charitable activities (foundation-run programs) and expenditures related tosupporting organizations and other affiliated funds.
Feedback from community foundations revealed that Form 990 exaggerates expenses (relative togiving) of community foundations that have affiliated trusts and supporting organizations. Thissituation requires further analysis and better instruments.
RECOMMENDATIONS FOR BOTH FORM 990-PF AND FORM 990
● Separate board/trustee and staff officers in the compensation of officers section of both forms(Part VIII of Form 990-PF and Part V of Form 990).
● Add a question to ascertain if officers are primarily paid employees (hours per week) or primarilyboard members (hours per week).
Transparency requires better reporting of salaries of foundation employees and compensation (if any)of trustees. Foundation executive staff members are often foundation board officers along with non-employee board members. The way the Forms 990 are currently configured, one cannot readily tellif a person is an employee or trustee or both. Adding a question that asks if an officer is a paidemployee would improve information. While there may still be ambiguity, it will be much easier toassess a person’s role and compensation level. More complete reporting of hours of work or servicewill also improve information on compensation patterns.


APPENDIX
A. METHODOLOGY
Study Datasets: This report is based on summary data from two datasets. The first is a foundation-leveldataset that includes the 10,000 largest independent, corporate, and community foundations (ranked bygiving) as reported for 2001 on Forms 990-PF and 990, which are filed annually with the Internal RevenueService, and supplemented by survey research conducted by the Foundation Center. The second datasetconsists of the 51,533 individual officers, directors, trustees, key employees, and institutional trusteesreported on Forms 990-PF and 990 for the same 10,000 foundations.
Data Providers and Sources: GuideStar supplied most of the Forms 990-PF and 990 expense and compensa-tion data for the study. The Foundation Center provided key financial data from foundation reports andfoundation operating and programmatic characteristics gleaned from its annual survey and analysis ofgrants lists. The National Center for Charitable Statistics at the Urban Institute filled in missing data fromits core dataset. Urban Institute staff merged the data by employee identification number to create thedatasets for the study.
Variables in the Analysis: In 2004, for the first phase of the project, the study partners identified variablesfor the analysis based on data that were already available in the GuideStar and Foundation Centerdatabases. In 2005, for the second phase, they identified additional key data fields, chiefly componentsof charitable administrative expenses and qualifying distributions, which needed to be digitized for thestudy. (See list of variables used in the study at the end of this section.) GuideStar digitized the newvariables for the majority of foundations, supplemented with work by the Foundation Center. The UrbanInstitute merged the new data into the datasets that had been compiled in the initial phase of the project.
Foundation-Level Dataset: The foundation-level dataset was used for the analyses presented in Section II,Components of Foundation Charitable Expenses, and Section III, Foundation Operating Characteristics andCharitable Expenses. As in any study of this type, researchers had to deal with missing cases and missingvariables as they checked the data and merged the IRS data with the survey data. For a small percentageof top 10,000 cases, 990-PF or 990 data were not available for 2001 from GuideStar, but data were availablefrom the Foundation Center or the National Center for Charitable Statistics. In other cases, GuideStar dataand Foundation Center survey data from immediately surrounding years were used to fill gaps in the set.In the latest study phase, an effort was made to improve the consistency of data, especially for the top1,000 foundations. Nearly all top 1,000 foundations now have complete 2001 records. Included in the top1,000 are five large jointly administered foundations (foundations that file more than one 990-PF but areadministered as one foundation) that had not been in the initial dataset. Compiled by the FoundationCenter from survey data and multiple tax returns, these composite foundation records replaced five smallerfoundations that had missing charitable expense data. Despite efforts made to fill gaps, some cases still

42 � Appendix
have missing values for key variables, and they were excluded from certain analyses. As a result, smallernumbers of foundations are reported in some charts and figures in the report than the total numbers ofindependent, corporate, and community foundations included in the study. Finally, after reviewing outliers,one foundation was identified as an operating foundation; it was excluded from all analyses.
Community Foundations Financial Data: Because community foundations are public charities and thereforefile IRS Form 990 instead of Form 990-PF, financial variables reported are not always equivalent to thosefor private foundations. To derive a charitable expense variable for community foundations, charitablegiving (that is, giving attributed to ‘‘program expenses,’’ listed on Part II, lines 22 and 23, column B) wassubtracted from total program expenses (line 44, column B). Similarly, the components of charitableexpenses are those categories listed under program expenses (Part II, lines 24–43, column B).
Foundation Operating Characteristics Data: The Foundation Center surveys roughly the top 20,000 grantmakingfoundations (ranked by giving) annually to update fiscal, operating, and programmatic data published inits online and print reference and research products. The response rate is approximately 30 percent forfoundations overall and over 66 percent for the top 1,000 foundations. For non-response foundations,information is compiled from foundation annual reports, grants lists, web sites, and Forms 990-PF or 990.Fiscal information (assets, gifts received, total giving, total expenses, qualifying distributions) obtained viasurvey is later compared and reconciled with data published in foundation annual reports and tax returns.
In the file of the top 10,000 foundations provided for this study, fiscal data fields are nearly complete.Grantmaker fields derived from an examination of the tax return and grants lists (e.g., grantmaker type,number of grants) are also fairly complete. Grantmaker fields that depend on survey responses or specialresearch (e.g., number of staff, geographic scope, establishment year) are not as complete. (See list ofvariables used in the study at the end of this section.)
Foundations that Compensate: To assess the influence of foundation compensation patterns on charitableoperating and administrative expenses, foundations that compensate some recipient and report aggregatecompensation as part of their qualifying distributions are separated from foundations that do not. Thisrecipient might be a staff and/or board member, and the compensation might take the form of a salary,remuneration for expenses, or a pension plan. A foundation was said to compensate when the sum oflines 13 (compensation of officers, directors, and trustees), 14 (other employee salaries and wages), and15 (pension plans and employee benefits), column d (disbursements for charitable purposes) was greaterthan zero; for community foundations, if the sum of lines 25–29 (same items) in column B (programservices) was greater than zero.
Foundations with Staff: To measure the effect of staffing on foundation charitable operating and administra-tive expenses, foundations with paid staff (as opposed to unpaid staff or paid trustees only) are separatedfrom foundations with no paid staff. To identify staffed foundations, a two-step process was used. First,if the Foundation Center survey (circa 2001) indicated that the foundation had one or more paid staffmembers, then the foundation was marked as staffed. In the absence of survey data, Form 990-PF wasexamined. If line 14, column a (other employee salaries and wages) was greater than zero, or if line 15(pension plans, and employee benefits) was greater than zero and line 13 (compensation of officers,directors, and trustees) was zero or blank, then the foundation was marked as staffed. Because not allfoundations responded to the Foundation Center’s survey and examining Forms 990 was not conclusivefor every foundation, some staffed foundations may not have been identified.
Staffed Foundations and Number of Staff: To assess the relative cost of having more or less staff, foundationsof the same type and size were grouped according to staff size. For staffed foundations that respondedto the Foundation Center survey, which represented the vast majority in the dataset, staff size was takendirectly from the survey. For foundations identified as staffed that did not report a staff number in thesurvey, an algorithm was developed for calculating staff size based on data reported by other staffedfoundations of the same type and of similar size.
Pass-Through Foundations: Some foundations retain few or no assets but instead award grants from yearlyor periodic gifts to the foundation. For example, many corporate foundations receive money directly fromthe parent company to award as grants. Similarly, a number of independent foundations—mainly youngerfoundations—receive regular gifts from living donors. For these foundations, the amount of qualifyingdistributions paid in the latest year may exceed year-end assets, because the foundation simply does not

Appendix � 43
retain assets. To assess the impact of maintaining or not maintaining assets on levels of charitable operatingand administrative expenses, foundations whose qualifying distributions exceeded 25 percent of the valueof their year-end assets were identified as ‘‘pass-through’’ foundations.
Individual Compensation Dataset: The second dataset consists of the 51,533 individual officers, directors,trustees, key employees, and institutional trustees reported on Forms 990-PF and 990 for the same 10,000foundations. The dataset was assembled by staff of the Urban Institute, based on data digitized byGuideStar. Assembling an individual-level dataset was challenging, due to current limitations of reporting.
Foundations report individual-level compensation of specified categories of individuals—officer, directors,foundation managers—in Part VIII (990-PF) and Part V (990). In addition to names and titles, foundationsare asked to list the average amount of time these people spend weekly with the organization, compensa-tion, and contributions to benefit plans and expense accounts. For this study, it was necessary to determinewhich of those compensated individuals listed in Part VIII and Part V were employees and which weretrustees. Based on our knowledge of foundations, we made as many reasonable assumptions as possibleto sort the individuals mechanically, and then inspected forms and coded the cases that were ambiguous.
The first assumption was that organizations that report no employee salaries/wages (line 14 on the 990PF and Part II, line 26 on the 990) or pension plans/employee benefits (line 15 on the 990-PF and Part II,lines 27–28 on the 990) or that did not report any paid staff in the Foundation Center survey, wereunstaffed. For these unstaffed organizations, compensated individuals listed in Part VIII (990-PF) andPart V (990) were coded as trustees.
For foundations with information that indicated paid staff, we assumed that individuals receiving lessthan $20,000 in compensation were not staff members; they were coded as trustees as well. In contrast,we assumed that individuals receiving over $100,000 in compensation were staff members, prior to furtherinspection detailed below.
Finally, we identified titles that tended strongly to be associated with trustees, and some that tended tobe associated strongly with staff members. After coding based on these assumptions and our classificationof titles, several hundred individuals were still undetermined. They worked for a staffed foundation,received more than $20,000 in compensation, and had titles that were ambiguous. To resolve these cases,we examined the actual forms.
At this stage 150 forms were reviewed, and 350 individuals were coded (or recoded) as either staff ortrustees after we considered information on titles relative to others, the number of hours worked (notreported in the data file, but clear on most forms), receipt of employee benefits relative to other individuals,the names of individuals in obvious family foundations, and occasional other subtle clues. The analysisof the actual forms led to recoding some previously coded cases. No single factor differentiated employeesfrom trustees, but thoughtful consideration of the combination of clues led to ‘‘staff’’ versus ‘‘trustee’’decisions. This exercise was complicated by the fact that foundations rarely list their trustees and keyemployees in Part VIII (990-PF) and Part V (990). Rather, they attach schedules that are difficult to locateamid dozens to hundreds (occasionally thousands) of pages of filings.
In this process we identified 1,340 corporate trustees (banks or other companies that manage the affairsof the foundation). These ‘‘institutional trustees’’ have their own category in the analyses.
By the end of the coding process we sorted 51,533 individuals listed in Part VIII of the 990-PF and PartV of the 990 as either staff, individual trustees, or institutional trustees. A coding process of this kinddoes contain a certain degree of error. Nevertheless, by applying our knowledge of foundation operationsand closely analyzing actual tax forms, we believe we have developed a sorting system that adequatelydefines the staffing dimensions of the foundations in the study.
This individual-level dataset is only used in Section III of the report. However, Section III presentsaggregate as well as individual-level compensation. When aggregate compensation is discussed (figures4.1 and 4.2), the summary statistics have been taken from the foundation-level dataset. In other words,aggregate compensation refers to Form 990-PF, Part I, the sum of lines 13–15, column d for privatefoundations and to Form 990, Part II, the sum of lines 25–29, column B for community foundations. Whenindividual compensation is addressed, compensation is the value provided in Part VIII of Form 990-PFand Part V of Form 990.

44 � Appendix
B. LIST OF VARIABLES
Key Financial Variables in the Foundation-Level Dataset
Aggregate Compensation: The total amount paid in salaries and wages, pension plans, and other employeebenefits reported as a part of a foundation’s charitable operating and administrative expenses. For privatefoundations, this figure is taken from Form 990-PF, Part I, sum of lines 13–15, column d. For communityfoundations, it comes from Form 990, Part II, sum of lines 25–29, column B.
Assets: Cash, stocks, bonds, real estate, or other holdings of a foundation. The fair market value of afoundation’s assets was used in this report as a proxy for size. Foundations were divided into six differentasset groups. For private foundations this comes from Form 990-PF, Introduction, line I. For communityfoundations it is taken from Form 990, Part IV, line 59, column B.
Charitable Operating and Administrative Expenses: Expenses related to carrying out a foundation’scharitable mission, including grant administrative expenses. For private foundations, this is taken fromForm 990-PF, Part I, line 24, column d. For community foundations, which do not report this line item,a proxy was developed using total program expenses minus giving. This comes from Form 990, Part II,line 44 minus the sum of lines 22 and 23, column B.
Qualifying Distributions: All disbursements that count toward the payout requirement for private founda-tions. The payout requirement is the minimum amount that a private foundation is required to expendfor charitable purposes. In general, a private foundation must pay out annually approximately 5 percentof the average market value of its assets. The forms of payout include grants, program-related investments,set-asides, charitable administrative expenses, and amounts paid to acquire assets used for charitablepurposes. Private foundations report qualifying distributions in Form 990-PF, Part XII, line 4. Communityfoundations are not subject to the 5 percent payout regulation and therefore do not report qualifyingdistributions. For comparative purposes, a proxy was developed using total program expenses. This comesfrom Form 990, Part II, line 44, column B.
Total Giving: The total amount paid out by foundations in the form of grants and contributions. In thisreport, this was another proxy for foundation size. For private foundations, this is taken from Form 990-PF, Part I, line 25, column d. For community foundations, it comes from Form 990, Part II, sum of lines22 and 23, column B.
Key Operating Characteristics Provided by the Foundation Center for the Foundation-Level Dataset
Establishment Year: The year that the foundation was created or for non-response foundations, the initialyear that it filed a tax return. In this study, foundations were grouped into four age groups: prior to 1950;1950 to 1969; 1979 to 1989; since 1990.
Formal Report Published: Identifies whether the foundation publishes an annual, biennial, or periodicreport on its activities, in addition to filing Form 990-PF or 990.
Foundation Type: Depending on the source of their funds, non-operating private foundations are identifiedas either independent or company-sponsored. Independent foundations shown to have substantial donor-family involvement (either self-reported or using objective criteria) are subcoded as family foundations.Community foundations, which are legally defined as public charities and usually file Form 990, areidentified through self-reporting and through listings shared with the Council on Foundations and othernational tracking groups.
Geographic Scope: Depending on the scope of their grantmaking, foundations are coded as local (eithergiving within their local community or within a few designated states), national, national/international,or international.
Grants to Individuals: Total giving amount paid directly to individuals.
Loans: Program-related investments/charitable loans amount reported by private and community founda-tions.
Number of Grants: Includes grants to organizations and individuals.

Appendix � 45
Number of Staff: Number of full-time, part-time, or unspecified paid staff.
Program Expenses: Expenditures for foundation-sponsored programs and other direct charitable activitiesreported by private and community foundations.
Web Site: Identifies that a foundation has its own URL or maintains a site hosted by the Foundation Center.
Key Variables in the Individual-Level Dataset
Compensation: The sum of compensation, contributions to employee benefit plans and deferred compensa-tion, and expense accounts and other allowances, as reported by private foundations in Part VIII of Form990-PF and community foundations in Part V of Form 990.
Executives: Presidents, chief executive officers, and executive directors who regularly spend a substantialamount of time operating the affairs of a foundation.
Individual Trustees: Members of a foundation governing board who spend a limited amount of timeprimarily providing governance for the organization.
Institutional Trustees: Institutions, such as banks, providing management and investment services tofoundations. Managerial roles may include managing assets, keeping books, providing legal representation,and filing regulatory documents.
Other Key Terms in the Report1
Community Foundations: Tax-exempt, nonprofit, autonomous, publicly supported philanthropic institu-tions composed primarily of permanent funds established by many separate donors for the long-termdiverse, charitable benefit of the residents of a defined geographic area. Typically, a community foundationserves an area no larger than a state. Community foundations provide an array of services to donorswho wish to establish endowed funds without incurring the administrative and legal costs of startingindependent foundations.
Corporate Foundations: Private charitable organizations that derive their funds primarily from the contri-butions of profitmaking parent businesses. Although closely tied to their company sponsors, they areseparate legal entities and subject to the same rules and regulations as other private foundations.
Direct Charitable Activities: Foundation-administered programs, including technical assistance to grant-ees, research, fellowship and scholarship programs, award programs, conferences, and others.
Endowments: Bequests or gifts intended to be kept permanently and invested to provide income forcontinued support of a foundation. Donors may require that the principal remain intact in perpetuity, or fora defined period of time or until sufficient assets have been accumulated to achieve a designated purpose.
Family Foundations: A subset of independent foundations within which legal responsibility for thedirection of the foundation rests to a large degree with family members.
Independent Foundations: Charitable organizations for which an individual or a family usually providesassets in the form of gifts or bequests that are held as an endowment. Because of the narrow base of theirsupport, they are subject to the private foundation laws, intended to assure they serve the public good.
Operating Foundations: Another type of private foundation. The source of their assets is usually anindividual or a small group of donors, and therefore, they are subject to most of the same rules andregulations as independent foundations. However, they accomplish their charitable purposes largely byrunning their own programs rather than through making grants. (Because of their different purposes andexpense patterns, operating foundations are not examined in this study.)
Pass-Through Foundations: Foundations that receive monies and make distributions to donees, with littleor no principal remaining with the foundation.

46 � Appendix
Private Foundations: Nongovernmental, nonprofit organizations with funds (usually from a single source,such as an individual, family, or corporation) and programs that are managed by their own trustees ordirectors and established to maintain or aid, primarily through grantmaking, social, educational, religious,or other charitable activities serving the common welfare.
N O T E
1. The definitions in this section were provided in Council on Foundations, 2003, Glossary of Philanthropic Terms.

Appendix � 47
C. BENCHMARKING TABLES
The following benchmarking tables provide comparative information for independent, corporate, andcommunity foundations on the ratio of charitable operating and administrative expenses to qualifyingdistributions, the components of expenses, and the compensation levels of foundation trustees and chiefexecutives, in finer detail than reported in the study graphs. These tables permit users to find mean andmedian amounts for the principal expense components and means, medians, and ranges of expendituresand compensation for various sizes and types of foundations. These tables should be used with cautionas they do not cover all the factors that might influence expenditures, nor do they account fully for theinteraction of multiple factors. They also report existing practices, not necessarily best practices. The tablesshould be consulted as one component of an overall analysis that those involved in governing, managing,or overseeing foundations might undertake.
Table A.1. Charitable Operating and Administrative Expenses as a Percentage of Qualifying Distributions forIndependent Foundations
Staffed foundations a Unstaffed foundations All independent foundations b
Mean Median Range Mean Median Range Mean Median RangeNo. % % % No. % % % No.c % % %
Giving leveld
� $500 K 703 12.4 8.3 0.0–95.2 3,860 2.7 0.4 0.0–65.9 4,563 4.2 0.7 0.0–95.2$500 K–$1 M 506 10.8 7.8 0.0–83.9 1,393 2.4 0.4 0.0–51.7 1,899 4.6 1.0 0.0–83.9$1 M–$5 M 756 9.0 6.4 0.0–78.7 999 2.0 0.3 0.0–34.0 1,755 5.0 1.8 0.0–78.7$5 M–$10 M 170 8.3 6.2 0.0–45.9 65 1.6 0.1 0.0–13.8 235 6.5 3.6 0.0–45.9$10 M–$50 M 151 8.3 6.8 0.0–33.8 41 1.0 0.1 0.0– 7.2 192 6.7 4.4 0.0–33.8� $50 M 41 8.2 5.9 0.7–24.1 2 0.1 — — 43 7.9 5.8 0.0–24.1
Asset levele
� $1 M 100 11.1 2.9 0.0–78.7 1,049 1.1 0.0 0.0–65.9 1,149 2.0 0.0 0.0–78.7$1 M–$10 M 746 9.6 5.7 0.0–81.5 3,760 2.5 0.5 0.0–56.0 4,506 3.7 0.7 0.0–81.5$10 M–$50 M 906 11.0 7.7 0.0–95.2 1,403 3.3 1.0 0.0–63.6 2,309 6.3 2.8 0.0–95.2$50 M–$200 M 413 10.0 7.1 0.0–83.9 138 3.2 0.9 0.0–36.4 551 8.3 5.6 0.0–83.9$200 M–$500 M 87 10.7 8.1 0.0–61.8 9 2.0 1.4 0.0– 5.6 96 10.0 7.6 0.0–61.8� $500 M 75 9.3 8.3 0.5–41.6 1 0.8 — — 76 9.2 7.9 0.5–41.6
Source: 2001 Foundation Expense Dataset.a In this study, staffing is determined by combining information from Form 990-PF for private foundations and Form 990 for community foundationswith an annual survey of foundations conducted by the Foundation Center. Organizations that report employee salaries, wages, or pension plans/employee benefits on their IRS forms or report paid staff on the Foundation Center survey were coded as staffed foundations. Those that did notreport employee salaries/wages or pension plans/employee benefits and did not report any employees to the Foundation Center in the surveyare unstaffed.b Includes 2,413 independent foundations that did not report any charitable expenses.c In this table and the following two tables, the reported number of all foundations does not represent all foundations in the study. The numbers varybecause individual cases are missing data on a variable of interest.d These categories represent total grants paid. For private foundations, it comes from Form 990-PF, Part I, line 25, column d. For community foundations,Form 990, Part II, lines 22–23, column B.e These categories represent the fair market value of a foundation’s assets. For private foundations, data are from Form 990-PF, Introduction, line I.For community foundations, data are from Form 990, Part IV, line 59, column B.

48 � Appendix
Table A.2. Charitable Operating and Administrative Expenses as a Percentage of Qualifying Distributions for CorporateFoundations
Staffed foundations Unstaffed foundations All corporate foundations a
Mean Median Range Mean Median Range Mean Median RangeNo. % % % No. % % % No. % % %
Giving level� $500 K 53 8.1 1.5 0.0–46.2 236 1.5 0.0 0.0–63.7 289 2.7 0.1 0.0–63.7$500 K–$1 M 33 8.6 0.4 0.0–83.4 112 1.6 0.1 0.0–22.9 145 3.1 0.1 0.0–83.4$1 M–$5 M 97 3.5 0.3 0.0–27.6 120 0.9 0.0 0.0–50.9 217 2.1 0.0 0.0–50.9$5 M–$10 M 35 4.2 1.4 0.0–30.1 24 6.6 0.2 0.0–77.8 59 5.2 0.9 0.0–77.8$10 M–$50 M 36 5.5 1.0 0.0–61.6 19 1.1 0.1 0.0– 6.7 55 4.0 0.9 0.0–61.6� $50 M 6 1.1 0.3 0.0– 3.1 1 3.0 — — 7 1.3 0.3 0.0– 3.1
Asset level� $1 M 47 3.9 0.1 0.0–56.4 172 1.9 0.0 0.0–63.7 219 2.3 0.0 0.0–63.7$1 M–$10 M 90 6.1 0.5 0.0–83.4 230 1.1 0.0 0.0–21.6 320 2.5 0.1 0.0–83.4$10 M–$50 M 82 4.9 1.4 0.0–46.2 91 2.0 0.0 0.0–77.8 173 3.4 0.3 0.0–77.8$50 M–$200 M 35 5.6 2.7 0.0–51.5 17 1.4 0.1 0.0– 8.6 52 4.2 1.6 0.0–51.5$200 M–$500 M 5 14.5 2.3 0.9–61.6 2 4.5 — — 7 11.6 2.3 0.0–61.6� $500 M 1 0.0 — — — — — — 1 0.0 — —
Source: 2001 Foundation Expense Dataset.
Note: See footnotes for table A.1 on independent foundations for definitions of key terms.aIncludes 300 corporate foundations that did not report any charitable expenses.
Table A.3. Charitable Operating and Administrative Expenses as a Percentage of Qualifying Distributions for CommunityFoundations
Staffed foundations Unstaffed foundations All community foundationsa
Mean Median Range Mean Median Range Mean Median RangeNo. % % % No. % % % No. % % %
Giving level� $500 K 69 14.3 6.6 0.0–96.7 5 2.4 0.0 0.0–10.3 74 13.5 4.8 0.0–96.7$500 K–$1 M 56 11.4 4.0 0.0–71.6 6 0.0 0.0 0.0– 0.0 62 10.3 3.4 0.0–71.6$1 M–$5 M 107 10.2 6.2 0.0–59.6 2 3.6 — — 109 10.1 6.2 0.0–59.6$5 M–$10 M 28 8.6 8.2 0.0–24.3 — — — — 28 8.6 8.2 0.0–24.3$10 M–$50 M 35 7.5 7.2 0.3–20.7 — — — — 35 7.5 7.2 0.3–20.7� $50 M 8 6.1 4.8 0.0–21.0 — — — — 8 6.1 4.8 0.0–21.0
Asset level� $1 M 3 9.0 4.3 1.6–21.1 1 0.0 — — 4 6.7 2.9 0.0–21.1$1 M–$10 M 85 10.5 4.0 0.0–71.6 6 2.0 0.0 0.0–10.3 91 9.9 3.2 0.0–71.6$10 M–$50 M 129 12.3 6.6 0.0–96.7 6 1.2 0.0 0.0– 7.3 135 11.8 5.4 0.0–96.7$50 M–$200 M 56 9.4 7.8 0.0–65.1 — — — — 56 9.4 7.8 0.0–65.1$200 M–$500 M 18 7.5 5.9 0.0–21.7 — — — — 18 7.5 5.9 0.0–21.7� $500 M 12 8.5 8.2 0.0–21.0 — — — — 12 8.5 8.2 0.0–21.0
Source: 2001 Foundation Expense Dataset.
Note: See footnotes for table A.1 on independent foundations for definitions of key terms.aIncludes 80 community foundations that did not report any charitable expenses.

Appendix � 49
Table A.4. Charitable Operating and Administrative Expenses as a Percentage of Qualifying Distributions for StaffedFoundations by Staffing Levels and Foundation Type (median percent and number of respondents)
Giving group
$500 K– $5 M– $10 M–� $500 K $1 M $1 M–$5 M $10 M $50 M � $50 M Overall
Med Med Med Med Med Med Med% (n) % (n) % (n) % (n) % (n) % (n) % (n)
Independent No. offoundations staff a
1 5.4 (360) 4.6 (194) 3.6 (188) 1.9 (17) 1.4 (8) — — 4.3 (767)2–3 11.4 (266) 9.6 (172) 6.6 (260) 3.3 (47) 3.1 (20) 1.3 (1) 7.8 (766)4–14 20.3 (27) 14.6 (98) 11.2 (192) 9.1 (78) 5.8 (74) 1.4 (11) 9.7 (480)
15–49 84.8 (1) 3.0 (1) 46.3 (8) 22.3 (8) 12.9 (39) 5.7 (15) 12.9 (72)� 49 — — — — — — 41.6 (1) 17.6 (2) 12.7 (14) 12.9 (17)All 8.4 (654) 8.0 (465) 6.5 (648) 6.3 (151) 7.0 (143) 5.9 (41) 7.1 (2,102)
Corporate No. offoundations staff
1 0.2 (19) 0.4 (11) 0.0 (18) 0.2 (7) 6.1 (1) — — 0.1 (56)2–3 8.4 (28) 0.0 (13) 0.2 (52) 0.6 (14) 0.0 (8) — — 0.8 (115)4–5 0.1 (1) 20.2 (4) 4.3 (20) 4.9 (7) 3.2 (7) 0.2 (2) 3.2 (41)6–8 — — 0.4 (2) 6.2 (3) 12.0 (3) 1.0 (10) — — 1.0 (18)� 8 4.5 (1) — — 27.6 (1) 9.6 (3) 1.8 (10) 1.5 (4) 3.1 (19)All 0.4 (49) 0.4 (30) 0.2 (94) 1.3 (34) 1.0 (36) 0.3 (6) 0.6 (249)
Community No. offoundations staff
1 3.1 (13) 14.3 (1) 8.0 (3) — — — — — — 3.1 (17)2–3 6.1 (36) 5.6 (32) 0.0 (21) 4.8 (1) — — — — 3.7 (90)4–5 7.4 (11) 4.0 (17) 8.0 (33) 3.2 (4) 2.8 (2) — — 4.5 (67)6–8 — — 34.5 (5) 10.2 (29) 7.7 (6) 0.7 (1) — — 9.4 (41)� 8 84.5 (1) — — 16.3 (20) 8.7 (15) 7.7 (31) 4.8 (8) 8.2 (75)All 5.6 (61) 4.1 (55) 6.5 (106) 7.7 (26) 7.0 (34) 4.8 (8) 6.4 (290)
Source: 2001 Foundation Expense Dataset.aIf a foundation is classified as staffed, number of staff equals the sum of full-time, part-time, and unspecified staff reported to the Foundation Center.In some instances, a foundation was classified as staffed because it reported employee compensation on Form 990-PF or Form 990, but it did notreport number of staff to the Foundation Center. In these cases, a number estimator was devised to approximate the number of staff.

50 � Appendix
Table A.5. Selected Components of Charitable Operating and Administrative Expenses for Independent Foundations(thousands of dollars)
Asset group
� $1 M $1 M–$10 M $10 M–$50 M $50 M–$200 M $200 M–$500 M � $500 M Overall
Total Average $ 75.9 32.8 84.8 304.9 950.0 5,018.8 233.3compensationa Median $ 21.0 14.4 44.2 210.4 784.8 2,141.4 33.7
# Reporting 93 1,266 1,148 403 85 73 3,068% Reportingb 7.8 27.4 48.9 72.5 88.5 96.1 34.6
Legal fees Average $ 5.3 9.6 15.0 23.9 55.1 137.4 19.0Median $ 1.9 2.4 4.0 7.6 19.8 43.6 3.6# Reporting 158 781 721 314 79 68 2,121% Reporting 13.3 16.9 30.7 56.5 82.3 89.5 23.9
Accounting Average $ 3.3 3.7 7.2 18.2 27.1 64.7 7.6fees Median $ 1.5 2.0 4.3 11.1 19.0 32.7 2.9
# Reporting 330 1,911 1,216 388 78 65 3,988% Reporting 27.8 41.4 51.8 69.8 81.3 85.5 44.9
Other Average $ 27.8 16.8 35.7 103.8 244.3 2,427.8 138.0professional Median $ 4.6 6.2 13.1 30.0 106.3 348.6 11.4expenses # Reporting 100 601 555 237 64 62 1,616
% Reporting 8.4 13.0 23.7 42.6 66.7 81.6 18.2
Interest Average $ 2.2 10.8 68.6 149.7 975.0 190.1 92.1Median $ 0.3 1.9 2.0 16.0 792.4 42.8 2.9# Reporting 10 50 38 25 4 9 136% Reporting 0.8 1.1 1.6 4.5 4.2 11.8 1.5
Taxes Average $ 2.9 4.0 9.4 20.6 56.2 99.0 11.6Median $ 0.3 1.1 4.0 10.9 29.0 49.8 3.0# Reporting 156 642 575 238 49 36 1,696% Reporting 13.2 13.9 24.5 42.8 51.0 47.4 19.1
Occupancy Average $ 28.3 13.1 23.0 58.7 16.8 870.8 84.0Median $ 12.8 6.9 11.3 32.8 88.0 325.8 15.1# Reporting 30 260 454 270 69 62 1,145% Reporting 2.5 5.6 19.4 48.6 71.9 81.6 12.9
Travel and Average $ 19.7 9.1 16.5 29.8 110.7 817.4 53.8conferences Median $ 5.7 2.1 5.0 12.6 56.2 262.6 5.5
# Reporting 71 503 641 319 79 68 1,681% Reporting 6.0 10.9 27.3 57.4 82.3 89.5 18.9
Printing and Average $ 4.7 4.5 5.3 14.6 56.6 333.3 27.1publications Median $ 0.1 135.0 0.7 4.4 16.2 126.7 796.0
# Reporting 71 341 322 176 56 55 1,021% Reporting 6.0 7.4 13.7 31.7 58.3 72.4 11.5
Other Average $ 13.2 9.0 27.7 103.6 449.4 1,760.8 58.9expenses Median $ 0.2 0.5 4.1 37.4 155.9 455.6 1.6
# Reporting 460 2,258 1,525 457 89 74 4,863% Reporting 38.8 48.9 65.0 82.2 92.7 97.4 54.8
Source: 2001 Foundation Expense Dataset.
Note: Selected expenses in this table are arranged in the order they are reported in Form 990-PF, Part I, lines 13–23, column d. Some expense categoriesin the Form 990-PF are not shown in the table above. This is because too few foundations reported such expenses to merit their inclusion.aTotal compensation, Form 990-PF, Part I, sum of lines 13–15, column d.bPercent reporting represents the percent of foundations reporting the given type of expense out of all foundations within the size group.

Appendix � 51
Table A.6. Selected Components of Charitable Operating and Administrative Expenses for Corporate Foundations(thousands of dollars)
Asset group
� $1 M $1 M–$10 M $10 M–$50 M $50 M–$200 M $200 M–$500 M Overall
Total Average $ 37.6 77.0 120.6 378.4 5,180.0 192.6compensationa Median $ 4.1 14.7 53.4 252.6 5,180.0 28.3
# Reporting 20 57 35 12 2 126% Reportingb 8.4 17.2 19.8 23.1 25.0 15.6
Legal fees Average $ 2.0 11.0 22.7 9.7 67.1 16.6Median $ 0.3 2.9 3.3 1.7 7.2 3.1# Reporting 9 26 16 11 5 67% Reporting 3.8 7.8 9.0 21.2 62.5 8.3
Accounting Average $ 2.9 4.2 12.9 13.8 47.4 8.9fees Median $ 1.3 2.2 5.9 10.1 30.8 3.1
# Reporting 35 67 49 20 6 177% Reporting 14.8 20.2 27.7 38.5 75.0 21.9
Other Average $ 268.4 71.2 111.1 397.8 1,422.0 239.1professional Median $ 1.9 9.5 41.2 65.0 599.5 27.8expenses # Reporting 20 25 44 21 5 115
% Reporting 8.4 7.5 24.9 40.4 62.5 14.3
Taxes Average $ 2.0 6.8 14.0 62.5 — 11.5Median $ 0.2 1.9 5.5 25.3 — 0.9# Reporting 30 36 20 8 — 94% Reporting 12.7 10.8 11.3 15.4 — 11.6
Occupancy Average $ 14.9 5.7 57.4 17.2 325.0 65.5Median $ 14.9 5.7 18.4 13.2 325.0 15.8# Reporting 2 2 7 5 2 18% Reporting 0.8 0.6 3.9 9.6 25.0 2.2
Travel and Average $ 38.3 34.6 11.5 41.9 309.9 44.1conferences Median $ 4.6 7.8 5.7 10.2 106.3 7.5
# Reporting 13 25 22 14 4 78% Reporting 5.5 7.5 12.4 26.9 50.0 9.7
Printing and Average $ 37.8 4.0 143.6 16.7 802.9 77.0publications Median $ 0.4 1.0 12.8 6.1 24.7 2.3
# Reporting 20 29 28 19 3 99% Reporting 8.4 8.7 15.8 36.5 37.5 12.3
Other Average $ 31.2 51.3 298.7 1,452.2 10,028.0 358.9expenses Median $ 0.6 2.8 11.2 67.6 345.7 2.9
# Reporting 108 139 86 32 5 370% Reporting 45.6 41.9 48.6 61.5 62.5 45.8
Source: 2001 Foundation Expense Dataset.
Note: Selected expenses in this table are arranged in the order they are reported in Form 990-PF, Part I, lines 13–23, column d. Some expense categoriesin the Form 990-PF are not shown in the table above because too few foundations reported such expenses to merit their inclusion.aTotal compensation, Form 990-PF, Part I, sum of lines 13–15, column d.bPercent reporting represents the percent of foundations reporting the given type of expense out of all foundations within the size group.

52 � Appendix
Table A.7. Selected Components of Charitable Operating and Administrative Expenses for Community Foundations(thousands of dollars)
Asset group
� $1 M $1 M–$10 M $10 M–$50 M $50 M–$200 M $200 M–$500 M � $500 M Overall
Total Average $ 27.6 51.1 135.5 313.4 708.5 1,908.4 310.4compensationa Median $ 27.6 36.9 78.1 274.3 487.7 1,460.3 128.1
# Reporting 1 38 82 45 17 11 194% Reportingb 25.0 41.8 60.3 80.4 94.4 91.7 61.2
Accounting Average $ 2.2 5.2 11.1 8.6 9.8 14.4 9.4fees Median $ 2.2 4.5 6.0 6.4 7.0 16.7 5.5
# Reporting 1 15 30 12 8 5 71% Reporting 25.0 16.5 22.1 21.4 44.4 41.7 22.4
Legal fees Average $ — 1.2 4.3 11.9 21.4 24.5 10.3Median $ — 0.6 0.9 10.4 14.8 15.9 2.4# Reporting — 10 28 15 11 8 72% Reporting — 11.0 20.6 26.8 61.1 66.7 22.7
Occupancy Average $ 8.9 6.6 14.8 46.2 96.9 254.7 47.4Median $ 8.9 3.3 7.8 24.6 62.5 278.3 12.1# Reporting 2 24 53 31 11 11 132% Reporting 50.0 26.4 39.0 55.4 61.1 91.7 41.6
Printing and Average $ 7.7 4.6 15.9 20.7 36.9 74.5 21.0publications Median $ 7.7 3.5 5.9 10.3 39.1 62.7 8.2
# Reporting 2 28 52 31 14 10 137% Reporting 50.0 30.8 38.2 55.4 77.8 83.3 43.2
Travel and Average $ 7.1 5.1 16.0 22.3 55.2 117.6 26.3conferences Median $ 7.1 2.0 3.7 15.5 57.8 90.5 6.0
# Reporting 2 31 64 37 15 11 160% Reporting 50.0 34.1 47.1 66.1 83.3 91.7 50.5
Interest Average $ — 0.3 57.2 6.1 25.2 653.0 105.3Median $ — 0.3 2.9 1.6 25.5 653.0 2.8# Reporting — 1 9 4 2 2 18% Reporting — 1.1 6.6 7.1 11.1 16.7 5.7
Depreciation Average $ 0.4 6.1 12.8 37.7 39.5 354.5 48.3Median $ 0.4 1.8 7.1 15.0 38.4 91.8 8.5# Reporting 1 22 42 22 6 9 102% Reporting 25.0 24.2 30.9 39.3 33.3 75.0 32.2
Other Average $ 227.6 84.4 277.6 451.1 944.5 1,422.4 380.5expenses Median $ 40.2 31.7 82.6 256.8 596.7 922.1 97.7
# Reporting 3 49 92 47 16 11 218% Reporting 75.0 53.8 67.6 83.9 88.9 91.7 68.8
Source: 2001 Foundation Expense Dataset.
Note: Selected expenses in this table are arranged in the order they are reported in Form 990, Part II, lines 25–43, column B. Some expense categoriesin the Form 990 are not shown in the table above because too few foundations reported such expenses to merit their inclusion.aTotal compensation, Form 990, Part II, sum of lines 25–29, column B.bPercent reporting represents the percent of foundations reporting the given type of expense out of all foundations within the size group.

Appendix � 53
Table A.8. Individual-Level Compensation for Trustees and Executives of Independent Foundations that Compensate
Asset group
� $1 M $1 M–$10 M $10 M–$50 M $50 M–$200 M $200 M–$500 M � $500 M Overall
Individual Average $ 8,007 10,921 15,510 20,544 22,242 31,020 15,864trusteesa Median $ 4,383 5,000 7,000 11,000 15,500 23,500 8,000
25th percentile 1,200 1,512 2,000 4,000 6,000 11,775 2,37075th percentile 10,000 13,946 20,000 25,608 32,000 35,000 20,42990th percentile 24,000 29,062 42,250 50,000 50,076 56,925 42,000# of trustees 178 2,392 2,554 1,010 301 492 6,927
Institutional Average $ 11,505 32,582 86,478 268,860 533,652 960,813 68,208trusteesb Median $ 5,799 31,200 74,902 226,500 434,401 967,510 39,634
25th percentile 2,351 17,600 43,683 120,990 202,119 489,113 22,80375th percentile 9,291 43,554 113,208 331,447 765,267 1,432,514 69,89290th percentile 22,787 56,378 161,784 670,274 1,416,206 1,468,999 132,527# of trustees 29 696 389 60 8 4 1,186
Executivesc Average $ 71,832 61,021 100,218 157,570 259,936 384,968 147,364Median $ 45,113 51,511 94,047 150,894 218,492 323,620 113,85925th percentile 30,394 27,500 61,000 105,160 170,701 225,500 67,05775th percentile 106,500 77,000 130,500 193,750 288,801 520,100 181,00490th percentile 148,051 101,000 167,164 240,603 339,409 643,868 269,568# of executives 17 114 261 214 60 61 727
Source: 2001 Foundation Compensation Dataset.
Note: Compensation includes any combination of remuneration, fringe benefits (current or deferred), and expense accounts, as reported in Form 990-PF, Part VIII. While compensation, benefit plans and deferred compensation, and expense accounts and other allowances are reported separately onForm 990-PF, the working datafile used here does not capture these distinctions. Additionally, trustee and executive compensation may includeinvestment-related compensation.aThese are members of the foundation’s governing board who spend a limited amount of time primarily providing governance for the foundation.Identifying individual trustees involved consideration of titles, hours worked, salaries, benefits packages, and relative position in the foundation.bInstitutional trustees include banks, law firms, investment firms, or other institutions that play managerial roles within foundations.cFoundation executives are defined as presidents, chief executive officers, and executive directors who regularly spend a substantial amount of timeoperating the affairs of the foundation. Determining executives followed a similar process to that described in the footnote on individual trustees. Forthose foundations that listed more than one executive staff member, the one with the highest salary was selected for the analysis.

54 � Appendix
Table A.9. Individual-Level Compensation for Executives and Trustees of Corporate Foundations that Compensate
Asset group
� $1 M $1 M–$10 M $10 M–$50 M $50 M–$200 M $200 M–$500 M Overall
Individual Average $ 5,306 6,584 11,402 7,152 6,329 7,497trustees Median $ 2,000 2,000 4,000 3,000 1,000 2,400
25th percentile 600 1,000 1,900 500 1,000 1,00075th percentile 3,000 7,772 10,000 4,000 15,000 8,00090th percentile 11,059 15,000 24,000 15,754 15,000 15,754# of trustees 35 62 41 17 18 173
Institutional Average $ 11,256 29,414 40,745 239,181 32,232 36,669trustees Median $ 7,177 16,778 43,145 — — 17,319
25th percentile 912 6,502 5,250 — — 6,00475th percentile 11,622 37,024 54,147 — — 43,99490th percentile 36,139 45,120 61,117 — — 61,117# of trustees 10 28 15 2 2 57
Executivesa Average $ 62,879 80,050 84,265 152,422 $517,728 103,826Median $ — 57,749 86,644 154,244 — 81,73225th percentile — 25,008 45,000 130,900 — 42,00075th percentile — 137,098 108,129 168,233 — 145,52390th percentile — 209,293 145,164 186,147 — 186,147# of executives 2 18 10 6 1 37
Source: 2001 Foundation Compensation Dataset.
Note: See footnotes for similar table on independent foundations for definitions of compensation, trustees, and executives.aRelatively few corporate foundations report compensation of executives, suggesting that they are executives of the company.
Table A.10. Individual-Level Compensation for Trustees and Executives of Community Foundations that Compensate
Asset group
� $1 M $1 M–$10 M $10 M–$50 M $50 M–$200 M $200 M–$500 M � $500 M Overall
Individual Average $ — 10,108 11,308 4,299 — — 8,348trusteesa Median $ — 1,800 11,500 5,000 — — 5,250
25th percentile — 125 3,000 3,886 — — 3,00075th percentile — 28,400 12,574 5,500 — — 12,00090th percentile — 28,400 23,100 5,500 — — 20,987# of trustees — 3 16 13 — — 32
Institutional Average $ — — 25,635 — — — 25,635trustees Median $ — — 14,634 — — — 14,634
25th percentile — — 1,235 — — — 1,23575th percentile — — 21,211 — — — 21,21190th percentile — — 89,933 — — — 89,933# of trustees — — 5 — — — 5
Executives Average $ 62,890 44,927 74,176 114,440 194,851 360,292 93,592Median $ — 41,909 73,945 111,473 203,113 275,840 75,00025th percentile — 31,600 57,700 90,720 182,821 239,875 47,87775th percentile — 55,120 87,826 135,375 228,058 342,462 107,58090th percentile — 72,354 102,151 164,658 240,540 937,852 182,821# of executives 2 58 107 50 15 9 241
Source: 2001 Foundation Compensation Dataset.
Note: Compensation includes any combination of remuneration, fringe benefits (current or deferred), and expense accounts, as reported in Form 990,Part V. While compensation, benefit plans and deferred compensation, and expense accounts and other allowances are reported separately on Form990, the working datafile used here does not capture these distinctions. Additionally, trustee and executive compensation may include investment-related compensation.aSee footnotes for table A.8 on independent foundations for definitions of trustees and executives.

The UrbanInstitute
Foundation Expenses & CompensationHow Operating Characteristics Influence Spending
AuthorsElizabeth T. Boris, Principal Investigator, Center on Nonprofits and Philanthropy, The Urban InstituteLoren Renz, Principal Investigator, The Foundation CenterAsmita Barve, The Foundation CenterMark A. Hager, The Urban Institute
George Hobor, The Urban Institute
ContributorsAmy Brimer, The Urban InstituteCharles E. McLean, GuideStar
o
R
Copyright © 2006. The Urban Institute, the Foundation Center, and Philanthropic Research, Inc.