
The Impact of Different Touchpoints on Brand Consideration · Journal of Retailing 91 (2, 2015)...
19
Journal of Retailing 91 (2, 2015) 235–253 The Impact of Different Touchpoints on Brand Consideration Shane Baxendale a , Emma K. Macdonald a,b,∗ , Hugh N. Wilson a a Cranfield School of Management, Cranfield University, United Kingdom b School of Marketing, University of South Australia, Australia Abstract Marketers face the challenge of resource allocation across a range of touchpoints. Hence understanding their relative impact is important, but previous research tends to examine brand advertising, retailer touchpoints, word-of-mouth, and traditional earned touchpoints separately. This article presents an approach to understanding the relative impact of multiple touchpoints. It exemplifies this approach with six touchpoint types: brand advertising, retailer advertising, in-store communications, word-of-mouth, peer observation (seeing other customers), and traditional earned media such as editorial. Using the real-time experience tracking (RET) method by which respondents report on touchpoints by contemporaneous text message, the impact of touchpoints on change in brand consideration is studied in four consumer categories: electrical goods, technology products, mobile handsets, and soft drinks. Both touchpoint frequency and touchpoint positivity, the valence of the customer’s affective response to the touchpoint, are modeled. While relative touchpoint effects vary somewhat by category, a pooled model suggests the positivity of in-store communication is in general more influential than that of other touchpoints including brand advertising. An almost entirely neglected touchpoint, peer observation, is consistently significant. Overall, findings evidence the relative impact of retailers, social effects and third party endorsement in addition to brand advertising. Touchpoint positivity adds explanatory power to the prediction of change in consideration as compared with touchpoint frequency alone. This suggests the importance of methods that track touchpoint perceptual response as well as frequency, to complement current analytic approaches such as media mix modeling based on media spend or exposure alone. © 2015 New York University. Published by Elsevier Inc. All rights reserved. Keywords: Retailing; Advertising; Integrated marketing communications; In-store communications; Word-of-mouth (WOM) Introduction There is a stream of research comparing the impact of vari- ous paid-for media, which is helpful to marketers in determining their overall media spend and its allocation across media (Naik and Peters 2009). Brand owners have a bigger challenge, how- ever: how to allocate budgets and management time across the wider range of touchpoints that occur in the customer deci- sion journey (Court et al. 2009). These broader touchpoints go beyond the brand advertising which is generally referred to as ∗ Corresponding author at: Cranfield School of Management, Cranfield Uni- versity, Cranfield, Bedofrdshire MK43-0AL, United Kingdom. Tel.: +44 07788 543 905. E-mail addresses: S.Baxendale@Cranfield.ac.uk (S. Baxendale), Emma.Macdonald@Cranfield.ac.uk (E.K. Macdonald), Hugh.Wilson@Cranfield.ac.uk (H.N. Wilson). paid media (or owned media where the firm does not have to pay directly), to include for example traditional earned media such as editorial coverage. Peer-to-peer encounters with the brand such as word-of-mouth (WOM) conversation can also be regarded as earned touchpoints (Stephen and Galak 2012). In the case of consumer goods sold through retailers, the focus of this article, the retailer may also pay for advertising that mentions the brand. Furthermore, the store itself is far more than a fulfillment channel to convert pre-existing intentions to purchases. In-store commu- nications can also bring new brands into active consideration (Court et al. 2009; Goodman et al. 2013) and influence imme- diate or subsequent purchase irrespective of channel (Verhoef, Neslin, and Vroomen 2007). Of these touchpoints, the brand owner only directly controls brand advertising, but all are poten- tially within the brand owner’s influence. The resulting resource allocation challenge in turn leads to a measurement challenge: assessing the relative importance of these diverse touchpoints in evolving the customer’s brand attitudes and hence behaviors. http://dx.doi.org/10.1016/j.jretai.2014.12.008 0022-4359/© 2015 New York University. Published by Elsevier Inc. All rights reserved.
Transcript of The Impact of Different Touchpoints on Brand Consideration · Journal of Retailing 91 (2, 2015)...
A
pabmtptcpafa©
K
otaewsb
vT
(H
h0
Journal of Retailing 91 (2, 2015) 235–253
The Impact of Different Touchpoints on Brand Consideration
Shane Baxendale a, Emma K. Macdonald a,b,∗, Hugh N. Wilson a
a Cranfield School of Management, Cranfield University, United Kingdomb School of Marketing, University of South Australia, Australia
bstract
Marketers face the challenge of resource allocation across a range of touchpoints. Hence understanding their relative impact is important, butrevious research tends to examine brand advertising, retailer touchpoints, word-of-mouth, and traditional earned touchpoints separately. Thisrticle presents an approach to understanding the relative impact of multiple touchpoints. It exemplifies this approach with six touchpoint types:rand advertising, retailer advertising, in-store communications, word-of-mouth, peer observation (seeing other customers), and traditional earnededia such as editorial. Using the real-time experience tracking (RET) method by which respondents report on touchpoints by contemporaneous
ext message, the impact of touchpoints on change in brand consideration is studied in four consumer categories: electrical goods, technologyroducts, mobile handsets, and soft drinks. Both touchpoint frequency and touchpoint positivity, the valence of the customer’s affective responseo the touchpoint, are modeled. While relative touchpoint effects vary somewhat by category, a pooled model suggests the positivity of in-storeommunication is in general more influential than that of other touchpoints including brand advertising. An almost entirely neglected touchpoint,eer observation, is consistently significant. Overall, findings evidence the relative impact of retailers, social effects and third party endorsement inddition to brand advertising. Touchpoint positivity adds explanatory power to the prediction of change in consideration as compared with touchpointrequency alone. This suggests the importance of methods that track touchpoint perceptual response as well as frequency, to complement current
nalytic approaches such as media mix modeling based on media spend or exposure alone.2015 New York University. Published by Elsevier Inc. All rights reserved.
eywords: Retailing; Advertising; Integrated marketing communications; In-store communications; Word-of-mouth (WOM)
pdeaect
Introduction
There is a stream of research comparing the impact of vari-us paid-for media, which is helpful to marketers in determiningheir overall media spend and its allocation across media (Naiknd Peters 2009). Brand owners have a bigger challenge, how-ver: how to allocate budgets and management time across the
ider range of touchpoints that occur in the customer deci-ion journey (Court et al. 2009). These broader touchpoints goeyond the brand advertising which is generally referred to as
∗ Corresponding author at: Cranfield School of Management, Cranfield Uni-ersity, Cranfield, Bedofrdshire MK43-0AL, United Kingdom.el.: +44 07788 543 905.
E-mail addresses: [email protected]. Baxendale), [email protected] (E.K. Macdonald),[email protected] (H.N. Wilson).
Ftn(dNotaae
ttp://dx.doi.org/10.1016/j.jretai.2014.12.008022-4359/© 2015 New York University. Published by Elsevier Inc. All rights reserv
aid media (or owned media where the firm does not have to payirectly), to include for example traditional earned media such asditorial coverage. Peer-to-peer encounters with the brand suchs word-of-mouth (WOM) conversation can also be regarded asarned touchpoints (Stephen and Galak 2012). In the case ofonsumer goods sold through retailers, the focus of this article,he retailer may also pay for advertising that mentions the brand.urthermore, the store itself is far more than a fulfillment channel
o convert pre-existing intentions to purchases. In-store commu-ications can also bring new brands into active considerationCourt et al. 2009; Goodman et al. 2013) and influence imme-iate or subsequent purchase irrespective of channel (Verhoef,eslin, and Vroomen 2007). Of these touchpoints, the brandwner only directly controls brand advertising, but all are poten-ially within the brand owner’s influence. The resulting resource
llocation challenge in turn leads to a measurement challenge:ssessing the relative importance of these diverse touchpoints involving the customer’s brand attitudes and hence behaviors.ed.

2 of Ret
jPjmnncntiuieii“c
twiacsAtrjnaabhprabt
eonItatewoptptsmt
sao
wsieSt
nrsrmgitOsappoaoeaf
wdw
baeia9ttcsbi
ha
36 S. Baxendale et al. / Journal
Despite widespread agreement that the customer decisionourney needs to be understood across all touchpoints (Wiesel,auwels, and Arts 2010), most research focuses on parts of this
ourney in isolation, such as brand advertising, in-store com-unications, or WOM. Such focused studies are undoubtedly
ecessary, providing granular insight into these parts of the jour-ey. However, managers also have an interest in understandingomparative effects of diverse touchpoints in an equivalent man-er in order to inform the complete marketing plan. Multipleouchpoints in the consumer search process, including customernteractions with ‘sales’ channels, can be viewed symmetricallyntil final choice occurs, as the search process may iterate indef-nitely while consumers revise brand/channel utilities (Neslint al. 2014). Such a holistic view of touchpoints is particularlymportant as media fragmentation sees brand managers increas-ngly allocate their budgets to what are still often described asunmeasured media” such as news media coverage and in-storeommunications (Ailawadi et al. 2009, p. 50).
We speculate that the paucity of empirical studies across mul-iple touchpoints is in large part due to data availability. In Table 1e show representative examples of research that does assess the
mpact of multiple touchpoints. While rich individual-level datare available for retail transactions and promotions from loyalty-ard holders and consumer panels (Ngobo 2011), these dataources do not reach other parts of the journey such as WOM.ggregate-level data such as media spend can be used to model
he relative impact of some market mix variables on consumeresponse (Naik and Peters 2009), but again there are parts of theourney such as peer-to-peer touchpoints that this method can-ot reach. In the online context, automatically captured data canllow a rich picture of the customer journey (Trusov, Bucklin,nd Pauwels 2009), but there is no ready equivalent for offlinerand encounters. Surveys can in theory ask about touchpointsolistically, but respondents find it difficult to remember touch-oints accurately (Wind and Lerner 1979); in particular, affectiveesponse decays rapidly and is recalled poorly (Aaker, Drolet,nd Griffen 2008). Marketing practitioners tend, therefore, to userand tracking surveys only for a few frequent and memorableouchpoints such as television advertisements.
In this article, we therefore apply the emerging real-timexperience tracking (RET) method to understand how a rangef touchpoints impacts on brand consideration. Adopted by aumber of companies such as BSkyB, Energizer, Microsoft andntercontinental Hotels (Macdonald, Wilson, and Konus 2012),he RET method involves asking a panel of consumers to send
structured text (SMS) message by mobile phone wheneverhey encounter one of a set of competitive brands within a cat-gory for a period of a week. This has the benefit of allowing aide range of touchpoints to be reported, including those such asffline WOM that leave no behavioral trace. It also allows touch-oint positivity, the valence of the customer’s affective responseo the touchpoint (Kahn and Isen 1993), to be captured. Byooling multiple RET samples, we study four categories: elec-
rical goods, technology products, mobile phone handsets, andoft drinks. These categories provide a spread of high involve-ent, extended decision journeys in mobile handsets, and inechnology products such as laptops, cameras, and televisions;
ci(c
ailing 91 (2, 2015) 235–253
omewhat lower involvement journeys in electrical goods, suchs blenders and dishwashers; and repertoire brands in the casef soft drinks
Through these data, we hence address two objectives. First,e examine the impact on change in brand consideration of
ix broad touchpoints: brand advertising; retailer advertising;n-store communications; peer-to-peer conversation; traditionalarned media; and peer observation (observing other customers).econd, we examine the roles of both touchpoint frequency and
ouchpoint positivity in forming this impact.This study thereby makes three contributions to multichan-
el and brand choice literature. First, we evidence the relativeole of multiple touchpoints in evolving brand consideration. Allix touchpoints are significant in at least three categories. Whileelative touchpoint effects vary somewhat by category, a pooledodel suggests the positivity of in-store communication is in
eneral more influential than that of other touchpoints includ-ng brand advertising. Furthermore, an almost entirely neglectedouchpoint, peer observation, is both pervasive and persuasive.verall, our findings evidence the relative impact of retailers,
ocial effects and third party endorsement in addition to branddvertising. Second, we highlight the roles of both touchpointositivity and frequency across this wide range of touchpoints. Inarticular, we find that positivity adds to the explanatory powerf a model predicting consideration change based on frequencylone. This suggests a limitation of media mix modeling basedn media spend as a proxy for frequency. Third, we propose andxemplify a RET-based approach by which both the positivitynd the frequency of multiple touchpoints can be assessed inurther categories and with further touchpoints.
In the following sections, we develop a conceptual frame-ork, describe the data collection and data analysis in moreetail, present findings, and discuss implications for practice asell as research directions.
Conceptual Framework
We view the customer search process as consisting of a num-er of discrete encounters with varying touchpoints, such asdvertisements, WOM, and so on. See Fig. 1. Drawing on Courtt al. (2009), we define a touchpoint as an episode of direct orndirect contact with the brand. Thus touchpoints include butre not limited to channels as defined by Neslin et al. (2006, p.6) as: “a customer contact point, or a medium through whichhe firm and the customer interact”. We suggest an expansion ofhis definition is required, as the emphasis here on interactionommonly excludes one-way communications such as televi-ion advertising, while the emphasis on the firm may excluderand encounters such as WOM in which the firm is not directlynvolved.
Our choice of touchpoints emphasizes breadth in the stake-older who the customer touches, from the brand owner (branddvertising) and the retailer (retailer advertising and in-store
ommunications) to peers (WOM and peer observation) andndependent third parties such as editorial and expert reviewstraditional earned media). In the interests of parsimony weombine subtypes within each of these touchpoints: online and
S. B
axendale et
al. /
Journal of
Retailing
91 (2,
2015) 235–253
237
Table 1Illustrative studies on the impact of multiple touchpoint types.
Context Data collection Maindependentvariable(s)
Touchpoints Real-timeencounterrecording
Perceptualresponse
Brandadvertising
Retaileradvertising
In-storecomms.
WOM Peerobservation
Traditionalearned media
Stephen andGalak(2012)
Lending Search, mediascanning
Sales * * *
Ngobo (2011) Grocery Panel data Preference,purchaseintention
* *
Stammerjohanet al. (2005)
Credit cards Experiment Attitude tobrand
* * *
Trusov,Bucklin,and Pauwels(2009)
Social network Transaction data Membergrowth
* * *
van der Lanset al. (2010)
Viral marketing Online form Participationin thecampaign
* *
O’Cass (2002) Politics Survey Attitude tobrand
* * *
Ataman, vanHeerde, andMela (2010)
Multiple Panel data Sales * *
This paper Multiple consumergoods
Real-time experiencetracking
Consideration * * * * * * * *

238 S. Baxendale et al. / Journal of Retailing 91 (2, 2015) 235–253
Change in brand con sid era�on
(T1 – T0)
Retailer adver�sin g
In-store commun ica�on s
Retail touchpoints
Brand adver�sin g
Brand owner touchpoints
• Tou chpoi nt frequency• Tou chpoi nt posi�vity
Word-of -mouth received
Pee r obse rva�on
Third party touchpoi nts
Tradi�onal earned media
Brand tou chpoints • Focal brand• Com pe�tor brand s
• Touchpoint frequency• Tou chpoi nt posi� vity
• Tou chpoi nt frequency• Tou chpoi nt posi� vity
eptual
otc
T
Sit22pt2oputrtrrpW(foWcceR
pemfaispr
B
bdcrcb(sitdCstwcp
Brand con sid era�on (T0)
Fig. 1. Conc
ffline WOM, for example. We model the impact of theseouchpoints on change in consideration, taking account of prioronsideration.
ouchpoint Frequency and Positivity
Unlike many time-series media mix studies (Thomas andullivan 2005), our study allows for customer heterogeneity
n touchpoint frequency. Frequency may impact brand atti-udes by increasing brand awareness (Yaveroglu and Donthu008). Repetition can also improve learning (Goh, Hui, and Png011). In addition, we consider perceptual response to touch-oints. Despite experimental findings that perceptual responseo advertisements impacts attitudes (Brinol, Petty, and Tormala004), many models of field data, particularly in the casef paid media, focus purely on frequency or media spend,resumably because perceptual response data are frequentlynavailable. This makes it difficult to untangle the effect ofhe medium from that of the message. Inspired by WOMesearch, we model perceptual response with touchpoint posi-ivity, which we define as the valence of the customer’s affectiveesponse to the encounter (Kahn and Isen 1993). Affectiveesponse has been shown to impact on spending and repeaturchase intentions (Arnold and Reynolds 2009; Liu 2006).hile affective response can be viewed multidimensionally
Chitturi, Raghunathan, and Mahajan, 2008), qualitatively dif-erent emotions can be related to the unidimensional constructf affective valence or positivity (Kahneman and Krueger 2006;estbrook and Oliver 1991). Positivity is associated with out-
omes including satisfaction (Westbrook and Oliver 1991),ommitment (Ahluwalia, Burnkrant, and Unnava 2000), vari-ty seeking (Kahn and Isen 1993), and consideration (Desai andaju 2007). We adopt positivity here in the interests of model
Ama
framework.
arsimony. Post-touchpoint affect forms part of the customer’svaluative response as affective markers remain in episodicemory thereafter (Westbrook and Oliver 1991), influencing
uture brand-related cognitions (Baumeister et al. 2007). After period of time, however, affective response may be not justmperfectly recalled but also reconstructed for reasons such aself-justification (Cowley 2008). This suggests that touchpointositivity should be assessed immediately after the encounter,ather than retrospectively in surveys.
rand Consideration
We focus for parsimony on one brand attitude construct:rand consideration. Following Roberts and Lattin (1997), weefine consideration as the extent to which the customer wouldonsider buying the brand in the near future. It is hence closelyelated to purchase intention, but allows for the observation thatustomers evoke a set of brands, which may evolve over time,etween which they then choose based on a comparison of utilityNeslin et al. 2014). Priester et al. (2004) provide experimentalupport for the mediating role of consideration between evolv-ng attitudes to the brand on the one hand and purchase onhe other. Brand consideration is hence useful as an interme-iate outcome variable when purchase data are not available.ourt et al. (2009), in particular, conceive of the consumer deci-
ion journey as an interplay between multiple touchpoints andhe consumer’s evolving brand consideration. We add to thisork more granularity of method description, real-time data
ollection, the distinction between touchpoint frequency andositivity, and further touchpoints such as peer observation.
nother reason for adopting consideration is that it is in com-on use among practitioners for evaluating consumer response,s it is readily studied through brand tracker surveys.

of Ret
T
er(cp(pb
Trcb(cemias(o(iWwiotf2
htetarecmll
D
DpoAd
boadaFep
cttcssett
tPsamc5bmwa(paiwtcefr
ceaataprlac(
S. Baxendale et al. / Journal
ouchpoints
See Fig. 1 for the touchpoints captured in this study. First, wexamine separately advertisements by the brand owner and theetailer. Media spend models do not necessarily pick up the latterNaik and Peters 2009). Next, we examine in-store communi-ations, including touchpoint subtypes such as viewing in-storeosters and seeing prominent display of the product on the shelfAilawadi et al. 2009). In a bar or restaurant, subtypes includeosters, beer mats, and seeing display of the product behind thear.
The first of two peer-to-peer touchpoints is peer observation.he impact of other customers in the retail or consumption envi-
onment has been explored relatively sparsely as compared withustomer-firm interactions (Verhoef et al. 2009). Nonetheless,oth qualitative (Borghini et al. 2009) and a few quantitativeSweeney and Soutar 2001) studies suggest that other customersan impact brand attitudes through observation alone without thexplicit recommendation or criticism of WOM. Observing peersay impact service satisfaction (Grove and Fisk 1997); the sim-
larity of others may increase purchase intentions (Thakor, Suri,nd Saleh 2008); and consumers who purchase products with theupport of others may form more enduring brand relationshipsMcAlexander, Schouten, and Koenig 2002). The influence ofthers is higher in environments where consumption is publicBearden and Etzel 1982); this is the case to differing extentsn our four categories. The second peer-to-peer touchpoint is
OM, defined as any conversation (whether online or offline)ith other individuals in which the brand is mentioned. The
mpact of WOM has often been examined in isolation fromther touchpoints (East, Hammond, and Lomax 2008). Excep-ions largely concern WOM in social media which has been theocus of much recent attention (Archak, Ghose, and Ipeirotis011; Liu 2006).
Finally, earned media such as editorial and news coverageas been recently rebranded as traditional earned media to dis-inguish it from social media (Stephen and Galak 2012). Sucharned communications have been the subject of some dedicatedime series studies (Goh, Hui, and Png 2011), though as Stephennd Galak (2012, p. 626) document in their extensive literatureeview on earned media, “often only one source of publicity isxamined, precluding comparisons between different types ofhannels”. Overall, these authors observe, “The effects of paidedia on sales have been extensively covered in the marketing
iterature. The effects of earned media, however, have receivedimited attention”.
Method
ata Collection Approach and Sample
See Fig. 2 for our operationalization of the RET method.ata were collected by MESH, a market research firm which
ioneered the method, on behalf of multiple sponsoring brandwners over the four categories. Data were collected in Northernmerica and Europe. First, an online survey was used to collectemographics and brand consideration for a set of competitivehtpt
ailing 91 (2, 2015) 235–253 239
rands at time T0; consideration was collected again at the endf the week (time T1). Second, participants were asked to send
text message whenever they encountered one of the brandsuring the seven days of the study. Each participant was sentn initial text message which documented the code frame inig. 2 so they always had the required information to hand. Thisnabled the capture of touchpoints as they occurred as well asarticipants’ real-time affective response in a positivity measure.
Within each category, a sample of consumers looking to pur-hase within the next three to twelve months (depending onhe category) was recruited via an online panel (Table 2). Inhe case of soft drinks participants were regular drinkers ofarbonated drinks. The data were collected over a period ofeveral months (dependent on the category) through weeklyamples in each category, with a new set of participants recruitedach week. This approach was adopted in order to expandhe sample and to allow sponsoring firms to track trends overime.
Each SMS message recorded the brand, the touchpoint, andhe participant’s real-time assessment of touchpoint positivity.articipants were briefed with a coding scheme for the mes-age, with a letter for each brand, a letter for each touchpoint,nd a Likert-scale number for positivity; so, for example, “BA5”ight represent a brand named “Quench” (name amended for
onfidentiality); a TV advertisement; and a positivity rating of (very positive) on a 5-point scale (measures are describedelow). The conciseness of the message had the aim of mini-izing the disruption to the participant’s life. While touchpointsere collected in detail (such as television, radio, billboards
nd so on), they were aggregated into the broad touchpointssuch as brand advertising) shown in Fig. 1, for analysis pur-oses. To enhance validity in this coding, participants weresked to visit an on-line diary at their convenience (typicallyn the evening) every two days, where the texts they had sentere displayed. In the diary, they were asked to provide fur-
her details about each touchpoint through a pull-down menuontaining touchpoint sub-types. This allowed checking, forxample, whether a magazine touchpoint was an advertisementrom the brand, an advertisement from a retailer, editorial mate-ial, and so on.
We excluded from analysis any participants where pre-onsideration or post-consideration was missing. We alsoxcluded those who did not report any brand encounters atll, as these participants either did not engage with the processnd hence constitute missing data, or genuinely had no encoun-ers which is of limited interest to our research objectives. Welso cleaned the data to ensure validity of entries; if any touch-oint was recorded with invalid codes then the participant wasemoved. We used listwise deletion as imputation methods canead to bias in coefficients and as the sample size was regardeds sufficient to allow a slight loss of power. 265 (6.0%) electri-al goods participants were excluded from the final dataset, 2604.4%) technology products participants, 204 (10.7%) mobile
andset participants, and 62 (2.5% of sample) soft drinks par-icipants. Table 2 shows the base sizes after excluding thesearticipants, ranging from 1709 for mobile phones to 5632 forechnology products.
240 S. Baxendale et al. / Journal of Retailing 91 (2, 2015) 235–253
Online survey
(Time T0):
Brand con sid era�on
Demographics
Real �me experience tracking (RET) via mobile handset (over 1 week)Example: Respondent texts “BA5 ”
Online survey
(Time T0plus 1 week) :
Brand con sid era�on
BrandA = Brand AB = Brand BC = Brand CD = Brand DE = Brand F
Touchpoi ntA = TVB = BillboardC = RadioD = Me drin kin g/
buyin gE = Conversa�onF = CinemaG = Ne wsp aperH = Magazin eI = SponsorshipJ = In storeK = At an eventL = Someone els e
drin kin gM = Onlin eN = LeafletO = In bar/
rest aurantP = Other (please
specify)
Posi� vityHow di d it make yo u feel?1 = very nega�ve5 = very posi�ve
. Me
M
acisaaaiaqrnda
rpz(oaiact
M
TS
SA
NBRIWPT
R
Fig. 2
easures
Brand consideration was measured using a 6-point scale,nchored by: ‘This is the only brand that I would consider pur-hasing’ and ‘I would definitely not consider purchasing it’. Thiss similar to Bian and Moutinho (2009). Positivity was mea-ured with a single Likert-scale item “How did it make you feelbout the brand?” on a 5-point scale anchored by ‘very positive’nd ‘very negative’, similarly to McFarland and Buehler (1998)mongst others. Touchpoint frequency was calculated by count-ng the touchpoints of a given type: so, if a respondent sees twodvertisements for a brand over the week, the touchpoint fre-uency is 2. Positivity was re-centered around 0, such that 0epresented neutral encounters, +2 very positive and −2 very
egative encounters. This was then averaged for each respon-ent and touchpoint type: so, if the respondent rates one branddvertisement as 4 and another as 5, the average positivity (aftermri
able 2ample definition.
Electrical goods Technolo
ample definitiona
ge 18–64 18–64
umber of encountersrand advertising 4446 4227
etailer advertising 7254 7003
n-store communications 4202 7002
OM 1132 1706
eer observation 2201 2689
raditional earned media 795 2462
espondents 4176 5632
a Either a current user or purchasing within the next few months, depending on the
thod.
e-centering) is 1.5. If the participant did not report a touch-oint (i.e., frequency is zero), average positivity was coded asero. Hence in a regression the impact of neutral touchpointsor if the average positivity is zero) is equivalent to the impactf frequency. Hence the impact of positivity can be interpreteds the impact above the neutral baseline of frequency, aidingnterpretation. We return later to some robustness checks on thispproach to modeling frequency, positivity, and our decision toode positivity as zero where a touchpoint did not occur duringhe week.
odels
We combine the data from our four categories in a pooledodel to further increase the sample size and deliver generalized
esults. We weight the data such that each brand is representedn the dataset equally to prevent any bias toward those categories
gy products Mobile handsets Soft drinks
18–64 16–44
3033 41981096 7361890 54021403 6592550 2693
299 104
1709 2445
study.

of Ret
w(fgWtbplrcl
cbwctm(
C
wstfvSttthoftt
fi
is
wpiats
apl
t
sapt
M
AmpdnacSacfi
iettctUrlWa
tvsfps
S. Baxendale et al. / Journal
ith a greater sample size. We model the change in considerationT1 consideration minus T0 consideration) at the customer levelor each brand by using prior (T0) brand consideration, demo-raphics, brand dummies, and time of year as control variables.e then explain additional variability through incorporating
ouchpoint frequency and positivity variables for both the focalrand and competitor brands. As we observe multiple responseser customer (one response for each brand in their study), there isikely to be unmodeled heterogeneity across each set of customeresponses caused, for example, by unobserved covariates at theustomer level. To account for this, we include a respondent-evel random intercept via a linear mixed-effects model.
The correlation matrix in Table 3 indicates no severe multi-ollinearity problems; however, we do notice high correlationsetween the frequency and positivity of each touchpoint, whiche return to in an exploratory analysis below. As a further
heck we calculated the variance inflation factors (VIF) forhe explanatory variables in each model. All VIF values (sum-
arized in Table 4) fall below the recommended cut off of 5O’Brien, 2007), suggesting multi-collinearity is not of concern.
Our model formulation is as follows:
onsid Posti,k − ConsidPrei,k = α + bi + βpreConsidPrei,k
+ βbrandBrandk + βtime1 Quarteri + βtime
2 Yeari + βdem1 Agei
+βdem2 Sexi +
J∑
j=1
{βfreqj ln(Freqi,k,j + 1) + β
posj AvgPosi,k,j
+γfreqj ln(Freqi,−k,j + 1) + γ
posj AbgPosi,−k,j} + ∈i,k
here ConsidPosti,k and ConsidPrei,k are the considerationcores of individual i for brand k after and before the week ofexting, respectively, Brandk is a dummy variable accountingor heterogeneity across brands, Quarteri and Yeari are dummyariables identifying when individual i was tracked, Agei andexi are variables for the age and sex of individual i. Age isreated as a continuous variable and Sex is a dummy variableaking 1 for male and 0 for female, Freqi,k,j and AvgPosi,k,j arehe frequency and average positivity of encounters individual ias through touchpoint j for brand k, and J is the total numberf touchpoints in the model, Freqi,−k,j and AvgPosi,−k,j are therequency and average positivity of encounters individual i hashrough touchpoint j for all brands other than k (i.e., competitorso the focal brand).
We build this model sequentially and summarize the modelt for each in Table 4:
Model 1: Only the control variables are included. This is todentify how respondent-level data can measure considerationhifts and to provide a baseline for future models.1
1 We also tested alternatives to Models 1 to 3 in which the dependent variableas post-study consideration and not change in consideration. Naturally, there-consideration coefficient was substantial and positive (β ranging from 0.52n electrical goods to 0.71 in soft drinks in Model 3) as pre-consideration acts asn initial estimate for post-consideration. However, substantive results regardinghe role of touchpoint frequency and positivity, including which variables wereignificant and coefficient magnitudes, were very similar to those reported here,
Mcjhe4w
sv
ailing 91 (2, 2015) 235–253 241
Model 2: As we anticipate that changes in consideration willlso be a function of brand touchpoints, Model 2 builds on therevious model by adding touchpoint frequency with a naturalogarithmic decay.
Model 3: We then add touchpoint positivity to distinguishouchpoint frequency from touchpoint perceptual response.
Model 4: While Model 3 only looks at same-brand effects,uch as brand A’s touchpoints impacting on brand A consider-tion, in Model 4 we add competitor touchpoint frequency andositivity; we would expect these to have a negative effect onhe focal brand’s consideration.
odel Selection
We compared and selected models on the basis of theirIC (Akaike’s Information Criterion) and BIC (Bayesian Infor-ation Criterion), with BIC preferring simpler models (fewer
arameters) than AIC. Improved model fit is evidenced byecreases in information criterion between models; however,either AIC or BIC gives an absolute indication of fit (Burnhamnd Anderson 2004). We also therefore use the marginal andonditional r2 values for mixed-effects models (Nakagawa andchielzeth, 2013). Marginal r2 demonstrates the amount of vari-bility explained by only the fixed effects in our models, andonditional r2 demonstrates the variability explained by bothxed and random effects.
Further, we calculated model fit statistics for each categoryn isolation, to understand which model best fits individual cat-gory data. If we were to take the full data for each categoryhen we might expect the categories with a higher sample sizeo prefer more complex models due to the formula used to cal-ulate AIC and BIC. To avoid this bias we restricted the sampleo 1,500 respondents per category when calculating fit statistics.sing a bootstrapping technique, we took a random sample with
eplacement of 1,500 respondents from each category and calcu-ated AIC, BIC, and r2 values for Models 1–4 using that sample.
e performed 5,000 iterations of this procedure and took theverage of the model statistics. See Table 4.
In the case of the pooled data, according to both AIC and BIChe full Model 4 is preferred. Fixed effects explain 19.6% of theariability in a respondent’s change in consideration, with unob-erved individual-level covariates (random intercept) accountingor a further 12.2%. By contrast, AIC indicates Model 3 isreferred for the individual categories, likely due to the lowerample size when compared to the pooled data. BIC also favors
odel 3, except in soft drinks where Model 1 is preferred. Thisould be due to the higher price-tag and extended purchaseourney for electrical goods, technology products, and mobileandsets when compared to soft drinks, more factors hence influ-ncing consideration. Given that r2 continues to rise until Model
in soft drinks, for simplicity we will only consider Model 3hen reporting individual category results.
uggesting robustness of the model with respect to this choice of dependentariable. We therefore do not report these in full.

242
S. B
axendale et
al. /
Journal of
Retailing
91 (2,
2015) 235–253
Table 3Correlation matrix: pooled data.
Mean Standarddeviation
Conside-ration (pre)
Age Sex Frequency Average positivity
Traditionalearned
Brandadvertising
WOM Peerobservation
In-storecommunica-tions
Retaileradvertising
Traditionalearned
Brandadvertising
WOM Peerobservation
In-storecommunica-tions
Retaileradvertising
Consideration(post–pre)
−0.02 1.12 −0.38** −0.02** −0.01* 0.02** 0.06** 0.02** 0.03** 0.07** 0.03** 0.05** 0.03** 0.05** 0.06** 0.08** 0.06**
Consideration(pre)
3.79 1.17 1.00
Age 37.11 11.41 0.04** 1.00Sex (male) 43% 0.01 −0.01* 1.00Frequency
Traditionalearned
0.04 0.23 0.04** 0.00 0.00 1.00
Brandadvertising
0.17 0.56 0.02** −0.03** 0.03** 0.05** 1.00
WOM 0.05 0.30 0.03** −0.04** 0.02** 0.06** 0.1** 1.00Peerobservation
0.10 0.43 0.03** −0.05** 0.00 0.02** 0.05** 0.08** 1.00
In-store com-munications
0.19 0.57 0.05** 0.01* 0.00 0.01** 0.03** 0.05** 0.08** 1.00
Retaileradvertising
0.16 0.56 0.07** 0.11** −0.03** 0.02** 0.03** 0.02** 0.00 0.04** 1.00
Average positivityTraditionalearned
0.02 0.20 0.06** 0.00 −0.01* 0.54** 0.00 0.02** 0.01** 0.01** 0.01* 1.00
Brandadvertising
0.10 0.39 0.07** −0.01* 0.01** 0.01 0.55** 0.03** 0.02** 0.02** 0.02** 0.01** 1.00
WOM 0.03 0.25 0.06** −0.01** 0.01 0.02** 0.04** 0.44** 0.04** 0.04** 0.02** 0.03** 0.05** 1.00Peerobservation
0.05 0.32 0.09** −0.02** −0.01** 0.03** 0.02** 0.04** 0.46** 0.04** 0.00 0.04** 0.02** 0.05** 1.00
In-store com-munications
0.12 0.44 0.12** 0.04** −0.01** 0.02** 0.01** 0.04** 0.02** 0.52** 0.02** 0.04** 0.03** 0.06** 0.06** 1.00
Retaileradvertising
0.08 0.34 0.09** 0.07** −0.03** 0.01** 0.02** 0.01** 0.00 0.03** 0.48** 0.02** 0.05** 0.03** 0.03** 0.06** 1.00
Significant parameters:** p < .01.* p < .05.

S. Baxendale et al. / Journal of Retailing 91 (2, 2015) 235–253 243
Table 4Model statistics.
Model AIC BIC r2 marginal r2 conditional Average VIF Maximum VIF
Pooled dataModel 0: Null 248,999 249,027 0.0% 16.7% NA NAModel 1: Baseline 235,861 236,186 14.6% 26.6% 2.02 2.49Model 2: Frequency 233,931 234,330 16.7% 29.4% 1.91 2.60Model 3: Positivity 231,244 231,717 19.4% 32.0% 1.92 2.62Model 4: Competitor effects 230,905a 231,527a 19.6% 31.8% 1.84 2.67
Electrical goodsb
Model 0: Null 26,029 26,051 0.0% 18.6% NA NAModel 1: Baseline 24,584 24,705 17.1% 28.5% 1.44 1.82Model 2: Frequency 24,337 24,513 19.8% 32.2% 1.37 1.86Model 3: Positivity 24,036a 24,269a 22.7% 35.1% 1.55 2.04Model 4: Competitor effects 24,068 24,414 23.3% 34.9% 1.55 2.08
Technology productsb
Model 0: Null 19,241 19,262 0.0% 17.0% NA NAModel 1: Baseline 18,152 18,253 17.8% 25.9% 1.30 1.62Model 2: Frequency 17,962 18,117 20.6% 30.5% 1.30 1.81Model 3: Positivity 17,734a 17,943a 23.8% 34.3% 1.61 2.18Model 4: Competitor effects 17,737 18,055 24.8% 34.1% 1.62 2.22
Mobile handsetsb
Model 0: Null 20,060 20,081 0.0% 15.4% NA NAModel 1: Baseline 18,840 18,947 18.8% 30.1% 1.53 1.80Model 2: Frequency 18,710 18,871 21.2% 33.3% 1.38 1.84Model 3: Positivity 18,499a 18,715a 24.1% 36.2% 1.60 2.19Model 4: Competitor effects 18,549 18,872 24.5% 36.0% 1.64 2.82
Soft drinksb
Model 0: Null 16,869 16,890 0.0% 19.6% NA NAModel 1: Baseline 16,332 16,420a 9.6% 25.4% 1.39 1.71Model 2: Frequency 16,300 16,442 10.7% 26.7% 1.40 1.90Model 3: Positivity 16,243a 16,438 12.0% 27.6% 1.42 1.93Model 4: Competitor effects 16,318 16,621 12.6% 27.7% 1.38 1.99
R
aat
F
rcdmd
(
P
dithe0nta
a Preferred model.b 1500 bootstrap sample.
obustness Checks
To check robustness we tested a number of competing modelsnd reformulations of frequency and positivity variables, andlso checked our decision to code the positivity of non-occurringouchpoints as 0. We discuss these in turn.
requency
The models above assume that frequency has a natural logelationship with change in consideration. This is to account forommunication wearout through over-exposure which results iniminishing returns (Bass et al. 2007). To check this transfor-ation of frequency we try four competing models, each with a
ifferent formulation of frequency:
Model Freq1: With dichotomous variable (where at least oneinstance of the touchpoint occurs): β
freqj I[Freqi,k,j>0].
Model Freq2: With a linear term: βfreq
Freq .
j i,k,jModel Freq3: With a quadratic decay term: βfreq1,j Freqi,k,j +
βfreq2,j Freq2
i,k,j .
nit(
Model Freq4: With a natural log decay term:β
freqj ln(Freqi,k,j + 1).
The fit statistics in Appendix show that the log decay termModel Freq4) provides the best fit.
ositivity
We investigated different ways of incorporating positivity byevising several competing models: again, see Appendix. Thenclusion of average positivity (Model Pos1) leads to a poten-ial loss of information. For example, it treats an individual whoas a very negative, a neutral, and a very positive (−2, 0, 2)ncounter the same as an individual who has three neutral (0, 0,) encounters because both average to 0. To check the robust-ess of this approach, we introduced a term for the variance ofouchpoint encounters (Model Pos2) following Archak, Ghose,nd Ipeirotis (2011). We alternatively separated the frequency of
egative, neutral, and positive encounters (Model Pos3) follow-ng Liu (2006). We also investigated a term for the positivity ofhe last touchpoint instead of (and as well as) average positivityModels Pos4 and Pos5). We conclude from the fit statistics that
244 S. Baxendale et al. / Journal of Retailing 91 (2, 2015) 235–253
Table 5Touchpoint impacts on consideration change (pooled data).
Model 1 Model 2 Model 3 Model 4
β SE β SE β SE β SE
(Constant) 0.07** 0.02 −0.14** 0.02 −0.10** 0.02 0.01 0.02Pre-considerationa −0.39** 0.00 −0.40** 0.00 −0.43** 0.00 −0.43** 0.00
FrequencyTraditional earned 0.14** 0.03 −0.01 0.03 0.02 0.03Brand advertising 0.26** 0.01 0.08** 0.02 0.09** 0.02WOM 0.18** 0.02 −0.03 0.02 −0.01 0.02Peer observation 0.24** 0.02 0.05** 0.02 0.07** 0.02In-store communications 0.29** 0.01 0.06** 0.02 0.10** 0.02Retailer advertising 0.19** 0.01 0.06** 0.02 0.08** 0.02
Positivitya
Traditional earned 0.04** 0.00 0.04** 0.00Brand advertising 0.07** 0.00 0.07** 0.00WOM 0.06** 0.00 0.06** 0.00Peer observation 0.08** 0.00 0.08** 0.00In-store communications 0.10** 0.00 0.10** 0.00Retailer advertising 0.06** 0.00 0.06** 0.00
Competitor frequencyTraditional earned −0.02 0.02Brand advertising −0.04** 0.01WOM −0.06** 0.01Peer observation −0.05** 0.01In-store communications −0.08** 0.01Retailer advertising −0.04** 0.01
Competitor positivitya
Traditional earned −0.01* 0.00Brand advertising −0.01 0.00WOM 0.00 0.00Peer observation −0.01** 0.00In-store communications −0.02** 0.00Retailer advertising −0.01 0.00
Significant parameters (p < 0.05) are bolded.
ts
P
pmebzzmtam
i
cadopt
nimTai
ticb
* p < .05.** p < .01.
a Standardized coefficients.
he most effective way to include positivity is indeed to use aimple average.
ositivity When no Touchpoint Occurs
When a respondent does not encounter a particular touch-oint with a brand during the week, its frequency is zero. In theain Models 1–4 we coded positivity as zero in this case; how-
ver, an alternate approach would be mean imputation. We testedoth approaches on Model 4. Both AIC and BIC indicate thatero-coding gives the best model fit (Appendix). Further, whileero-coding gives VIFs below the recommended cut-off of 5,ean imputation gives six VIF scores above this cut-off with
he largest being 18.2. Hence using zero coding seems the mostppropriate approach to reduce multi-collinearity and improveodel fit.
Findings and Discussion
Results for the pooled data, using Models 1–4, are shownn Table 5. In Table 6 we show Model 3 estimated for each
nwe
ategory. We report standardized coefficients for positivity toid comparison of relative impact across touchpoints, but leaveummy and frequency (count) variables unstandardized for easef interpretation. We begin with these main results, focusingrimarily on Model 4 in the case of the pooled data, beforeurning to the exploratory analyses.
Initially, we briefly discuss non-touchpoint terms. First weote that prior consideration is negatively associated with shiftn consideration (p < 0.01, standardized β = −0.43 for the pooled
odel and ranging from −0.33 to −0.46 for category models).his is presumably an expected regression to the mean effect,s the higher a respondent’s pre-consideration, the more likelyt is that any shift will be down rather than up.
While the study focus is primarily brand neutral, some addi-ional explanatory power is obtained through consideration ofndividual brands. The coefficients of these dummy variablesorrelate highly with prior consideration (r = 0.84). One possi-le explanation is that higher levels of consideration represent
ot just a more positive attitude but also higher attitude strength,hich provides resistance against change to attitude (Priestert al. 2004).

S. Baxendale et al. / Journal of Retailing 91 (2, 2015) 235–253 245
Table 6Touchpoint impacts on consideration change by category (Model 3).
Electrical goods Technology products Mobile handsets Soft drinks
β SE β SE β SE β SE
(Constant) −0.31** 0.02 −0.12** 0.02 0.02 0.04 0.06 0.04Pre-considerationa −0.45** 0.01 −0.45** 0.01 −0.46** 0.01 −0.33** 0.01
FrequencyTraditional earned 0.02 0.06 −0.02 0.04 −0.06 0.11 −0.02 0.14Brand advertising 0.14** 0.03 0.14** 0.03 0.05 0.04 0.02 0.03WOM −0.13* 0.05 −0.04 0.05 −0.06 0.06 0.08 0.06Peer observation −0.07 0.04 −0.03 0.05 0.04 0.04 0.10** 0.03In-store communications 0.04 0.03 −0.01 0.03 0.06 0.05 0.08** 0.02Retailer advertising 0.06** 0.02 0.06* 0.03 0.10 0.07 −0.05 0.07
Positivitya
Traditional earned 0.03** 0.01 0.06** 0.01 0.02* 0.01 0.02* 0.01Brand advertising 0.08** 0.01 0.06** 0.01 0.09** 0.01 0.08** 0.01WOM 0.05** 0.01 0.05** 0.01 0.09** 0.01 0.04** 0.01Peer observation 0.09** 0.01 0.09** 0.01 0.10** 0.01 0.04** 0.01In-store communications 0.12** 0.01 0.15** 0.01 0.09** 0.01 0.06** 0.01Retailer advertising 0.08** 0.01 0.08** 0.01 0.02** 0.01 0.02 0.01
Significant parameters (p < 0.05) are bolded.*
rdtmlcwf
o
T
pcisstipacglsoamod
tOitint
R
pctprpt�
eedstrac
i
p < 0.05.** p < 0.01.
a Standardized coefficients.
With regard to the temporal dummy variables, we find thatespondents are likely to report a higher shift in considerationuring Quarters 2–4 compared to Quarter 1. We conjecture thathis may be due to a post-Christmas dip, with fewer people able to
ake discretionary expenditure and hence lower brand attentionevels. We also see that years 2011 and 2012 lead to signifi-antly higher shift than 2010 (β = 0.08 and 0.10, respectively),hich could coincide with an increase in consumer confidence
ollowing the recession.There are also some demographic predictors, which are not
ur focus here.
ouchpoint Frequency and Positivity
The pooled analysis suggests that touchpoint frequency andositivity both play a role in shaping consideration. While weannot compare these coefficients directly (as the scale of datas radically different), we do see that touchpoint positivity addsubstantial explanatory power (Model 2 vs. Model 3). We alsoee the coefficients for touchpoint frequency change substan-ially between Model 2 and Model 3. It appears that as frequencys naturally somewhat correlated with positivity (due, for exam-le, to the liking effect), its separate effect (due, for example, towareness increases) is over-estimated if positivity is not alsoonsidered. This supports work on advertising affect that sug-ests that emotional appeals may have a strong effect despiteow recall (Bülbül and Menon 2010). It suggests the need toupplement existing methods of measurement that rely purelyn touchpoint frequency, such as the respondent-level frequency
pproach (Havlena, Cardarelli, and De Montigny 2007) andedia spend modeling (Naik and Peters 2009). These meth-ds for assessing touchpoint impact struggle to tease out theifference between an encounter that does not work because of
scft
he touchpoint choice and one where the execution is flawed.ur findings show that this difference matters. A practical
mplication is that measurement techniques focusing purely onouchpoint frequency, even putting aside the well-known valid-ty problems associated with recall (Wind and Lerner 1979), willot provide the specificity of insight provided by techniques thatrack positivity.
elative Touchpoint Impacts
We next consider the relative impacts of different touch-oints, both by examining which terms are significant and byomparing coefficients. To check for significance in the lat-er case, we use the method proposed by Wooldridge (2009,p. 140–143). We define a new coefficient �βpq (= βp − βq),epresenting the difference in the positivity coefficients of touch-oints p and q. Our null hypothesis is that �βpq = 0, that is, thathere is no difference in the coefficients, against the alternateβpq /= 0. We reparameterize the model to ensure that �β is
stimated as a coefficient (by simple algebraic manipulation),nabling us to calculate the standard error associated with theifference and hence the p-value for the hypothesis test. Weummarize the resulting coefficient comparisons in Table 7. Theable shows detailed results for the pooled analysis, and summa-ized results for the category-specific analysis. The touchpointsre ranked by the impact of their positivity on considerationhange.
While we followed a similar process to examine the relativempact of touchpoint frequency, examination of Tables 5 and 6
hows that only some touchpoints have significant frequencyoefficients in any case, and the coefficient comparison showedew significant differences amongst these. Hence, we suppresshese results for brevity (except occasionally in the text) and refer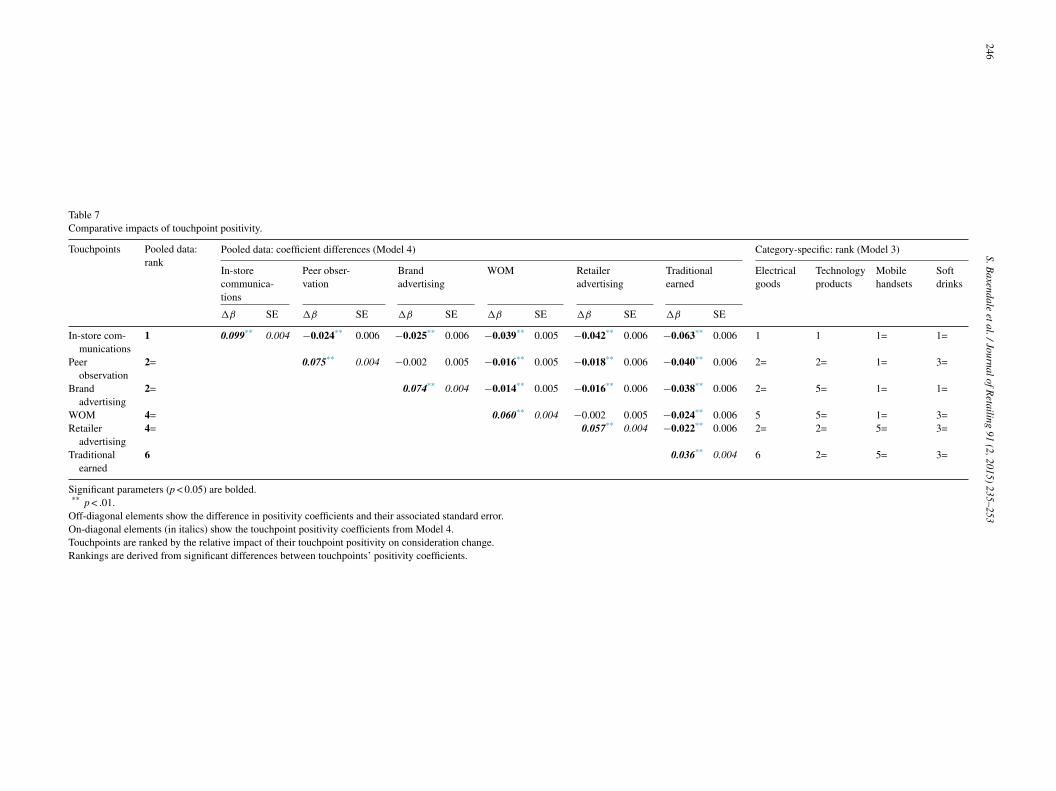
246
S. B
axendale et
al. /
Journal of
Retailing
91 (2,
2015) 235–253
Table 7Comparative impacts of touchpoint positivity.
Touchpoints Pooled data:rank
Pooled data: coefficient differences (Model 4) Category-specific: rank (Model 3)
In-storecommunica-tions
Peer obser-vation
Brandadvertising
WOM Retaileradvertising
Traditionalearned
Electricalgoods
Technologyproducts
Mobilehandsets
Softdrinks
�β SE �β SE �β SE �β SE �β SE �β SE
In-store com-munications
1 0.099** 0.004 −0.024** 0.006 −0.025** 0.006 −0.039** 0.005 −0.042** 0.006 −0.063** 0.006 1 1 1= 1=
Peerobservation
2= 0.075** 0.004 −0.002 0.005 −0.016** 0.005 −0.018** 0.006 −0.040** 0.006 2= 2= 1= 3=
Brandadvertising
2= 0.074** 0.004 −0.014** 0.005 −0.016** 0.006 −0.038** 0.006 2= 5= 1= 1=
WOM 4= 0.060** 0.004 −0.002 0.005 −0.024** 0.006 5 5= 1= 3=Retailer
advertising4= 0.057** 0.004 −0.022** 0.006 2= 2= 5= 3=
Traditionalearned
6 0.036** 0.004 6 2= 5= 3=
Significant parameters (p < 0.05) are bolded.** p < .01.
Off-diagonal elements show the difference in positivity coefficients and their associated standard error.On-diagonal elements (in italics) show the touchpoint positivity coefficients from Model 4.Touchpoints are ranked by the relative impact of their touchpoint positivity on consideration change.Rankings are derived from significant differences between touchpoints’ positivity coefficients.

of Ret
tl
iimcstTaHtjdaraeiiwa
piqtfna2
tpsfiSdTteo
ibnnamar
f
tfWmpsihe
C
Cc
setbr
mpbpaiAo
bid4ft
C
ptmccesa
S. Baxendale et al. / Journal
he reader instead to the frequency coefficients and significanceevels in Tables 5 and 6.2
We begin with the pooled model and consider the touchpointsn turn, in order of decreasing positivity impact, as summarizedn the ranking of Table 7. Highest-ranked is in-store com-
unications, for which frequency is also significant. In-storeommunications such as shelf and display make the brand morealient at the point of purchase (Van Nierop et al. 2010), poten-ially leading to unplanned purchases (Cobb and Hoyer 1986).hey are aided by their multi-sensory nature, as well as by highttention levels in a store environment (Peck and Wiggins 2006).owever, this effect on sales is not direct but via considera-
ion (Van Nierop et al. 2010; Zhang 2006) and is the case notust for such in-store communications, such as feature ads andisplay but also for price-based promotions, which also play
role in consideration set evolution. This is in addition to theole of discounted price in the customer’s judgment of utilityt the moment of final choice (Van Nierop et al. 2010). Thempirical importance of in-store communications in our datas consistent with recent arguments that in-store touchpoints aremportant in influencing consideration irrespective of where andhen the purchase is made (Court et al. 2009; Verhoef, Neslin,
nd Vroomen 2007).Second-ranked are two touchpoints, brand advertising and
eer observation. It is notable that while brand advertisings influential in determining consideration through both fre-uency and positivity effects, it is not the most influentialouchpoint in terms of positivity. This supports the wider agendaor a touchpoint-neutral view of the customer decision jour-ey (Neslin et al. 2014), and in particular a touchpoint-neutralpproach to customer insight (Macdonald, Wilson, and Konus012).
While WOM positivity is significant, in line with the con-emporary emphasis on social effects, it is notable that theositivity of the rarely studied peer observation touchpoint isignificantly more influential. Furthermore, its frequency coef-cient is significantly higher than that for WOM (�β = 0.07,E = 0.03, p < 0.01). Seeing someone else drinking a brandedrink was a common case in point in the soft drinks category.his observation led to marketing strategies in a sponsoring firm
o increase the frequency and positivity of such touchpoints, forxample through the prominence and positioning of the brandn the product.
Retailer advertising also has a significant role in complement-ng advertising by the brand owner, impacting consideration viaoth frequency and positivity. Its impact via frequency is not sig-ificantly different to brand advertising (�β = 0.01, SE = 0.02,s), but the impact of its positivity is somewhat lower. Retailerdvertising is frequently missing from practitioners’ media mixodels due to the lack of available data (Macdonald, Wilson,
nd Konus 2012), but this result shows that it has an importantole and should be tracked.
2 Equivalents of Table 7 for frequency and for competitor effects are availablerom the authors on request.
iii
apd
ailing 91 (2, 2015) 235–253 247
Finally, traditional earned media plays a significant role viaouchpoint positivity, though we could not detect an effect viarequency. In this respect, traditional earned media are similar to
OM. The absence of frequency effect may be related to the lowean positivity of these two touchpoints, and in Model 2 where
ositivity is not considered, both terms become significant. Thisuggests that careful attention to both frequency and positivitys required in earned media evaluation too, in order to diagnoseow the impact of earned media can be increased, or whetherfforts should be focused elsewhere.
ompetitor Effects
Competitor touchpoint effects are accounted for in Model 4.ompetitor frequency and positivity variables test for any directompetitor influence on consideration for the focal brand.
We find that the effect of several competitor touchpoints isignificant (and in the expected, negative, direction on consid-ration change for the focal brand). However, in comparisono focal brand effects, the effect size is moderate, as indicatedy somewhat modest coefficients and a modest increment to2.
Again, in-store communication is important, ranking as theost influential competitor touchpoint via both frequency and
ositivity. The ability for the consumer to compare multiplerands simultaneously in a store may contribute to this as com-ared with touchpoints where brands are seen in isolation. Alsos with the focal brand, peer observation is significant, its pos-tivity being significantly more influential than that of WOM.gain, this highlights the need to track and, where feasible,ptimize peer observation.
The frequency of competitor advertising (from either therand or retailer) is significant but its positivity is not, imply-ng that mere exposure rather than perceptual response mayecrease focal brand consideration. However, these are rankedth and 5th in terms of the impact of competitor touchpointrequency, behind peer influence and in-store communica-ions.
omparing Touchpoint Impacts by Category
Next we consider briefly similarities and differences to theooled model in the category-specific analysis: see Table 6 andhe category-specific ranks in Table 7 for details. In-store com-
unications is consistently the most important touchpoint acrossategories in terms of positivity. Its frequency is also signifi-ant in soft drinks, a sector with rich opportunities for brandncounters out of the home. Peer observation positivity is alsoignificant in each category, and while it is less so than branddvertising in the case of soft drinks, peer observation frequencys nonetheless significant in this category in which consumptions readily observed. Overall, then, peer observation retains itsmportance across categories.
The relative impact of brand advertising is fairly consistentcross categories, being ranked the equal most influential touch-oint via positivity in two categories (mobile handsets and softrinks), and the most influential via frequency in the others. Its

2 of Ret
itstar
E
atiit
F
twat
wbAiihtiitaabitbftsptaa
T
wa
r
Ha
β
(baidtHvitsafadttwd
iiifm
C
scWtip(t
β
wio
48 S. Baxendale et al. / Journal
mportance relative to retailer advertising varies, however, inhe positivity analysis. Whereas in soft drinks and mobile hand-ets brand advertising has a higher coefficient, consistent withhe pooled analysis, the reverse is true is technology products,n area where high margins lead to intense competition amongetailers.
xploratory Analyses
We investigate extensions to Model 4 via three exploratorynalyses. The first considers the possible interaction betweenouchpoint frequency and positivity, the second examines thempact of pre-consideration on touchpoint impact, and the thirdnvestigates the impact of competitor touchpoints on brandouchpoint performance. Each analysis is now briefly discussed.
requency/Positivity InteractionIn Exploratory Analysis 1, we consider the possibility that
ouchpoint frequency and positivity may interact. For example,hile attitude to a single message can influence brand attitude,
ttitude strength may be boosted by repeated positive (or nega-ive) messages (Erdem and Keane 1996).
Interacting the frequency and positivity of touchpoints,hether for the focal brand or for both the focal and competitorrands, does not lead to an increase in model fit as calculated byIC or BIC (Appendix). Furthermore, VIF scores substantially
ncrease, most likely due to the collinearity we are introduc-ng through interaction terms. With this warning, we brieflyighlight preliminary results without reporting them in full forhe sake of brevity.3 Future research may better isolate thesenteraction effects, if they exist. First, interaction effects are alln the expected direction (positive for focal brand and nega-ive for competitors). Second, the competitor interactions whichre significant are WOM, in-store communications, and retailerdvertising. These are the three environments where multiplerands are perhaps most likely to be experienced in close prox-mity, which may invoke a more complex relationship betweenhese touchpoints and consideration. Finally, the significant focalrand interactions are precisely those which have significantrequency-only effects, namely peer observation, retailer adver-ising, in-store communications, and brand advertising, againuggesting that there may be a more complex relationship atlay between frequency and positivity. This finding is consis-ent with work on attitude strength (Erdem and Keane 1996),nd shows another respect in which taking account of positivitynd not just frequency may be important.
ouchpoint Interaction With Pre-ConsiderationIn Exploratory Analysis 2 (models Exp2a/b in Appendix),
e suggest that an individual’s pre-disposition to the brand mayffect how touchpoints influence his/her shift in consideration.
3 Results tables for exploratory analyses are available from the authors onequest.
itWmiβ
ailing 91 (2, 2015) 235–253
ence, we allow ConsidPre to interact with the touchpoint vari-bles by reformulating the touchpoint coefficients, such that:
freqi,k,j = β
(freq×pre)1,j + β
(freq×pre)2,j ConsidPrei,k
And similar for βpos− , γ
freq− , and γ
pos− .
Model Exp2b provides an improvement over Model 4Appendix). This model includes the interaction of initial focalrand consideration with touchpoint variables (for both focalnd competitor brands). However, due to the large number ofnteractions, VIF scores are high (average 8.79). While ourata suggest that this interaction exists, further investigation isherefore needed to establish its exact strength and significance.ence again we do not report results in detail but instead pro-ide an overview. In general, as an individual’s pre-considerationncreases, the impact of touchpoint frequency and positivity onheir change in consideration decreases. This suggests that con-umers who have a more favorable predisposition to the brandre less impacted by brand encounters. This could be a straight-orward case of regression to the mean, where consumers wholready hold a very positive opinion are more likely to moveown the scale or stay where they are rather than further increaseheir opinion. This is managerially interesting when decidingargets for touchpoints such as addressable media, particularlyhere the aim of the communication is attitudinal rather thanirectly behavioral.
We also see that as an individual’s pre-considerationncreases, the impact of competitor frequency and positivityncreases: that is, the pulling power of competitor touchpointss greater for those who have a favorable predisposition to theocal brand. Again, we conjecture that this is a regression to theean effect.
ompetitor Effects on ConsiderationIn Exploratory Analysis 3 (Exp3a/b/c/d), we attempt to mea-
ure the indirect effect of competitor touchpoints on focal brandonsideration via an interaction with focal brand touchpoints.e investigate the impact of competitor clutter on focal brand
ouchpoint performance (Danaher, Bronfer, and Dhar 2008). Wenclude an interaction term between focal and competitor touch-oint frequency and, as proposed by Danaher, Bonfrer, and Dhar2008), attempt to moderate this by the proportion of competi-ors experienced. We do this using the reparameterization of:
freqi,k,j = β
comp1,j + β
comp2,j
∑ρ /= kρ I[Freqi,p,j>0]
Bi − 1Freqi,−k,j
here I[f(x)] = 1 if the statement f(x) is true, that is, if respondent has an experience with brand ρ through touchpoint j, and zerotherwise; and Bi is the total number of brands which individual
was asked to report on – that is, we are calculating the propor-ion of competitor brands which respondent i has experienced.
e also investigate whether competitor positivity (AvgPosi,−k,j)oderates focal touchpoint frequency, and further, the moderat-
ng effect on focal touchpoint positivity (a reparameterization ofpos− ). Appendix shows model fit for each of these explorations.

of Ret
pitaciMboTwesi
rscMctepcbto(tbb
kobfireVnmdpbia
ttiafi
(twkTbWtbvgr
aospwb2t2bbattp
P
bdcqctojoatatnde
apim
S. Baxendale et al. / Journal
Whilst none of these models decreases BIC, Model Exp3b isreferred over Model 4 by AIC although there is no real increasen the r2. With this warning, we briefly report preliminary resultso aid future research. In each model, the significant interactionsre all in the expected negative direction: an improvement inompetitor touchpoints (whether frequency or positivity) resultsn a lower impact from focal brand touchpoints. In the preferred
odel Exp3b, competitor positivity reduces the impact of focalrand frequency for four touchpoints: brand advertising, peerbservation, in-store communications, and retailer advertising.his is consistent with Danaher et al. (2008) who found thathen competitors and focal brands advertise concurrently the
lasticity of the focal brand’s advertising reduces. Our resultshow that this could also extend into retailer advertising andnto positivity.
Conclusion
In this study, we tracked the impact of contemporaneouslyeported touchpoints on brand consideration across four con-umer goods categories. We examined the impact on brandonsideration change of six touchpoints. In our main, pooledodel 4 (Table 5), we found that touchpoint positivity signifi-
antly impacts consideration change for all six touchpoints, andouchpoint frequency does so for all but WOM and traditionalarned media. We further rank the touchpoints by the touchpointositivity coefficients (Table 7) and find that in-store communi-ations are most influential, followed by peer observation andrand advertising, then WOM and retailer advertising. Finally,raditional earned media are the least influential. The impactf competitor touchpoints on a focal brand was also examinedTable 5). Again, in-store communications are most influen-ial (via both frequency and positivity), and as with the focalrand, peer observation has a significant effect, its positivityeing significantly more influential than that of WOM.
We hence make three contributions. First, the study is to ournowledge one of the first, if not the first, on the relative impactf brand, retailer, peer and earned touchpoints on the customer’srand relationship. Notably, peer observation, predominantly theocus until now of qualitative research (Grove and Fisk 1997),s both frequent and influential, suggesting that this touchpointequires far more attention from both scholars and practition-rs. A recent line of research (Nitzan and Libai 2011; Risselada,erhoef, and Bijmolt 2014) shows the importance of social con-ections on consumer behavior. Our research sheds light on theechanisms underpinning these social effects by empirically
istinguishing WOM (recommendation or criticism) from sim-ly observing peers. Earned media are somewhat less influentialut are nonetheless significant. While the role of retailer advertis-ng is somewhat category contingent, in-store communicationsre consistently impactful.
Our second contribution is to propose and demonstrate thathe assessment of touchpoint impact needs to take into account
ouchpoint positivity and not just frequency. We find that pos-tivity adds explanatory power as compared with frequencylone when predicting brand consideration. This generalizesndings from long-standing experimental advertising researchtowh
ailing 91 (2, 2015) 235–253 249
MacKenzie, Lutz, and Belch 1986) to a multi-touchpoint con-ext. Positivity by definition is a real-time affective responsehich can only be recalled imperfectly and with significantnown biases (Aaker, Drolet, and Griffen 2008; Cowley 2008).his makes the survey problematic for such research, whileehavioral measures mostly fail to capture positivity entirely.e have illustrated one method for addressing this, through
he RET texting approach; alternative methods may be possi-le. Real-time reporting takes the logic of mall intercepts (andariants such as exit surveys as customers leave a website) andeneralizes it to the challenge that decision journeys play out ineal time across diverse touchpoints.
This brings us to our third contribution, which is to proposend exemplify an RET-based approach by which the impactf multiple touchpoints can be assessed. This approach treatsymmetrically touchpoints with the brand owner, the retailer,eers and the media. We hence respond to calls for researchhich acknowledges that the consumer decision journey extendseyond firm-owned media and channel contacts (Ailawadi et al.009; Court et al. 2009). Customers integrate learning from mul-iple sources in order to achieve their objectives (Neslin et al.014). In our study, touchpoints significantly associated withrand consideration included those from four stakeholders: therand owner, retailers, peers, and the public media. Yet therere other stakeholders who the customer may touch, and whoseouchpoints could be included within further applications ofhis approach, such as sponsors (Court et al. 2009) and serviceersonnel (Grove and Fisk 1997).
ractitioner Implications
As classic market research is increasingly complementedy database analytics, managers are hardly short of customerata. But these data are fragmented, hiding key insights on theustomer’s holistic relationship with the brand. They are also fre-uently incomplete, as empowered customers take less notice ofompany-driven communication, choosing instead to learn fromhe experience of other customers and doing their own researchnline. Marketers need to know which parts of the customerourney have most impact on attitudes and behaviors, and whichf these crucial encounters are not working well. Methods suchs real-time experience tracking may prove a useful addition tohe methodological armory to complement both ethnographicpproaches on the one hand and, on the other, focused quanti-ative work within subsets of the touchpoint mix. Whether orot data collection follows the SMS-based approach we haveescribed, we tentatively suggest three guidelines to practition-rs for providing holistic customer insight.
First, we suggest widening the scope of insight to all directnd indirect touchpoints, as an input into the overall marketinglan. For instance, should a company invest in advertising orn improving call center standards, in product design improve-
ent or online advice, in supporting customer communication
hrough channel partners or in social media? While a company’sverall positioning and competencies will inform such decisions,e suggest that holistic insight across multiple touchpoints canelp.
2 of Ret
rdiawmotf
kbtklc
L
sneottroawcpfiaotpst
evaMhsittpetSthC
rai
Wsrpmetpelestcubw
boG2Htafiatttaiabriwf
aiir2Asta
50 S. Baxendale et al. / Journal
Second, we suggest tracking the customer’s perceptualesponse to touchpoints contemporaneously. Even if objectiveata were available on all touchpoints, it would not include thismportant information. To get closer to customers, one might ide-lly walk along with them, asking how they feel at the momenthen they encounter the brand. Asking this at the end of theonth in a tracker survey may be too late to capture the problem
r opportunity. As mobile handsets tend to travel with the cus-omer, they seem a natural place to start in seeking this real-timeeedback.
Third, we suggest assessing the impact of encounters oney outcomes. These may be attitudinal, as in this study, orehavioral, as we discuss further below. A bank might wisho know, for example, whether it should invest further in mar-eting communications, or whether improvement in serviceevels would have a higher impact on consideration and pur-hase.
imitations and Research Directions
While we have employed some robustness checks, futuretudies might usefully further explore the strengths and weak-esses of real-time experience tracking in focused researchfforts, analogous to the methodological studies of survey meth-ds (Chandon, Morwitz, and Reinartz 2006). First, for someouchpoint types, self-reports could be checked against objec-ive sources such as CRM data. Second, a comparison againstetrospective surveys might allocate respondents randomly tone method. We might expect real-time reporting to be fullernd more accurate – given Wind and Lerner’s (1979) findingshen comparing surveys with purchase diaries, of which RET
an be thought of as a variant – as well as more differentiating inerceptual response. These conjectures could be tested using aeld experiment. Such pairwise comparisons of methods mightlso examine the relative explanatory power of different meth-ds on an attitudinal or behavioral outcome, to test the extento which real-time experience tracking captures encounters thatrove to be significant. Third, touchpoints mentioned in post-tudy interviews could be compared against data from real-timeracking.
Such methodological studies would amongst other thingsnable the estimation of mere measurement effects. As with sur-ey methods, the act of asking respondents to respond is itselfn intervention which may influence brand attitudes (Chandon,orwitz, and Reinartz 2006). Unlike some company surveys,
owever, our respondents were not aware of any particular brandponsoring the study. We conjecture, therefore, that study partic-pants may be to some extent hot-housed, paying more attentiono the whole category than they might otherwise, and perhapshereby exhibiting greater shifts in brand attitudes than non-articipants. Any such effect might be expected, though, to bequal across brands. An experimental design in which a con-rol group fills in only pre-study and post-study surveys without
MS messaging in-between could perhaps check this conjec-ure. Hot-housing might also cause respondents to notice andence report greater touchpoint frequencies than a control group.onversely, the agency problem may lead to respondents not
epr2
ailing 91 (2, 2015) 235–253
eporting all touchpoints due to laziness. Again, experimentsre needed to check any downward or upward bias in report-ng.
Another research opportunity concerns the tracking period.e found that even with around 1700–5600 respondents, the
heer breadth of touchpoint types led to some touchpoints beingelatively sparsely represented for some brands within the studyeriod of one week. While a greater number of respondentsight help, a powerful option would be longitudinal studies cov-
ring a longer tracking period of perhaps one month. In additiono raising the statistical power for relatively infrequent touch-oints, this might also increase the statistical power for furtherxploration of interactions (Naik and Peters 2009). Furthermore,ongitudinal data structured in panel data format could allow thexamination of the time-variant dynamic effects of touchpoints,uch as the recency, frequency and sequential order of encoun-ers. Such longitudinal data might also be the key to bringingustomer initiated touchpoints into the analysis, such as productse, product purchase, or visiting a brand website. These mighte modeled as resulting from the impact of prior encounters asell as pre-study attitudes.A further limitation and research direction concerns the possi-
ility of touchpoint endogeneity. In common with most researchn the impact of touchpoints from advertising to WOM (Archak,hose, and Ipeirotis 2011; Bass et al. 2007; Goh, Hui, and Png011; Liu 2006), we have treated touchpoints as independent.owever, this simplification may bias coefficients. For example,
hose individuals who are more likely to increase their consider-tion for a brand may also be more likely to notice touchpointsor that brand or perceive them as positive. Therefore their shiftn consideration is not wholly due to their experience but also
result of some unobserved engagement with the brand. Orhere may be psychographic or lifestyle variables that impactouchpoint frequency or positivity. Hence there may be omit-ed variable bias affecting coefficient estimates. Related, firmctions are tacit within our model: while our analysis is primar-ly brand neutral, brand strategies may target a segment whore naturally more likely to increase their consideration for therand, in which case a participant’s segment membership is cor-elated with both their frequency of exposure and their changen consideration. By omitting any relevant segment variablese may be introducing bias into the estimate of frequency, as
requency is correlated with an omitted variable.We do not have available suitable instrumental variables to
dequately identify whether and to what extent this endogene-ty issue exists, and we prefer not to use weak or ill-definednstrumental variables as they are likely to introduce further biasather than remove it (Larcker and Rusticus 2010; Wooldridge009). This issue deserves focused attention in future research.gain, one-month datasets may help, where psychographic and
ocio-demographic variables with potential conceptual links toouchpoints would need to be included. While we have reportedn exploratory analysis of the interaction between prior consid-
ration and touchpoint impact, conceptually the best measure ofrior brand relationship in predicting touchpoints might be theecently clarified construct of brand engagement (Brodie et al.011). Another potential predictor of touchpoints might be the
of Ret
rtr
gtiipm
C
ptmbt
tisarh
vaPsE
M
RM
MMMMMM
MM
M
M
EMM
M
M
M
M
M
M
M
S. Baxendale et al. / Journal
espondent’s involvement in the study, as this may impact onhe level of the potential biases we have discussed in touchpointecording.
A final limitation concerns unobserved customer hetero-eneity. The gap between marginal r2 and conditional r2 forhe preferred models suggests that around 8–14% of variabil-ty in consideration change could be explained by unobserved,ndividual level data. Again, careful consideration of relevantsychographic, socio-demographic or brand health variablesay shed further light and be managerially useful.
oncluding Remarks
There was perhaps a time when customers learned aboutroducts and services through what the brand owner told them. Ifhis time ever existed, it is certainly not the case now, as our data
ake plain. A focus purely on optimizing the spend within therand-owner’s control would be myopic. Instead, we suggest lis-ening to customers in real time to understand how they construe
(
odel AIC BIC
obustness checksodel Freq1: Frequency – Dichotomous IncidenceVariable
231,091 231,713
odel Freq2: Frequency – Linear Frequency 231,010 231,633
odel Freq3: Frequency – Quadratic Decay 231,150 231,921
odel Freq4: Frequency – Natural Log (ln) decay 230,905a 231,527a
odel Pos1: Positivity – Arithmetic Mean 230,905a 231,527a
odel Pos2: Positivity – Mean and Variance 230,926 231,697
odel Pos3: Positivity – Frequency of positive,negative, and neutral experiences
231,958 232,729
odel Pos4: Positivity – Last experience positivity 233,445 234,067
odel Pos5: Positivity – Mean and last experiencepositivity
230,988 231,758
odel Imp1: Positivity imputation – usingzero-coding
230,905a 231,527a
odel Imp2: Positivity imputation – using mean 231,022 231,644
xploratory modelsodel 4: Preferred model for pooled data 230,905 231,527
odel Exp1a: Focal brand frequency and positivityinteraction
230,916 231,613
odel Exp1b: Focal brand and competitorfrequency and positivity interaction
230,936 231,707
odel Exp2a: Focal initial consideration interactionwith focal brand touchpoints
230,321 231,092
odel Exp2b: Focal initial consideration interactionwith focal and competitor touchpoints
230,119a 231,038a
odel Exp3a: Competitor frequency interactionwith focal brand frequency
230,969 231,665
odel Exp3b: Competitor positivity interactionwith focal brand frequency
230,865a 231,561
odel Exp3c: Competitor frequency interactionwith focal brand positivity
230,974 231,670
odel Exp3d: Competitor positivity interactionwith focal brand positivity
230,925 231,622
a Preferred model.
ailing 91 (2, 2015) 235–253 251
heir customer journey. The range of touchpoints they encountern this journey is undoubtedly broad but perhaps not intractablyo. Managers take decisions every day based on their workingssumptions about their relative importance and efficacy. Theesearch challenge is to support these holistic decisions witholistic insight.
Acknowledgements
The authors gratefully acknowledge the financial support pro-ided by the Technology Strategy Board (UK) and the Economicnd Social Research Council (UK) via a Knowledge Transferartnership grant. The authors also gratefully acknowledge theupport and data access provided by research agency MESHxperience.
Appendix.
Fit statistics for robustness checks and exploratory modelsbased on pooled data Model 4)
r2 marginal r2 conditional Average VIF Maximum VIF
19.5% 31.7% 1.90 2.66
19.5% 31.7% 1.75 2.6419.6% 31.8% 2.10 3.1019.6% 31.8% 1.84 2.6719.6% 31.8% 1.84 2.6719.7% 31.8% 1.77 2.6718.6% 30.6% 2.17 3.45
17.2% 29.1% 1.72 2.6319.7% 31.8% 2.28 5.71
19.6% 31.8% 1.84 2.67
19.4% 31.5% 2.92 18.21
19.6% 31.8% 1.84 2.6719.7% 31.8% 4.31 19.53
19.7% 31.8% 5.19 19.91
20.2% 32.2% 6.75 21.02
20.8% 32.7% 8.98 21.19
19.7% 31.8% 1.82 2.67
19.7% 31.8% 1.85 2.67
19.7% 31.8% 1.79 2.67
19.7% 31.8% 1.85 2.67

2 of Ret
A
A
A
A
A
A
B
B
B
B
B
B
B
B
B
C
C
C
C
C
D
D
E
E
G
G
G
H
K
K
L
L
M
M
M
M
N
N
N
N
Nitzan, Irit and Barak Libai (2011), “Social Effects on Customer Retention,”
52 S. Baxendale et al. / Journal
References
aker, Jennifer, Aimee Drolet and Dale Griffen (2008), “Recalling Mixed Emo-tions,” Journal of Consumer Research, 35 (2), 268–78.
hluwalia, Rohini, Robert E. Burnkrant and H. Rao Unnava (2000),“Consumer Response to Negative Publicity: The Moderat-ing Role of Commitment,” Journal of Marketing Research, 37,203–14.
ilawadi, Kusum L., J.P. Beauchamp, Naveen Donthu, Dinesh K. Gauri andVenkatesh Shankar (2009), “Communication and Promotion Decisions inRetailing: A Review and Directions for Future Research,” Journal of Retail-ing, 85 (1), 42–55.
rchak, Nicolay, Anindya Ghose and Panagiotis G. Ipeirotis (2011), “Deriv-ing the Pricing Power of Product Features by Mining Consumer Reviews,”Management Science, 57 (8), 1485–509.
rnold, Mark and Kristy Reynolds (2009), “Affect and Retail Shopping Behav-ior: Understanding the Role of Mood Regulation and Regulatory Focus,”Journal of Retailing, 85 (3), 308–20.
taman, M. Berk, Harald J. van Heerde and Carl F. Mela (2010), “The Long-term Effect of Marketing Strategy on Brand Sales,” Journal of MarketingResearch, 47 (1), 866–82.
ass, Frank M., Norris Bruce, Sumit Majumdar and B.P.S. Murthi (2007),“Wearout Effects of Different Advertising Themes: A Dynamic BayesianModel of the Advertising-Sales Relationship,” Marketing Science, 26 (2),179–95.
aumeister, Roy F., Kathleen D. Vohs, C. Nathan DeWall and Liqing Zhang(2007), “How Emotion Shapes Behavior: Feedback, Anticipation, andReflection, Rather Than Direct Causation,” Personality and Social Psychol-ogy Review, 11, 167–203.
earden, William O. and Michael J. Etzel (1982), “Reference Group Influenceon Product and Brand Purchase Decisions,” Journal of Consumer Research,9 (2), 183–94.
ian, Xuemei and Luiz Moutinho (2009), “An Investigation of Determinants ofCounterfeit Purchase Consideration,” Journal of Business Research, 62 (3),368–78.
orghini, Stefania, Nina Diamond, Robert V. Kozinets, Mary Ann McGrath,Albert M. Muniz Jr. and John F. Sherry Jr. (2009), “Why Are Themed Brand-stores So Powerful? Retail Brand Ideology at American Girl Place,” Journalof Retailing, 85 (3), 363–75.
rinol, Pablo, Richard E. Petty and Zakary L. Tormala (2004), “Self-Validationof Cognitive Responses to Advertisements,” Journal of Consumer Research,30 (4), 559–72.
rodie, Roderick J., Linda D. Hollebeek, Biljana Juric and Ana Ilic (2011),“Customer Engagement: Conceptual Domain, Fundamental Propositions,and Implications for Research,” Journal of Service Research, 14 (3),252–71.
ülbül, Cenk and Geeta Menon (2010), “The Power of Emotional Appealsin Advertising: The Influence of Concrete Versus Abstract Affect onTime-Dependent Decisions,” Journal of Advertising Research, 50 (2),169–80.
urnham, Kenneth P. and David R. Anderson (2004), “Multimodel Inference:Understanding AIC and BIC in Model Selection,” Sociological MethodsResearch, 33 (2), 261–304.
handon, Pierre, Vicki G. Morwitz and Werner Reinartz (2006), “Do Inten-tions Really Predict Behavior? Self-Generated Validity Effects in SurveyResearch,” Journal of Marketing, 69 (2), 1–14.
hitturi, Favindra, Rajagopal Raghunathan and Vijay Mahajan (2008), “Delightby Design: The Role of Hedonic Versus Utilitarian Benefits,” Journal ofMarketing, 72 (May), 48–63.
obb, Cathy J. and Wayne D. Hoyer (1986), “Planned Versus Impulse PurchaseBehavior,” Journal of Retailing, 62 (4), 384–409.
ourt, David, Dave Elzinga, Susan Mulder and Ole J. Vetvik (2009), “TheConsumer Decision Journey,” McKinsey Quarterly, 3, 96–107.
owley, Elizabeth (2008), “Looking Back at an Experience Through Rose-Colored Glasses,” Journal of Business Research, 61, 1046–52.
anaher, Peter J., André Bonfrer and Sanjay Dhar (2008), “The Effect of Com-petitive Advertising Interference on Sales for Packages Goods,” Journal ofMarketing Research, 45 (April), 211–25.
N
ailing 91 (2, 2015) 235–253
esai, Kalpesh K. and Sekar Raju (2007), “Adverse Influence of BrandCommitment on Consideration of and Preference for Competing Brands,”Psychology & Marketing, 24 (7), 595–614.
ast, Robert, Kathy Hammond and Wendy Lomax (2008), “Measuringthe Impact of Positive and Negative Word of Mouth on Brand Pur-chase Probability,” International Journal of Research in Marketing, 25,215–24.
rdem, Tülin and Michael P. Keane (1996), “Decision-Making Under Uncer-tainty: Capturing Dynamic Brand Choice Processes in Turbulent ConsumerGoods Markets,” Marketing Science, 15 (1), 1–20.
oh, Khim-Yong, Kai-Lung Hui and Ivan Png (2011), “Newspaper Reports andConsumer Choice: Evidence from the Do Not Call Registry,” ManagementScience, 57 (9), 1640–54.
oodman, Joseph K., Susan M. Broniarczyk, Jill G. Griffin and Leigh McAlister(2013), “Help or Hinder? When Recommendation Signage Expands Con-sideration Sets and Heightens Decision Difficulty,” Journal of ConsumerPsychology, 23 (2), 165–74.
rove, Stephen J. and Raymond P. Fisk (1997), “The Impact of Other Cus-tomers on Service Experiences: A Critical Incident Examination of “GettingAlong”,” Journal of Retailing, 73, 63–85.
avlena, William, Robert Cardarelli and Michelle De Montigny (2007), “Quan-tifying the Isolated and Synergistic Effects of Exposure Frequency for TV,Print, and Internet Advertising,” Journal of Advertising Research, 45 (2),255–68.
ahn, Barbara E. and Alice M. Isen (1993), “The Influence of Positive Affecton Variety Seeking among Safe, Enjoyable Products,” Journal of ConsumerResearch, 20, 257–70.
ahneman, Daniel and Alan B. Krueger (2006), “Developments in the Mea-surement of Subjective Well-Being,” Journal of Economic Perspectives, 20(1), 3–24.
arcker, David F. and Tjomme O. Rusticus (2010), “On the Use of InstrumentalVariables in Accounting Research,” Journal of Accounting and Economics,49, 186–205.
iu, Yong (2006), “Word of Mouth for Movies: Its Dynamics and Impact onBox Office Revenue,” Journal of Marketing, 70 (July), 74–89.
acdonald, Emma K., Hugh N. Wilson and Umut Konus (2012), “BetterCustomer Insight – In Real Time,” Harvard Business Review, 90 (9),102–8.
acKenzie, Scott B., Richard J. Lutz and Beorge E. Belch (1986), “The Roleof Attitude Toward the Ad as a Mediator of Advertising Effectiveness:A Test of Competing Explanations,” Journal of Marketing Research, 23,130–43.
cAlexander, James H., John W. Schouten and Harold F. Koenig (2002),“Building Brand Community,” Journal of Marketing, 66 (January),38–54.
cFarland, Cathy and Roger Buehler (1998), “The Impact of NegativeAffect on Autobiographical Memory: The Role of Self-Focused Atten-tion to Moods,” Journal of Personality and Social Psychology, 75 (6),1424–40.
akagawa, Shinichi and Holger Schielzeth (2013), “A General and SimpleMethod for Obtaining R2 From Generalized Linear Mixed-Effects Models,”Methods in Ecology and Evolution, 4 (2), 133–42.
aik, Prasad A. and Kay Peters (2009), “A Hierarchical Marketing Communica-tions Model of Online and Offline Media Synergies,” Journal of InteractiveMarketing, 23, 288–99.
eslin, Scott A., Dhruv Grewal, Robert Leghorn, Venkatesh Shankar, Marije L.Teerling, Jacquelyn S. Thomas and Peter C. Verhoef (2006), “Challenges andOpportunities in Multichannel Customer Management,” Journal of ServiceResearch, 9 (2), 95–112.
eslin, Scott A., Kinshuk Jerath, Bodapati Anand, Eric T. Bradlow, JohnDeighton, Sonja Gensler, Leonard Lee, Elisa Montaguti, Rahul Telang, RajVenkatesan, Peter C. Verhoef and Z. John Zhang (2014), “The Interrela-tionships Between Brand and Channel Choice,” Marketing Letters, 25 (3),319–30.
Journal of Marketing, 75 (November), 24–38.gobo, Paul V. (2011), “What Drives Household Choice of Organic Products in
Grocery Stores?,” Journal of Retailing, 87 (1), 90–100.

of Ret
O
O
P
P
R
R
S
S
S
T
T
T
v
V
V
V
W
W
W
W
Yment Issues in On-line Environments,” Journal of Advertising, 37 (2), 31–44.
S. Baxendale et al. / Journal
’Brien, Robert M. (2007), “A Caution Regarding Rules of Thumb for VarianceInflation Factors,” Quality and Quantity, 41 (5), 673–90.
’Cass, Aron (2002), “Political Advertising Believability and Informa-tion Source Value During Elections,” Journal of Advertising, 31 (1),63–74.
eck, Joanne and Jennifer Wiggins (2006), “It Just Feels Good: Customers’Affective Response to Touch and its Influence on Persuasion,” Journal ofMarketing, 70 (4), 56–69.
riester, Joseph, Dhananjay Nayakankuppam, Monique A. Fleming and JohnGodek (2004), “The A2SC2 Model: The Influence of Attitudes and AttitudeStrength on Consideration and Choice,” Journal of Consumer Research, 30(4), 574–85.
isselada, Hans, Peter C. Verhoef and Tammo H.A. Bijmolt (2014), “DynamicEffects of Social Influence and Direct Marketing on the Adoption of High-Technology Products,” Journal of Marketing, 78 (March), 52–68.
oberts, John H. and James M. Lattin (1997), “Consideration: Review ofResearch and Prospects for Future Insights,” Journal of Marketing Research,34, 406–10.
tammerjohan, Claire, Charles M. Wood, Yuhmiin Change and Esther Thorson(2005), “An Empirical Investigation of the Interaction Between Publicity,Advertising, and Previous Brand Attitudes and Knowledge,” Journal ofAdvertising, 34 (4), 55–67.
tephen, Andrew T. and Jeff Galak (2012), “The Effects of Traditional and SocialEarned Media on Sales: A Study of a Microlending Marketplace,” Journalof Marketing Research, 49 (5), 624–39.
weeney, Jillian C. and Geoffrey N. Soutar (2001), “Consumer Perceived Value:The Development of a Multiple Item Scale,” Journal of Retailing, 77 (2),203–20.
hakor, Mrugank V., Rajneesh Suri and Katayoun Saleh (2008), “Effects ofService Setting and Other Consumers’ Age on the Service Perceptions of
Young Consumers,” Journal of Retailing, 84 (2), 137–49.homas, Jacquelyn S. and Ursula Y. Sullivan (2005), “Managing MarketingCommunications with Multichannel Customers,” Journal of Marketing, 69(4), 239–51.
Z
ailing 91 (2, 2015) 235–253 253
rusov, Michael, Randolph Bucklin and Koen Pauwels (2009), “Effects of Word-of-Mouth Versus Traditional Marketing: Findings from an Internet SocialNetworking Site,” Journal of Marketing, 73 (September),90–102.
an der Lans, Ralf, Gerrit Van Bruggen, Jehoshua Eliashberg and BerendWierenga (2010), “A Viral Branching Model for Predicting the Spread ofElectronic Word of Mouth,” Marketing Science, 29 (2), 348–65.
an Nierop, Erjen, Bart Bronnenberg, Richard Paap, Michel Wedel and PhilipHans Franses (2010), “Retrieving Unobserved Consideration Sets FromHousehold Panel Data,” Journal of Marketing Research, 47 (1), 63–74.
erhoef, Peter C., Scott A. Neslin and Bjorn Vroomen (2007), “Multi-channel Customer Management: Understanding the Research ShopperPhenomenon,” International Journal of Research in Marketing, 24 (2),129–48.
erhoef, Peter C., Katherine N. Lemon, A. Parasuraman, Anne Roggeveen,Michael Tsiros and Leonard A. Schlesinger (2009), “Customer ExperienceCreation: Determinants, Dynamics and Management Strategies,” Journal ofRetailing, 85 (1), 31–41.
estbrook, Robert A. and Richard L. Oliver (1991), “The Dimensionality ofConsumption Emotion Patterns and Consumer Satisfaction,” Journal ofConsumer Research, 18, 84–91.
iesel, Thorsten, Koen Pauwels and Joep Arts (2010), “Marketing’s ProfitImpact: Quantifying Online and Off-line Funnel Progression,” MarketingScience, 30 (4), 604–11.
ind, Yoram and David Lerner (1979), “On the Measurement of PurchaseData: Surveys Versus Purchase Diaries,” Journal of Marketing Research,16 (February), 39–47.
ooldridge, Jeffrey M. (2009), Introductory Econometrics: A ModernApproach, 4th ed. Boston: South Western College.
averoglu, Idil and Naveen Donthu (2008), “Advertising Repetition and Place-
hang, Jie (2006), “An Integrated Choice Model Incorporating AlternativeMechanisms for Consumers’ Reactions to In-Store Display and FeatureAdvertising,” Marketing Science, 25 (3), 278–90.