Criminal Justice Today Chapter 16 Drugs and Crime Criminal Justice.
The Impact of COVID-19 on Nevada's Criminal Justice System
Project Introduction to Nevada Sentencing Commission
May 21, 2021
2
Agenda
• Introductions • Project Overview
• Data Analysis • System Assessment
• National Landscape & Examples • What We Know So Far • Next Steps • Questions
3
About CJI
• The Crime and Justice Institute (CJI) works with local, state, and national criminal justice organizations to assist them in developing data and public-safety-driven solutions to tough criminal justice policy problems
• CJI provides nonpartisan policy analysis, research, technical assistance, program evaluation, and training to jurisdictions throughout the country
4
CJI’s Other Work in Nevada
• Support Staff for the ACAJ (2018-2019): • Assisted Nevada’s Advisory Commission on the
Administration of Justice (ACAJ) as it developed policy recommendations that led to Assembly Bill 236, which went into effect in mid-2020
• Implementation Support for AB 236 (2019-present) • Staffs an implementation team that works closely
with in-state agencies to support changes required by AB 236

Project Overview
6
Leadership Charge
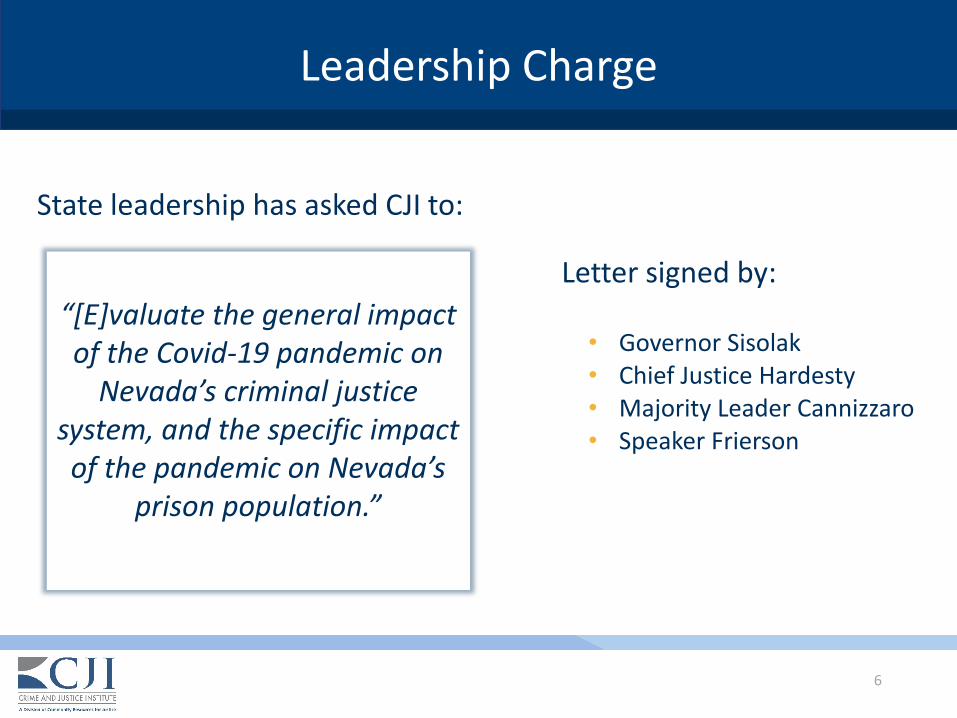
State leadership has asked CJI to:
“[E]valuate the general impact of the Covid-19 pandemic on
Nevada’s criminal justice system, and the specific impact of the pandemic on Nevada’s
prison population.”
Letter signed by:
• Governor Sisolak • Chief Justice Hardesty • Majority Leader Cannizzaro • Speaker Frierson
7
Project Goals
1. To better understand the impact of COVID-19 on the state’s prison population through data analysis and system assessment.
2. To identify gaps and opportunities for post-pandemic policies and practices.
3. To revise prison population projections where necessary.
8
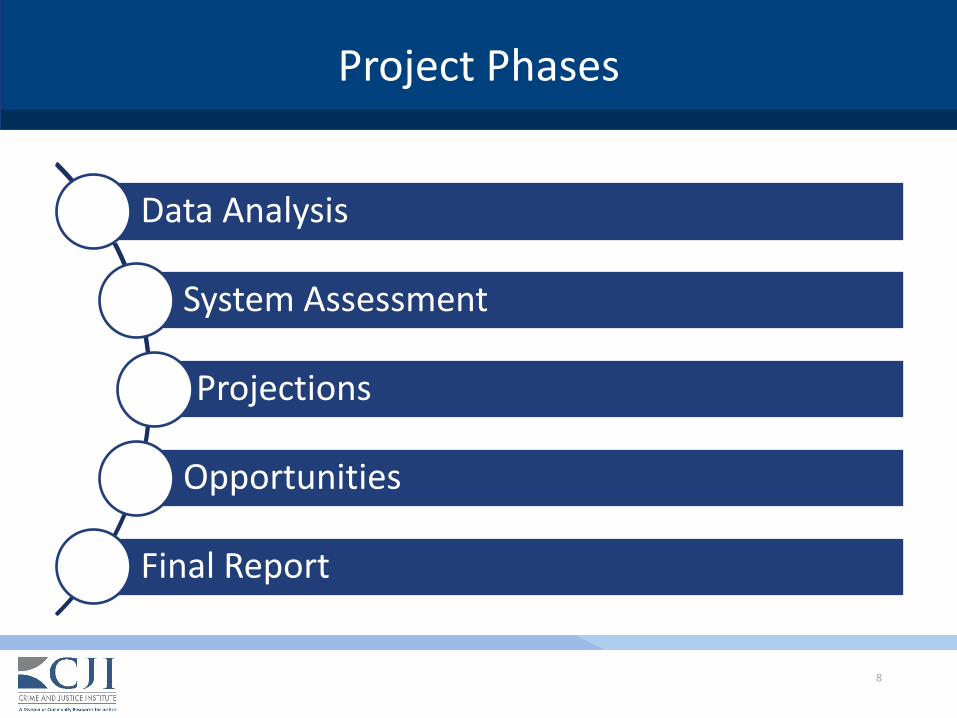
Project Phases
Data Analysis
System Assessment
Projections
Opportunities
Final Report
Data Analysis
10
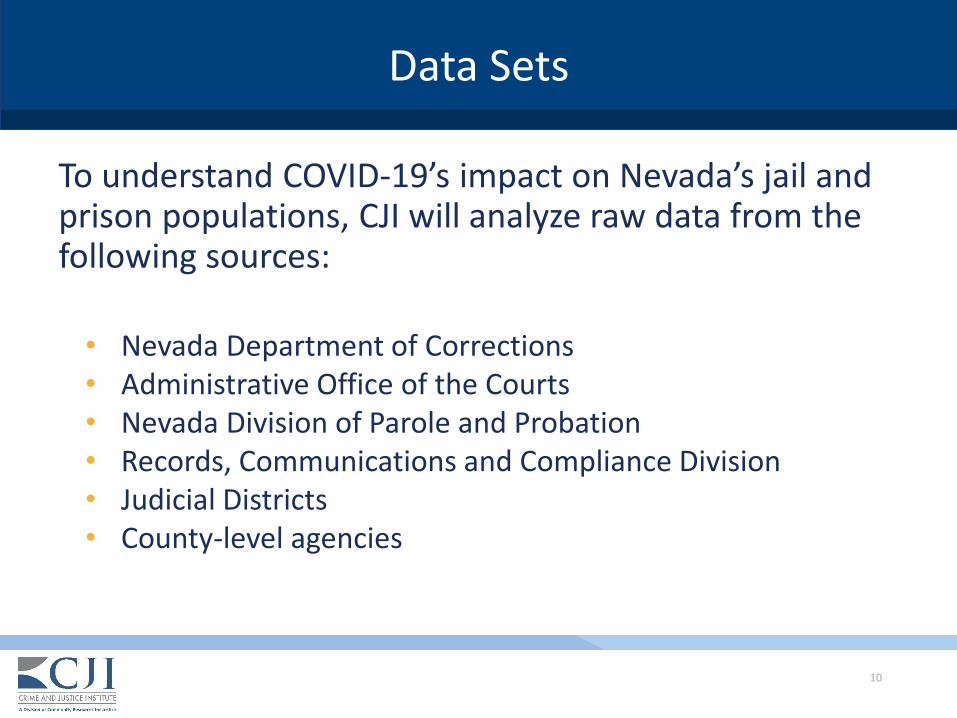
Data Sets
To understand COVID-19’s impact on Nevada’s jail and prison populations, CJI will analyze raw data from the following sources:
• Nevada Department of Corrections • Administrative Office of the Courts • Nevada Division of Parole and Probation • Records, Communications and Compliance Division • Judicial Districts • County-level agencies
11
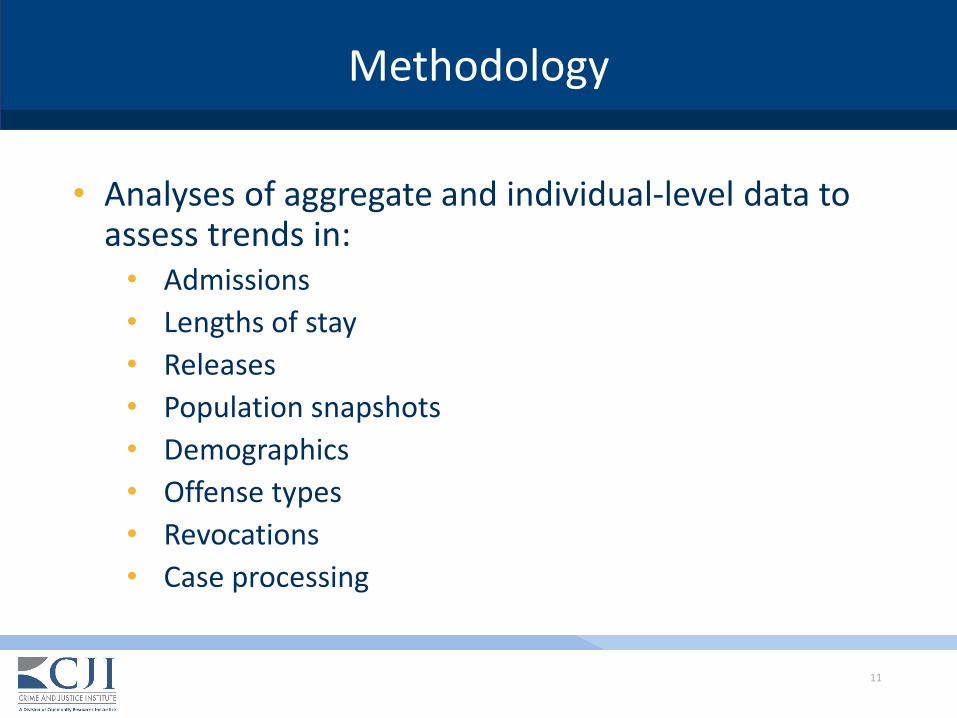
Methodology
• Analyses of aggregate and individual-level data to assess trends in:
• Admissions • Lengths of stay • Releases • Population snapshots • Demographics • Offense types • Revocations • Case processing
System Assessment
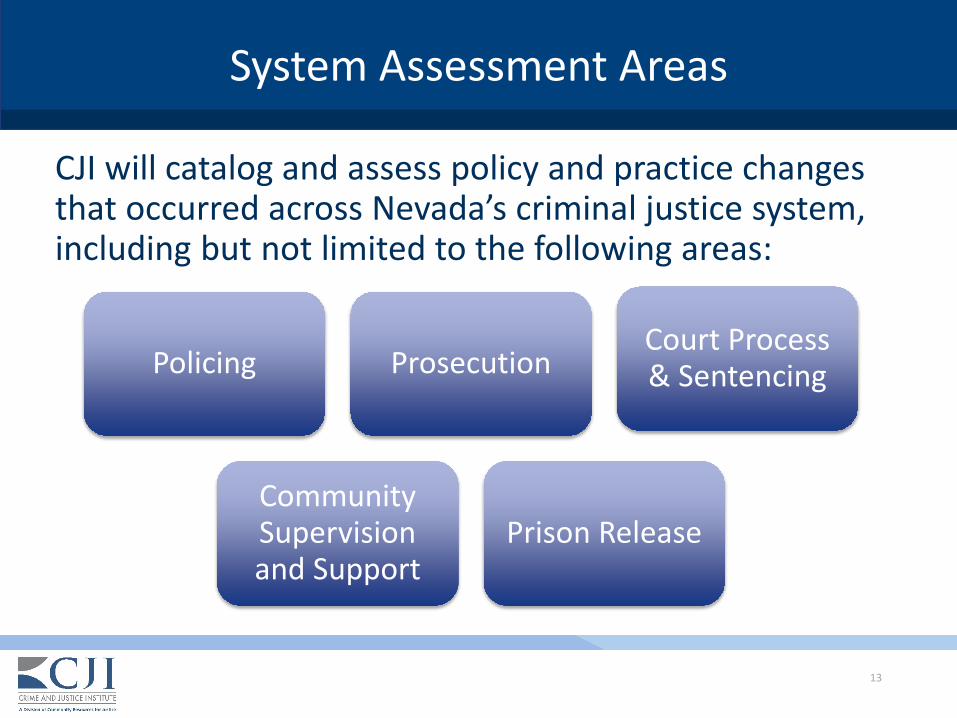
System Assessment Areas
CJI will catalog and assess policy and practice changes that occurred across Nevada’s criminal justice system, including but not limited to the following areas:
Policing Prosecution Court Process & Sentencing
Community Supervision and Support
Prison Release
13
14
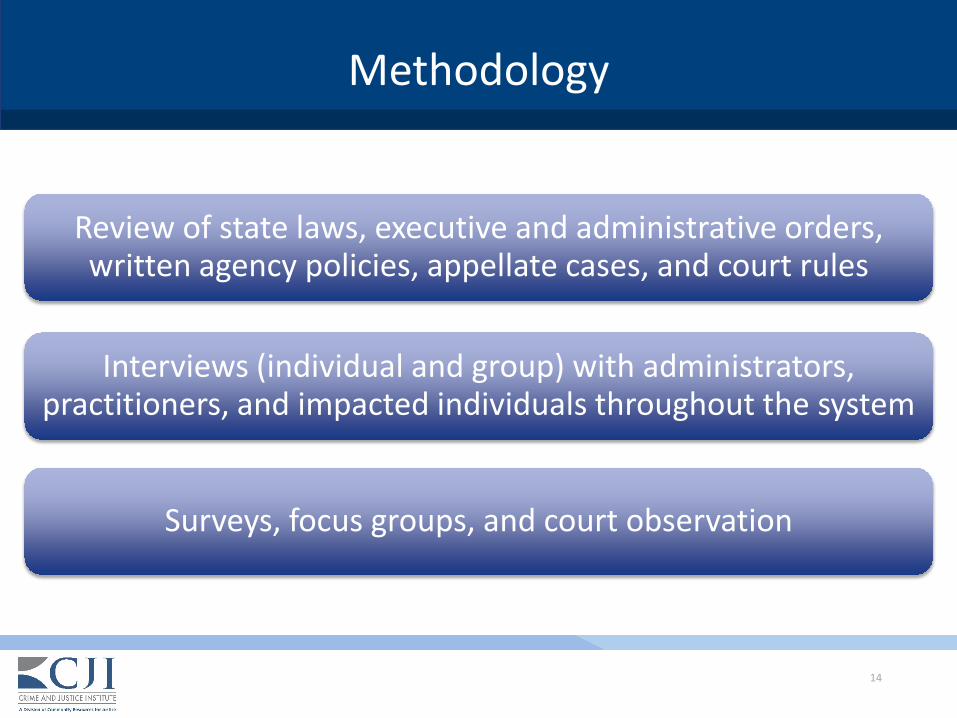
Methodology
Review of state laws, executive and administrative orders, written agency policies, appellate cases, and court rules
Interviews (individual and group) with administrators, practitioners, and impacted individuals throughout the system
Surveys, focus groups, and court observation

National Trends

16
Changes to Law Enforcement Practices
• High staff sick rates result in many departments decreasing their physical footprint
• Intentional reduction in frequency of arrests to protect the health and safety of officers
• Increased use of citations in lieu of arrests
• Limited enforcement of certain types of offenses such as traffic violations

17
Changes to Court Processes
• Courts across the country transitioned to virtual court without in-person appearances for most hearings
• Many jurisdictions enacted policies to limit pretrial detention, including presumptive release on recognizance for broad classes of offenses
• Due to closures and other safety measures, many courts delayed disposition of cases via mass continuances or limiting jury trials

18
Changes to Incarcerated Populations
• Departments released individuals who were vulnerable to COVID-19 through a variety of different mechanisms, including work release, geriatric parole, or medical release
• Some states issued commutation orders, for example authorizing early release for nonviolent offenders
• Departments moved to release individuals who were within a certain number days of their parole eligibility date
• Some states housed individuals at previously vacant facilities for quarantine, intake, and other purposes
• Departments stopped all transfers of individuals
19
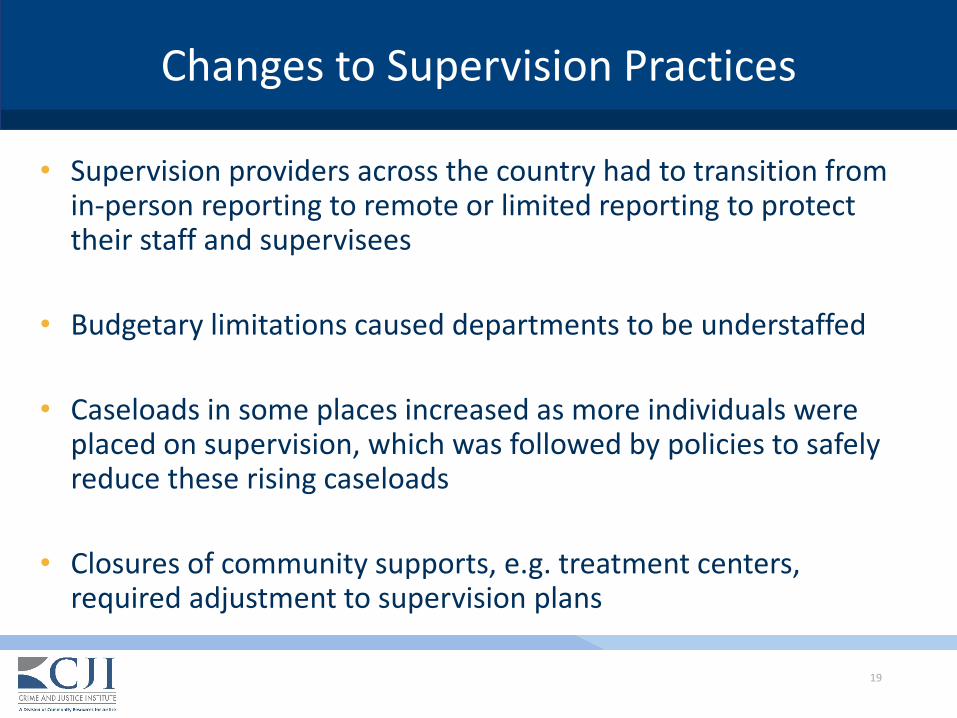
Changes to Supervision Practices
• Supervision providers across the country had to transition from in-person reporting to remote or limited reporting to protect their staff and supervisees
• Budgetary limitations caused departments to be understaffed
• Caseloads in some places increased as more individuals were placed on supervision, which was followed by policies to safely reduce these rising caseloads
• Closures of community supports, e.g. treatment centers, required adjustment to supervision plans

What We Know So Far
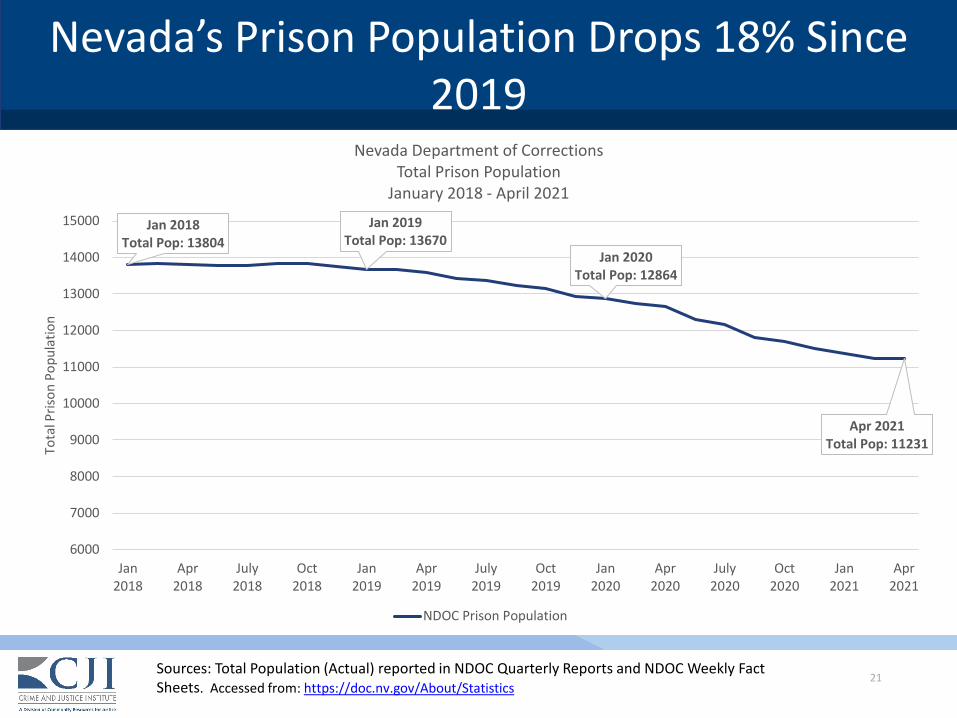
Nevada’s Prison Population Drops 18% Since 2019
Nevada Department of Corrections Total Prison Population
January 2018 - April 2021
Jan 2018 Total Pop: 13804
Jan 2019 Total Pop: 13670
Jan 2020 Total Pop: 12864
Apr 2021 Total Pop: 112319000
10000
11000
12000
13000
14000
15000
Tota
l Pris
on P
opul
atio
n
8000
7000
6000 Jan
2018 Apr
2018 July
2018 Oct
2018 Jan
2019 Apr
2019 July
2019 Oct
2019 Jan
2020 Apr
2020 July
2020 Oct
2020 Jan
2021 Apr
2021
NDOC Prison Population
Sources: Total Population (Actual) reported in NDOC Quarterly Reports and NDOC Weekly Fact Sheets. Accessed from: https://doc.nv.gov/About/Statistics
21
22
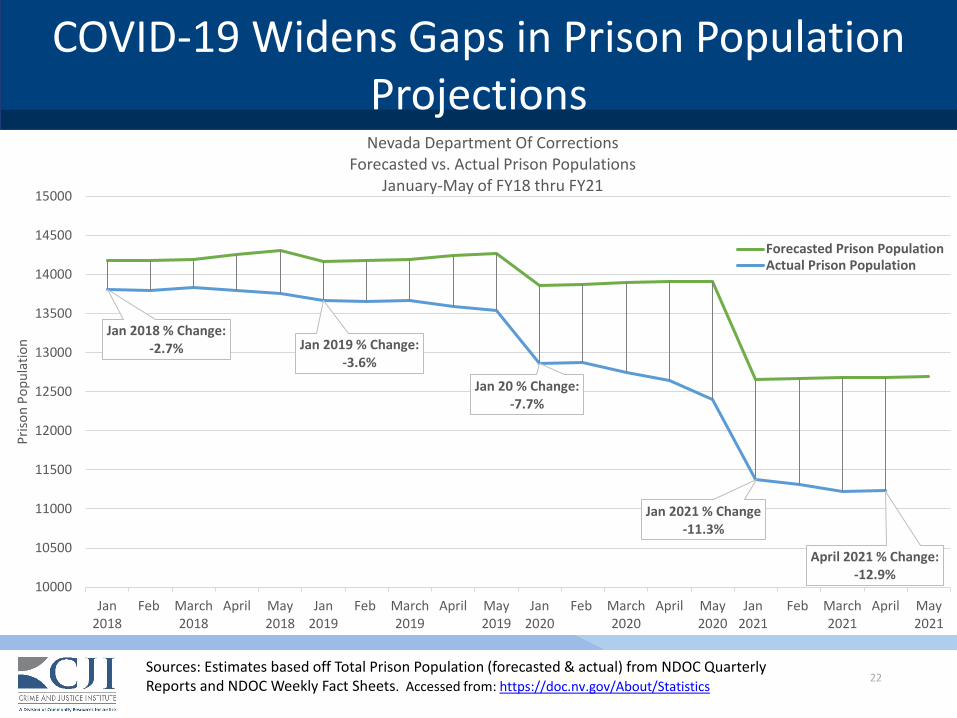
COVID-19 Widens Gaps in Prison Population Projections Nevada Department Of Corrections
Forecasted vs. Actual Prison Populations January-May of FY18 thru FY21
15000
14500
14000
13500
13000
12500
12000
11500
11000
10500
10000 Jan Feb March April May Jan Feb March April May Jan Feb March April May Jan Feb March April May
Jan 2018 % Change: -2.7% Jan 2019 % Change:
-3.6%
Jan 20 % Change: -7.7%
Jan 2021 % Change -11.3%
April 2021 % Change: -12.9%
Forecasted Prison Population Actual Prison Population
2018 2018 2018 2019 2019 2019 2020 2020 2020 2021 2021 2021
Priso
n Po
pula
tion
Sources: Estimates based off Total Prison Population (forecasted & actual) from NDOC Quarterly Reports and NDOC Weekly Fact Sheets. Accessed from: https://doc.nv.gov/About/Statistics
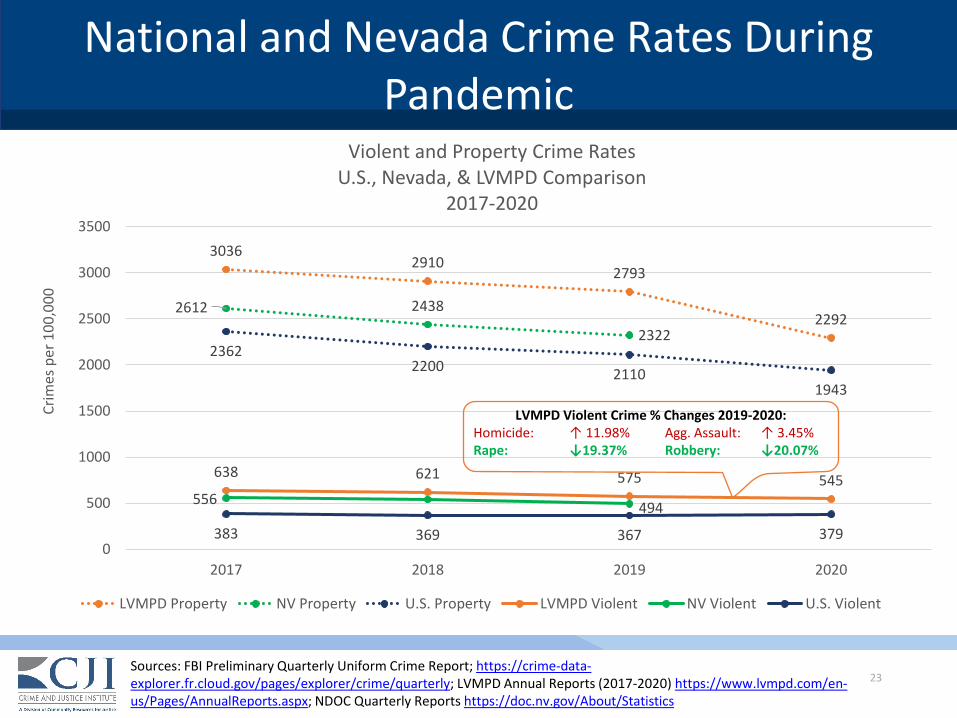
National and Nevada Crime Rates During Pandemic
Violent and Property Crime Rates U.S., Nevada, & LVMPD Comparison
2017-2020
3500 3036
2910 2793
22922612 2438
2322 2362
2200 2110 1943
638 621 575 545 556 494500
1000
1500
2000
2500
3000
Crim
es p
er 1
00,0
00
LVMPD Violent Crime % Changes 2019-2020: Homicide: ↑ 11.98% Agg. Assault: ↑ 3.45% Rape: ↓19.37% Robbery: ↓20.07%
0 383
2017
369
2018
367
2019
379
2020
LVMPD Property NV Property U.S. Property LVMPD Violent NV Violent U.S. Violent
Sources: FBI Preliminary Quarterly Uniform Crime Report; https://crime-data-explorer.fr.cloud.gov/pages/explorer/crime/quarterly; LVMPD Annual Reports (2017-2020) https://www.lvmpd.com/en-us/Pages/AnnualReports.aspx; NDOC Quarterly Reports https://doc.nv.gov/About/Statistics
23
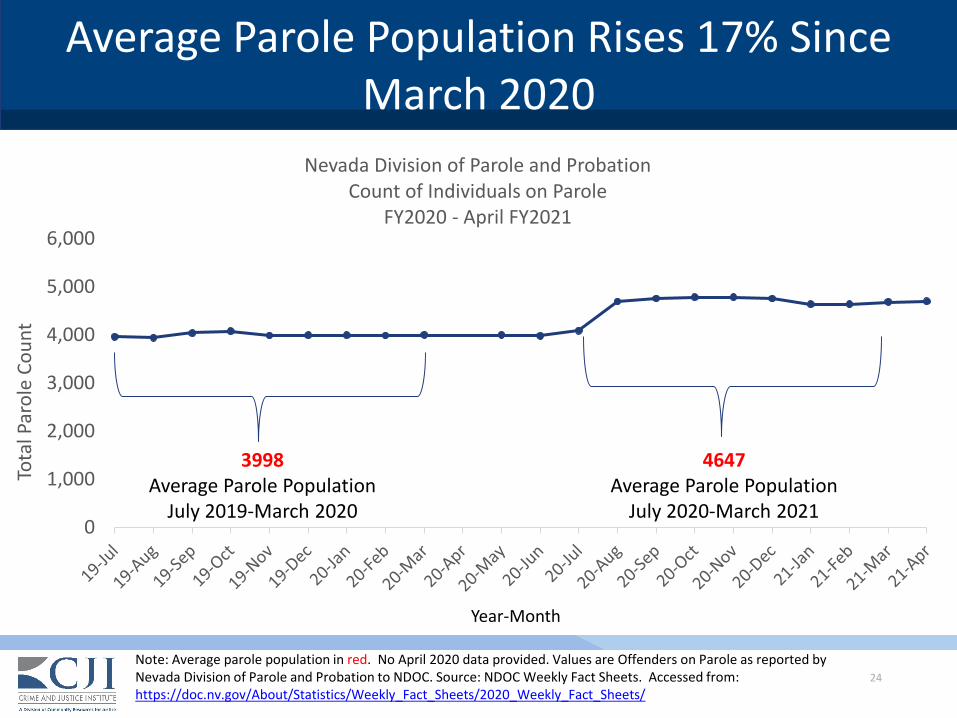
Average Parole Population Rises 17% Since March 2020
Nevada Division of Parole and Probation Count of Individuals on Parole
FY2020 - April FY2021
6,000
3998 4647 1,000 Average Parole Population Average Parole Population
July 2019-March 2020 July 2020-March 2021 0
2,000
3,000
4,000
5,000
Tota
l Par
ole
Coun
t
Year-Month
Note: Average parole population in red. No April 2020 data provided. Values are Offenders on Parole as reported by Nevada Division of Parole and Probation to NDOC. Source: NDOC Weekly Fact Sheets. Accessed from: https://doc.nv.gov/About/Statistics/Weekly_Fact_Sheets/2020_Weekly_Fact_Sheets/
24

Next Steps
26
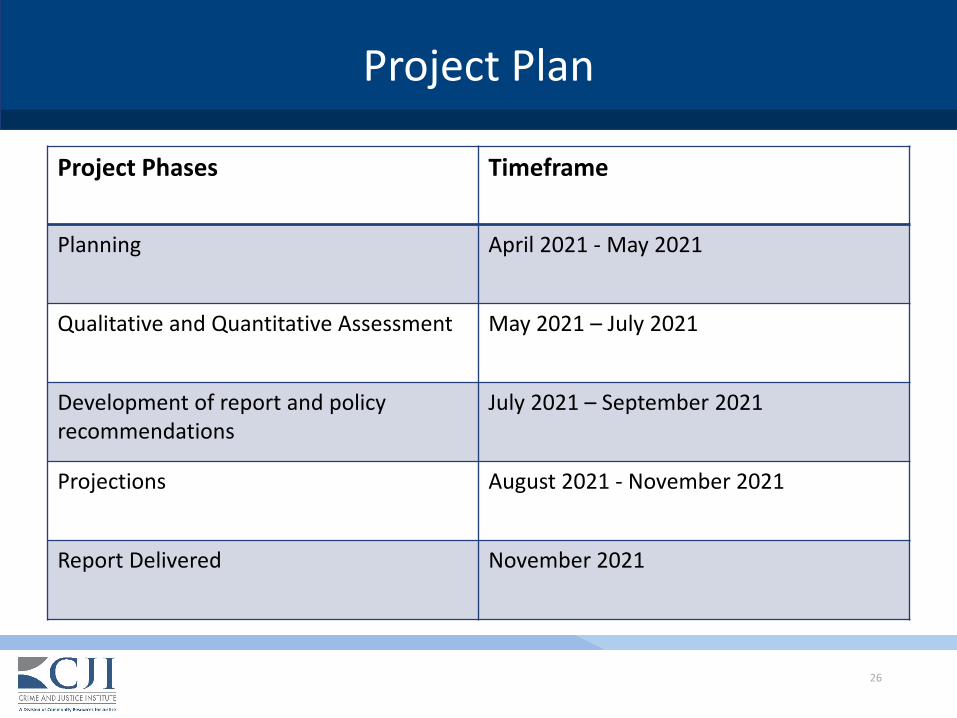
Project Plan
Project Phases Timeframe
Planning April 2021 - May 2021
Qualitative and Quantitative Assessment May 2021 – July 2021
Development of report and policy recommendations
July 2021 – September 2021
Projections August 2021 - November 2021
Report Delivered November 2021

27
Next Steps
• CJI will be reaching out to many of you as part of the data analysis and system assessment
• The success of this project will depend on the participation, perspective, data, and referrals of as many practitioners and experts as possible
• The final report, including both the data analysis and system assessment, will be published in November

28
CJI Contacts
Quentin Weld [email protected] (617) 485-4956
Adrian Rocha [email protected]
Dr. Molly Buchanan [email protected]
Vibha Honasoge [email protected]
29
Disclaimer
This project was supported by Grant No. 2019-ZB-BX-K003 awarded by the Bureau of Justice Assistance. The Bureau of
Justice Assistance is a component of the Department of Justice’s Office of Justice Programs, which also includes the Bureau of
Justice Statistics, the National Institute of Justice, the Office of Juvenile Justice and Delinquency Prevention, the Office for Victims of Crime, and the SMART Office. Points of view or
opinions in this presentation are those of the author and do not necessarily represent the official position or policies of the U.S.
Department of Justice.