The Impact of CEO Compensation on Nonprofit Donations
23
1 The Impact of CEO Compensation on Nonprofit Donations Steven Balsam Temple University Fox School of Business 1801 Liacorous Walk Philadelphia, PA 19122 [email protected] and Erica E. Harris Rutgers University School of Business Camden 227 Penn Street Camden, NJ 08102 [email protected] This version: October 13, 2011 Acknowledgements: We are grateful for comments from participants at the American Accounting Association (AAA) 2011 mid-year meeting in Baltimore, MD.
Transcript of The Impact of CEO Compensation on Nonprofit Donations

1
The Impact of CEO Compensation on Nonprofit Donations
Steven Balsam
Temple University
Fox School of Business
1801 Liacorous Walk
Philadelphia, PA 19122
and
Erica E. Harris
Rutgers University
School of Business Camden
227 Penn Street
Camden, NJ 08102
This version: October 13, 2011
Acknowledgements: We are grateful for comments from participants at the American
Accounting Association (AAA) 2011 mid-year meeting in Baltimore, MD.

2
The Impact of CEO Compensation on Nonprofit Donations
Abstract
Compensation in nonprofit organizations is controversial, with nonprofit organizations
trading off the need to attract and compensate employees against the wishes of donors that
contributions go to the core mission, e.g., helping those in need. This issue is particularly
controversial when top executives receive compensation rivaling those of for-profit
organizations. In this paper we look at the impact of nonprofit CEO compensation on nonprofit
donations, finding evidence that donors do in fact reduce their contributions to nonprofit
organizations with high CEO pay. Specifically, we find a negative relationship between direct
donor contributions and the ratio of CEO pay to total expenditures as well as other measures of
excessive CEO compensation. In additional analyses we find our results are robust over time and
across industries.

3
The Impact of CEO Compensation on Nonprofit Donations
I. Introduction
Recent media attention surrounding executive pay has not only increased scrutiny of for-
profit organizations, but the nonprofit sector as well (NY State Attorney General 2007; Boroff
2008; Banjo 2009; Wilhelm 2009; Gershman 2011).1 Concerns have been intensified by current
economic conditions, including shrinking endowments and the overall economic downturn. In
times of strained charity and personal budgets, donors are especially cautious of supporting
nonprofit organizations with high CEO pay (Charity Navigator 2010 CEO Compensation Study).
Donors have expressed this exact concern on CharityNavigator.org, America’s largest charity
evaluator, indicating that high salaries have made them “reconsider their donations” to certain
nonprofit organizations (Emerson 2010). The IRS has raised similar concerns in a recent report
of hospital executive compensation (IRS 2009). This comes in addition to several 2008 changes
to IRS Form 990 requiring detailed disclosure of executive compensation in an effort to increase
transparency and accountability. We examine whether donors have indeed “reconsidered their
donations” by reducing contributions to nonprofits who pay their CEOs well.
Using a sample drawn initially from Charity Navigator and augmented by hand collected
data from Form 990’s we find that donors react to high CEO pay. Specifically, we find a
negative relationship between direct donor contributions and CEO pay, a relationship that is
robust over time and across industries.
The remainder of this paper is organized as follows. In the next section, we discuss the
motivation and hypothesis. This is followed by section III which discusses sample selection,
1

4
section IV the model specification, and section V which discusses our empirical results. Tests of
robustness and paper conclusions are presented in sections VI and VII, respectively.
II. Motivation and hypothesis
There are about 1.4 million nonprofit organizations in the U.S. generating contributions
of over $260 billion (Nonprofit Almanac 2007). Given the magnitude of the contributions
involved, the ability to attract and maintain supporters is vital to the survival of these
organizations. Studies in the nonprofit sector find that donations are associated with three
primary accounting measures: efficiency, effectiveness, and the ability to continue operations
into the future (Parsons 2007). However, a fourth factor not examined in the literature (to the
best of our knowledge) is the impact of executive compensation on contributors’ willingness to
support nonprofit organizations.
Anecdotally we know that supporters of the United Way withheld contributions in the
wake of multiple scandals related to CEO compensation over the years. In 1992 uproar resulted
from the disclosure of United Way President William Aramony receiving an annual
compensation package worth $463,000. Even though Aramony resigned from his position
shortly after this disclosure, it was estimated that United Way collections would be down 10
percent in 1992 from the year earlier, with the implication that some, if not the entire drop was
caused by the scandal (Stodghill et al. 1992). In sum, “faithful donors to the organization
demanded change and greater accountability for the use of their charitable dollars” (Frumkin
2001), evidence that nonprofits do respond to pressure from stakeholders to control executive
pay.

5
Nonprofits compete with other organizations for employee and executive talent. While
they may attract individuals who are less driven by extrinsic rewards2, in most cases they need to
provide a pay package that is competitive with an individuals’ other alternatives. Consequently,
to attract and retain an individual capable of running a multi-million or billion dollar enterprise,
nonprofits need to provide a compensation package that is competitive with that of for-profit
entities. Emerson (2010) provides a list of the top 15 paid charity CEOs (outside of colleges and
universities) showing that each received in excess of $800,000 in 2008, with the highest Zarin
Mehta, of the New York Philharmonic topping $2.5 million. While these amounts are
substantially less than that paid to for-profit CEOs (see for example Balsam 2007), they come as
a shock to donors who, according to Emerson (2010), “assume that charity leaders work for free
or minimal pay and are shocked to see that they earn six figure salaries.”
The IRS stipulates that nonprofit organizations pay executive compensation that is “fair
and reasonable”. While there is no collective standard for what is fair and reasonable, balancing
the market value of executive talent and public trust is a critical component of charity success.
We argue that nonprofits perceived to pay their CEO excessively will suffer the political costs of
reduced donor support.3 Our research question is whether donors respond to high CEO pay by
cutting back on donations to these organizations.
H1: Nonprofit organizations with higher CEO pay have lower direct donations.
III. Sample selection
2 As an example, when Elizabeth Dole served as President of the American Red Cross from 1991-1999. Initially she
declined compensation. http://womenincongress.house.gov/member-profiles/profile.html?intID=59 3 There may also be actual penalties for excess compensation applied by the IRS. Penalties range from fines levied
on both executives and approving boards to revocation of tax exempt status (although rare). In a 2007 IRS
investigation, the service reported over $4 million in excess benefit transaction excise taxes arising from excessive
executive pay at charity organizations (IRS 2007).

6
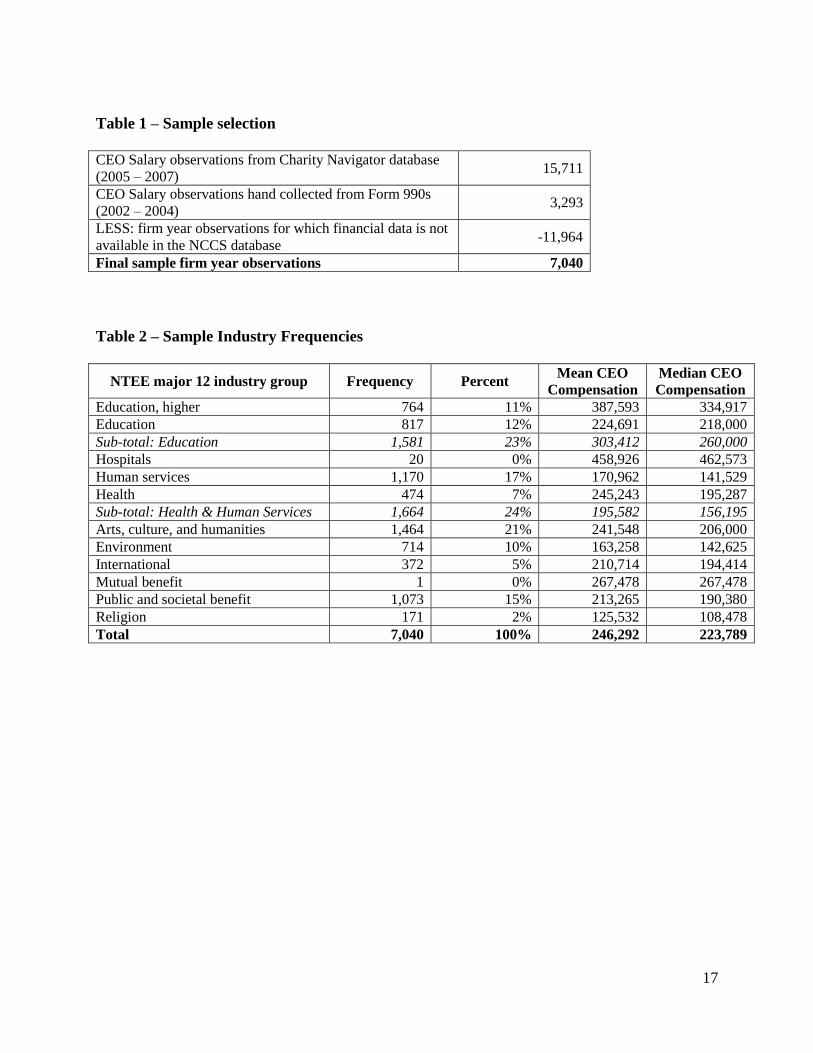
To test our hypothesis we analyze a sample of over 7,000 firm year observations across
six years and a broad array of industries. The majority of our CEO salary observations are drawn
from the CharityNavigator.org database. Charity Navigator is America’s largest charity
evaluator and the proprietor of financial and organizational data for over 5,500 mid to large size
US charities. Charity Navigator is the most frequently consulted website by individual givers,
with over 3 million unique hits in 2009 (charitynavigator.org). Further, Gordon et al. (2009) find
empirical evidence to support donor use of Charity Navigator ratings in their donation decisions.
In addition to providing ratings, Charity Navigator also highlights leadership salary information
for the nonprofits in their database. Each nonprofit organization listed has a section for
organizational leadership where the name, title, compensation, and percentage of compensation
to total expenses are presented.
Charity Navigator provided our initial sample of 15,711 CEO salary observations for
nonprofit organizations in their database from 2005 – 20074. We augmented this database with
hand collected salary information from IRS Form 990s5 for fiscal years 2002 – 2004 which
provided for an additional 3,293 CEO salary observations.6 We then merge our CEO salary
sample with financial information available from the National Council on Charitable Statistics
(NCCS) Statistics of Income (SOI) file. Unfortunately, not all the organizations in the Charity
Navigator database are included in the NCCS SOI file. We are forced to delete 11,964
4 We utilize CEO salary information through 2007 given that our model requires lagged CEO compensation and the
most recent data available for our dependent variable is for fiscal years ending 2008. 5 To verify that Charity Navigator salary data was extracted from the same source as our hand collected data, we
selected a random sample of 10 salary observations provided by Charity Navigator and traced them to the
organization’s Form 990. In all 10 cases the information presented on the organization’s Form 990 matched the
salary information supplied by Charity Navigator. 6 To minimize our data collection efforts we only collected salary data for nonprofits for which we had all other data
required for our empirical model. Consequently while it appears we have much less data for 2002 through 2004, the
number of usable observations is not significantly smaller in those years.

7
observations for which financial information is not available. This leaves a final sample of 7,040
observations. See Table 1 for a reconciliation of our sample.
IV. Model specification
Dependent variable
While nonprofits fund their operations from a variety of sources including government
grants and program service revenues, we focus on direct donations or public support. Direct
public support has been defined by the IRS as the “amounts of contributions, gifts, grants, and
bequests that the organization received directly from the public”. We focus on direct public
support as we believe that this source of funding, rather than government grants or program
service revenues, would be most sensitive to the political costs associated with high
compensation. Specifically, we test the response of direct donations to nonprofit CEO
compensation; given that direct donations are the most straight forward measure of donor
dissatisfaction.
Test variables
One of the issues we face is determining the appropriate form of the test variable. That
is, for example, do donors and potential donors react to the level of CEO compensation or do
they adjust for the scale of the nonprofit? Or do they react to some excess compensation
threshold? Unfortunately there is no prior literature to provide guidance. Our main analysis is
based on CEO salary as a percentage of total firm expenditures. We believe this may be the best
functional form for two reasons. First, information sites such as Charity Navigator present this
ratio to donors as a means of allowing for comparison between organizations. Second, because
scaling by total expenses controls for the size of the organization, and it is well know that size is
a major determinant of CEO compensation (Tosi et al. 2000). This is important in a sector, and

8
sample, where organizational size is so varied. However, because we are unsure of what donors
react to, we also present results for several alternative test variables. In particular we also define
CEO pay as: the level of CEO compensation, the change in CEO compensation, the percentage
change in CEO compensation,7 in addition to indicator variables taking the value of one if the
ratio of CEO pay to total expenses is in the top 10, 20, or 25 percent of our sample, and zero
otherwise. Whichever variable we use, we measure it as of year t-1 to allow for donors to
become aware of CEO pay and adjust their donations accordingly.8 Our expectation is that the
test variable, however it is operationalized, will be negatively associated with the dependent
variable, direct donations.
Control variables
Prior research (Weisbrod and Dominguez 1986; Posnett and Sandler 1989; Hyndman
1991; Callen 1994; Tinkelman 1998; Khumawala and Gordon 1997; Greenlee and Brown 1999;
Parsons 2003; Tinkelman and Mankaney 2007; Parsons and Trussel 2008; Tinkelman 2009)
confirms that organizational efficiency is associated with the ability to attract donations.
Following Baber et al. (2001), we utilize the ratio of program service expenses to total expenses,
or Program Ratio, to measure organizational efficiency. To illustrate consider a charity with
$1,000 in program service expenses and total expenses of $2,000. The Program Ratio equals .5
for this organization which is interpreted as for every $1.00 donated, $0.50 is used to provide
services related to the charity’s mission. Our expectation, based on prior research, is that a more
7 In the models where we use change in compensation or percentage change in compensation as our test variable, we
redefine the dependent and control variables in similar fashion (i.e., redefine them in change or percentage change
form). 8 This holds for our control variables as well. Given delays in filing however, sometime salary for year t-1 is not
disclosed until well into year t. If that is the case it is less likely that salary in year t-1 would affect direct donations
in year t. Consequently in untabulated analyses we also run our models using year t-2 data on the right hand side of
the equation finding comparable results.

9
efficient organization will be better able to attract donations; hence we expect a positive
coefficient on this variable.
The ability to continue operations has been described as the financial stability of a
nonprofit organization. Chang and Tuckman (1991) define a ratio similar to the for-profit gross
margin ratio, dubbed the operating margin, operationalized as the ratio of total revenues less
total expenses divided by total revenues. Operating margin is found to be positively related to
contributions (Chang and Tuckman 1991) and consequently we expect a positive coefficient.
Information quantity represents the amount of financial information displayed to potential
contributors typically in the form of advertising or other means of making the mission of a
nonprofit organization public. We use the fundraising expenses of an organization to proxy for
the amount of information made available to contributors. Weisbrod and Dominguez (1986) and
Tinkelman (1999) find fundraising expenses to be positively related to donations received by an
organization, thus we expect a positive coefficient on this variable.
Information quality is considered paramount in the decision to invest, as well as in the
choice to contribute to a nonprofit firm. Parsons and Trussel (2008) identify two variables which
are found to be related to the decision to donate: age and size. Weisbrod and Dominguez (1986)
suggest that a nonprofit’s reputation, proxied by age, plays a role in the volume of contributions
secured by an organization. Weisbrod and Dominguez operationalize reputation as the number of
years since the initial 501(c)3 filing for tax exempt status and predict that increased organization
age represents superior effectiveness. Organization size has been controlled for in related studies
(Tinkelman 1998; Krishnan and Schauer 2000) and will be proxied for by year-end total assets.
We expect both organization age and total assets to be positively associated with the level of
donations.

10
Several papers have included the notion of donors refraining from making donations to
organizations who receive high levels of government grants, program service revenue, or other
revenue all considered to “crowd out” donations (Weisbrod and Dominguez 1986; Posnett and
Sandler 1989; Callen 1994; Emanuele and Simmons 2004; Yetman and Yetman 2009). However,
other literature has also documented the “crowding-in” effect of these same variables (Okten and
Weisbrod 2000; Khanna and Sandler 2000; Petrovits et al. 2011). As such, these three revenue
sources have been included to control for the presence of income sources considered either to be
substitutes or compliments by the donor population. However, given the mixed results of prior
literature, we do not have predicted directions for these variables.
In sum, the ordinary least squares regression model to test our hypothesis may be
expressed as:
Direct Donationst = β0 + β1 Compensation test variablet-1 + β2 Program Ratiot-1 + β3 Operating
Margint-1 + β4 Fundraising Expensest-1 + β5 Total Assetst-1 + β6 Government Grantst-1
+ β7 Program Service Revenuet-1 + β8 Other Revenuet-1 + β9 Organization Aget-1 + ε
Where all variables are defined above.
V. Empirical results
Descriptive Statistics
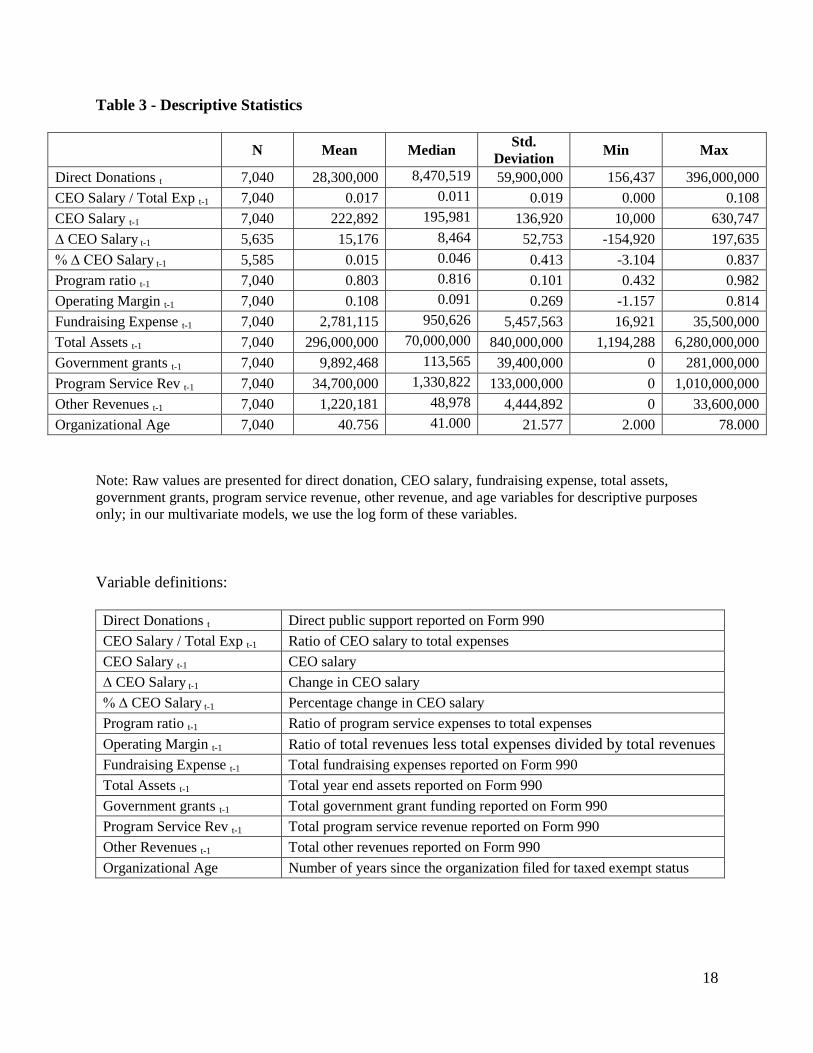
Table 3 provides descriptive statistics for the dependent and independent variables in our
model. The means and medians indicate a skewed distribution which is consistent with the need
for logged variables throughout our analyses. Additionally, all variables used in our empirical
analyses (Tables 5 – 8) are winsorized at the 1% level to mitigate the effect of extreme
observations. Table 4 presents Pearson and Spearman correlations for the variables included in
the model. Consistent with prior literature, age and size are significantly correlated with the
(1)

11
majority of the other control variables. For example, the highest (Pearson) correlation, 0.833, is
between total assets and program service revenue. However the Variance Inflation Factors are all
less than one, suggesting that multicollinearity is not a problem.
Empirical Results
Table 5 provides our first set of empirical results. Column one presents the model where
our test variable is lagged CEO compensation deflated by lagged total expenses, whereas in
column two the test variable is the log level of lagged compensation, column three the change in
compensation, and column four the percentage change in compensation9. In all cases the
coefficient on the test variable is negative and significantly different from zero, consistent with
our hypothesis that donors restrict contributions to organizations that pay their CEOs more.
Turning to our control variables, we generally find expected positive significant
relationships between direct donations and program ratio, operating margin, fundraising
expense, and total assets, however these results are not consistent across models. For example
when we use the change model, which incorporates the change in both the dependent and
independent variables, neither program ratio nor total assets are significantly related to direct
donations, while operating margin is negatively associated with direct donations. Related to the
crowding-in or out effects of government grants, program service revenues, or other revenues,
we find mixed results which differ across variable and model.
Table 6 provides our second set of empirical results, where the test variable is defined as
compensation relative to other nonprofit organizations. We define high compensation to be those
CEOs paid in the top 10 (column 1), 20 (column 2), and 25 (column 3) percent of our sample. In
all three columns we see the coefficient on the variable for high compensation is inversely
9 We lose a substantial number of firm year observations in our percentage change in CEO salary model because of
zero value variables which inhibit the ability to calculate a percentage change ration.

12
related to direct donations, once again supporting our hypothesis that donors restrict
contributions to organizations that pay their CEOs more.
VI. Robustness Tests
We explore two additional avenues as a means of testing the robustness of our results. In
the first we examine whether our findings are consistent across our sample period, while in the
second we examine whether our findings are consistent across our sample industries.
To rule out the possibility that any one year is driving our results, we analyze our model
by year. Table 7 presents the results of yearly regressions as well as the Fama MacBeth summary
statistics. Consistent with our hypothesis and our earlier results, we observe an inverse relation
between direct donations and the ratio of CEO salary to total expense in each year (2003 –
2008). The last column of Table 7 presents the Fama-MacBeth (1973) test which also confirms
the robustness of our findings.
To rule out the possibility that any one industry is driving our results, we analyze our
results by industry. Table 8 presents the results of industry regressions as well as the Fama
MacBeth (1973) summary statistics. In all seven industries we observe an inverse relation
between direct donations and the ratio of CEO salary to total expense.
VII. Conclusions
This paper examined the impact of nonprofit CEO compensation finding evidence which
suggests that donors take CEO compensation into account when they decide whether and how
much to contribute to a particular charity. This research extends and is incremental to prior work
showing that donors consider a charity’s success, efficiency, and stability in their donation
decision. It also builds on for-profit research that documents the political costs associated with
high CEO pay.

13
Using a fairly large sample of nonprofit organizations across a number of years and
industries, we find that donors do react to high CEO pay. Specifically, we find a robust negative
relationship between direct donor contributions and a variety of proxies for high or excessive
CEO compensation. These empirical results support the notion that donors have “reconsidered
their donations” and reduced their contributions to nonprofits that pay their CEO well.

14
References
Baber, W. R., A. A. Roberts, and G. Visvanathan. 2001. Charitable Organizations' Strategies and
Program-Spending Ratios. Accounting Horizons 15 (4): 329-343.
Balsam, S. 2007. Executive compensation: An introduction to practice and theory. WorldatWork.
Banjo, S. 2009. IRS Questions Pay of Charity Executives. Wall Street Journal February 18.
Boroff, P. 2008. Big Bucks for Theater Chiefs Draw Criticism as Sign of Excess. Bloomberg
October 28, 2008.
Callen, J., 1994. Money Donations, Volunteering and Organizational Efficiency. The Journal of
Productivity Analysis 5 (October): 215-228.
Chang, C., and H.P. Tuckman. 1991. Financial Vulnerability and Attrition as Measures of
Nonprofit Performance. Annals of Public & Cooperative Economics 62 (4): 655-672.
Charity Navigator. 2010. CEO Compensation Study.
(http://www.charitynavigator.org/index.cfm?bay=studies.ceo)
Emanuele, R., and W. Simmons. 2004. Does Government Spending Crowd Out Donations of
Time and Money? Public Finance Review 32 (5): 498-511.
Emerson, G. 2010. 15 Highest-Paid Charity CEOs. Smart Spending
(http://www.mainstreet.com/print/19173)
Fama, E., & J. MacBeth. 1973. Risk return and equilibrium: Empirical tests. Journal of Political
Economy 71: 607–636.
Frumkin, P. 2001. Are nonprofit CEOs overpaid? Public Interest (142):83.
Gershman, J., 2011. Charity Probe Questions. The Wall Street Journal September 9, 2011.
Gordon, T. P., C. L. Knock, and D. G. Neely. 2009. The role of rating agencies in the market for
charitable contributions: An empirical test. Journal of Accounting & Public Policy 28 (6):469-
484.
Greenlee, J.S. and K.L. Brown. 1999. The impact of accounting information on contributions to
charitable organizations. Research in Accounting Regulation 13: 111-125.
Hyndman, N. 1991. Contributions to charities – A comparison of their information needs and the
perceptions of such by the providers of information. Financial Accountability & Management 7
(2) (Summer): 69-82.

15
Nonprofit Almanac. 2007. The Nonprofit Sector in Brief, Facts and Figures from the Nonprofit
Almanac 2007. http://www.urban.org/UploadedPDF/311373_nonprofit_sector.pdf
IRS. 2007. Report on Exempt Organizations Executive Compensation Compliance Project –
Parts I and II. http://www.irs.gov/pub/irs-tege/exec._comp._final.pdf
IRS. 2009. IRS Nonprofit Hospital Project – Final Report. http://www.irs.gov/pub/irs-
tege/frepthospproj.pdf
Khanna, J., and T. Sandler. 2000. Partners in giving: The crowding-in effect of UK government
grants. European Economic Review 44 8: 1543–1556.
Khumawala, S. B. and T. P. Gordon. 1997. Bridging the credibility of GAAP: Individual donors
and the new accounting standards for nonprofit organizations. Accounting Horizons. 11 (3)
(September): 45-68.
Krishnan, J., and P.C. Schauer. 2000. The Differentiation of Quality Among Auditors: Evidence
from the Not-for-Profit Sector. Auditing: A Journal of Practice & Theory 19 (2): 9-25.
New York State Attorney General. 2007. Attorney General Cuomo Recovers $1,900,000 in
Excess Compensation from Morris Foundation. May 15, 2007.
Okten, C., and B. Weisbrod. 2000. Determinants of Donations in Private Nonprofit Markets.
Journal of Public Economics 75 (2): 255-272.
Parsons, L.M. 2003. Is accounting information from nonprofit organizations useful to donors? A
review of charitable giving and value-relevance. Journal of Accounting Literature. 22: 104-129.
Parsons, L. M. 2007. The Impact of Financial Information and Voluntary Disclosures on
Contributions to Not-For-Profit Organizations. Behavioral Research in Accounting 19:179-196.
Parsons, L. M., and J. M. Trussel. 2008. Financial reporting factors affecting donations to
charitable organizations. Advances in Accounting (23):263-285.
Petrovits, C., C. Shakespeare, and A. Shih. 2011. The Causes and Consequences of Internal
Control Problems in Nonprofit Organizations. Accounting Review 86 (1):325-357.
Posnett, J., and T. Sandler. 1989. Demand for Charity Donations in Private Non-Profit
Markets. Journal of Public Economics 40 (2): 187-200.
Stodghill, R., C. Del Valle, G. Sandler and L. Therrien. 1992. United They Stand. Business Week
Oct. 19: 40-41.
Tinkelman, D. 1998. Differences in Sensitivity of Financial Statement Users to Joint Cost
Allocations: The Case of Nonprofit Organizations. Journal of Accounting, Auditing & Finance
13 (4): 377-393.

16
Tinkelman, D. 1999. Factors Affecting the Relation Between Donations to Not-for-profit
Organizations and an Efficiency Ratio. Research in Governmental and Nonprofit Accounting 10:
135-161.
Tinkelman, D. 2009. Unintended consequences of expense ratio guidelines: The Avon breast
cancer walks. Journal of Accounting and Public Policy 28 (6):485-494.
Tinkelman, D., and K. Mankaney. 2007. When is Administrative Efficiency Associated With
Charitable Donations? Nonprofit and Voluntary Sector Quarterly 36 (1):41-64.
Tosi, H., S. Werner, J. P. Katz and L. R. Gomez-Mejia. 2000. How much does performance
matter? A meta-analysis of CEO pay studies. Journal of Management, 26(2): 301-339.
Weisbrod, B., and N. Dominguez. 1986. Demand for Collective Goods in Private Nonprofit
Markets: Can Fundraising Expenditures Help Overcome Free-Rider Behavior? Journal of Public
Economics 30 (1): 83-95.
Wilhelm, I. 2009. Executive Compensation at Charities Attracts New Scrutiny. The Chronicle of
Philanthropy February 18, 2009.
Yetman, M. H., and R. J. Yetman. 2009. Determinants of nonprofits' taxable activities. Journal
of Accounting and Public Policy 28 (6):495-509.
17
Table 1 – Sample selection
CEO Salary observations from Charity Navigator database
(2005 – 2007) 15,711
CEO Salary observations hand collected from Form 990s
(2002 – 2004) 3,293
LESS: firm year observations for which financial data is not
available in the NCCS database -11,964
Final sample firm year observations 7,040
Table 2 – Sample Industry Frequencies
NTEE major 12 industry group Frequency Percent Mean CEO
Compensation
Median CEO
Compensation
Education, higher 764 11% 387,593 334,917
Education 817 12% 224,691 218,000
Sub-total: Education 1,581 23% 303,412 260,000
Hospitals 20 0% 458,926 462,573
Human services 1,170 17% 170,962 141,529
Health 474 7% 245,243 195,287
Sub-total: Health & Human Services 1,664 24% 195,582 156,195
Arts, culture, and humanities 1,464 21% 241,548 206,000
Environment 714 10% 163,258 142,625
International 372 5% 210,714 194,414
Mutual benefit 1 0% 267,478 267,478
Public and societal benefit 1,073 15% 213,265 190,380
Religion 171 2% 125,532 108,478
Total 7,040 100% 246,292 223,789
18
Table 3 - Descriptive Statistics
N Mean Median
Std.
Deviation Min Max
Direct Donations t 7,040 28,300,000 8,470,519 59,900,000 156,437 396,000,000
CEO Salary / Total Exp t-1 7,040 0.017 0.011 0.019 0.000 0.108
CEO Salary t-1 7,040 222,892 195,981 136,920 10,000 630,747
∆ CEO Salary t-1 5,635 15,176 8,464 52,753 -154,920 197,635
% ∆ CEO Salary t-1 5,585 0.015 0.046 0.413 -3.104 0.837
Program ratio t-1 7,040 0.803 0.816 0.101 0.432 0.982
Operating Margin t-1 7,040 0.108 0.091 0.269 -1.157 0.814
Fundraising Expense t-1 7,040 2,781,115 950,626 5,457,563 16,921 35,500,000
Total Assets t-1 7,040 296,000,000 70,000,000 840,000,000 1,194,288 6,280,000,000
Government grants t-1 7,040 9,892,468 113,565 39,400,000 0 281,000,000
Program Service Rev t-1 7,040 34,700,000 1,330,822 133,000,000 0 1,010,000,000
Other Revenues t-1 7,040 1,220,181 48,978 4,444,892 0 33,600,000
Organizational Age 7,040 40.756 41.000 21.577 2.000 78.000
Note: Raw values are presented for direct donation, CEO salary, fundraising expense, total assets,
government grants, program service revenue, other revenue, and age variables for descriptive purposes
only; in our multivariate models, we use the log form of these variables.
Variable definitions:
Direct Donations t Direct public support reported on Form 990
CEO Salary / Total Exp t-1 Ratio of CEO salary to total expenses
CEO Salary t-1 CEO salary
∆ CEO Salary t-1 Change in CEO salary
% ∆ CEO Salary t-1 Percentage change in CEO salary
Program ratio t-1 Ratio of program service expenses to total expenses
Operating Margin t-1 Ratio of total revenues less total expenses divided by total revenues
Fundraising Expense t-1 Total fundraising expenses reported on Form 990
Total Assets t-1 Total year end assets reported on Form 990
Government grants t-1 Total government grant funding reported on Form 990
Program Service Rev t-1 Total program service revenue reported on Form 990
Other Revenues t-1 Total other revenues reported on Form 990
Organizational Age Number of years since the organization filed for taxed exempt status

19
Table 4 – Spearman (under) / Pearson (over) Correlations
Coefficients p-values (significant relationships are bolded)
C
EO
Sal
ary
to T
ota
l
Expen
ses
t-1
CE
O S
alar
y
t-1
Chan
ge
in
CE
O S
alar
y
t-1
% c
han
ge
CE
O S
alar
y
t-1
Pro
gra
m
rati
o t-
1
Oper
atin
g
Mar
gin
t-1
Fundra
isin
g
Expen
se t-
1
Tota
l A
sset
s
t-1
Gover
n-
men
t gra
nts
t-1
Pro
gra
m
Ser
vic
e
Rev
enue
t-1
Oth
er
Rev
enues
t-1
Org
aniz
a-
tional
Age
CEO Salary to Total
Expenses t-1
1.000 -0.277 0.010 0.098 -0.333 0.055 -0.314 -0.245 -0.192 -0.206 -0.197 -0.237
0.000 0.468 0.000 0.000 0.000 0.000 0.000 0.000 0.000 0.000 0.000
CEO Salary t-1 -0.381 1.000 0.400 0.213 0.141 0.034 0.466 0.490 0.427 0.453 0.346 0.229
0.000 0.000 0.000 0.000 0.004 0.000 0.000 0.000 0.000 0.000 0.000
Change in CEO
Salary t-1
-0.057 0.406 1.000 0.726 0.043 0.045 0.109 0.133 0.103 0.127 0.104 0.041
0.000 0.000 0.000 0.001 0.001 0.000 0.000 0.000 0.000 0.000 0.002
Percentage change
CEO Salary t-1
0.042 0.195 0.950 1.000 0.010 0.037 0.003 0.001 -0.004 0.004 -0.006 -0.004
0.002 0.000 0.000 0.446 0.006 0.818 0.966 0.793 0.751 0.683 0.751
Program ratio t-1 -0.443 0.095 0.059 0.040 1.000 -0.082 0.094 0.206 0.189 0.205 0.123 -0.012
0.000 0.000 0.000 0.003 0.000 0.000 0.000 0.000 0.000 0.000 0.322
Operating Margin t-1 0.011 0.059 0.070 0.060 -0.039 1.000 0.013 0.085 0.022 0.020 0.032 -0.022
0.402 0.000 0.000 0.000 0.004 0.274 0.000 0.067 0.094 0.007 0.068
Fundraising Expense
t-1
-0.698 0.640 0.180 0.034 0.059 0.028 1.000 0.637 0.558 0.561 0.459 0.058
0.000 0.000 0.000 0.011 0.000 0.035 0.000 0.000 0.000 0.000 0.000
Total Assets t-1 -0.687 0.662 0.208 0.055 0.225 0.265 0.643 1.000 0.756 0.833 0.544 0.128
0.000 0.000 0.000 0.000 0.000 0.000 0.000 0.000 0.000 0.000 0.000
Government grants t-1 -0.370 0.348 0.090 0.006 0.151 -0.051 0.345 0.298 1.000 0.727 0.459 0.054
0.000 0.000 0.000 0.649 0.000 0.000 0.000 0.000 0.000 0.000 0.000
Program Service
Revenue t-1
-0.492 0.479 0.156 0.042 0.135 -0.005 0.417 0.516 0.348 1.000 0.501 0.131
0.000 0.000 0.000 0.002 0.000 0.718 0.000 0.000 0.000 0.000 0.000
Other Revenues t-1 -0.416 0.357 0.100 0.017 0.080 0.036 0.449 0.403 0.263 0.294 1.000 0.103
0.000 0.000 0.000 0.211 0.000 0.007 0.000 0.000 0.000 0.000 0.000
Organizational Age -0.203 0.261 0.048 -0.021 -0.026 0.023 0.246 0.327 0.100 0.371 0.160 1.000
0.000 0.000 0.000 0.115 0.048 0.083 0.000 0.000 0.000 0.000 0.000

20
Table 5 H1: Compensation regression results
Dependent Variable:
Direct Donations t
CEO Salary/Total
Expense t-1
CEOsalary t-1
Change in CEO
salary t-1†
Percentage change
in CEO salary t-1†
Coefficient Coefficient Coefficient Coefficient
p-value p-value p-value p-value
Constant 3.748*** 2.134*** 474,452.100** 0.221***
0.000 0.000 0.047 0.000
Test variable (Defined
in column heading) t-1
-10.062*** -0.019 -11.294*** -0.110***
0.000 0.311 0.006 0.002
Program ratio t-1
2.268*** 2.731*** -6,807,152.000 0.195
0.000 0.000 0.145 0.478
Operating Margin t-1 0.400*** 0.345*** -3,710,730.000*** -0.000
0.000 0.000 0.000 0.956
Fundraising Expense t-1 0.583*** 0.632*** 0.826** -0.101*
0.000 0.000 0.011 0.095
Total Assets t-1 0.201*** 0.231*** 0.005 -0.850***
0.000 0.000 0.193 0.000
Government Grants t-1 -0.001 -0.001 0.364*** 0.019**
0.430 0.617 0.000 0.011
Program Service
Revenue t-1
-0.030*** -0.028*** 0.095*** 0.005
0.000 0.000 0.001 0.884
Other Revenue t-1 0.006*** 0.007*** 0.331* -0.002
0.003 0.000 0.082 0.584
Organization Age t-1 -0.219*** -0.204*** n/a n/a
0.000 0.000
N 7,040 7,040 5,612 2,149
Adjusted R2 0.659 0.651 0.023 0.024
*significant at 10% level, **significant at 5% level, ***significant at 1% level.
See Table 2 for variable definitions.

21
Table 6 H2: Excess compensation regression results
Dependent Variable:
Direct Donations t
Top 10%
Salary Indicator t-1
Top 20%
Salary Indicator t-1
Top 25%
Salary Indicator t-1
Coefficient Coefficient Coefficient
p-value p-value p-value
Constant 2.427*** 2.965*** 3.078***
0.000 0.000 0.000
Test variable (Defined in
column heading) t-1
-0.250*** -0.343*** -0.328***
0.000 0.000 0.000
Program ratio t-1
2.615*** 2.460*** 2.425***
0.000 0.000 0.000
Operating Margin t-1 0.363*** 0.376*** 0.374***
0.000 0.000 0.000
Fundraising Expense t-1 0.618*** 0.602*** 0.600***
0.000 0.000 0.000
Total Assets t-1 0.222*** 0.215*** 0.212***
0.000 0.000 0.000
Government Grants t-1 -0.001 -0.001 -0.001
0.600 0.537 0.551
Program Service Revenue
t-1
-0.029*** -0.029*** -0.029***
0.000 0.000 0.000
Other Revenue t-1 0.007*** 0.006*** 0.006***
0.001 0.003 0.004
Organization Age t-1 -0.213*** -0.217*** -0.216***
0.000 0.000 0.000
N 7,040 7,040 7,040
Adjusted R2 0.653 0.657 0.657
*significant at 10% level, **significant at 5% level, ***significant at 1% level.
See Table 2 for variable definitions.

22
Table 7 Robustness: Yearly regressions and Fama MacBeth
Dependent
Variable: Direct
Donations t
2003 2004 2005 2006 2007 2008
Summary
(Fama
MacBeth)
Coefficient Coefficient Coefficient Coefficient Coefficient Coefficient Coefficient
p-value p-value p-value p-value p-value p-value p-value
Constant 4.521*** 3.736*** 3.180*** 3.853*** 2.910*** 3.148*** 3.558***
0.000 0.000 0.000 0.000 0.000 0.000 0.000
CEO Salary/Total
Expense t-1
-12.504*** -9.840*** -10.042*** -8.691*** -6.245*** -11.757*** -9.847***
0.000 0.000 0.000 0.000 0.010 0.000 0.000
Program ratio t-1
1.844*** 2.178*** 2.534*** 1.900*** 2.539*** 3.411*** 2.400***
0.000 0.000 0.000 0.000 0.000 0.000 0.000
Operating
Margin t-1
0.440*** 0.718*** 0.565*** 0.412*** 0.452*** 0.423*** 0.502***
0.000 0.000 0.000 0.000 0.002 0.000 0.000
Fundraising
Expense t-1
0.451*** 0.585*** 0.578*** 0.658*** 0.667*** 0.596*** 0.589***
0.000 0.000 0.000 0.000 0.000 0.000 0.000
Total Assets t-1 0.2994*** 0.215*** 0.235*** 0.133*** 0.151*** 0.182*** 0.202***
0.000 0.000 0.000 0.000 0.000 0.000 0.000
Government
Grants t-1
0.001 -0.006 -0.003 0.002 -0.001 -0.002 -0.001
0.716 0.113 0.326 0.480 0.827 0.526 0.309
Program Service
Revenue t-1
-0.042*** -0.037*** -0.036*** -0.018*** -0.022*** -0.030*** -0.031***
0.000 0.000 0.000 0.000 0.000 0.000 0.000
Other Revenue t-1 0.006 0.002 -0.001 0.007*** 0.011* 0.005 0.005**
0.213 0.656 0.911 0.000 0.060 0.228 0.025
Organization Age t-1 -0.216*** -0.227*** -0.214*** -0.173*** -0.218*** -0.283*** -0.222***
0.000 0.000 0.000 0.000 0.000 0.000 0.000
N 938 1,122 1,140 1,314 1,376 1,150 7,040
Adjusted R2 0.688 0.791 0.724 0.6914 0.546 0.716 0.680
*significant at 10% level, **significant at 5% level, ***significant at 1% level.
See Table 2 for variable definitions.

23
Table 8 Robustness: Industry regressions
Dependent Variable:
Direct Donations t
Education
(including
higher
education)
Health and
Human
Services
Arts, culture,
and
humanities
Environment International
Public and
societal
benefit
Religion
Coefficient Coefficient Coefficient Coefficient Coefficient Coefficient Coefficient
p-value p-value p-value p-value p-value p-value p-value
Constant 2.949*** 3.676*** 2.176*** 3.802*** -2.277** 5.597*** 9.664***
0.000 0.000 0.000 0.000 0.035 0.000 0.000
CEO Salary/Total
Expense t-1
-6.243*** -5.257*** -7.106*** -5.206*** -8.624** -21.122*** -16.381***
0.007 0.000 0.000 0.001 0.036 0.000 0.000
Program ratio t-1
0.953*** 2.651*** 0.895*** 1.459*** 6.881*** 2.833*** 0.298
0.000 0.000 0.000 0.000 0.000 0.000 0.759
Operating
Margin t-1
0.211** 0.300*** 0.576*** 0.287** 0.479** 0.209** 0.388
0.015 0.003 0.000 0.001 0.021 0.037 0.344
Fundraising Expense t-1 0.340*** 0.646*** 0.634*** 0.614*** 0.583*** 0.459*** 0.578***
0.000 0.000 0.000 0.000 0.000 0.000 0.000
Total Assets t-1 0.497*** 0.154*** 0.244*** 0.195*** 0.328*** 0.135*** 0.009
0.000 0.000 0.000 0.000 0.000 0.000 0.897
Government
Grants t-1
0.007** -0.004 -0.005 -0.004 -0.006 -0.004 0.023
0.018 0.227 0.217 0.299 0.361 0.387 0.442
Program Service Revenue
t-1
-0.054*** -0.020*** -0.014** -0.017*** 0.015* -0.001 -0.012
0.000 0.000 0.017 0.005 0.056 0.857 0.360
Other Revenue t-1 0.005 0.005 0.010*** 0.003 -0.035*** 0.006 0.040**
0.103 0.231 0.005 0.602 0.001 0.257 0.016
Organization Age t-1 -0.261*** -0.389*** 0.005 -0.208*** -0.089 -0.003 -0.575***
0.000 0.000 0.860 0.000 0.164 0.949 0.000
N 1,581 1,664 1,464 714 372 1,073 171
Adjusted R2 0.745 0.583 0.686 0.770 0.720 0.520 0.684
*significant at 10% level, **significant at 5% level, ***significant at 1% level.
See Table 2 for variable definitions.